available online at sciencedirect vision is like... · perceptual deficits of central vision that...
TRANSCRIPT
www.sciencedirect.com
c o r t e x 8 9 ( 2 0 1 7 ) 1 3 5e1 5 5
Available online at
ScienceDirect
Journal homepage: www.elsevier.com/locate/cortex
Research report
Agnosic vision is like peripheral vision, which islimited by crowding
Francesca Strappini a,b,c, Denis G. Pelli d, Enrico Di Pace a andMarialuisa Martelli a,b,*
a Department of Psychology, University of Rome La Sapienza, Rome, Italyb Neuropsychology Research Centre, IRCCS Foundation Hospital Santa Lucia, Rome, Italyc Neurobiology Department, Weizmann Institute of Science, Rehovot, Israeld Department of Psychology and Center for Neural Science, New York University, New York, NY, USA
a r t i c l e i n f o
Article history:
Received 23 April 2014
Reviewed 14 July 2014
Revised 24 October 2014
Accepted 13 January 2017
Action editor Jason Barton
Published online 1 February 2017
Keywords:
Visual agnosia
Crowding
Object recognition
Integrative agnosia
Apperceptive agnosia
Neural density
Integration deficit
* Corresponding author. Dipartimento di PsiE-mail address: marialuisa.martelli@unir
http://dx.doi.org/10.1016/j.cortex.2017.01.0120010-9452/© 2017 Elsevier Ltd. All rights rese
a b s t r a c t
Visual agnosia is a neuropsychological impairment of visual object recognition despite
near-normal acuity and visual fields. A century of research has provided only a rudimen-
tary account of the functional damage underlying this deficit. We find that the object-
recognition ability of agnosic patients viewing an object directly is like that of normally-
sighted observers viewing it indirectly, with peripheral vision. Thus, agnosic vision is
like peripheral vision. We obtained 14 visual-object-recognition tests that are commonly
used for diagnosis of visual agnosia. Our “standard” normal observer took these tests at
various eccentricities in his periphery. Analyzing the published data of 32 apperceptive
agnosia patients and a group of 14 posterior cortical atrophy (PCA) patients on these tests,
we find that each patient's pattern of object recognition deficits is well characterized by one
number, the equivalent eccentricity at which our standard observer's peripheral vision is like
the central vision of the agnosic patient. In other words, each agnosic patient's equivalent
eccentricity is conserved across tests. Across patients, equivalent eccentricity ranges from 4
to 40 deg, which rates severity of the visual deficit.
In normal peripheral vision, the required size to perceive a simple image (e.g., an iso-
lated letter) is limited by acuity, and that for a complex image (e.g., a face or a word) is
limited by crowding. In crowding, adjacent simple objects appear unrecognizably jumbled
unless their spacing exceeds the crowding distance, which grows linearly with eccentricity.
Besides conservation of equivalent eccentricity across object-recognition tests, we also find
conservation, from eccentricity to agnosia, of the relative susceptibility of recognition of
ten visual tests. These findings show that agnosic vision is like eccentric vision.
Whence crowding? Peripheral vision, strabismic amblyopia, and possibly apperceptive
agnosia are all limited by crowding, making it urgent to know what drives crowding. Acuity
does not (Song et al., 2014), but neural density might: neurons per deg2 in the crowding-
relevant cortical area.
© 2017 Elsevier Ltd. All rights reserved.
cologia Universit�a di Romoma1.it (M. Martelli).
rved.
a La Sapienza, Via dei Marsi 78, 00185 Roma, Italy.
c o r t e x 8 9 ( 2 0 1 7 ) 1 3 5e1 5 5136
1. Introduction
1.1. Visual apperceptive agnosia
Visual agnosia is a neuropsychological disorder characterized
by the inability to recognize familiar objects. Visual agnosia
patients are generally unable to recognize visually presented
objects, but they can successfully name the object on the basis
of tactile exploration and they correctly describe the object'sfunction from its name. Such impairment must be distin-
guished from early sensory deficits (e.g., low visual acuity or
contrast sensitivity), oculomotor disturbances, attentional
deficits, aphasic syndromes, and mental deterioration (De
Renzi, 1996; Farah, 1990). It is remarkable that these patients
can recognize a tiny letter when tested for acuity, yet cannot
recognize everyday objects.
The nature of visual agnosia is debated, and patients
within this gross category are diverse. For a recent review, see
Behrmann and Nishimura (2010). Neuropsychological studies
of brain-damaged patients have found selective deficits for
words (pure alexia), objects (pure visual object agnosia), and
faces (prosopagnosia) (Farah, 2004). The inhomogeneity of the
visual agnosic population reported in the literature may
reflect the various neural sites of the lesion and the varying
degree of neural damage (Adler, 1944; Behrmann&Nishimura,
2010; Benson & Greenberg, 1969; Campion & Latto, 1985;
Milner et al., 1991; Vecera & Behrmann, 1997). The classical
description (Lissauer, 1890/1988) distinguishes “apperceptive”
agnosia, which is a perceptual processing deficit, from “asso-
ciative” agnosia, which is a deficit either in semantic knowl-
edge of visual objects or in accessing that knowledge.
Associative agnosia patients have trouble recognizing a vari-
ety of visually presented objects, despite their intact visual
perception, which is usually demonstrated by having the pa-
tients copy objects that they cannot recognize. Patients that
show highly selective impairment of one object category (i.e.,
pure alexia, pure visual object agnosia, and prosopagnosia)
are classically said to have an associative deficit (Farah, 2004).
We will consider the debate about category-specific deficits in
visual agnosia in the Discussion section. Putting associative
deficits aside, here we focus on apperceptive agnosia. Loosely,
“apperceptive” refers to sensation without perception,
marked by detection without recognition. The apperceptive
deficit comprises a broad range of symptoms. Several authors
have proposed a detailed taxonomy of visual apperceptive
agnosia, differentiating it into: shape/form agnosia (Efron,
1968; Milner et al., 1991; Riddoch, Johnston, Bracewell,
Boutsen, & Humphreys, 2008), integrative agnosia (Riddoch
& Humphreys, 1987), transformational agnosia (Humphreys
& Riddoch, 1987; Warrington, 1985), and perceptual categori-
zation deficit (Farah, 2004). The deficits range from severedin
patients who cannot even discriminate simple geometric
shapes (shape agnosia)dto milddin patients who seem un-
impaired in their daily lives, but who fail, at the clinic, to
recognize familiar objects in photographs taken from unusual
perspectives (transformational agnosia). Between these two
extremes, there is a wide intermediate range of deficit that is
sometimes called “integrative agnosia” (Riddoch &
Humphreys, 1987). Here, we apply the term apperceptive
agnosia to this broad category of patients with an intermediate
degree of deficit. These patients with visual agnosia are pro-
foundly impaired in object recognition, face recognition, word
recognition, and reading. They may show signs of achroma-
topsia and topographical agnosia as well. They do recognize
an isolated letter. They typically perform better with real ob-
jects than with drawings and photographs, but only if the
objects are presented in isolation or inmotion. This syndrome
is usually associated with either bilateral occipito-temporal
lesions or unilateral right occipito-temporal lesion sparing
striate cortex and parietal areas (Humphreys, 1999).
Popularized by Oliver Sacks (1998) in “The man who mistook
his wife for a hat,” apperceptive agnosia has long attracted keen
interest for the investigation of integration in object recogni-
tion and how we produce a single coherent percept
(Behrmann & Kimchi, 2003; Lissauer, 1890; Riddoch &
Humphreys, 1987). Despite severely impaired visual recogni-
tion of the object, these patients can verbally describe what
they perceive, though their descriptions are often piecemeal.
When presented with a drawing of a paintbrush, HJA (one of
the most famous and well-studied cases of visual agnosia)
said, “it appears to be two things close together; a longish
wooden stick and a shorter, darker object, though this can't beright or you would have told me.” (Riddoch & Humphreys,
1987, p. 60).
Despite detailed descriptions of individual patients span-
ning the whole range of symptoms associated with this syn-
drome, there is still no comprehensive account. According to
Riddoch and Humphreys (1987), apperceptive agnosia is an
“integration deficit”: The patients can process local visual el-
ements but cannot integrate them into a whole. However,
contrary to this generalization, some apperceptive agnosia
patients perform better with silhouettes than with drawings
(Humphreys, Riddoch, & Quinlan, 1985; Le et al., 2002), which
presumably requires some integration (Humphreys, 1999). On
the other hand, these patients are still impaired in recognizing
a single part of a complex object. For instance, they are slower
than normally-sighted observers in processing a “local” letter
embedded in “global” letter (Behrmann & Kimchi, 2003;
Navon, 1977). The interplay between impairments of recog-
nition of single parts and complex objects remains
mysterious.
Apperceptive agnosia severely impairs vision yet spares
acuity and visual fields. Patients with visual agnosia can
recognize small simple shapes (e.g., a letter) when presented
in isolation. Most visual impairments (e.g., macular degener-
ation or anisometropic amblyopia) restrict visual field or
acuity, and are well characterized by those restrictions.
However, there are several conditions, like apperceptive
agnosia, that impair central vision while sparing acuity and
fields. We focus on perceptual deficits (hence apperceptive
agnosia), putting aside high-level attentional deficits such as
neglect and simultanagnosia (and associative agnosias). The
perceptual deficits of central vision that spare acuity include:
apperceptive agnosia, achromatopsia (color agnosia), akine-
topsia (motion blindness), dysmetropsia (failure of size con-
stancy), transformational agnosia (inability to recognize
objects seen from an unusual perspective), and depth
perception deficits. Among them, only apperceptive agnosia
specifically impairs recognition of complex shapes.
c o r t e x 8 9 ( 2 0 1 7 ) 1 3 5e1 5 5 137
Here, we provide evidence towards a simple unified ac-
count of apperceptive agnosia. We show that apperceptive
agnosia is like peripheral vision, which is limited by visual
crowding.
1.2. Visual crowding
Visual crowding is the failure to identify a simple object (like a
letter) because of surrounding clutter. When the clutter
closely surrounds the target object, the features of the target
and cluttermingle together, producing a jumble that is hard to
identify. Recognition is wrecked, but detection is unscathed.
This perceptual phenomenon was reported first in the foveal
vision of amblyopes, and then in normal peripheral vision
(Irvine, 1945; Korte, 1923). It was later dubbed “crowding”
(Ehlers, 1953; Stuart & Burian, 1962). In strabismic amblyopia,
the acuity size for identifying a foveal letter is raised ten-fold
when other letters surround the target (Levi, Song, & Pelli,
2007). In the normal fovea, crowding is usually negligible,
occurring only when clutter is within a few minutes of arc
(Flom,Heath,&Takahaski, 1963; Latham&Whitaker, 1996; Liu
& Arditi, 2000; Pelli et al., 2016). Crowding severely limits pe-
ripheral vision (Levi et al., 2007; Song et al., 2014).
Crowding is usually characterized by its extent, the crowding
distance (or “critical spacing”), defined as the minimum dis-
tance, center-to-center, between a simple target and a neigh-
boring clutter object, beyond which the clutter is innocuous.
Crowding distance grows linearly with eccentricity (angular
distance from the point of fixation). This “Bouma law”holds for
most objects and tasks (Bouma, 1970; Martelli, Majaj, & Pelli,
2005; Pelli, Palomares, & Majaj, 2004; Pelli & Tillman, 2008;
Pelli et al., 2007; Toet & Levi, 1992; Whitney & Levi, 2011),
though crowding distance may be reduced somewhat through
familiarity (Chung, 2007;Grainger, Tydgat,& Issel�e, 2010). Thus,
as eccentricity is increased from zero (at fixation) to 60�,crowdingdistance increases from .05 to 18�, nearly 400:1 (Eq. 2).
The wide range of crowding in the normal periphery has
allowed extensive study (For reviews, see Levi, 2008; Pelli et al.,
2004; Pelli & Tillman, 2008; Whitney & Levi, 2011.).
The crowding distance distinguishes crowding from ordi-
nary “overlap” masking. In overlap masking, the flanker and
target overlap (or are nearly contiguous), and the flanker-to-
target center-to-center spacing needed for identification de-
pends on stimulus size and not on eccentricity, whereas the
crowding distance depends on stimulus eccentricity and not
on size (Pelli et al., 2004). Overlap masking makes the target
unrecognizable and invisible, presumably because the detec-
tor in the primary visual cortex also responds to the flankers
(Legge & Foley, 1980; Pelli et al., 2004; Thomas, 1985). The
target is also unrecognizable in crowding (and agnosia), but
remains visible. Crowding combines detected features over an
inappropriately large area, producing a jumbled percept.
Models of crowding suppose pooling or source confusion
(Chung, Li, & Levi, 2007; Levi, 2008; Martelli et al., 2005; Nandy
& Tjan, 2007; Parkes, Lund, Angelucci, Solomon, & Morgan,
2001; Treisman & Gelade, 1980).
Crowding is typically manifest in one of two ways,
depending on the complexity of the target. A simple target, like
aRoman letterAeZ, is only crowded if otherobjects arenearby,
within the crowding distance. Alternatively, in a complex
target with several parts, like a word, the parts (letters) can
crowd each other (Rosen, Chakravarthi, & Pelli, 2014). This is
self-crowding. The crowding distance of the elements (e.g., let-
ters) is the same. There is not yet an independent definition for
what constitutes a “part”, other than the self-crowding test.
But, so far, all parts have turned out to have familiar names.
Thus, Martelli et al. (2005) found that a face is complex, like a
word, and consists of facial featuresdeyes, nose, and mouth-
dthatmust be at least the crowding distance apart for the face
to be recognized. Consequently, in the periphery, a shrunken
target remains identifiable only if it is simple, like a letter or a
facial feature, while a complex target, like aword or a face, can
only be identified if it is huge, large enough so that its parts do
not crowd each other. Thus, for an isolated object in the pe-
riphery, the minimum size required for identification is
determined by visual acuity if it is simple, and by crowding if it
is complex (Pelli et al., 2004). In sum, the crowding phenome-
non is a severe and distinctive impairment of recognition.
Two research groups have reported crowding in neuro-
psychological patients. Price and Humphreys (1995) reported
that two alexic patients identified letters in a string more
accurately when they were widely spaced, and this effect was
most pronounced for the central letters in the string. Using
Bouma's (1970) terminology, they called this crowding effect
an abnormally strong “flanker interference” in letter identifi-
cation. Crutch and Warrington (2007; 2009) found that the
reading deficits of two patients with bilateral posterior cortical
atrophy (PCA) could be attributed to crowding: Letter identi-
fication accuracy decreased in the presence of flankers, more
so with greater flanker proximity, independent of target or
flanker size. After our initial submission of this manuscript,
Crutch and co-authors reported crowding tests and brain
imaging for 26 PCA patients (Yong et al., 2014). Again, they
found crowding: The PCA patients were less accurate and
slower to identify targets between flankers when the flankers
were nearer, and this effect was correlated with lower gray
matter volume. The two Crutch and Warrington patients are
included in our sample, but the Yong et al. (2014) paper was
published too late to be included.
1.3. The crowding conjecture for apperceptive agnosia
Crowding is an important well-studied operationally-defined
psychophysical phenomenon. Establishing that a visual
impairment is “crowding” classifies it as this well-known
perceptual phenomenon. Here we link apperceptive agnosia
and crowding, and we anticipate that this link will prove
useful in elucidating both. Specifically, we conjecture that the
deficit in agnosic central vision is like the crowding at some
eccentricity in normal peripheral vision. It predicts that the
agnosic patient sees a simple display, e.g., an isolated letter,
normally, but has impaired vision of complex displays, like a
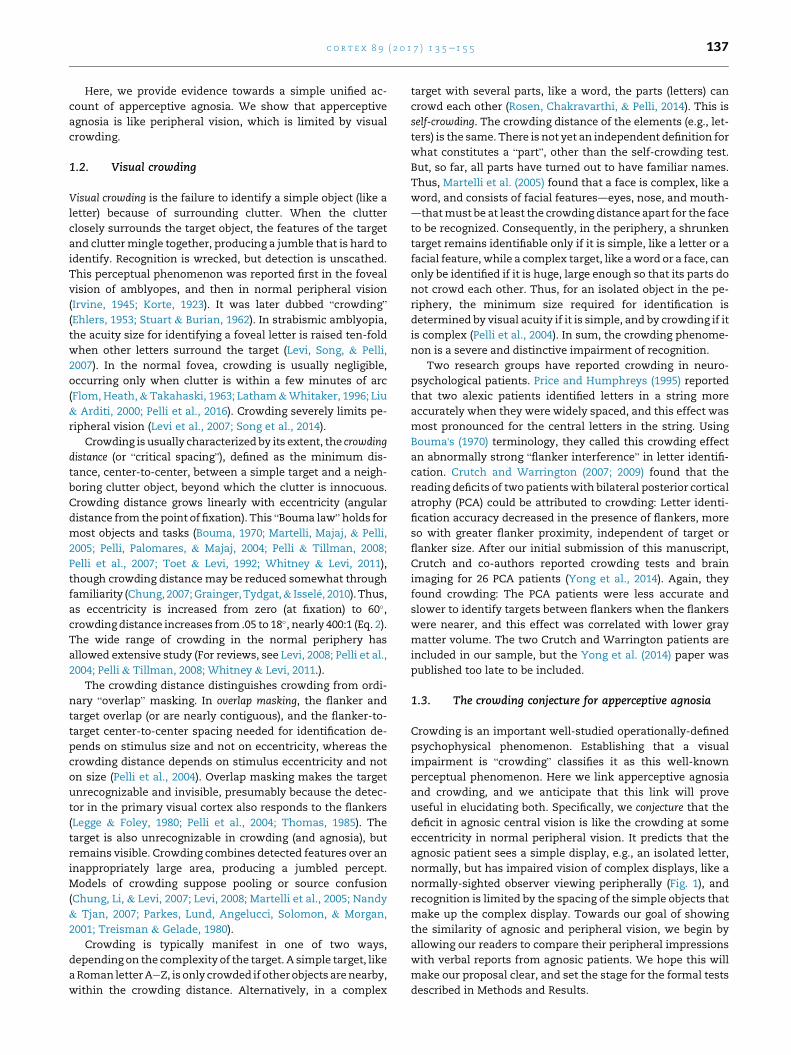
normally-sighted observer viewing peripherally (Fig. 1), and
recognition is limited by the spacing of the simple objects that
make up the complex display. Towards our goal of showing
the similarity of agnosic and peripheral vision, we begin by
allowing our readers to compare their peripheral impressions
with verbal reports from agnosic patients. We hope this will
make our proposal clear, and set the stage for the formal tests
described in Methods and Results.
c o r t e x 8 9 ( 2 0 1 7 ) 1 3 5e1 5 5138
A hint of this idea emerges in Humphreys and Riddoch's(1987, p. 78) description of the perceptual world of HJA as,
“composed of rather gross descriptions of objectsdthe kinds
of descriptions we might make if we glimpsed objects from
the corner of an eye.” Moreover, in crowding, a normally-
sighted observer can report something of what he sees
peripherally, even if he cannot identify it. In crowding, the
target is visible but jumbled. In line with this phenomenology,
the agnosia patient FWT said that everything seemed to “run
together” (Shelton, Bowers, Duara, & Heilman, 1994). Gordon
(1968) describes the recognition abilities of a child with
early-acquired visual agnosia, “although he can recognize
pictures of objects if presented singly, he cannot always
identify the same objects if several pictures are presented on
the same card.” Similarly, HJA reported that, in ordinary life,
he found it much harder to recognize objects close to each
other: “For instance, eating at a buffet or a self-service
restaurant is extremely difficult. I can recognize many food
items seen individually. They somehow seemhard to separate
en masse” (Humphreys & Riddoch, 1987, p. 33).
Fig. 1 allows you to compare your perceptual experience of
peripherally seen objects with the patients' descriptions.
While looking directly at the object, the patient's mistaken
name is absurd, but the same name seems appropriate when
the object is viewed peripherally while fixating the name. We
conjecture that agnosic vision is like peripheral vision, and
thus that the agnosic deficit is like crowding.
Fig. 1 e What they say. Compare central agnosic vision to
your own peripheral vision. The drawings on the right
(Snodgrass & Vanderwart, 1980) are often presented to
patients to test for visual agnosia. Each drawing appears to
the right of the word response that it elicited from an
agnosic patient (“ladle” and “necklace” from HJA in
Humphreys & Riddoch, 1987, and “bag” from SM in
Behrmann & Kimchi, 2003). To experience something like
agnosic vision, please fixate each word, and, without
moving your eyes, try to identify the object in your right
peripheral field. You may find yourself agreeing with the
patients.
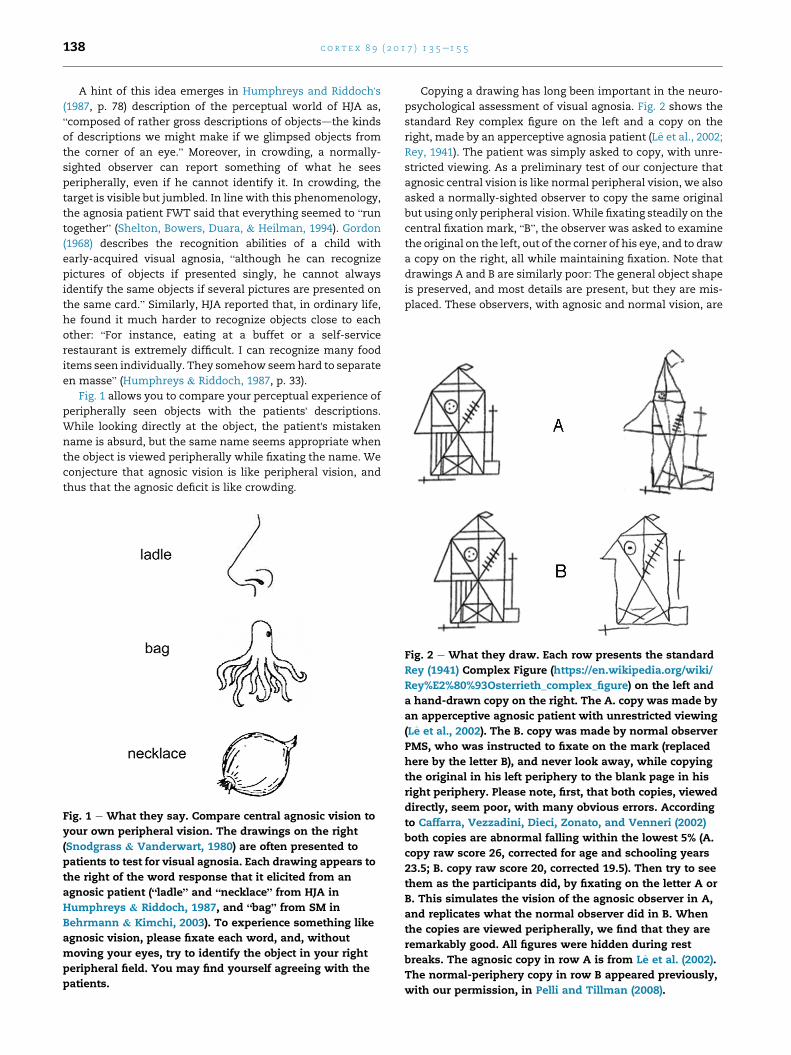
Copying a drawing has long been important in the neuro-
psychological assessment of visual agnosia. Fig. 2 shows the
standard Rey complex figure on the left and a copy on the
right, made by an apperceptive agnosia patient (Le et al., 2002;
Rey, 1941). The patient was simply asked to copy, with unre-
stricted viewing. As a preliminary test of our conjecture that
agnosic central vision is like normal peripheral vision, we also
asked a normally-sighted observer to copy the same original
but using only peripheral vision.While fixating steadily on the
central fixation mark, “B”, the observer was asked to examine
the original on the left, out of the corner of his eye, and to draw
a copy on the right, all while maintaining fixation. Note that
drawings A and B are similarly poor: The general object shape
is preserved, and most details are present, but they are mis-
placed. These observers, with agnosic and normal vision, are
Fig. 2 e What they draw. Each row presents the standard
Rey (1941) Complex Figure (https://en.wikipedia.org/wiki/
Rey%E2%80%93Osterrieth_complex_figure) on the left and
a hand-drawn copy on the right. The A. copy was made by
an apperceptive agnosic patient with unrestricted viewing
(Le et al., 2002). The B. copy was made by normal observer
PMS, who was instructed to fixate on the mark (replaced
here by the letter B), and never look away, while copying
the original in his left periphery to the blank page in his
right periphery. Please note, first, that both copies, viewed
directly, seem poor, with many obvious errors. According
to Caffarra, Vezzadini, Dieci, Zonato, and Venneri (2002)
both copies are abnormal falling within the lowest 5% (A.
copy raw score 26, corrected for age and schooling years
23.5; B. copy raw score 20, corrected 19.5). Then try to see
them as the participants did, by fixating on the letter A or
B. This simulates the vision of the agnosic observer in A,
and replicates what the normal observer did in B. When
the copies are viewed peripherally, we find that they are
remarkably good. All figures were hidden during rest
breaks. The agnosic copy in row A is from Le et al. (2002).
The normal-periphery copy in row B appeared previously,
with our permission, in Pelli and Tillman (2008).
c o r t e x 8 9 ( 2 0 1 7 ) 1 3 5e1 5 5 139
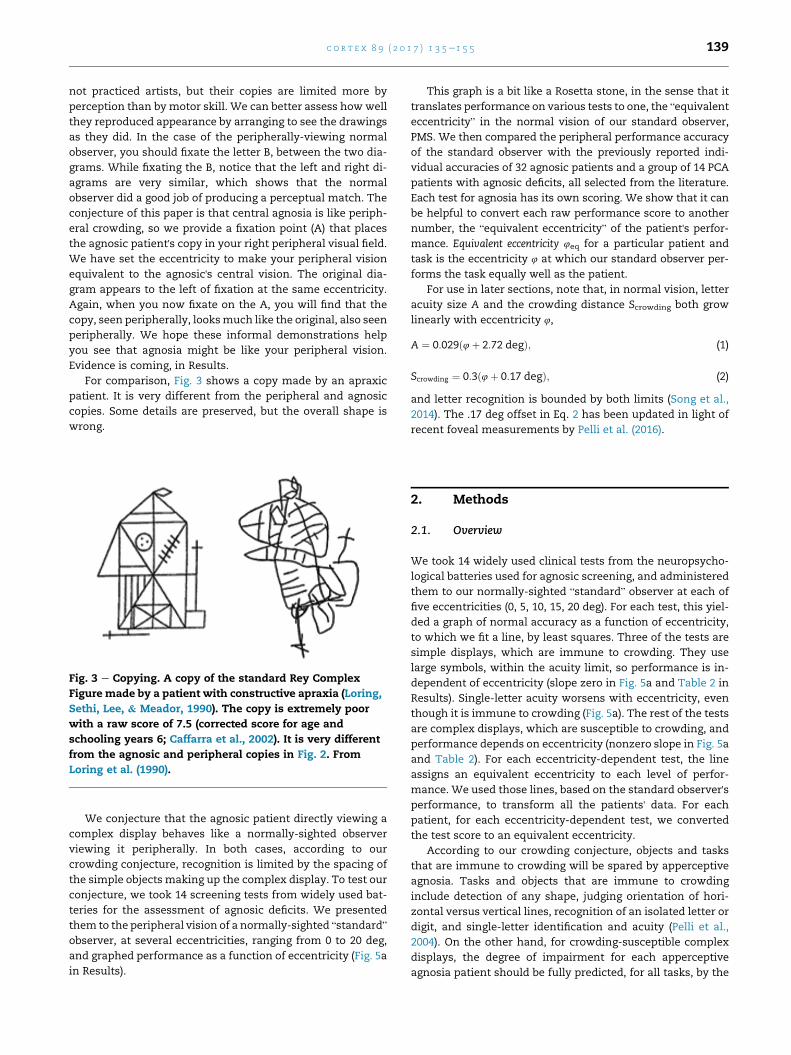
not practiced artists, but their copies are limited more by
perception than by motor skill. We can better assess how well
they reproduced appearance by arranging to see the drawings
as they did. In the case of the peripherally-viewing normal
observer, you should fixate the letter B, between the two dia-
grams. While fixating the B, notice that the left and right di-
agrams are very similar, which shows that the normal
observer did a good job of producing a perceptual match. The
conjecture of this paper is that central agnosia is like periph-
eral crowding, so we provide a fixation point (A) that places
the agnosic patient's copy in your right peripheral visual field.
We have set the eccentricity to make your peripheral vision
equivalent to the agnosic's central vision. The original dia-
gram appears to the left of fixation at the same eccentricity.
Again, when you now fixate on the A, you will find that the
copy, seen peripherally, looksmuch like the original, also seen
peripherally. We hope these informal demonstrations help
you see that agnosia might be like your peripheral vision.
Evidence is coming, in Results.
For comparison, Fig. 3 shows a copy made by an apraxic
patient. It is very different from the peripheral and agnosic
copies. Some details are preserved, but the overall shape is
wrong.
Fig. 3 e Copying. A copy of the standard Rey Complex
Figure made by a patient with constructive apraxia (Loring,
Sethi, Lee, & Meador, 1990). The copy is extremely poor
with a raw score of 7.5 (corrected score for age and
schooling years 6; Caffarra et al., 2002). It is very different
from the agnosic and peripheral copies in Fig. 2. From
Loring et al. (1990).
We conjecture that the agnosic patient directly viewing a
complex display behaves like a normally-sighted observer
viewing it peripherally. In both cases, according to our
crowding conjecture, recognition is limited by the spacing of
the simple objects making up the complex display. To test our
conjecture, we took 14 screening tests from widely used bat-
teries for the assessment of agnosic deficits. We presented
them to the peripheral vision of a normally-sighted “standard”
observer, at several eccentricities, ranging from 0 to 20 deg,
and graphed performance as a function of eccentricity (Fig. 5a
in Results).
This graph is a bit like a Rosetta stone, in the sense that it
translates performance on various tests to one, the “equivalent
eccentricity” in the normal vision of our standard observer,
PMS. We then compared the peripheral performance accuracy
of the standard observer with the previously reported indi-
vidual accuracies of 32 agnosic patients and a group of 14 PCA
patients with agnosic deficits, all selected from the literature.
Each test for agnosia has its own scoring. We show that it can
be helpful to convert each raw performance score to another
number, the “equivalent eccentricity” of the patient's perfor-
mance. Equivalent eccentricity 4eq for a particular patient and
task is the eccentricity 4 at which our standard observer per-
forms the task equally well as the patient.
For use in later sections, note that, in normal vision, letter
acuity size A and the crowding distance Scrowding both grow
linearly with eccentricity 4,
A ¼ 0:029ð4þ 2:72 degÞ; (1)
Scrowding ¼ 0:3ð4þ 0:17 degÞ; (2)
and letter recognition is bounded by both limits (Song et al.,
2014). The .17 deg offset in Eq. 2 has been updated in light of
recent foveal measurements by Pelli et al. (2016).
2. Methods
2.1. Overview
We took 14 widely used clinical tests from the neuropsycho-
logical batteries used for agnosic screening, and administered
them to our normally-sighted “standard” observer at each of
five eccentricities (0, 5, 10, 15, 20 deg). For each test, this yiel-
ded a graph of normal accuracy as a function of eccentricity,
to which we fit a line, by least squares. Three of the tests are
simple displays, which are immune to crowding. They use
large symbols, within the acuity limit, so performance is in-
dependent of eccentricity (slope zero in Fig. 5a and Table 2 in
Results). Single-letter acuity worsens with eccentricity, even
though it is immune to crowding (Fig. 5a). The rest of the tests
are complex displays, which are susceptible to crowding, and
performance depends on eccentricity (nonzero slope in Fig. 5a
and Table 2). For each eccentricity-dependent test, the line
assigns an equivalent eccentricity to each level of perfor-
mance. We used those lines, based on the standard observer'sperformance, to transform all the patients' data. For each
patient, for each eccentricity-dependent test, we converted
the test score to an equivalent eccentricity.
According to our crowding conjecture, objects and tasks
that are immune to crowding will be spared by apperceptive
agnosia. Tasks and objects that are immune to crowding
include detection of any shape, judging orientation of hori-
zontal versus vertical lines, recognition of an isolated letter or
digit, and single-letter identification and acuity (Pelli et al.,
2004). On the other hand, for crowding-susceptible complex
displays, the degree of impairment for each apperceptive
agnosia patient should be fully predicted, for all tasks, by the
c o r t e x 8 9 ( 2 0 1 7 ) 1 3 5e1 5 5140
performance of our standard observer at some equivalent
eccentricity.
2.2. Participants: literature search and inclusion criteria
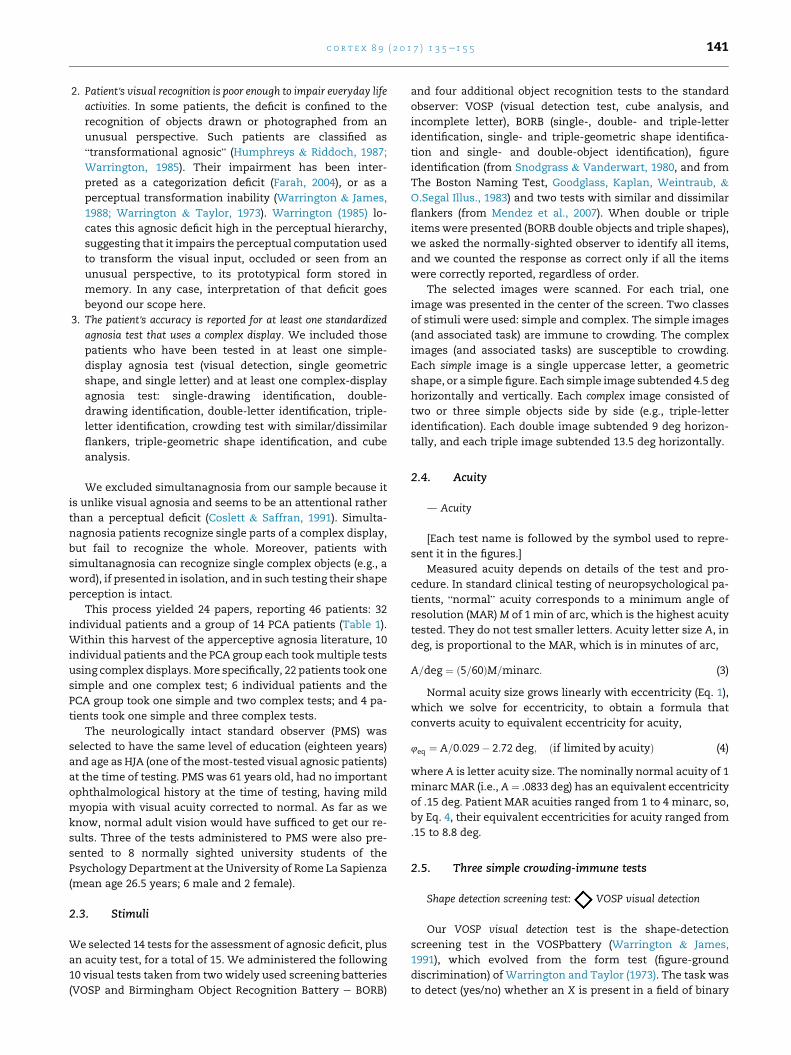
3763 papers published between 1900 and 2013 were found by
searching the PubMed and Google Scholar databases for visual
agnosia using the keywords listed in Fig. 4, and checking the
reference lists of the identified papers. This included some
papers on PCA patients who show a perceptual deficit iden-
Fig. 4 e Flowchart of the patient selection process. In the chart, MAR (minimum angle of resolution) indicates the angle (in
minarc) which the strokes of the letter subtend at the person's eye.
tified as apperceptive agnosia (McMonagle, Deering, Berliner,
& Kertesz, 2006) [The Yong et al. (2014) study of 26 PCA pa-
tients appeared too late to be included in our sample.]. On the
basis of the title and abstract, papers describing cases of
associative agnosia or associative prosopagnosia were
excluded, as well as case descriptions of Kluver-Bucy syn-
drome and Alzheimer patients with semantic deficits, and
further papers reporting the same case. This yielded 58
1“Simultanagnosia” (Farah, 2004; Wolpert, 1924) is frequently as
Simultanagnosia patients have few signs of visual agnosia. Like apperthey fail to recognize a complex display as whole. However, unlike appsingle parts of a complex display, and have a complementary spectrfunctions of the dorsal visual areas (Milner & Goodale, 1995; Mishkin,patients tend to fail to recognize the global letter but succeed in recog& Humphreys, 2005). Simultanagnosia is associated with a deficit in th1991; Farah, 1990), a general reduction in speed of visual processing (Bobject information (Coslett & Lie, 2008).
papers, which were fully assessed. 34 papers were excluded
from further investigation because either 1) no data were re-
ported on standard agnosia tests, or 2) the reported visual
acuity indicated a deep impairment. The 24 papers included in
the meta-analysis are listed in Table 1. 15 patients from these
studies were excluded: 14 from the study of Lehmann et al.
(2011) because of deeply impaired acuity; and 1 patient (JJ)
from the study of Mannan, Kennard, and Husain (2009) for
having symptoms related to simultanagnosia.1 Fig. 4 presents
a flowchart of the patient selection process.
Each candidate patient was included only if he or she
met all three of the following criteria:
1. Patient preserves elementary visual abilities. Patients with vi-
sual fields defects, and or those not able to solve a shape-
detection task (e.g., the Visual Object and Space Percep-
tion e VOSP screening test, see below for a description)
were not included in the analysis.
sociated with the Balint-Holmes syndrome (Balint, 1909/1995).ceptive agnosic patients, their visual acuity is usually normal, anderceptive agnosia patients, simultanagnosia patients do recognizeum of symptoms, which may reflect the different computationalUngerleider, & Macko, 1983). In the Navon local/global test, thesenizing the small local letter (Mevorach et al., 2014; Shalev, Chajut,e disengagement of attention from the objects (Coslett & Saffran,alint, 1909/1995; Luria, 1959), and a deficit in combining space and
c o r t e x 8 9 ( 2 0 1 7 ) 1 3 5e1 5 5 141
2. Patient's visual recognition is poor enough to impair everyday life
activities. In some patients, the deficit is confined to the
recognition of objects drawn or photographed from an
unusual perspective. Such patients are classified as
“transformational agnosic” (Humphreys & Riddoch, 1987;
Warrington, 1985). Their impairment has been inter-
preted as a categorization deficit (Farah, 2004), or as a
perceptual transformation inability (Warrington & James,
1988; Warrington & Taylor, 1973). Warrington (1985) lo-
cates this agnosic deficit high in the perceptual hierarchy,
suggesting that it impairs the perceptual computation used
to transform the visual input, occluded or seen from an
unusual perspective, to its prototypical form stored in
memory. In any case, interpretation of that deficit goes
beyond our scope here.
3. The patient's accuracy is reported for at least one standardized
agnosia test that uses a complex display. We included those
patients who have been tested in at least one simple-
display agnosia test (visual detection, single geometric
shape, and single letter) and at least one complex-display
agnosia test: single-drawing identification, double-
drawing identification, double-letter identification, triple-
letter identification, crowding test with similar/dissimilar
flankers, triple-geometric shape identification, and cube
analysis.
We excluded simultanagnosia from our sample because it
is unlike visual agnosia and seems to be an attentional rather
than a perceptual deficit (Coslett & Saffran, 1991). Simulta-
nagnosia patients recognize single parts of a complex display,
but fail to recognize the whole. Moreover, patients with
simultanagnosia can recognize single complex objects (e.g., a
word), if presented in isolation, and in such testing their shape
perception is intact.
This process yielded 24 papers, reporting 46 patients: 32
individual patients and a group of 14 PCA patients (Table 1).
Within this harvest of the apperceptive agnosia literature, 10
individual patients and the PCA group each tookmultiple tests
using complex displays.More specifically, 22 patients took one
simple and one complex test; 6 individual patients and the
PCA group took one simple and two complex tests; and 4 pa-
tients took one simple and three complex tests.
The neurologically intact standard observer (PMS) was
selected to have the same level of education (eighteen years)
and age as HJA (one of themost-tested visual agnosic patients)
at the time of testing. PMS was 61 years old, had no important
ophthalmological history at the time of testing, having mild
myopia with visual acuity corrected to normal. As far as we
know, normal adult vision would have sufficed to get our re-
sults. Three of the tests administered to PMS were also pre-
sented to 8 normally sighted university students of the
Psychology Department at the University of Rome La Sapienza
(mean age 26.5 years; 6 male and 2 female).
2.3. Stimuli
We selected 14 tests for the assessment of agnosic deficit, plus
an acuity test, for a total of 15. We administered the following
10 visual tests taken from two widely used screening batteries
(VOSP and Birmingham Object Recognition Battery e BORB)
and four additional object recognition tests to the standard
observer: VOSP (visual detection test, cube analysis, and
incomplete letter), BORB (single-, double- and triple-letter
identification, single- and triple-geometric shape identifica-
tion and single- and double-object identification), figure
identification (from Snodgrass & Vanderwart, 1980, and from
The Boston Naming Test, Goodglass, Kaplan, Weintraub, &
O.Segal Illus., 1983) and two tests with similar and dissimilar
flankers (from Mendez et al., 2007). When double or triple
itemswere presented (BORB double objects and triple shapes),
we asked the normally-sighted observer to identify all items,
and we counted the response as correct only if all the items
were correctly reported, regardless of order.
The selected images were scanned. For each trial, one
image was presented in the center of the screen. Two classes
of stimuli were used: simple and complex. The simple images
(and associated task) are immune to crowding. The complex
images (and associated tasks) are susceptible to crowding.
Each simple image is a single uppercase letter, a geometric
shape, or a simple figure. Each simple image subtended 4.5 deg
horizontally and vertically. Each complex image consisted of
two or three simple objects side by side (e.g., triple-letter
identification). Each double image subtended 9 deg horizon-
tally, and each triple image subtended 13.5 deg horizontally.
2.4. Acuity
d Acuity
[Each test name is followed by the symbol used to repre-
sent it in the figures.]
Measured acuity depends on details of the test and pro-
cedure. In standard clinical testing of neuropsychological pa-
tients, “normal” acuity corresponds to a minimum angle of
resolution (MAR)M of 1 min of arc, which is the highest acuity
tested. They do not test smaller letters. Acuity letter size A, in
deg, is proportional to the MAR, which is in minutes of arc,
A=deg ¼ ð5=60ÞM=minarc: (3)
Normal acuity size grows linearly with eccentricity (Eq. 1),
which we solve for eccentricity, to obtain a formula that
converts acuity to equivalent eccentricity for acuity,
4eq ¼ A=0:029� 2:72 deg; ðif limited by acuityÞ (4)
where A is letter acuity size. The nominally normal acuity of 1
minarc MAR (i.e., A¼ .0833 deg) has an equivalent eccentricity
of .15 deg. Patient MAR acuities ranged from 1 to 4 minarc, so,
by Eq. 4, their equivalent eccentricities for acuity ranged from
.15 to 8.8 deg.
2.5. Three simple crowding-immune tests
Shape detection screening test: VOSP visual detection
Our VOSP visual detection test is the shape-detection
screening test in the VOSPbattery (Warrington & James,
1991), which evolved from the form test (figure-ground
discrimination) of Warrington and Taylor (1973). The task was
to detect (yes/no) whether an X is present in a field of binary
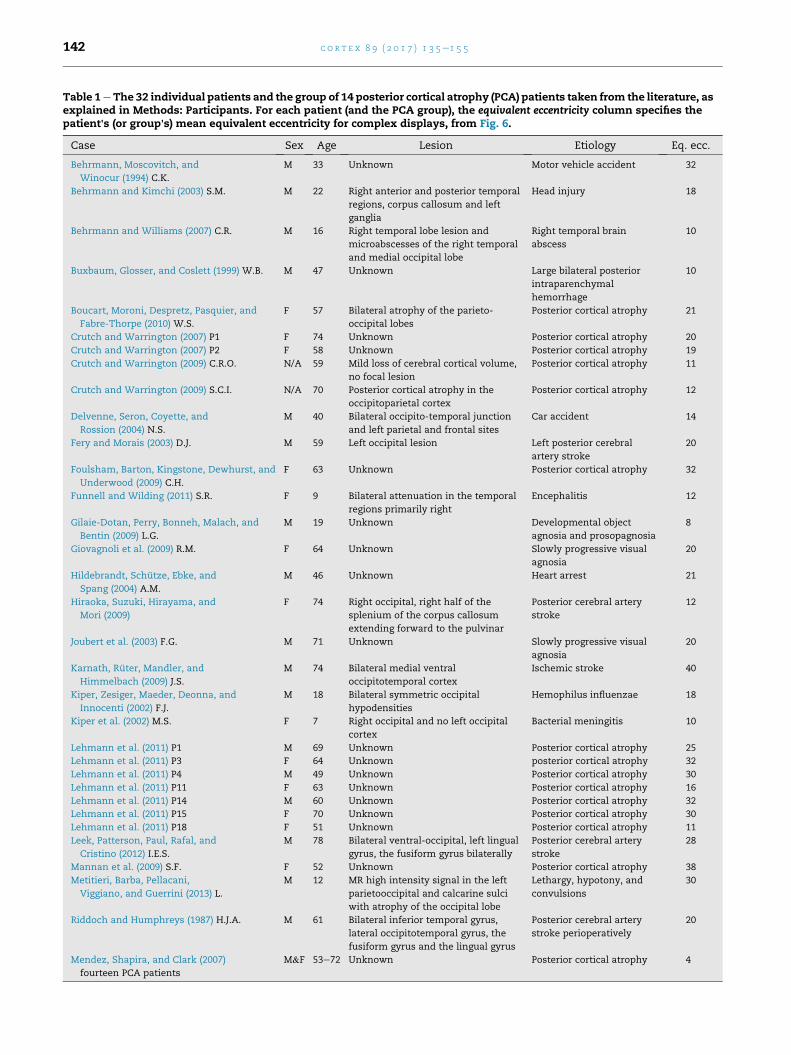
Table 1eThe 32 individual patients and the group of 14 posterior cortical atrophy (PCA) patients taken from the literature, asexplained in Methods: Participants. For each patient (and the PCA group), the equivalent eccentricity column specifies thepatient's (or group's) mean equivalent eccentricity for complex displays, from Fig. 6.
Case Sex Age Lesion Etiology Eq. ecc.
Behrmann, Moscovitch, and
Winocur (1994) C.K.
M 33 Unknown Motor vehicle accident 32
Behrmann and Kimchi (2003) S.M. M 22 Right anterior and posterior temporal
regions, corpus callosum and left
ganglia
Head injury 18
Behrmann and Williams (2007) C.R. M 16 Right temporal lobe lesion and
microabscesses of the right temporal
and medial occipital lobe
Right temporal brain
abscess
10
Buxbaum, Glosser, and Coslett (1999) W.B. M 47 Unknown Large bilateral posterior
intraparenchymal
hemorrhage
10
Boucart, Moroni, Despretz, Pasquier, and
Fabre-Thorpe (2010) W.S.
F 57 Bilateral atrophy of the parieto-
occipital lobes
Posterior cortical atrophy 21
Crutch and Warrington (2007) P1 F 74 Unknown Posterior cortical atrophy 20
Crutch and Warrington (2007) P2 F 58 Unknown Posterior cortical atrophy 19
Crutch and Warrington (2009) C.R.O. N/A 59 Mild loss of cerebral cortical volume,
no focal lesion
Posterior cortical atrophy 11
Crutch and Warrington (2009) S.C.I. N/A 70 Posterior cortical atrophy in the
occipitoparietal cortex
Posterior cortical atrophy 12
Delvenne, Seron, Coyette, and
Rossion (2004) N.S.
M 40 Bilateral occipito-temporal junction
and left parietal and frontal sites
Car accident 14
Fery and Morais (2003) D.J. M 59 Left occipital lesion Left posterior cerebral
artery stroke
20
Foulsham, Barton, Kingstone, Dewhurst, and
Underwood (2009) C.H.
F 63 Unknown Posterior cortical atrophy 32
Funnell and Wilding (2011) S.R. F 9 Bilateral attenuation in the temporal
regions primarily right
Encephalitis 12
Gilaie-Dotan, Perry, Bonneh, Malach, and
Bentin (2009) L.G.
M 19 Unknown Developmental object
agnosia and prosopagnosia
8
Giovagnoli et al. (2009) R.M. F 64 Unknown Slowly progressive visual
agnosia
20
Hildebrandt, Schutze, Ebke, and
Spang (2004) A.M.
M 46 Unknown Heart arrest 21
Hiraoka, Suzuki, Hirayama, and
Mori (2009)
F 74 Right occipital, right half of the
splenium of the corpus callosum
extending forward to the pulvinar
Posterior cerebral artery
stroke
12
Joubert et al. (2003) F.G. M 71 Unknown Slowly progressive visual
agnosia
20
Karnath, Ruter, Mandler, and
Himmelbach (2009) J.S.
M 74 Bilateral medial ventral
occipitotemporal cortex
Ischemic stroke 40
Kiper, Zesiger, Maeder, Deonna, and
Innocenti (2002) F.J.
M 18 Bilateral symmetric occipital
hypodensities
Hemophilus influenzae 18
Kiper et al. (2002) M.S. F 7 Right occipital and no left occipital
cortex
Bacterial meningitis 10
Lehmann et al. (2011) P1 M 69 Unknown Posterior cortical atrophy 25
Lehmann et al. (2011) P3 F 64 Unknown posterior cortical atrophy 32
Lehmann et al. (2011) P4 M 49 Unknown Posterior cortical atrophy 30
Lehmann et al. (2011) P11 F 63 Unknown Posterior cortical atrophy 16
Lehmann et al. (2011) P14 M 60 Unknown Posterior cortical atrophy 32
Lehmann et al. (2011) P15 F 70 Unknown Posterior cortical atrophy 30
Lehmann et al. (2011) P18 F 51 Unknown Posterior cortical atrophy 11
Leek, Patterson, Paul, Rafal, and
Cristino (2012) I.E.S.
M 78 Bilateral ventral-occipital, left lingual
gyrus, the fusiform gyrus bilaterally
Posterior cerebral artery
stroke
28
Mannan et al. (2009) S.F. F 52 Unknown Posterior cortical atrophy 38
Metitieri, Barba, Pellacani,
Viggiano, and Guerrini (2013) L.
M 12 MR high intensity signal in the left
parietooccipital and calcarine sulci
with atrophy of the occipital lobe
Lethargy, hypotony, and
convulsions
30
Riddoch and Humphreys (1987) H.J.A. M 61 Bilateral inferior temporal gyrus,
lateral occipitotemporal gyrus, the
fusiform gyrus and the lingual gyrus
Posterior cerebral artery
stroke perioperatively
20
Mendez, Shapira, and Clark (2007)
fourteen PCA patients
M&F 53e72 Unknown Posterior cortical atrophy 4
c o r t e x 8 9 ( 2 0 1 7 ) 1 3 5e1 5 5142
c o r t e x 8 9 ( 2 0 1 7 ) 1 3 5e1 5 5 143
noise, 50% white and 50% black. If present, the region of the X
had a higher proportion of white than black. The X was pre-
sent in half of the 20 trials. The standard observer was pre-
sentedwith the set of 20 trials for each eccentricity tested, and
was asked to detect the presence of the X. As specified by the
authors of the test, texture density was not considered in the
response scoring.
Identification: BORB single shape, BORB single letter
These two tests are part of the BORB(Riddoch &
Humphreys, 1993). On each trial, the observer identified an
object. In the BORB single shape task, there were 36 trials
showing one out of seven different geometric shapes (circle,
triangle, square, pentagon, hexagon, Greek cross, Greek cross
rotated by 45�). In the BORB single letter task, there were 36
trials, each presenting one out of 12 possible uppercase letters
(A, C, D, G, H, L, J, M, R, S, U, and V).
2.6. Eight complex crowding-susceptible tests
VOSP incomplete letter
The VOSP incomplete letters task was developed by
Warrington and James (1991) and was included in the VOSP.
The observer was asked to identify an uppercase letter that
has been “degraded” by omitting fragments. There were 21
uppercase letters (including a practice trial) degraded by
30e70%. Letter identity, ordered by increasing degradation, is:
F, B, P, D, V, M, S, K, X, Y, H, C, Z, A, E, L, G, U, R, W, and N. At
each eccentricity, as specified by the authors of the test, we
presented one letter per trial, for 21 trials, the first of which
was practice, and scoring total accuracy on the non-practice
trials regardless of degradation.
Identification of single drawing: BORB single object,
Boston naming test, Snodgrass & Vanderwart
In these three tasks, the observer identified the drawing
shown on each trial. BORB single object, taken from BORB, had
40 drawings of everyday objects, animals, and plants. In the
Boston Naming Test , there were 30 drawings of familiar ob-
jects (e.g., helicopter, octopus, comb) (Kaplan, Goodglass, &
Weintraub, 1983). Finally, the Snodgrass and Vanderwart
(1980) test had 260 line drawings of everyday objects. The
standard observer was presented with the three tests in
separate blocks for a total of 330 trials at each eccentricity.
Double-letter identification: BORB double letters
Also from BORB, on each trial, the observer identified a pair
of letters. Therewere 36 trials. The two letterswere each taken
from the same set of possible letters used in the BORB single
letter test. The observer was asked to identify both letters, and
the response was scored as correct only if both letters were
correctly named, in any order.
Triple-letter identification: BORB triple letters
Also from the BORB, on each trial, the observer identified
the three letters presented, in any order. There were 36 trials,
and the three letters in each trial were selected to be always
different. The response was scored as correct only if all three
letters were correctly named, in any order.
Letter strings: Similar flanker, Dissimilar flanker
Mendez et al. (2007) used this test with patients affected by
PCA. The task was to read the central letter of a letter triplet,
ignoring the flankers. There were 56 trials, in random order.
On 28 trials, the flanking letters were similar to the central
target letter (Similar flanker), and, on the other 28 trials, they
were not similar to the target letter (Dissimilar flanker).
Crowding studies have shown that similar flankers produce
more crowding than dissimilar flankers do.
2.7. Three more crowding-susceptible tests
For future estimation of equivalent eccentricity in neuropsy-
chological patients, Table 2 also reports normal results on
three more tests for which we did not find any patient results
to present here. Since there is no patient data, these tests
appear only in Table 2, not in any of the figures.
Triple geometric shapes: BORB triple shapes
Also from BORB, the observer was asked to identify three
shapes. 36 trials each presented three different shapes
sampled from a set of seven (circle, triangle, square, pentagon,
hexagon, Greek cross, Greek cross rotated by 45�). The
response was scored as correct only if all three shapes were
correctly identified, in any order.
Identification of double drawings: BORB double objects
Also from BORB, the observer was presented with two
drawings, side by side, and asked to identify both. This test
consisted of 40 double drawings of everyday objects, animals
and plants. The response was correct only if both items were
correctly identified, in any order.
Cube analysis: VOSP cube
This test of visuo-spatial abilities is part of the VOSP bat-
tery (Warrington & James, 1991). The observer was asked to
say how many cubes were depicted in a line drawing. The
observer performed 2 practice trials and 10 test trials.
2.8. Apparatus and procedure
Stimuli were presented on a LaCie 21-inchmonitor driven by a
Power Mac G5 computer. The monitor was 57 cm in front of
the observer's eyes. The experiment was implemented in
MATLAB softwarewith the Psychophysics Toolbox extensions
(http://psychtoolbox.org; Brainard, 1997; Pelli, 1997).
c o r t e x 8 9 ( 2 0 1 7 ) 1 3 5e1 5 5144
The monitor was directly in front of the seated standard
observer (PMS), and the observer was asked to face the
display, moving only his eyes to fixate the static black cross
constantly present to the left of center of the display. The
observer was asked to visually fixate the black cross
constantly. While fixating, he was asked to identify an image
that appeared in the center of the screen for 200 msec. The
tests were conducted at five eccentricities, 0, 5, 10, 15, 20 deg,
by varying the distance of the black cross from the center of
the screen. At 0 deg of eccentricity (direct view), the fixation
mark disappeared 100 msec before stimulus onset. The re-
sponses were recorded by the experimenter using one button
for correct and another for incorrect. Recording the response
initiated the appearance of the next stimulus. Vocal re-
sponses supplied by the observer were also audio-recorded
for offline review after testing. The observer was encour-
aged to respond accurately and to describe the perceptual
experience even in those cases in which he was not able to
correctly identify the stimulus. PMS was also asked to
describe verbally and copy stimuli seen in his periphery. PMS
took part in eight experimental sessions of one hour each,
over a three-month period.
Eight more normal observers were tested in two different
experiments on three tasks (Similar flanker, Dissimilar
flanker, Single Letter, as defined above) in a single session
with the same procedure used for PMS. The letter x-height
was 5 deg. (This is negligibly larger than the 4.5 deg size used
with PMS.) The target letter was presented in central vision,
either alone, or between two flanker letters, whichwere either
similar or dissimilar to the target letter. For one experiment,
we measured accuracy as a function of eccentricity (0, 4, or 8
deg), to compare with PMS. For the other experiment, using
central viewing, wemeasured accuracy for the three tasks as a
function of blur (pillbox radius: 0, 1.41, 2.82, 3.52, 4.22 or 5.63
deg). Stimuli were blurred with the MATLAB function “fspe-
cial”, using the disk option to specify the diameter the aver-
aging filter (pillbox). Each of the 3 � (6 þ 3) conditions (no,
similar, and dissimilar flanker; six degrees of blur; and 3 ec-
centricities) was tested for 20 trials, for a total of 540 trials in
one long session.
3. Results
We tested our conjecture that agnosic central vision is like
normal peripheral vision. To that end, we compared perfor-
mance accuracy of the eccentrically viewing standard
observer with the previously reported central performance of
46 patients with visual agnosia (32 individuals and a group of
14 PCA patients, see Table 1).
We have several layers to peel off in examining the results.
First is the dichotomy between simple and complex displays.
Simple displays are immune to crowding and show little or no
effect of eccentricity, whereas complex displays are suscep-
tible to crowding and are much harder to identify at greater
eccentricity. This dichotomy is an important similarity be-
tween the phenomena of crowding and apperceptive agnosia:
Both deficits spare identification of simple displays and impair
identification of complex displays. Our strongest evidence for
crowding is the stunning regularity of the complex-display
results. Apperceptive agnosia and crowding are similar to
each other in how they affect the whole gamut of complex
displays. As explained below, this regularity is manifest by
finding that each patient conserves “equivalent eccentricity”
across tasks. Furthermore, at the end of Results, comparing
results from agnosia and eccentricity, we will find that the
relative susceptibility of the tasks to crowding is conserved in
agnosia.
3.1. Comparing peripheral and agnosic vision
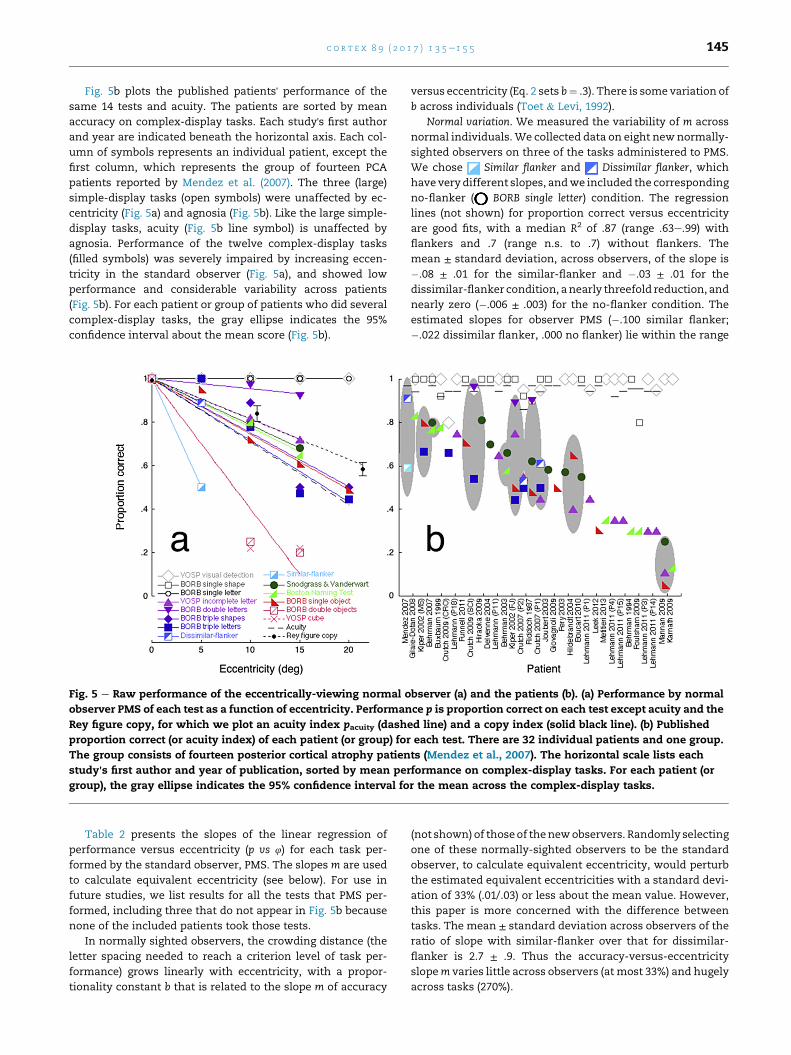
Fig. 5a plots the standard observer's performance on each of
the 14 different tests (each indicated by a different geo-
metric symbol) as a function of eccentricity. Three tasks
used simple displays (open symbols): visual detection (of X
in texture), identification of single geometric shapes, and
identification of single letters. Twelve tasks used complex
displays (filled symbols): identification of an incomplete
letter, identification of single and multiple drawings of ob-
jects, identification of two or three letters, and identification
of a target letter in the presence of two nearby similar or
dissimilar flankers, triple geometric shapes, and the cube
test. Performance of large simple-display tasks was unaf-
fected by eccentricity (open symbols) and performance of
complex-display tasks dropped rapidly with eccentricity
(filled symbols). In normal peripheral vision, complex object
recognition is limited by crowding, which grows with ec-
centricity, while perception of a large simple image is un-
affected by eccentricity.
In normally sighted observers, acuity size grows linearly
with eccentricity (Eq. (1)). In order to plot acuity on our 0 to 1
“performance” scale, and have it drop with eccentricity, we
offset acuity size A to produce an “acuity index” pacuity,
pacuity ¼ 1:08� A ¼ 1� 0:0294; (5)
which is the dashed line in Fig. 5a.
PMS's copy of the Rey complex figure while viewing
peripherally is much like the agnosic patient's copy (Fig. 2). To
evaluate the dependency of the Rey test score on viewing ec-
centricity, we asked 10 new observers to copy the Rey figure,
each at just one eccentricity (3 observers at 0 deg, 3 and PMS at
11 deg, and 4 at 21 deg) to avoid contamination of our results
by any learning of the Rey figure at another eccentricity. The
scoring rules assign zero only when there is no attempt to
copy, so our raw scores have a minimum of 1, and we
normalize the log score log s by its highest possible value, log
S, to produce a “copy index” pcopy that ranges from 0 to 1,
pcopy ¼ log slog S
; (6)
The drop in performance with eccentricity for copying the
Rey figure (black disks in Fig. 5a) is similar to those for
recognition of complex displays. However, performance of
this copying task is dominated by personal drawing ability,
not perception, so we do not report equivalent eccentricities
for copying.
c o r t e x 8 9 ( 2 0 1 7 ) 1 3 5e1 5 5 145
Fig. 5b plots the published patients' performance of the
same 14 tests and acuity. The patients are sorted by mean
accuracy on complex-display tasks. Each study's first author
and year are indicated beneath the horizontal axis. Each col-
umn of symbols represents an individual patient, except the
first column, which represents the group of fourteen PCA
patients reported by Mendez et al. (2007). The three (large)
simple-display tasks (open symbols) were unaffected by ec-
centricity (Fig. 5a) and agnosia (Fig. 5b). Like the large simple-
display tasks, acuity (Fig. 5b line symbol) is unaffected by
agnosia. Performance of the twelve complex-display tasks
(filled symbols) was severely impaired by increasing eccen-
tricity in the standard observer (Fig. 5a), and showed low
performance and considerable variability across patients
(Fig. 5b). For each patient or group of patients who did several
complex-display tasks, the gray ellipse indicates the 95%
confidence interval about the mean score (Fig. 5b).
Fig. 5 e Raw performance of the eccentrically-viewing normal observer (a) and the patients (b). (a) Performance by normal
observer PMS of each test as a function of eccentricity. Performance p is proportion correct on each test except acuity and the
Rey figure copy, for which we plot an acuity index pacuity (dashed line) and a copy index (solid black line). (b) Published
proportion correct (or acuity index) of each patient (or group) for each test. There are 32 individual patients and one group.
The group consists of fourteen posterior cortical atrophy patients (Mendez et al., 2007). The horizontal scale lists each
study's first author and year of publication, sorted by mean performance on complex-display tasks. For each patient (or
group), the gray ellipse indicates the 95% confidence interval for the mean across the complex-display tasks.
Table 2 presents the slopes of the linear regression of
performance versus eccentricity (p vs 4) for each task per-
formed by the standard observer, PMS. The slopes m are used
to calculate equivalent eccentricity (see below). For use in
future studies, we list results for all the tests that PMS per-
formed, including three that do not appear in Fig. 5b because
none of the included patients took those tests.
In normally sighted observers, the crowding distance (the
letter spacing needed to reach a criterion level of task per-
formance) grows linearly with eccentricity, with a propor-
tionality constant b that is related to the slope m of accuracy
versus eccentricity (Eq. 2 sets b¼ .3). There is some variation of
b across individuals (Toet & Levi, 1992).
Normal variation. We measured the variability of m across
normal individuals.We collected data on eight newnormally-
sighted observers on three of the tasks administered to PMS.
We chose Similar flanker and Dissimilar flanker, which
have very different slopes, andwe included the corresponding
no-flanker ( BORB single letter) condition. The regression
lines (not shown) for proportion correct versus eccentricity
are good fits, with a median R2 of .87 (range .63e.99) with
flankers and .7 (range n.s. to .7) without flankers. The
mean ± standard deviation, across observers, of the slope is
�.08 ± .01 for the similar-flanker and �.03 ± .01 for the
dissimilar-flanker condition, anearly threefold reduction, and
nearly zero (�.006 ± .003) for the no-flanker condition. The
estimated slopes for observer PMS (�.100 similar flanker;
�.022 dissimilar flanker, .000 no flanker) lie within the range
(not shown) of thoseof thenewobservers. Randomly selecting
one of these normally-sighted observers to be the standard
observer, to calculate equivalent eccentricity, would perturb
the estimated equivalent eccentricities with a standard devi-
ation of 33% (.01/.03) or less about the mean value. However,
this paper is more concerned with the difference between
tasks. The mean ± standard deviation across observers of the
ratio of slope with similar-flanker over that for dissimilar-
flanker is 2.7 ± .9. Thus the accuracy-versus-eccentricity
slopem varies little across observers (at most 33%) and hugely
across tasks (270%).
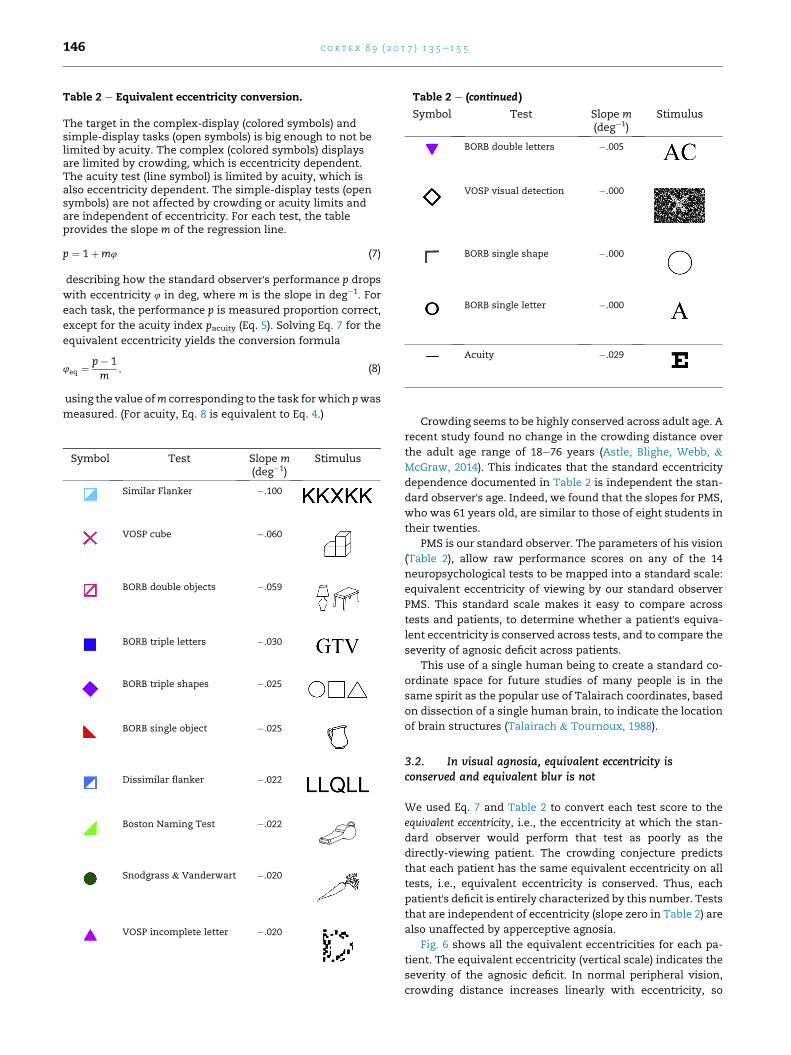
Table 2 e Equivalent eccentricity conversion.
The target in the complex-display (colored symbols) andsimple-display tasks (open symbols) is big enough to not belimited by acuity. The complex (colored symbols) displaysare limited by crowding, which is eccentricity dependent.The acuity test (line symbol) is limited by acuity, which isalso eccentricity dependent. The simple-display tests (opensymbols) are not affected by crowding or acuity limits andare independent of eccentricity. For each test, the tableprovides the slope m of the regression line.
p ¼ 1þm4 (7)
describing how the standard observer's performance p drops
with eccentricity 4 in deg, where m is the slope in deg�1. For
each task, the performance p is measured proportion correct,
except for the acuity index pacuity (Eq. 5). Solving Eq. 7 for the
equivalent eccentricity yields the conversion formula
4eq ¼ p� 1m
; (8)
using the value ofm corresponding to the task for which pwas
measured. (For acuity, Eq. 8 is equivalent to Eq. 4.)
Symbol Test Slope m(deg�1)
Stimulus
Similar Flanker �.100
VOSP cube �.060
BORB double objects �.059
BORB triple letters �.030
BORB triple shapes �.025
BORB single object �.025
Dissimilar flanker �.022
Boston Naming Test �.022
Snodgrass & Vanderwart �.020
VOSP incomplete letter �.020
Table 2 e (continued )
Symbol Test Slope m(deg�1)
Stimulus
BORB double letters �.005
VOSP visual detection �.000
BORB single shape �.000
BORB single letter �.000
Acuity �.029
c o r t e x 8 9 ( 2 0 1 7 ) 1 3 5e1 5 5146
Crowding seems to be highly conserved across adult age. A
recent study found no change in the crowding distance over
the adult age range of 18e76 years (Astle, Blighe, Webb, &
McGraw, 2014). This indicates that the standard eccentricity
dependence documented in Table 2 is independent the stan-
dard observer's age. Indeed, we found that the slopes for PMS,
who was 61 years old, are similar to those of eight students in
their twenties.
PMS is our standard observer. The parameters of his vision
(Table 2), allow raw performance scores on any of the 14
neuropsychological tests to be mapped into a standard scale:
equivalent eccentricity of viewing by our standard observer
PMS. This standard scale makes it easy to compare across
tests and patients, to determine whether a patient's equiva-
lent eccentricity is conserved across tests, and to compare the
severity of agnosic deficit across patients.
This use of a single human being to create a standard co-
ordinate space for future studies of many people is in the
same spirit as the popular use of Talairach coordinates, based
on dissection of a single human brain, to indicate the location
of brain structures (Talairach & Tournoux, 1988).
3.2. In visual agnosia, equivalent eccentricity isconserved and equivalent blur is not
We used Eq. 7 and Table 2 to convert each test score to the
equivalent eccentricity, i.e., the eccentricity at which the stan-
dard observer would perform that test as poorly as the
directly-viewing patient. The crowding conjecture predicts
that each patient has the same equivalent eccentricity on all
tests, i.e., equivalent eccentricity is conserved. Thus, each
patient's deficit is entirely characterized by this number. Tests
that are independent of eccentricity (slope zero in Table 2) are
also unaffected by apperceptive agnosia.
Fig. 6 shows all the equivalent eccentricities for each pa-
tient. The equivalent eccentricity (vertical scale) indicates the
severity of the agnosic deficit. In normal peripheral vision,
crowding distance increases linearly with eccentricity, so
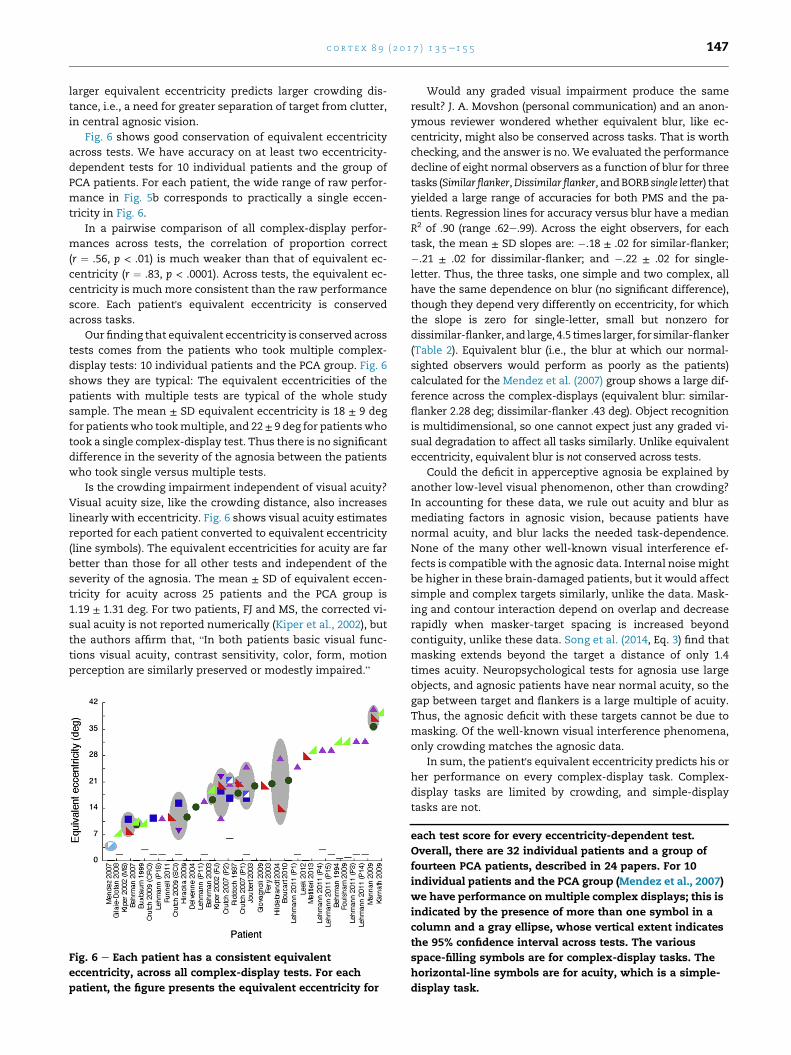
c o r t e x 8 9 ( 2 0 1 7 ) 1 3 5e1 5 5 147
larger equivalent eccentricity predicts larger crowding dis-
tance, i.e., a need for greater separation of target from clutter,
in central agnosic vision.
Fig. 6 shows good conservation of equivalent eccentricity
across tests. We have accuracy on at least two eccentricity-
dependent tests for 10 individual patients and the group of
PCA patients. For each patient, the wide range of raw perfor-
mance in Fig. 5b corresponds to practically a single eccen-
tricity in Fig. 6.
In a pairwise comparison of all complex-display perfor-
mances across tests, the correlation of proportion correct
(r ¼ .56, p < .01) is much weaker than that of equivalent ec-
centricity (r ¼ .83, p < .0001). Across tests, the equivalent ec-
centricity is much more consistent than the raw performance
score. Each patient's equivalent eccentricity is conserved
across tasks.
Our finding that equivalent eccentricity is conserved across
tests comes from the patients who took multiple complex-
display tests: 10 individual patients and the PCA group. Fig. 6
shows they are typical: The equivalent eccentricities of the
patients with multiple tests are typical of the whole study
sample. The mean ± SD equivalent eccentricity is 18 ± 9 deg
for patientswho tookmultiple, and 22 ± 9 deg for patientswho
took a single complex-display test. Thus there is no significant
difference in the severity of the agnosia between the patients
who took single versus multiple tests.
Is the crowding impairment independent of visual acuity?
Visual acuity size, like the crowding distance, also increases
linearly with eccentricity. Fig. 6 shows visual acuity estimates
reported for each patient converted to equivalent eccentricity
(line symbols). The equivalent eccentricities for acuity are far
better than those for all other tests and independent of the
severity of the agnosia. The mean ± SD of equivalent eccen-
tricity for acuity across 25 patients and the PCA group is
1.19 ± 1.31 deg. For two patients, FJ and MS, the corrected vi-
sual acuity is not reported numerically (Kiper et al., 2002), but
the authors affirm that, “In both patients basic visual func-
tions visual acuity, contrast sensitivity, color, form, motion
perception are similarly preserved or modestly impaired.”
Fig. 6 e Each patient has a consistent equivalent
eccentricity, across all complex-display tests. For each
patient, the figure presents the equivalent eccentricity for
Would any graded visual impairment produce the same
result? J. A. Movshon (personal communication) and an anon-
ymous reviewer wondered whether equivalent blur, like ec-
centricity, might also be conserved across tasks. That is worth
checking, and the answer is no. We evaluated the performance
decline of eight normal observers as a function of blur for three
tasks (Similar flanker,Dissimilar flanker,andBORB single letter) that
yielded a large range of accuracies for both PMS and the pa-
tients. Regression lines for accuracy versus blur have a median
R2 of .90 (range .62e.99). Across the eight observers, for each
task, the mean ± SD slopes are: �.18 ± .02 for similar-flanker;
�.21 ± .02 for dissimilar-flanker; and �.22 ± .02 for single-
letter. Thus, the three tasks, one simple and two complex, all
have the same dependence on blur (no significant difference),
though they depend very differently on eccentricity, for which
the slope is zero for single-letter, small but nonzero for
dissimilar-flanker, and large, 4.5 times larger, for similar-flanker
(Table 2). Equivalent blur (i.e., the blur at which our normal-
sighted observers would perform as poorly as the patients)
calculated for the Mendez et al. (2007) group shows a large dif-
ference across the complex-displays (equivalent blur: similar-
flanker 2.28 deg; dissimilar-flanker .43 deg). Object recognition
is multidimensional, so one cannot expect just any graded vi-
sual degradation to affect all tasks similarly. Unlike equivalent
eccentricity, equivalent blur is not conserved across tests.
Could the deficit in apperceptive agnosia be explained by
another low-level visual phenomenon, other than crowding?
In accounting for these data, we rule out acuity and blur as
mediating factors in agnosic vision, because patients have
normal acuity, and blur lacks the needed task-dependence.
None of the many other well-known visual interference ef-
fects is compatible with the agnosic data. Internal noisemight
be higher in these brain-damaged patients, but it would affect
simple and complex targets similarly, unlike the data. Mask-
ing and contour interaction depend on overlap and decrease
rapidly when masker-target spacing is increased beyond
contiguity, unlike these data. Song et al. (2014, Eq. 3) find that
masking extends beyond the target a distance of only 1.4
times acuity. Neuropsychological tests for agnosia use large
objects, and agnosic patients have near normal acuity, so the
gap between target and flankers is a large multiple of acuity.
Thus, the agnosic deficit with these targets cannot be due to
masking. Of the well-known visual interference phenomena,
only crowding matches the agnosic data.
In sum, the patient's equivalent eccentricity predicts his or
her performance on every complex-display task. Complex-
display tasks are limited by crowding, and simple-display
tasks are not.
each test score for every eccentricity-dependent test.
Overall, there are 32 individual patients and a group of
fourteen PCA patients, described in 24 papers. For 10
individual patients and the PCA group (Mendez et al., 2007)
we have performance on multiple complex displays; this is
indicated by the presence of more than one symbol in a
column and a gray ellipse, whose vertical extent indicates
the 95% confidence interval across tests. The various
space-filling symbols are for complex-display tasks. The
horizontal-line symbols are for acuity, which is a simple-
display task.
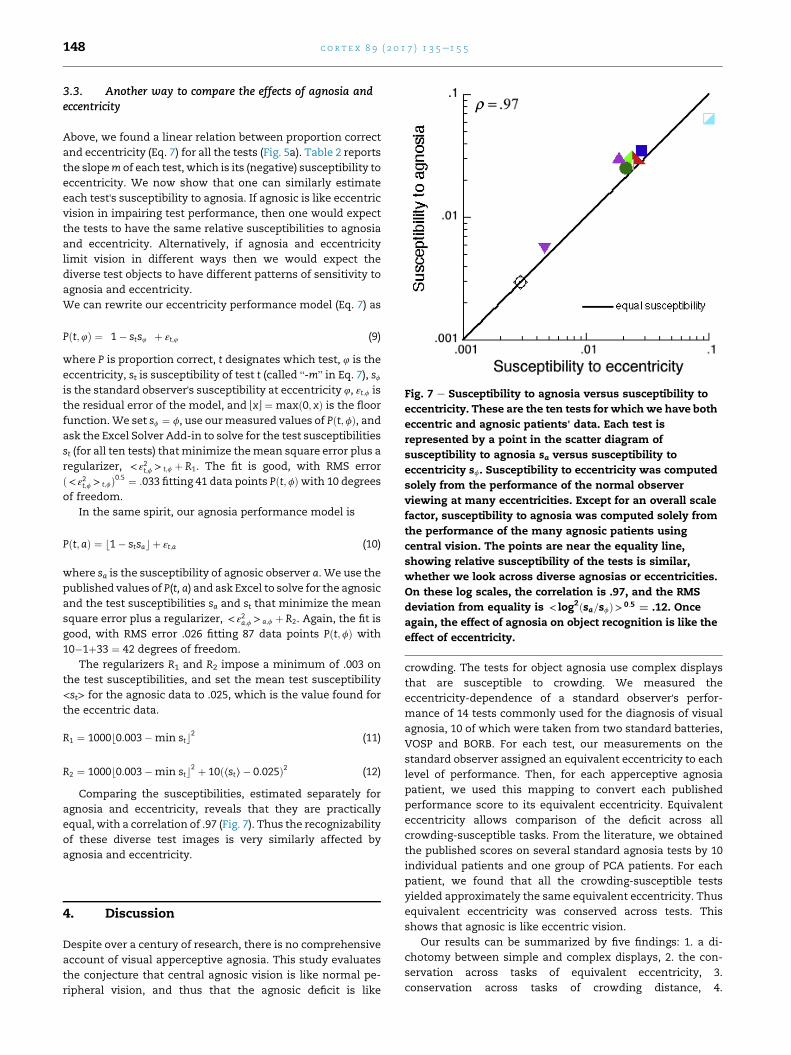
Fig. 7 e Susceptibility to agnosia versus susceptibility to
eccentricity. These are the ten tests for which we have both
eccentric and agnosic patients' data. Each test is
represented by a point in the scatter diagram of
susceptibility to agnosia sa versus susceptibility to
eccentricity sf. Susceptibility to eccentricity was computed
solely from the performance of the normal observer
viewing at many eccentricities. Except for an overall scale
factor, susceptibility to agnosia was computed solely from
the performance of the many agnosic patients using
central vision. The points are near the equality line,
showing relative susceptibility of the tests is similar,
whether we look across diverse agnosias or eccentricities.
On these log scales, the correlation is .97, and the RMS
deviation from equality is < log2ðsa=sfÞ> 0:5 ¼ .12. Once
again, the effect of agnosia on object recognition is like the
effect of eccentricity.
c o r t e x 8 9 ( 2 0 1 7 ) 1 3 5e1 5 5148
3.3. Another way to compare the effects of agnosia andeccentricity
Above, we found a linear relation between proportion correct
and eccentricity (Eq. 7) for all the tests (Fig. 5a). Table 2 reports
the slopem of each test, which is its (negative) susceptibility to
eccentricity. We now show that one can similarly estimate
each test's susceptibility to agnosia. If agnosic is like eccentric
vision in impairing test performance, then one would expect
the tests to have the same relative susceptibilities to agnosia
and eccentricity. Alternatively, if agnosia and eccentricity
limit vision in different ways then we would expect the
diverse test objects to have different patterns of sensitivity to
agnosia and eccentricity.
We can rewrite our eccentricity performance model (Eq. 7) as
Pðt;4Þ ¼ �1� sts4
�þ εt;4 (9)
where P is proportion correct, t designates which test, 4 is the
eccentricity, st is susceptibility of test t (called “-m” in Eq. 7), sfis the standard observer's susceptibility at eccentricity 4, εt;f is
the residual error of the model, and PxR ¼ maxð0; xÞ is the floor
function.We set sf ¼ f, use ourmeasured values of Pðt;fÞ, andask the Excel Solver Add-in to solve for the test susceptibilities
st (for all ten tests) thatminimize themean square error plus a
regularizer, < ε2t;f > t;f þ R1. The fit is good, with RMS error
ð< ε2t;f > t;fÞ0:5 ¼ :033 fitting 41 data points Pðt;fÞwith 10 degrees
of freedom.
In the same spirit, our agnosia performance model is
Pðt;aÞ ¼ b1� stsac þ εt;a (10)
where sa is the susceptibility of agnosic observer a. We use the
published values of P(t, a) and ask Excel to solve for the agnosic
and the test susceptibilities sa and st that minimize the mean
square error plus a regularizer, < ε2a;f > a;f þ R2. Again, the fit is
good, with RMS error .026 fitting 87 data points Pðt;fÞ with
10�1þ33 ¼ 42 degrees of freedom.
The regularizers R1 and R2 impose a minimum of .003 on
the test susceptibilities, and set the mean test susceptibility
<st> for the agnosic data to .025, which is the value found for
the eccentric data.
R1 ¼ 1000b0:003�min stc2 (11)
R2 ¼ 1000b0:003�min stc2 þ 10ð⟨st⟩� 0:025Þ2 (12)
Comparing the susceptibilities, estimated separately for
agnosia and eccentricity, reveals that they are practically
equal, with a correlation of .97 (Fig. 7). Thus the recognizability
of these diverse test images is very similarly affected by
agnosia and eccentricity.
4. Discussion
Despite over a century of research, there is no comprehensive
account of visual apperceptive agnosia. This study evaluates
the conjecture that central agnosic vision is like normal pe-
ripheral vision, and thus that the agnosic deficit is like
crowding. The tests for object agnosia use complex displays
that are susceptible to crowding. We measured the
eccentricity-dependence of a standard observer's perfor-
mance of 14 tests commonly used for the diagnosis of visual
agnosia, 10 of which were taken from two standard batteries,
VOSP and BORB. For each test, our measurements on the
standard observer assigned an equivalent eccentricity to each
level of performance. Then, for each apperceptive agnosia
patient, we used this mapping to convert each published
performance score to its equivalent eccentricity. Equivalent
eccentricity allows comparison of the deficit across all
crowding-susceptible tasks. From the literature, we obtained
the published scores on several standard agnosia tests by 10
individual patients and one group of PCA patients. For each
patient, we found that all the crowding-susceptible tests
yielded approximately the same equivalent eccentricity. Thus
equivalent eccentricity was conserved across tests. This
shows that agnosic is like eccentric vision.
Our results can be summarized by five findings: 1. a di-
chotomy between simple and complex displays, 2. the con-
servation across tasks of equivalent eccentricity, 3.
conservation across tasks of crowding distance, 4.
c o r t e x 8 9 ( 2 0 1 7 ) 1 3 5e1 5 5 149
conservation, across eccentricity and agnosia, of the relative
susceptibility of recognition of the many tests, and, 5. that
crowding is not tightly linked to acuity.
1. Simple versus complex displays. Agnosic is like eccentric
vision, and the object-recognition deficit of agnosic pa-
tients is like peripheral crowding. Complex-display tasks
are limited by crowding, and patients perform thempoorly.
Simple-display tasks are immune to crowding, and pa-
tients perform them well. In neurology clinics, acuity is
usually tested with a simple one-letter display, which is
immune to crowding, and is near normal in the patients.
2. Conservation, across tests, of equivalent eccentricity. Normally-
sighted performance drops with eccentricity at a different
rate for each task, so, for any poor score at a given task by a
patient viewing directly, there is a larger equivalent eccen-
tricity at which our normally-sighted observer would
attain the same score. This becomes increasingly inter-
esting when the patient has taken multiple tests, so our
literature survey sought to find them all. Our key finding is
that, when a patient's scores on several tests are converted
to equivalent eccentricities, they agree: Equivalent eccen-
tricity is conserved across tasks. This is remarkable in light
of the diversity of the tests and patients. Despite the
obvious diversity of the tests (Table 2), they give the same
equivalent eccentricity. The patients have diverse lesions,
all accidental, which might be expected to produce diverse
effects on different tests, too complicated to capture with
any single parameter, yet equivalent eccentricity is
enough. For any given patient, observer PMS viewing at a
single eccentricity predicts the patient's central perfor-
mance of every complex-display test.
3. Conservation, across tests, of crowding distance. In normal
eccentric vision, crowding distance is conserved across
objects at each eccentricity (Pelli& Tillman, 2008). We have
shown that one number, the apperceptive agnosia patient'sequivalent eccentricity, is enough to specify the patient'sability to identify each of the ten diverse complex visual
objects tested. Thus, across objects, each agnosia patient'sconservation of equivalent eccentricity implies that they
also conserve crowding distance.
4. Conservation, from patients to eccentricity, of test susceptibility.
Whether assessed across various degrees of agnosia or
eccentricity, we find the same relative susceptibility of
recognition of the ten objects for which we have data
(Fig. 7). If foveal agnosic vision is like eccentric vision, then
one would expect this conservation of susceptibility.
Alternatively, if agnosia and eccentricity limit vision in
different ways then we would expect the diverse test ob-
jects to have different patterns of relative sensitivity for
agnosia and eccentricity, contrary to what we found.
5. Crowding is not tightly linked to acuity. Peripheral identifica-
tion of a complex display is usually crowding-limited, and
thus independent of acuity. The complex displays used
here to estimate equivalent eccentricity all use objects
much bigger than the acuity size. Song et al. (2014) report
that anisometropic amblyopia patients have poor acuity
and normal crowding, while our data suggest that another
clinical condition (apperceptive agnosia) seems to greatly
worsen crowding while sparing acuity. Combining their
results with ours, Song et al. (2014) report a psychophysical
double dissociation of acuity and crowding. We welcome
further studies on these clinical populations to assess the
suggested double dissociation and its neural correlates.
4.1. Crowding and apperceptive agnosia
We have shown that each apperceptive agnosia patient's abil-
ity to identify diverse complex visual objects may be specified
by one number, his or her equivalent eccentricity. This con-
servation of equivalent eccentricity, in each apperceptive
agnosia patient, implies conservation of crowding distance.
Crowding-like behavior in agnosia: Text. When identification
of cluttered or multi-part objects is impaired because of
crowding, recognition can be restored by increasing the object
size, increasing the spacing between the parts, or isolating the
target part from the surrounding elements (Levi, 2008; Martelli
et al., 2005; Pelli et al., 2004; Whitney & Levi, 2011). Crutch and
Warrington (2007; 2009) reported two patients affected by
PCAwhose ability to recognize a central letter improved when
the flanking distracters were farther away. In the case of a
word, scaling the size of the text increases the letter spacing:
This scaling reduces crowding and restores recognition.
Similarly, HJA's “reading is restricted to newspaper headlines
or large print books” (Humphreys & Riddoch, 1987, p. 29).
Buxbaum et al. (1999) report that “although W.B.'s visual
acuity of 20/40 is adequate … he thought letter recognition to
be less difficult with large stimuli”.
Crowding-like behavior in agnosia: Faces. In the normal pe-
riphery, a facial feature is hard to identify when crowded by
the other features, and isolating a part by removing the rest of
the face or spreading the facial features apart restores recog-
nition (Martelli et al., 2005). Similarly, HJA was much better at
recognizing a facial feature presented alone than when pre-
sented in a face (Boutsen & Humphreys, 2002). HJA's perfor-
mance is unlike the well-known foveal face superiority effect
(Tanaka & Farah, 1993; Tanaka & Sengco, 1997) and similar to
the face inferiority effect due to crowding found in the normal
periphery (M€akel€a, N€as€anen, Rovamo, & Melmoth, 2001;
Martelli et al., 2005). We imagine that an agnosia patient
might occasionally see better by using his or her hand as a
reduction tube to isolate a simple recognizable part of a face or
street sign.
4.2. A glance at the neural substrates of crowding andapperceptive agnosia
Apperceptive agnosia may represent a defect in the ventral
stream (Goodale & Milner, 1992; Goodale, Milner, Jakobson, &
Carey, 1991), and is usually associated with either a bilateral
or a right-unilateral occipito-temporal lesion that spares stri-
ate cortex and parietal areas (Humphreys, 1999). More recently
it has been reported that a lesion in the left hemisphere near
the visual word form area (VWFA) may lead to severe alexia
and a mild prosopagnosia and, conversely, a lesion in the right
hemisphere near the fusiform face area (FFA) may lead to
prosopagnosia and a mild alexia (Behrmann & Plaut, 2014).
Thus, object recognition deficits seem to be associated with
distributed cortical networks (Behrmann & Plaut, 2013).
c o r t e x 8 9 ( 2 0 1 7 ) 1 3 5e1 5 5150
Consistent with this view, recent fMRI studies found that a
neural analog of visual crowding seems to be associated with a
widespread network that involves all the early visual areas
including the VWFA (Anderson, Dakin, Schwarzkopf, Rees, &
Greenwood, 2012; Chen et al., 2014; Freeman, Donner, &
Heeger, 2011; Millin, Arman, Chung, & Tjan, 2013). Lesions
may compromise this network in agnosia. In their study of
crowding in 26 PCA patients, Yong et al. (2014) report a corre-
lation between crowding and gray matter volume within the
right collateral sulcus, between the fusiform and lingual gyri.
Thus, crowding in the central vision of the agnosic patients
may reflect limited plasticity in recovering from neural loss of
the ventral stream, i.e., insufficient recruitment of other neu-
rons to entirely make up for the loss. Our results speak only to
the psychophysical behavior of agnosic and peripheral vision.
Other studies are needed to identify the neural correlates. Even
so, linking apperceptive agnosia and crowding as perceptual
phenomena facilitates consideration of the computation un-
derlying object recognition.
4.3. Conservation of number of neurons
Crowding field is the area enclosed by the crowding distance in
every direction (also known as “combining field” and “inte-
gration field”, among other names). As eccentricity increases,
the crowding distance (in deg at visual field) grows propor-
tionally and the cortical magnification factor (mm/deg) drops
inversely, so that their product, the crowding distance in mm
at the cortex, is constant, independent of eccentricity, in all
the cortical areas with logarithmic retinotopy: V1, V2, V3, V4/
V8, LO1, and LO2 (Motter and Simoni, 2007; Pelli, 2008). This
implies a fixed cortical area within a crowding distance, i.e.,
crowding area is conserved across eccentricity. Since neural
density (neurons per mm2 of cortical surface) is conserved
across (normal) individuals, conservation of crowding area
implies conservation of the number of cortical neurons in the
crowding area (Braitenberg & Schuz, 2013; Pelli, 2008; Rockel,
Hiorns, & Powell, 1980). Neural density is .12 1012 mm2 in
most of the cortex and .31 1012 mm2 in V1 (Rockel et al., 1980).
The cortical magnification scalar b varies slightly among vi-
sual areas (Larsson & Heeger, 2006). Thus the V1 crowding
area of 2� 12mm2 contains 7.4mm2 neurons, and the V2 (and
V3 and hV4) crowding area of 1.6 � 10 mm2 contains 1.9 1012
neurons. (Relative to V2, the estimated area and count are 40%
lower for LO1 and 40% higher for LO2.)
The site of crowding is still unknown. Neurophysiology in-
dicates that crowding may occur between V1 and V4/V8
(Anderson et al., 2012; Chen et al., 2014; Freeman et al., 2011;
Freeman & Simoncelli, 2011; Harrison & Bex, 2015; Millin
et al., 2013), and the conservation across eccentricity of the
radial crowding distance in the logarithmically mapped areas
makes V1, V2, V3, hV4, LO1, and LO2 likely candidates. All these
areas conserve thenumberofneuronsper crowdingfieldacross
eccentricity. Let us suppose, for a moment, that one of these
cortical areas is crowding-relevant, i.e., the site of crowding.
Across normal individuals, Vernier acuity is highly corre-
lated with the cortical magnification factor in V1, and the
threshold Vernier offset corresponds to a fixed distance inmm
on the surface of V1 (Duncan & Boynton, 2003; Levi, Klein, &
Aitsebaomo, 1985). Since acuity size and crowding distance
both seem to be linked to corticalmagnification, the Song et al.
(2014) evidence for double dissociation of crowding and acuity
suggests that acuity and crowding are linked to different
areas. Acuity is tightly linked to V1, so crowding cannot be, but
may be tightly linked to another cortical area.
Knowing that in normal vision there is a fixed number of
neurons in a crowding field, independent of eccentricity, and
that agnosic vision is like eccentric vision, we hypothesize that
in agnosia as well, there is the same fixed number of neurons
in a crowding field. We suppose that radial crowding distance,
whether in agnosia after brain damage or in peripheral vision
after normal development, is determined solely by the number
of available neurons per square degree in the in the crowding-
relevant cortical area, e.g., hV4, at the tested eccentricity.
Confining ourselves to the crowding-relevant cortical area,
once given the number of cortical neurons that fit in the area of
a crowding field, then the neural density (per deg2) determines
the extent of crowding. This neural density may be reduced by
lower corticalmagnification (in the periphery), take over by the
other eye (in strabismic amblyopia), or cell death (in agnosia).
This neural-density hypothesis would account for the known
dependence of radial crowding distance on eccentricity and
explain the new observation that loss of neurons in agnosia
results in central vision that is like peripheral vision, limited by
crowding. Note that this neural-density hypothesis merely
extends the known conservation of number of neurons per
crowding field (in the crowding-relevant cortical area) from
normal to agnosic vision.
4.4. Crowding and object-category-specific deficits invisual agnosia
Though rare, visual agnosia has been studied with great in-
terest for over a century in order to elucidate the basic
mechanisms of object recognition. Part of the debate has
focused on whether agnosia may occur as a domain-specific
deficit, impairing some kinds of objects and tasks, while
sparing others.
Neuropsychological studies of brain-damaged patients
have found selective deficits for words (pure alexia), objects
(pure visual object agnosia), and faces (prosopagnosia) (Farah,
2004). However, when the deficit is selective, it usually turns
out to be associativednot apperceptivedagnosia (Farah, 2004).
Conversely, patients with a pure apperceptive deficit are
usually broadly impaired in the recognition ofmany categories
of stimuli, not just one specific category. For instance, patients
with pure alexia (cannot read words) are also impaired with
digits and in discriminating black-and-white checkerboards
(Mycroft, Behrmann, & Kay, 2009; Starrfelt, Habekost, & Leff,
2009). Patients with apperceptive object agnosia following a
unilateral or bilateral lesion in the lateral occipital complex
(LOC) seem to also be impaired with several kinds of stimuli
(James et al., 2003; Ptak, Lazeyras, Di Pietro, Schnider,& Simon,
2014). Patients with apperceptive prosopagnosia may have
trouble identifying other visually similar items like “Greebles”
(Gauthier & Tarr, 1997). Gauthier, Behrmann, and Tarr (1999)
suggested that object recognition tasks may be distributed in
a multidimensional space defined by at least three relevant
factors: expertise, categorization level, and stimulus class
membership. Previous attempts to equate task difficulty were
c o r t e x 8 9 ( 2 0 1 7 ) 1 3 5e1 5 5 151
based on accuracy of normal observers. Gauthier et al. (1999)
measured each prosopagnosia patient's sensitivity and reac-
tion time as a function of manipulations of the three factors.
The authors found that prosopagnosia patients show a highly
selective deficit for faces when performance is measured in
terms of accuracy, but for non-face objects with increased
categorization level (from subordinate to basic to exemplar)
they have disproportionately lower sensitivity and higher re-
action times. Similarly, in psychophysical testing, Starrfelt,
Habekost, and Gerlach (2010) found that the deficit of a pa-
tient with pure alexia (NN) was not restricted to letters, and
NN's central vision was like NN's peripheral vision. In the au-
thors' words, this “could point to a form of foveal amblyopia,
where shape perception is disproportionally impaired in the
centre of the visual field.” (Starrfelt et al., 2010, p. 253).
In short, the selectivity of the agnosic deficit has been
debated, and part of the variation in performance across ob-
ject categories may reflect task difficulty (but see also Riddoch
et al., 2008 for a counterargument).
The absence of pure cases does not exclude the existence of
domain-specific areas serving each category (Andrews, Clarke,
Pell,&Hartley, 2010; Doniger et al., 2000; Grill-Spector, Kushnir,
Edelman, Itzchak, & Malach, 1998; Kourtzi & Kanwisher, 2000;
Murtha, Chertkow, Beauregard, & Evans, 1999; Woodhead,
Wise, Sereno, & Leech, 2011). The presence of a category-
selective module does not guarantee that pure deficits will
occur in the clinical population. One possible reason for the
dearth of pure cases is that lesions in these patients are seldom
narrow enough to knock out just one category. It is also
possible that each domain-specific area recruits a wider
network in the occipito-temporal cortex, and the domain-
specific networks overlap somewhat (Behrmann& Plaut, 2013).
The evidence for brain modules specific to particular kinds
of object led us to expect that each patient would have diverse
equivalent eccentricities, reflecting the kind of object most
impaired by the lesion. Instead we find that each patient'sequivalent eccentricity is conserved across objects. It is
remarkable that the plastic changes in recovery from brain
damage converge on visual crowding that is so similar, across
all complex image tasks, to normal peripheral retina. Perhaps
each eye's crowding distance is wholly determined by neural
density in the crowding-relevant cortical area.
4.5. Agnosic is like eccentric vision
In general, the effect of crowding is strongly task- and
stimulus-dependent. Here we showed that various tasks yield
very different slopes of accuracy versus eccentricity: from a
mere �.005 for two-letter identification to a whopping �.1 for
the similar-flanker condition. Converting a patient's accuracy
to equivalent eccentricity accounts for the way that crowding
depends on task and stimulus. Similarly, the relative suscep-
tibility of recognition of diverse objects to various eccentric-
ities is conserved for various agnosias.
5. Conclusions
Conservation of each patient's equivalent eccentricity. We find that
each apperceptive agnosia patient's ability to identify diverse
complex visual objects is specified by one number, his or her
equivalent eccentricity. That is the eccentricity at which a
standard observer's peripheral vision is as poor as the pa-
tient's central vision for that task. The conservation of
equivalent eccentricity across tasks indicates that the recog-
nition deficit in apperceptive agnosia is like visual crowding.
Our crowding hypothesis provides a one-parameter ac-
count of apperceptive agnosia that predicts performance of all
the complex-object recognition tests. This enables succinct
description of a phenomenon that historically has relied
heavily on case studies of individual patients. The published
patients included here have brain lesions of various sizes and
locations, yet all conform to the equivalent-eccentricity
model. To the extent that the findings reported here, based
on 46 patients from24papers, are representative of all patients
with apperceptive agnosia, it may be helpful to routinely
convert raw test performance scores to equivalent eccentric-
ities. Our crowding conjecture predicts conservation of
equivalent eccentricity: Each patient's equivalent eccentricity
will be consistent across all complex-image tests. Table 2
provides a formula and parameter values to compute equiva-
lent eccentricity from the performance score on 14 popular
tests. Eccentricity-dependence varies hugely across tasks
(Table 2) and very little across normally-sighted individuals.
Conservation of each test's susceptibility. Relative susceptibil-
ity of recognition in ten diverse visual tasks is conserved from
testing with various eccentricities to testing with various ag-
nosias. This recommends tabulating susceptibility, as in Table
2. We welcome extensions of this table to include more tests.
Clinical recommendation. Thus, it may be helpful to explicitly
test for crowding when characterizing the vision of agnosic
patients. We recommend the Cambridge Crowding Cards
(Atkinson, Anker, Evans, Hall, & Pimm-Smith, 1988; Atkinson,
Pimm-Smith, Evans, Harding, & Braddick, 1986), the Glasgow
Acuity Cards (McGraw & Winn, 1993; sold by Keeler as the
LogMAR Crowding Test), and the Pelli Clinical Test for Visual
Crowding (Pelli et al., 2016), which are all designed to measure
foveal crowding. However, any sensitive complex-display
(with a high slope in Table 2) will do. We hope it will prove
useful to routinely convert raw test scores with complex dis-
plays to equivalent eccentricity, to facilitate comparisons
across tests and patients.
Neural density. Finally, the neural-density hypothesis pro-
vides a parsimonious account of the surprising finding that
agnosic is like eccentric vision. Perhaps both are limited by
crowding and radial crowding distance is determined by neu-
ral density (per deg2) in the crowding-relevant cortical area.
Author contributions
The project began when Marialuisa Martelli noted the simi-
larity between her peripheral crowded vision and HJA's verbal
reports of object appearance and wondered how general this
similarity might be. Francesca Strappini, Enrico Di Pace, and
Marialuisa Martelli together decided to apply tests for agnosia
to normal peripheral vision and compare the results with
published tests of agnosic vision. Francesca Strappini reviewed
the visual agnosia literature and collected the data. Enrico Di
Pace wrote the first draft of this paper. Denis Pelli introduced
c o r t e x 8 9 ( 2 0 1 7 ) 1 3 5e1 5 5152
the concept of equivalent eccentricity, devised the analyses
that yielded Figs. 5e7, and formulated the neural-density hy-
pothesis. All the authors contributed to the crowding conjec-
ture, data analysis, and writing. This is draft 104.
Acknowledgments
We thankAenne Brielmann, Apollinaire Scherr, Roberta Daini,
Tomer Livne, Sarah Rosen, Lauren Vale, Carol SeaholmVolow,
Xiuyun Wu, Angelica Zeller-Michaelson, and Pierluigi Zocco-
lotti for helpful comments. We particularly thank both J.A.
Movshon and Reviewer 1 for suggesting that it would beworth
looking at acuity as an alternate account. We thank PMS for
his careful observations. Thanks to Margaret Morton, Pepe
Karmel, Thomas PMcNulty, and Todd Leibowitz for helping us
locate the Picasso painting for the cover. This work was sup-
ported by: Italian Department of Health and Sapienza Uni-
versity (M.M.); Paola dei Mansi Fellowship (F.S.); NIH Grant
R01-EY04432 (D.G.P.).
r e f e r e n c e s
Adler, A. (1944). Disintegration and restoration of opticrecognition in visual agnosia: Analysis of a case. Archives ofNeurology and Psychiatry, 51, 243e259.
Anderson, E. J., Dakin, S. C., Schwarzkopf, D. S., Rees, G., &Greenwood, J. A. (2012). The neural correlates of crowding-induced changes in appearance. Current Biology, 22(13),1199e1206.
Andrews, T. J., Clarke, A., Pell, P., & Hartley, T. (2010). Selectivityfor low-level features of objects in the human ventral stream.NeuroImage, 49, 703e711.
Astle, A. T., Blighe, A. J., Webb, B. S., & McGraw, P. V. (2014). Theeffect of aging on crowded letter recognition in the peripheralvisual field. Investigative Ophthalmology and Visual Science, 55(8),5039e5045. http://dx.doi.org/10.1167/iovs.14-14181.
Atkinson, J., Anker, S., Evans, C., Hall, R., & Pimm-Smith, E. (1988).Visual acuity testing of young children with the CambridgeCrowding Cards at 3 and 6 m. Acta Ophthalmologica (Copenh),66(5), 505e508.
Atkinson, J., Pimm-Smith, E., Evans, C., Harding, G., & Braddick, O.(1986). Visual crowding in young children. Doc Ophthalmol ProcSer, 45, 201e213.
Balint, R. (1909). Seelenl€ahmung des ‘‘Schauens’’, optische Ataxie,r€aumliche St€orung der Aufmerksamkeit. Monattsschriften furPsychiatrie und Neurologie, 25, 51e81 (Translated in CognitiveNeuropsychology, 1995, 12, 265e281).
Behrmann, M., & Kimchi, R. (2003). What does visual agnosia tellus about perceptual organization and its relationship to objectperception? Journal of Experimental Psychology: Human Perceptionand Performance, 29(1), 19e42.
Behrmann, M., Moscovitch, M., & Winocur, G. (1994). Intact visualimagery and impaired visual perception in a patient withvisual agnosia. Journal of Experimental Psychology: HumanPerception and Performance, 20(5), 1068.
Behrmann, M., & Nishimura, M. (2010). Agnosias. WileyInterdisciplinary Reviews: Cognitive Science, 1(2), 203e213.
Behrmann, M., & Plaut, D. C. (2013). Distributed circuits, notcircumscribed centers, mediate visual recognition. Trends inCognitive Sciences, 17(5), 210e219.
Behrmann, M., & Plaut, D. C. (2014). Bilateral hemisphericprocessing of words and faces: Evidence from word
impairments in prosopagnosia and face impairments in purealexia. Cerebral Cortex, 24(4), 1102e1118.
Behrmann, M., & Williams, P. (2007). Impairments in part-wholerepresentations of objects in two cases of integrative visualagnosia. Cognitive Neuropsychology, 24(7), 701e730.
Benson, D. F., & Greenberg, J. P. (1969). Visual form agnosia.Archives of Neurology, 20, 82e90.
Boucart, M., Moroni, C., Despretz, P., Pasquier, F., & Fabre-Thorpe, M. (2010). Rapid categorization of faces and objects ina patient with impaired object recognition. Neurocase, 16(2),157e168.
Bouma, H. (1970). Interaction effects in parafoveal letterrecognition. Nature, 226(241), 177e178.
Boutsen, L., & Humphreys, G. W. (2002). Face context interfereswith local part processing in a prosopagnosic patient.Neuropsychologia, 40, 2305e2313.
Brainard, D. H. (1997). The psychophysics toolbox. Spatial Vision,10, 433e436.
Braitenberg, V., & Schuz, A. (2013). Cortex: Statistics and geometry ofneuronal connectivity (2nd ed.). Springer Science & BusinessMedia.
Buxbaum, L. J., Glosser, G., & Coslett, H. B. (1999). Impaired faceand word recognition without object agnosia.Neuropsychologia, 37(1), 41e50.
Caffarra, P., Vezzadini, G., Dieci, F., Zonato, F., & Venneri, A.(2002). Rey-Osterrieth complex figure: Normative values in anItalian population sample. Neurological Sciences, 22(6), 443e447.
Campion, J., & Latto, R. (1985). Apperceptive agnosia due tocarbon monoxide poisoning: An interpretation based oncritical band masking from disseminated lesions. BehavioralBrain Research, 15, 227e240.
Chen, J., He, Y., Zhu, Z., Zhou, T., Peng, Y., Zhang, X., et al. (2014).Attention-dependent early cortical suppression contributescrowding. The Journal of Neuroscience, 34, 10465e10474.
Chung, S. T. (2007). Learning to identify crowded letters: Does itimprove reading speed? Vision Research, 47, 3150e3159.
Chung, S. T., Li, R. W., & Levi, D. M. (2007). Crowding betweenfirst- and second-order letter stimuli in normal foveal andperipheral vision. Journal of Vision, 7(2). http://dx.doi.org/10.1167/7.2.10, 10, 1e13 http://journalofvision.org/7/2/10/.
Coslett, H., & Lie, G. (2008). Simultanagnosia: When a rose is notred. Journal of Cognitive Neuroscience, 20, 36e48.
Coslett, H., & Saffran, E. (1991). Simultanagnosia: To see but nottwo see. Brain, 114, 1523e1545.
Crutch, S., & Warrington, E. (2007). Foveal crowding in posteriorcortical atrophy: A specific early-visual-processing deficitaffectingword reading.CognitiveNeuropsychology, 24(8), 843e866.
Crutch, S. J., & Warrington, E. K. (2009). The relationship betweenvisual crowding and letter confusability: Towards anunderstanding of dyslexia in posterior cortical atrophy.Cognitive Neuropsychology, 26(5), 471e498.
Delvenne, J. F., Seron, X., Coyette, F., & Rossion, B. (2004).Evidence for perceptual deficits in associative visual (prosop)agnosia: A single-case study. Neuropsychologia, 42(5), 597e612.
De Renzi, E. (1996). Le agnosie visive. In G. Denes, & L. Pizzamiglio(Eds.), Manuale di Neuropsicologia Cognitiva. Normalit�a e Patologiadei Processi Cognitivi (p. 1426). Bologna: Zanichelli.
Doniger, G. M., Foxe, J. J., Murray, M. M., Higgins, B. A.,Snodgrass, J. G., Schroeder, C. E., et al. (2000). Activationtimecourse of ventral visual stream object-recognition areas:High density electrical mapping of perceptual closureprocesses. Journal of Cognitive Neuroscience, 12(4), 615e621.
Duncan, R. O., & Boynton, G. M. (2003). Cortical magnificationwithin human primary visual cortex correlates with acuitythresholds. Neuron, 38(4), 659e671.
Efron, R. (1968). What is perception? In R. S. Cohen, & M. Wartofky(Eds.), Boston studies in the philosophy of science. New York:Humanities Press.
c o r t e x 8 9 ( 2 0 1 7 ) 1 3 5e1 5 5 153
Ehlers, H. E. (1953). Clinical testing of visual acuity. AMA Archivesof Ophthalmology, 49, 431e434.
Farah, M. J. (1990). Visual agnosia: Disorders of object recognition andwhat they tell us about normal vision. Boston, Massachusetts:The MIT Press.
Farah, M. J. (2004). Visual agnosia. London, U.K.: The MIT Press.Fery, P., & Morais, J. (2003). A case study of visual agnosia without
perceptual processing or structural descriptions impairment.Cognitive Neuropsychology, 20(7), 595e618.
Flom, M. C., Heath, G. G., & Takahaski, E. (1963). Contourinteraction and visual resolution: Contralateral effects. Science,142, 979e980.
Foulsham, T., Barton, J. J., Kingstone, A., Dewhurst, R., &Underwood, G. (2009). Fixation and saliency during search ofnatural scenes: The case of visual agnosia. Neuropsychologia,47(8e9), 1994e2003.
Freeman, J., Donner, T. H., & Heeger, D. J. (2011). Inter-areacorrelations in the ventral visual pathway reflect featureintegration. Journal of Vision, 11(4), 15, 1e23.
Freeman, J., & Simoncelli, E. P. (2011). Metamers of the ventralstream. Nature Neuroscience, 14(9), 1195e1201.
Funnell, E., & Wilding, J. (2011). Development of a vocabulary ofobject shapes in a child with a very-early-acquired visualagnosia: A unique case. The Quarterly Journal of ExperimentalPsychology, 64(2), 261e282.
Gauthier, I., Behrmann, M., & Tarr, M. J. (1999). Can facerecognition really be dissociated from object recognition?Journal of Cognitive Neuroscience, 11(4), 349e370.
Gauthier, I., & Tarr, M. J. (1997). Becoming a “Greeble” expert:Exploring mechanisms for face recognition. Vision Research,37(12), 1673e1682.
Gauthier, I., Tarr, M. J., Anderson, A. W., Skudlarski, P., &Gore, J. C. (1999). Activation of the middle fusiform ‘face area’increases with expertise in recognizing novel objects. NatureNeuroscience, 2(6), 568e573.
Gilaie-Dotan, S., Perry, A., Bonneh, Y., Malach, R., & Bentin, S.(2009). Seeing with profoundly deactivated mid-level visualareas: Non-hierarchical functioning in the human visualcortex. Cerebral Cortex, 19(7), 1687e1703.
Giovagnoli, A. R., Aresi, A., Reati, F., Riva, A., Gobbo, C., & Bizzi, A.(2009). The neuropsychological and neuroradiologicalcorrelates of slowly progressive visual agnosia. NeurologicalSciences, 30(2), 123e131.
Goodale, M. A., & Milner, A. D. (1992). Separate visual pathwaysfor perception and action. Trends in Neurosciences, 15(1),20e25.
Goodale, M. A., Milner, A. D., Jakobson, L. S., & Carey, D. P. (1991).A neurological dissociation between perceiving objects andgrasping them. Nature, 349, 154e156.
Goodglass, H., Kaplan, E., & Weintraub, S. (O. Segal, Illus.) (1983).Boston naming test (2nd ed.). Philadelphia: Lea & Tebiger.
Gordon, N. (1968). Visual agnosia in childhood VI: Preliminarycommunication. Developmental Medicine and Child Neurology, 10,377e379.
Grainger, J., Tydgat, I., & Issel�e, J. (2010). Crowding affects lettersand symbols differently. Journal of Experimental Psychology:Human Perception and Performance, 36(3), 673.
Grill-Spector, K., Kushnir, T., Edelman, S., Itzchak, Y., &Malach, R. (1998). Cue-invariant activation in object-relatedareas of the human occipital lobe. Neuron, 21(1), 191e202.
Harrison, W. J., & Bex, P. J. (2015). A unifying model of orientationcrowding in peripheral vision.Current Biology, 25(24), 3213e3219.
Hildebrandt, H., Schutze, C., Ebke, M., & Spang, K. (2004).Differential impact of parvocellular and magnocellularpathways on visual impairment in apperceptive agnosia?Neurocase, 10(3), 207e214.
Hiraoka, K., Suzuki, K., Hirayama, K., & Mori, E. (2009). Visualagnosia for line drawings and silhouettes without apparent
impairment of real-object recognition: A case report.Behavioural Neurology, 21(3), 187e192.
Humphreys, G. W. (1999). Integrative agnosia. InG. W. Humphreys (Ed.), Case studies in the neuropsychology ofvision (pp. 41e58). London: Psychology Press.
Humphreys, G. W., & Riddoch, M. J. (1987). To see but not to see: Acase study of visual agnosia. Hillsdale, NJ: Erlbaum.
Humphreys, G. W., Riddoch, M. J., & Quinlan, P. T. (1985).Interactive processes in perceptual organization: Evidencefrom visual agnosia. In M. I. Posner, & O. S. M. Marin (Eds.),Attention & performance XI. Hillsdale, N. J.: Erlbaum.
Irvine, R. S. (1945). Amblyopia ex anopsia. Observations on retinalinhibition, scotoma, projection, light differencediscrimination and visual acuity. Transactions of the AmericanOphthalmological Society, 66, 527e575.
James, T. W., Culham, J., Humphrey, G. K., Milner, A. D., &Goodale, M. A. (2003). Ventral occipital lesions impair objectrecognition but not object-directed grasping: An fMRI study.Brain, 126, 2463e2475.
Joubert, S., Felician, O., Barbeau, E., Sontheimer, A., Barton, J. J.,Ceccaldi, M., et al. (2003). Impaired configurational processingin a case of progressive prosopagnosia associated withpredominant right temporal lobe atrophy. Brain, 126(11),2537e2550.
Kaplan, E., Goodglass, H., & Weintraub, S. (1983). Boston namingtest. Philadelphia: Lea & Febiger. OCLC 10450471.
Karnath, H. O., Ruter, J., Mandler, A., & Himmelbach, M. (2009).The anatomy of object recognitiondvisual form agnosiacaused by medial occipitotemporal stroke. The Journal ofNeuroscience, 29(18), 5854e5862.
Kiper, D. C., Zesiger, P., Maeder, P., Deonna, T., & Innocenti, G. M.(2002). Vision after early-onset lesions of the occipital cortex: I.Neuropsychological and psychophysical studies. NeuralPlasticity, 9(1), 1e25.
Korte, W. (1923). Uber die Gestaltauffassung im indirekten Sehen.Zeitschrift fur Psychologie, 93, 17e82.
Kourtzi, Z., & Kanwisher, N. (2000). Cortical regions involved inperceiving object shape. Journal of Neuroscience, 20(9),3310e3318.
Larsson, J., & Heeger, D. J. (2006). Two retinotopic visual areas inhuman lateral occipital cortex. The Journal of Neuroscience, 26,13128e13142.
Latham, K., & Whitaker, D. (1996). Relative roles of resolution andspatial interference in foveal and peripheral vision. Ophthalmic& Physiological Optics, 16, 49e57.
Le, S., Cardebat, D., Boulanouar, K., H�enaff, M. A., Michel, F.,Milner, D., et al. (2002). Seeing, since childhood,without ventral stream: A behavioural study. Brain, 125(1),58e74.
Leek, C. E., Patterson, C., Paul, M. A., Rafal, R., & Cristino, F. (2012).Eye movements during object recognition in visual agnosia.Neuropsychologia, 50(9), 2142e2153.
Legge, G. E., & Foley, J. M. (1980). Contrast masking in humanvision. Journal of the Optical Society of America, 70(12), 1458e1471.
Lehmann, M., Barnes, J., Ridgway, G. R., Wattam-Bell, J.,Warrington, E. K., Fox, N. C., et al. (2011). Basic visual functionand cortical thickness patterns in posterior cortical atrophy.Cerebral Cortex, 21(9), 2122e2132.
Levi, D. M. (2008). Crowding e an essential bottleneck for objectrecognition: A mini-review. Vision Research, 48(5), 635e654.
Levi, D. M., Klein, S. A., & Aitsebaomo, A. P. (1985). Vernier acuity,crowding and cortical magnification. Vision Research, 25(7),963e977.
Levi, D. M., Song, S., & Pelli, D. G. (2007). Amblyopic reading iscrowded. Journal of Vision, 7(2), 21, 1e17.
Lissauer, H. (1890). Ein Fall von Seelenblindheit nebst einemBeitr€age zur Theorie derselben [A case of visual agnosia with acontribution to theory]. Archiv fur Psychiatrie, 21, 222e270
c o r t e x 8 9 ( 2 0 1 7 ) 1 3 5e1 5 5154
[Translated in Shallice, T., & Jackson, M. (1988). Lissauer onagnosia. Cognitive Neuropsychology, 5, 153e192.].
Liu, L., & Arditi, A. (2000). Apparent string shorteningconcomitant with letter crowding. Vision Research, 40(9),1059e1067.
Loring, D. W., Sethi, K. D., Lee, G. P., & Meador, K. J. (1990).Neuropsychological performance in Hallervorden-Spatzsyndrome: A report of two cases. Neuropsychology, 4(3), 191.
Luria, A. R. (1959). Disorders of “simultaneous perception” in acase of bilateral occipito-parietal brain injury. Brain, 82,437e449.
M€akel€a, P., N€as€anen, R., Rovamo, J., & Melmoth, D. (2001).Identification of facial images in peripheral vision. VisionResearch, 41(5), 599e610.
Mannan, S. K., Kennard, C., & Husain, M. (2009). The role of visualsalience in directing eye movements in visual object agnosia.Current Biology, 19(6), R247eR248.
Martelli, M. M., Majaj, N. J., & Pelli, D. G. (2005). Are face processedlike words? A diagnostic test for recognition by parts. Journal ofVision, 5, 58e70.
McGraw, P. V., & Winn, B. (1993). Glasgow acuity cards: A new testfor the measurement of letter acuity in children. Ophthalmicand Physiological Optics, 13(4), 400e404.
McMonagle, P., Deering, F., Berliner, Y., & Kertesz, A. (2006). Thecognitive profile of posterior cortical atrophy. Neurology, 66,331e338.
Mendez, M. F., Shapira, J. S., & Clark, D. G. (2007). “Apperceptive”alexia in posterior cortical atrophy. Cortex, 43(2), 264e270.
Metitieri, T., Barba, C., Pellacani, S., Viggiano, M. P., & Guerrini, R.(2013). Making memories: The development of long-termvisual knowledge in children with visual agnosia. NeuralPlasticity, 2013.
Mevorach, C., Shalev, L., Green, R. J., Chechlacz, M., Riddoch, M. J.,& Humphreys, G. W. (2014). Hierarchical processing in Balint'ssyndrome: A failure of flexible top-down attention. Frontiers inHuman Neuroscience, 27(8), 113.
Millin, R., Arman, A. C., Chung, S. T., & Tjan, B. S. (2013). Visualcrowding in V1. Cerebral Cortex. Epub 10.1093/cercor/bht159.
Milner, A. D., & Goodale, M. A. (1995). The visual brain in action.Oxford, UK: Oxford Press.
Milner, A. D., Perrett, D. I., Johnston, R. S., Benson, P. J.,Jordan, T. R., Heeley, D. W., et al. (1991). Perception and actionin “visual form agnosia.” Brain, 114, 405e428.
Mishkin, M., Ungerleider, L. G., & Macko, K. A. (1983). Object visionand spatial vision: Two cortical pathways. Trends inNeurosciences, 6, 414e417.
Motter, B. C., & Simoni, D. A. (2007). The roles of cortical imageseparation and size in active visual search performance.Journal of Vision, 7(2), 6e6.
Murtha, S., Chertkow, H., Beauregard, M., & Evans, A. (1999). Theneural substrate of picture naming. Journal of CognitiveNeuroscience, 11(4), 399e423.
Mycroft, R. H., Behrmann, M., & Kay, J. (2009). Visuoperceptualdeficits in letter-by-letter reading? Neuropsychologia, 47,1733e1744.
Nandy, A. S., & Tjan, B. S. (2007). The nature of letter crowding asrevealed by first- and second-order classification images.Journal of Vision, 7(2), 5, 1e26.
Navon, D. (1977). Forest before the trees. The precedence of globalfeatures in visual perception. Cognitive Psychology, 9(3), 353e383.
Parkes, L., Lund, J., Angelucci, A., Solomon, J. A., & Morgan, M.(2001). Compulsory averaging of crowded orientation signalsin human vision. Nature Neuroscience, 4(7), 739e744.
Pelli, D. G. (1997). The VideoToolbox software for visualpsychophysics: Transforming numbers into movies. SpatialVision, 10, 437e442.
Pelli, D. G. (2008). Crowding: A cortical constraint on objectrecognition. Current Opinion in Neurobiology, 18, 445e451.
Pelli, D. G., Palomares, M., & Majaj, N. J. (2004). Crowding is unlikeordinary masking: Distinguishing feature integration fromdetection. Journal of Vision, 4(12), 1136e1169.
Pelli, D. G., & Tillman, K. A. (2008). The uncrowded window ofobject recognition. Nature Neuroscience, 11(10), 1129e1135.
Pelli, D. G., Tillman, K. A., Freeman, J., Su, M., Berger, T. D., &Majaj, N. J. (2007). Crowding and eccentricity determinereading rate. Journal of Vision, 7(2), 20.
Pelli, D. G., Waugh, S. J., Martelli, M., Crutch, S. J., Primativo, S.,Yong, K. X., et al. (2016). A clinical test for visual crowding.F1000Research, 5, 81.
Price, C. J., & Humphreys, G. W. (1995). Contrasting effects ofletter-spacing in alexia: Further evidence that differentstrategies generate word length effects in reading. TheQuarterly Journal of Experimental Psychology, 48(3), 573e597.
Ptak, R., Lazeyras, F., Di Pietro, M., Schnider, A., & Simon, S. R.(2014). Visual object agnosia is associated with a breakdown ofobject-selective responses in the lateral occipital cortex.Neuropsychologia, 60, 10e20.
Rey, A. (1941). L'examen psychologie dan les casd'enc�ephalopathie traumatique (Les probl�emes) [Thepsychological examination in cases of traumaticencephalopathy (Problems)]. Archives de Psychologie, 28,215e285. http://en.wikipedia.org/wiki/Rey-Osterrieth_Complex_Figure (Accessed 1 December 2016).
Riddoch, M. J., & Humphreys, G. W. (1987). A case of integrativevisual agnosia. Brain, 110, 1431e1462.
Riddoch, M. J., & Humphreys, G. W. (1993). Birmingham objectrecognition battery (BORB). Hove, UK: Lawrence ErlbaumAssociates.
Riddoch, M. J., Johnston, R. A., Bracewell, R. M., Boutsen, L., &Humphreys, G. W. (2008). Are faces special? A case of pureprosopagnosia. Cognitive Neuropsychology, 25(1), 3e26.
Rockel, A. J., Hiorns, R. W., & Powell, T. P. (1980). The basicuniformity in structure of the neocortex. Brain, 103, 221e244.
Rosen, S., Chakravarthi, R., & Pelli, D. G. (2014). The Bouma law ofcrowding, revised: Critical spacing is equal across parts, notobjects. Journal of Vision, 14(6), 10, 1e15 http://www.journalofvision.org/content/14/6/10.
Sacks, O. (1998). The man who mistook his wife for a hat: And otherclinical tales. Simon and Schuster.
Shalev, L., Chajut, E., & Humphreys, G.,W. (2005). Interactiveperceptual and attentional limits in visual extinction.Neurocase, 11(6), 452e462.
Shelton, P. A., Bowers, D., Duara, R., & Heilman, K. M. (1994).Apperceptive visual agnosia: A case study. Brain and Cognition,25, 1e30.
Snodgrass, J. G., & Vanderwart, M. (1980). A standardized set of260 pictures: Norms for name agreement, familiarity andvisual complexity. Journal of Experimental Psychology: HumanLearning & Memory, 6, 174e215.
Song, S., Levi, D. M., & Pelli, D. G. (2014). A double dissociation ofthe acuity and crowding limits to letter identification, andthe promise of improved visual screening. Journal of Vision,14(5), 3. http://jov.arvojournals.org/article.aspx?articleid¼2121640.
Starrfelt, R., Habekost, T., & Gerlach, C. (2010). Visual processingin pure alexia: A case study. Cortex, 46(2), 242e255.
Starrfelt, R., Habekost, T., & Leff, A. P. (2009). Too little, too late:Reduced visual span and speed characterize pure alexia.Cerebral Cortex, 19(12), 2880e2890.
Stuart, J. A., & Burian, H. M. (1962). A study of separationdifficulty: Its relationship to visual acuity in normal andamblyopic eyes. American Journal of Ophthalmology, 53,471e477.
Talairach, J., & Tournoux, P. (1988). Co-planar stereotaxic atlas of thehuman brain. 3-Dimensional proportional system: An approach tocerebral imaging. New York: Thieme.
c o r t e x 8 9 ( 2 0 1 7 ) 1 3 5e1 5 5 155
Tanaka, J. W., & Farah, M. J. (1993). Parts and wholes in facerecognition. Quarterly Journal of Experimental Psychology A, 46(2),225e245.
Tanaka, J. W., & Sengco, J. A. (1997). Features and theirconfiguration in face recognition. Memory & Cognition, 25(5),583e592.
Thomas, J. P. (1985). Effect of static-noise and grating masks ondetection and identification of grating tar-gets. Journal of theOptical Society of America A, 2(9), 1586e1592.
Toet, A., & Levi, D. M. (1992). The two-dimensional shape of spatialinteractionzones in theparafovea.VisionResearch, 32, 1349e1357.
Treisman, A. M., & Gelade, G. (1980). A feature integration theoryof attention. Cognitive Psychology, 12, 97e136.
Vecera, S., & Behrmann, M. (1997). Spatial attention does notrequire preattentive grouping. Neuropsychology, 11, 30e43.
Warrington, E. K. (1985). Agnosia: The impairment of objectrecognition. In P. J. Vinken, G. W. Bruyn, & H. L. Klawans (Eds.),Handbook of clinical neurology. Amsterdam: Elsevier.
Warrington, E. K., & James, M. (1988). Visual apperceptiveagnosia: A clinical-anatomical study of three cases. Cortex,24, 13e32.
Warrington, E. K., & James, M. (1991). Visual object and spaceorientation battery (VOSP). Bury St Edmunds: Thames ValleyTest Company.
Warrington, E. K., & Taylor, A. M. (1973). The contribution ofthe right parietal lobe to object recognition. Cortex, 9,152e164.
Whitney, D., & Levi, D. M. (2011). Visual crowding: A fundamentallimit on conscious perception and object recognition. Trends inCognitive Sciences, 15(4), 160e168.
Wolpert, I. (1924). Die Simultanagnosie: St€orung derGesamtauffassung. Zeitschrift fur di gesamte Neurologie undPsychiatrie, 93, 397e415.
Woodhead, Z. V., Wise, R. J., Sereno, M., & Leech, R. (2011).Dissociation of sensitivity to spatial frequency in word andface preferential areas of the fusiform gyrus. Cerebral Cortex,21(10), 2307e2312.
Yong, K. X., Shakespeare, T. J., Cash, D., Henley, S. M.,Nicholas, J. M., Ridgway, G. R., et al. (2014). Prominent effectsand neural correlates of visual crowding in a neurodegenerativedisease population. Brain, 137, 3284e3299. http://dx.doi.org/10.1093/brain/awu293.