available listing inventory essex county, ma
TRANSCRIPT
Available Listing InventoryA Real Estate Forecast for Essex County
All of the following data is per MLS Property Information Network (MLSPIN) for SF & CC property types for the areas and time frames noted on each page.
Analysis by Siga Snipas & Ed Ridolfi
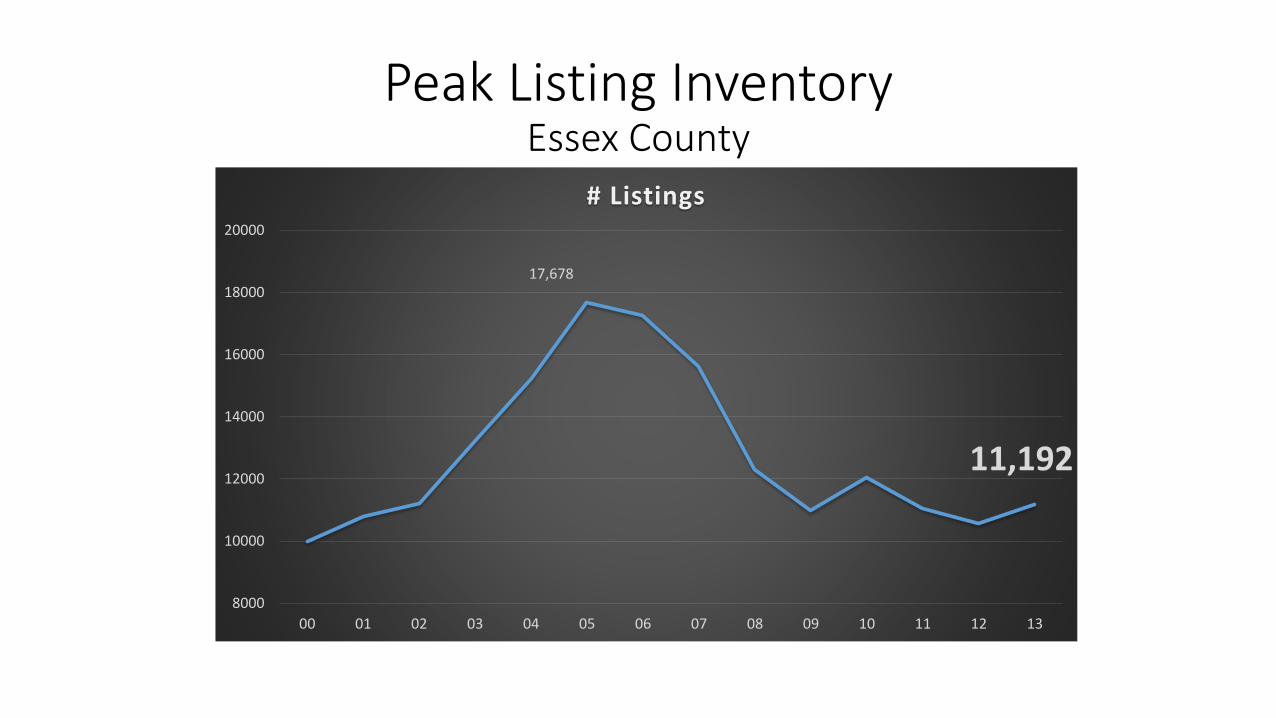
Peak Listing InventoryEssex County
17,678
11,192
8000
10000
12000
14000
16000
18000
20000
00 01 02 03 04 05 06 07 08 09 10 11 12 13
# Listings
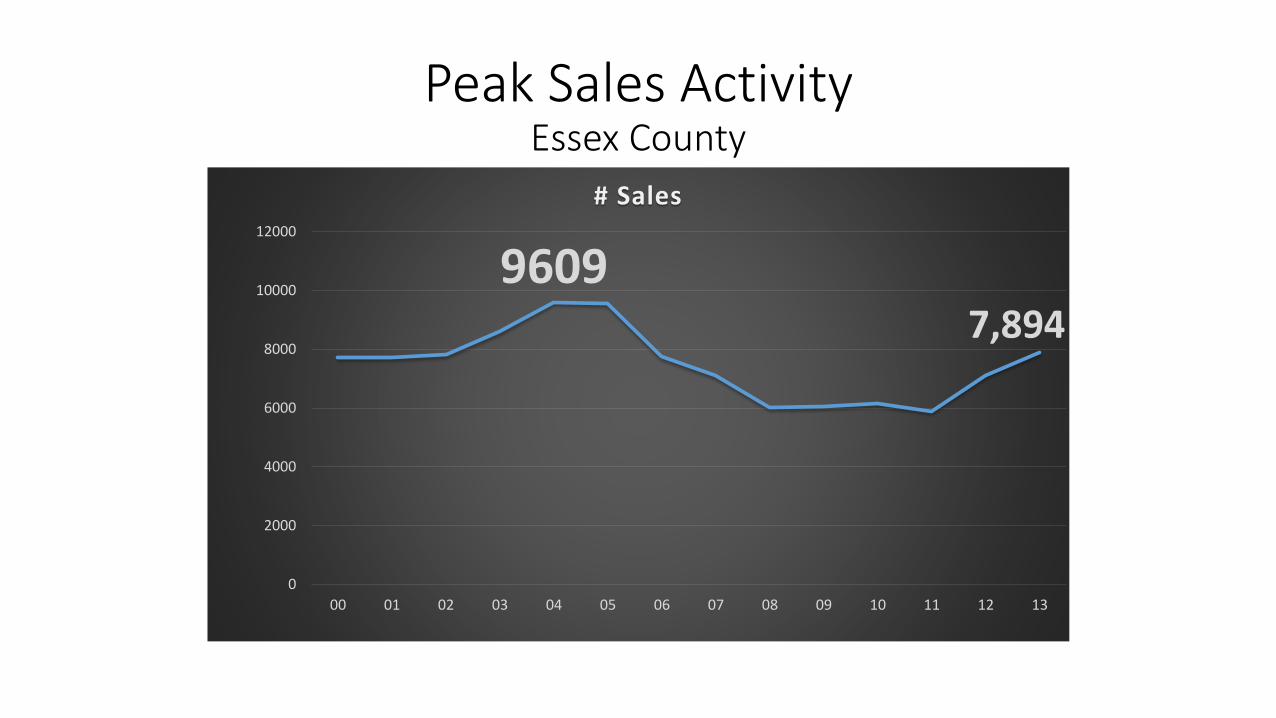
Peak Sales ActivityEssex County
96097,894
0
2000
4000
6000
8000
10000
12000
00 01 02 03 04 05 06 07 08 09 10 11 12 13
# Sales
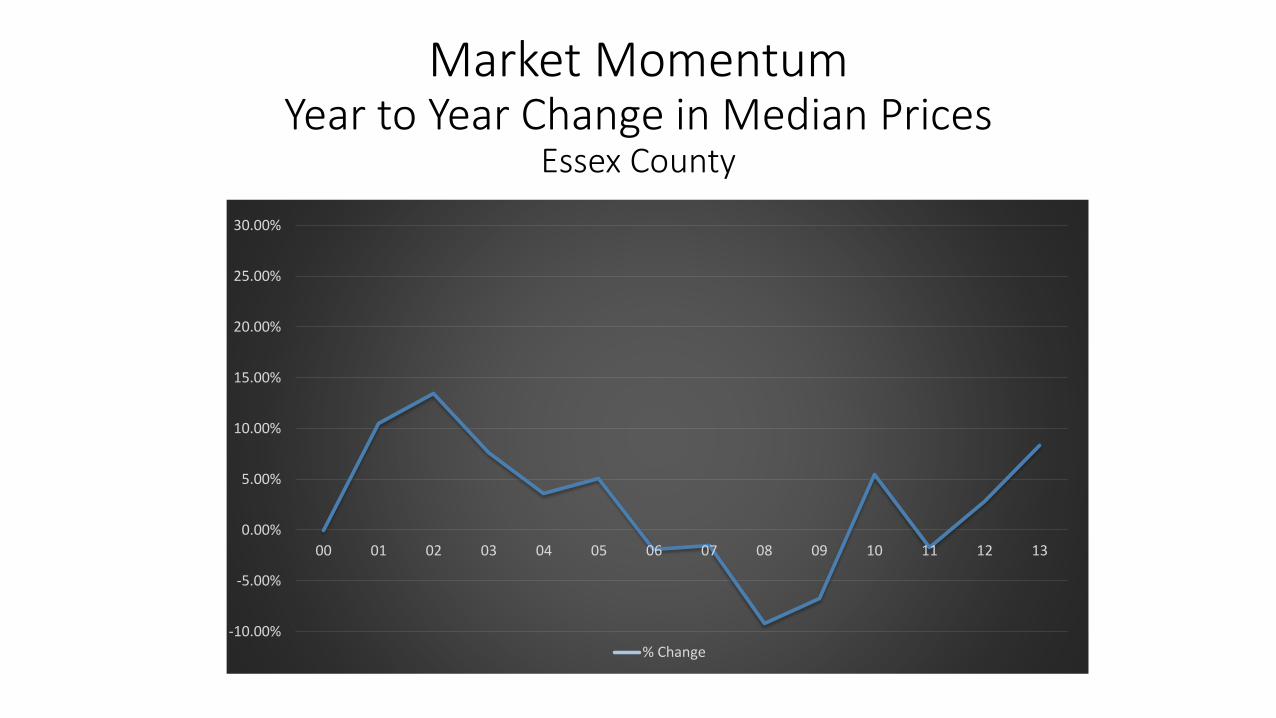
Market MomentumYear to Year Change in Median Prices
Essex County
-10.00%
-5.00%
0.00%
5.00%
10.00%
15.00%
20.00%
25.00%
30.00%
00 01 02 03 04 05 06 07 08 09 10 11 12 13
% Change
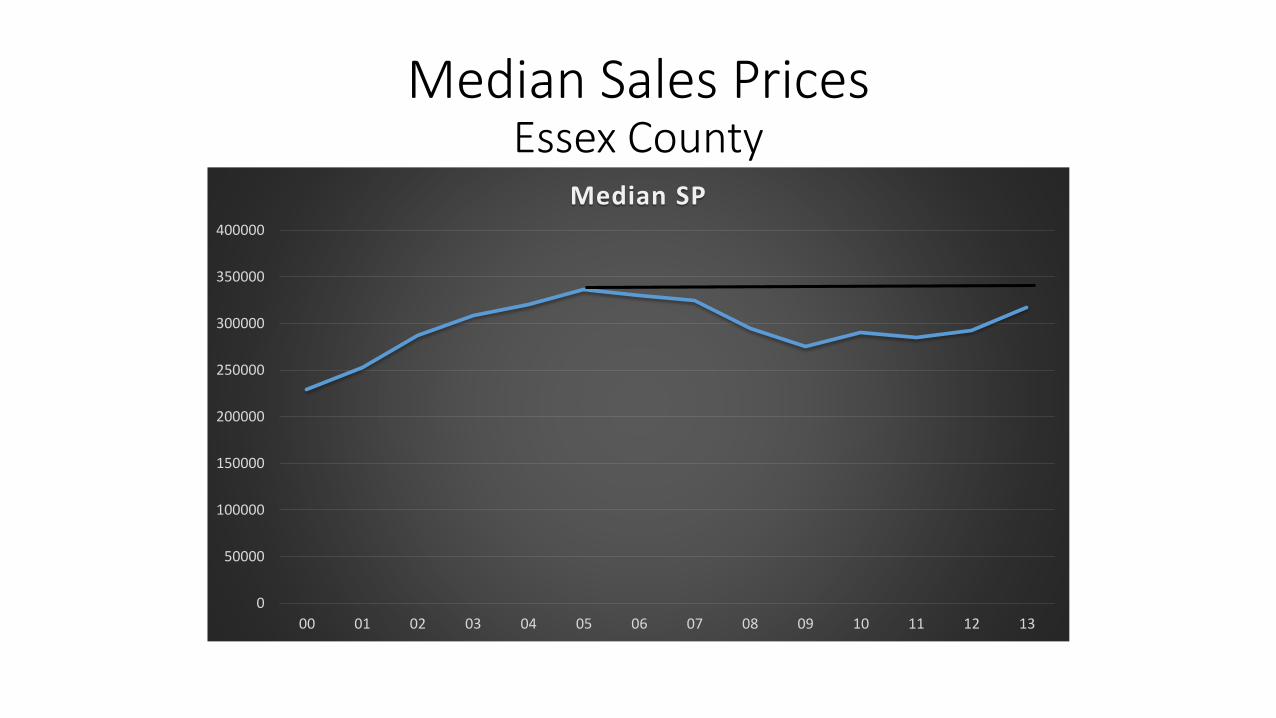
Median Sales PricesEssex County
0
50000
100000
150000
200000
250000
300000
350000
400000
00 01 02 03 04 05 06 07 08 09 10 11 12 13
Median SP
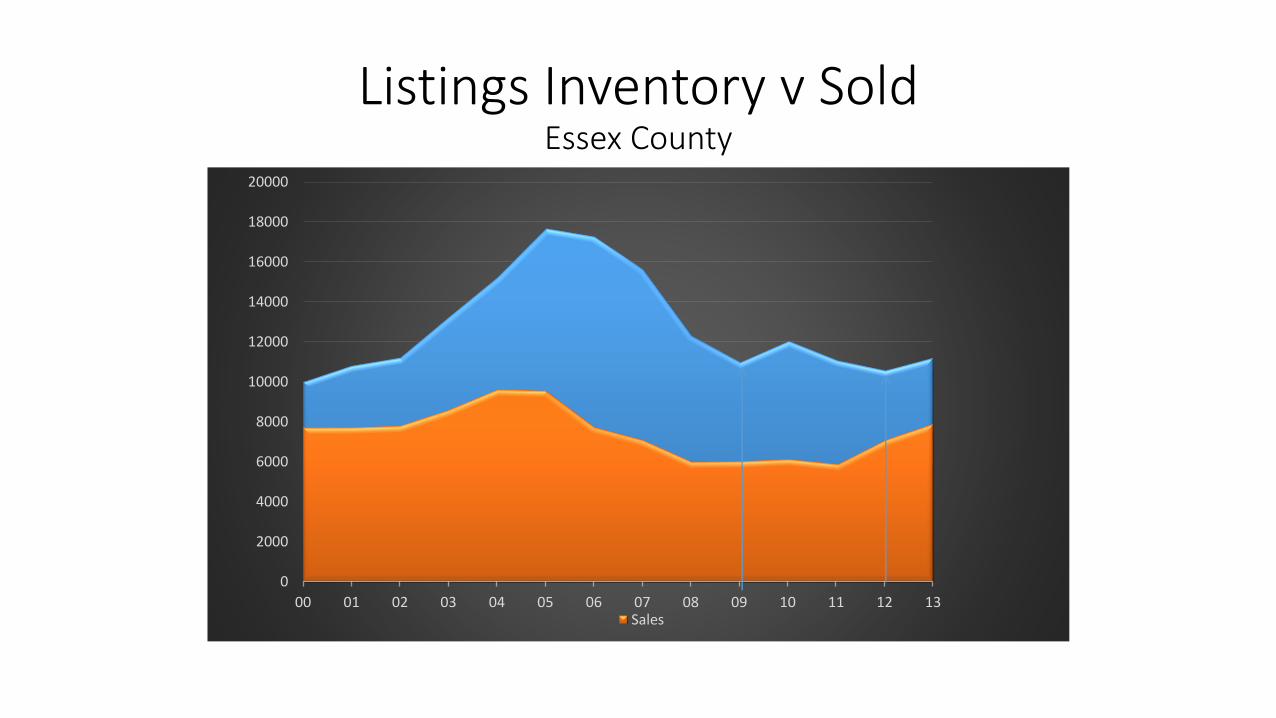
Listings Inventory v SoldEssex County
0
2000
4000
6000
8000
10000
12000
14000
16000
18000
20000
00 01 02 03 04 05 06 07 08 09 10 11 12 13Sales
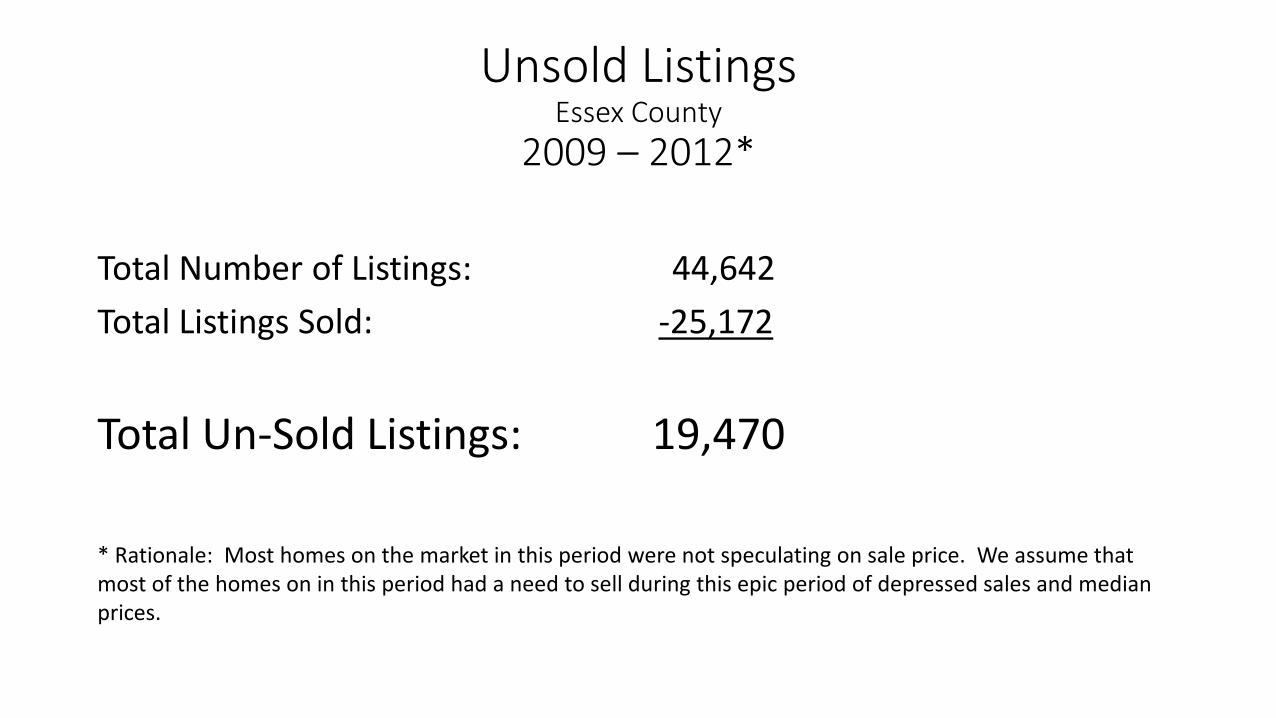
Unsold ListingsEssex County
2009 – 2012*
Total Number of Listings: 44,642
Total Listings Sold: -25,172
Total Un-Sold Listings: 19,470
* Rationale: Most homes on the market in this period were not speculating on sale price. We assume that most of the homes on in this period had a need to sell during this epic period of depressed sales and median prices.
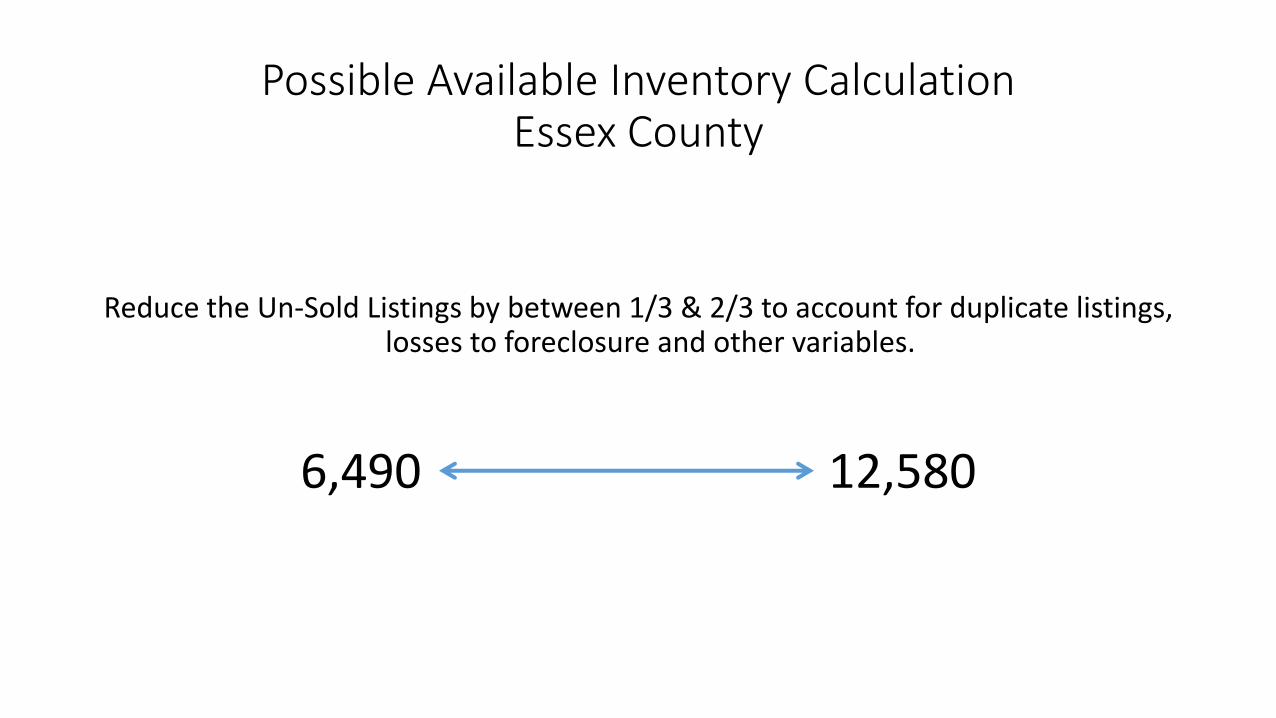
Possible Available Inventory CalculationEssex County
Reduce the Un-Sold Listings by between 1/3 & 2/3 to account for duplicate listings, losses to foreclosure and other variables.
6,490 12,580
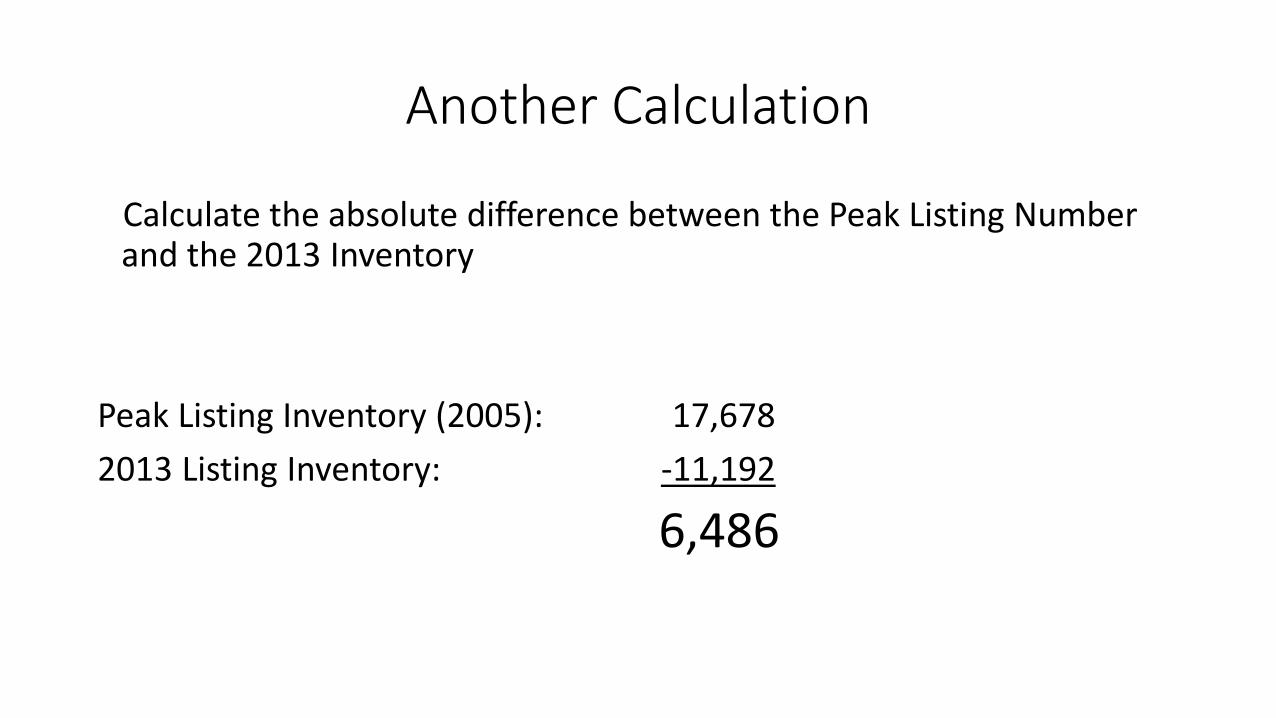
Another Calculation
Calculate the absolute difference between the Peak Listing Number and the 2013 Inventory
Peak Listing Inventory (2005): 17,678
2013 Listing Inventory: -11,192
6,486
Historical Increases in Listing InventoryEssex County
In the period 2003 – 2005, inventory increased an average of 16% per year or roughly 2,000 additional listings each year.
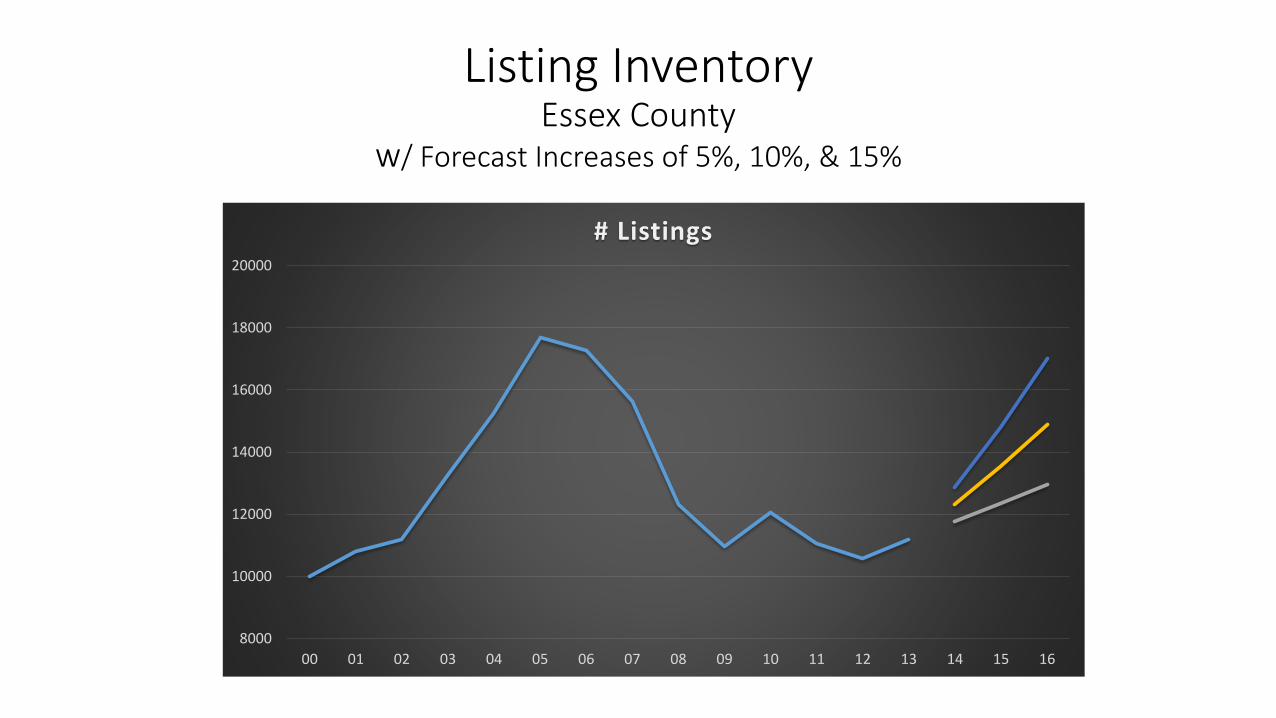
Listing InventoryEssex County
w/ Forecast Increases of 5%, 10%, & 15%
8000
10000
12000
14000
16000
18000
20000
00 01 02 03 04 05 06 07 08 09 10 11 12 13 14 15 16
# Listings

2014 -2016
The Next Big Market Upswing
?