availability and storage intelligence- what it can do...
TRANSCRIPT

Availability and Storage Intelligence-What it can do for you
Ros Schulman and John TicicHDS and IntelliMagic
Date of presentation (01/11/2016)Session LE

Methodology for Monitoring Mainframe
Performance

Characterize the Issue• Dimensions of performance measurement?
– Online Workloads▪ Throughput
– IOPs– MBS
▪ Response Time▪ Achieved by employing low resource utilization and minimal queuing
– Batch Workloads▪ Throughput
– IOPs– MBS
▪ Achieved by employing maximum resource utilization with moderate queuing• Optimizing utilization of a storage access resource for a batch workload and an online
workload are mutually exclusive.• Consequently, batch workloads and online workloads should generally not share
same storage access resource at same time.

Online Workload IO Profile
Metric Name Name in MAR Value Description NormalValue
BadValue As seen from
I/O Rate IOPS I/Os per second N/A Host View
Read Rate Disk Reads/sec I/Os per second N/A Host & Port View
Write Rate Disk Writes/sec I/Os per second N/A Host & Port View
Read Block Size Avg Disk Bytes/Read Bytes xfered per I/O operation 4k to 27k N/A Host View
Write Block Size Avg Disk Bytes/Write Bytes xfered per I/O operation 2k to 27k N/A Host View
Read Response Time Avg Disk Sec/Read Time required to complete a Read I/O (Millisecond) 1 to 10 > 10 Host & Port View
Write ResponseTime Avg Disk Sec/Write Time required to complete a
Write I/O (Millisecond) 1 to 3 > 3 Host & Port View
Metrics
§ Values shown in the Normal Value column are planning estimates.§ You should baseline your I/O profile when all systems are in a good and
normal running state.

• Minute-by-minute basis for Online workloads– High utilization in any minute is a point of concern.– Scope of concern:
▪ Immediate, likely to cause perceptible response time problems▪ Contingent, inadequate reserves to support processing during failures
• Average over time remaining in batch window for batch workloads– High utilization by itself is not cause for concern; it is a design goal.
▪ Maximizing utilization per resource maximizes throughput per resource, the optimization goal for batch processing.
▪ High response time is not cause for concern either. High response time is a natural consequence of high utilization levels and moderate queuing, the keys to maximizing throughput per resource.
– The key question:▪ Is there adequate capacity to complete processing within the batch window
even after a component failure?
Assessing Utilization Levels, Online or Batch

Design for Normal or Failure Operation
• Thresholds are being exceeded regularly.
• Corrective attention is recommended.
• Further load may cause severe degradation.
• Thresholds are being exceeded occasionally.
• Increased monitoring is appropriate.
• Bursts of load may cause noticeable performance degradation.
• Normal operation.• No thresholds are
being exceeded.• Ability to accommodate
bursts of load without noticeable impact.
Allow for Utilization during failure modes
Design/build for normal operation
50% 75%
Design/build for failure operation
Traffic Light System:
45%

Reporting Intervals• Most performance issues are analyzed using 1-
minute data intervals.– Performance problems requiring shorter interval
analysis are rare, but do occur.– Analysis of 1-minute interval data is generally limited
to 1 to 2 day durations.– Short intervals avoid muting peaks by averaging.
• Longer 15 minute intervals are mostly useful for workload cycle and trend analysis.

• Utilization = percent busy or occupied.• Most storage performance problems are attributable to
excessive storage resource utilization.– High MPB utilization– High Front End Port Utilization– High Write Pending (high back end utilization)– High Array Group utilization
• Storage resource throughput, utilization, and response time are reported by:– Mainframe Analytics Recorder (MAR)– SVP Performance Monitor (Export)– Tuning Manager
Assess Storage Resource Utilization

• Front end port utilization– Work to balance a system or predict new loads.– High microprocessor utilization is an unambiguous
indication of high port utilization. – Low microprocessor utilization is not by itself a
definitive indication of low port utilization. – When port microprocessor utilization is low,
throughput in MB/s must also be examined before concluding that port utilization is low.
– Throughput constraints for small block I/O traffic typically manifest themselves as high microprocessor utilization.
Front End Port Utilization

• For Online workloads– 30% during normal operations for HDD
• SSD/FMD you can go up to 80%– Utilization reserve required to accommodate failure
• For Batch workloads– As high as possible, because batch metric is normally Elapsed Time– Expected maximums of 70%-80%
• Depends on the burst profile of initiator– Average utilization over time remaining in batch window should not exceed
50%
Maximum Recommended Array Group Utilization

• Response time– This threshold depends on the application needs and
the Service Level Agreement (SLA) for the application.
– Since the Logical Unit (LU) Response Time has a direct impact on applications, this indicator should be monitored on key LUs to determine deltas as loads increase.
• Watch out for worst performing LUs– Use a performance monitor to look at worst
performance LUs by correlating to VOLSERs.
Response Time Monitoring

Benefits and Use cases

• Think of Medicine before Radiology– Choose your medicine
Why do you need DASD internal metrics?

Stg Analytics: X-Ray for your Storage

• All the data produced in these slides is captured with MXG
• Uses the MXG member standards– TYPEMAR– VMACMAR– EXMARnn
Capture Data with MXG
/* COPYRIGHT (C) 2015 BY MERRILL CONSULTANTS DALLAS TEXAS *//*********MEMBER=TYPEMAR*************************************/%INCLUDE SOURCLIB(VMACSMF,VMACMAR,IMACKEEP);DATA_VARMAR_SMF_CDEMAR

• RMF does not go away– Still provides the host
view of performance– 15 minute intervals can
smooth out extremes and variance
– Activity does not usually happen on a quarter hour boundary
Drilling Deep – MRI for your DASD

• RMF 15 minutes with MAR 1 minute– Not all sites can reduce
RMF to 1 minute intervals– MAR interval can be
shorter than RMF– You can still find problems
below the surface like an MRI
Drilling Deep – MRI for your DASD

What are the overheads?• The observer effect
– Did it changed because I looked?

A Tuning ExampleWhere RMF is not enough

• Barry Merrill (MXG) taught the value of the scatter plot
• There are many observations of volumes with excessive response time at medium IO Rates
A performance problem is diagnosed with RMF

• The anomaly is paralleled by Average Pend Time
• All the usual suspects eliminated– Channel MP Usage– Open Exchanges
• Next candidate – MPB % busy
A performance problem is diagnosed with RMF

• 95th percentile of all intervals is greater than 10ms
• Assume that this identifies volumes with the most frequent incidence of high pending time
Identify the volumes significant pend time

Now we start the X-Ray

• Use Device Number and Volser to tie RMF and internal stats together
• Identify that all high Pend time volumes are using the same MPB
What are the MPB used by these volumes

• MPB 3 is frequently overused
• Other MPB, except 0 have spare capacity
• Solution – reassign the high pend LDEV to other MPB– Assume a correlation
with high pend and MPB usage
Identify the volumes significant pend time

So how good was the treatment

• Tuning and optimization that RMF cannot provide• Statistics based on the Storage architecture• Cache, Channel Ports, CLPR, PG, HDP/HDP
activity• Capacity Planning
– Track MPB usage trends– Preventative tuning– Improve JIT upgrades
Radiotherapy for DASD

Building on RMFLet’s look at RMF data and see how additional MAR data can help us understand and investigate performance issues.

Building on RMF
RMF has very useful performance and configuration data, but we sometimes have the need to supplement what is available with vendor specific data.
Let’s look at some examples.
Sample charts shown using IntelliMagic Vision.

Response TimeBased on RMF Data – The Host View
A critical metric for application performance.Good performance, but we need other metrics to judge this.

Other Critical MetricsBased on RMF Data – The Host View
All critical to judging performance and potentially understand Disk utilization.But what is it like under the convers?
I/O Rate
Throughput MB/s

Back-end Drive Rate (ops/s)Based on RMF Data – The Disk View
Yes, RMF will show us disk internal activity.We can use the Rank statistics (SMF 74.8) to see I/O activity at the internal disk
level.
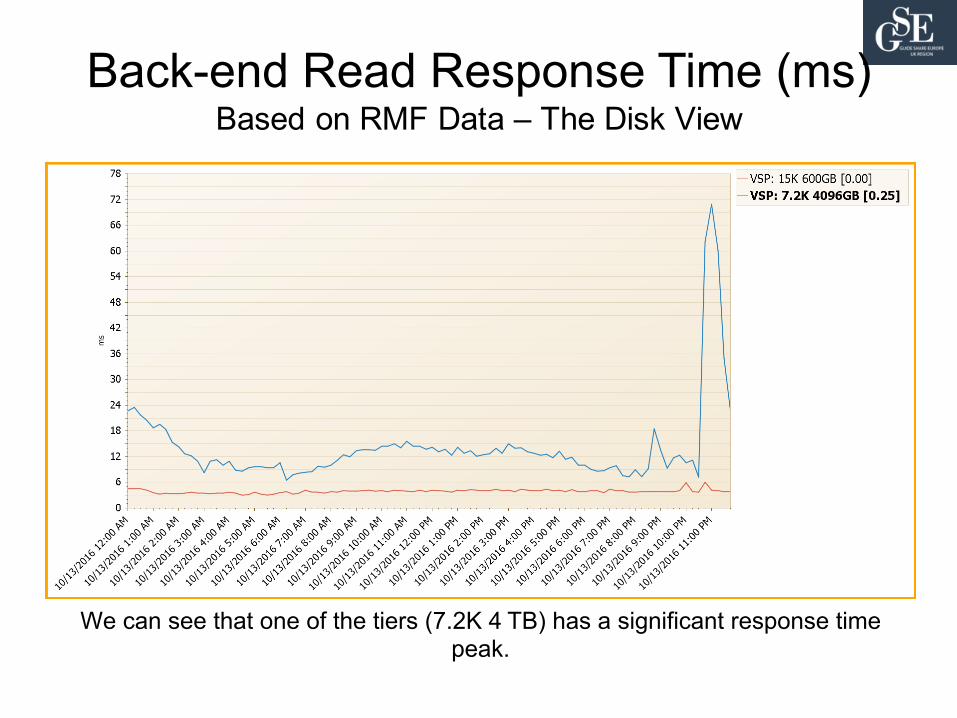
Back-end Read Response Time (ms) Based on RMF Data – The Disk View
We can see that one of the tiers (7.2K 4 TB) has a significant response time peak.

Response time for Reads from RAID Group Based on RMF Data – The Disk View
We can go deeper and get to the individual ranks (parity groups).But we don’t have detailed internal data to see other components.

MAR DataHDS VSP-G1000 Internal Metrics
A HDS user SMF record can be generated that contains internal performance data that can aid in investigating disk related problems.
Currently available and reported in IntelliMagic Vision are:

MAR DataHDS VSP-G1000 Internal Metrics
Logical Device (LDEV)
MPB
CLPR
Parity Groups
Ports

MAR DataIntelliMagic VIsion

MP Activity and Utilization Levels Based on HDS MAR Data – The Internal View
We see that one MPB is lightly over utilized.
We are only looking at a single HDS VSP-G1000.

Overall MP Utilization (%) Based on HDS MAR Data – The Internal View
The MPB is not highly utilized, but we see where the peaks are.Note: The thresholds are set by IntelliMagic and are changeable by the user.

MP Utilization by Activity (%)Based on HDS MAR Data – The Internal View
We can see the different MP utilization (only looking at MPB 1MB).Back-end Disk is higher at this time, but the main component is z/OS FICON
activity.
This corresponds to our RMF back-end disk peak.

MP Utilization by Activity (%)Based on HDS MAR Data – The Internal View
We see the effect that the back-end disk activity has on the MPB (utilization), but we also see that FICON activity is the major component driving the MPB utilization.
When there are MPB related problems, we can investigate and take specific action:E.g. Rebalance the FICON port distribution or activity
Here are some other sample charts:

Response Time for Destaging Operations per Track Destaged (ms)
Based on HDS MAR Data – The Internal View
Time to destage tracks from cache.
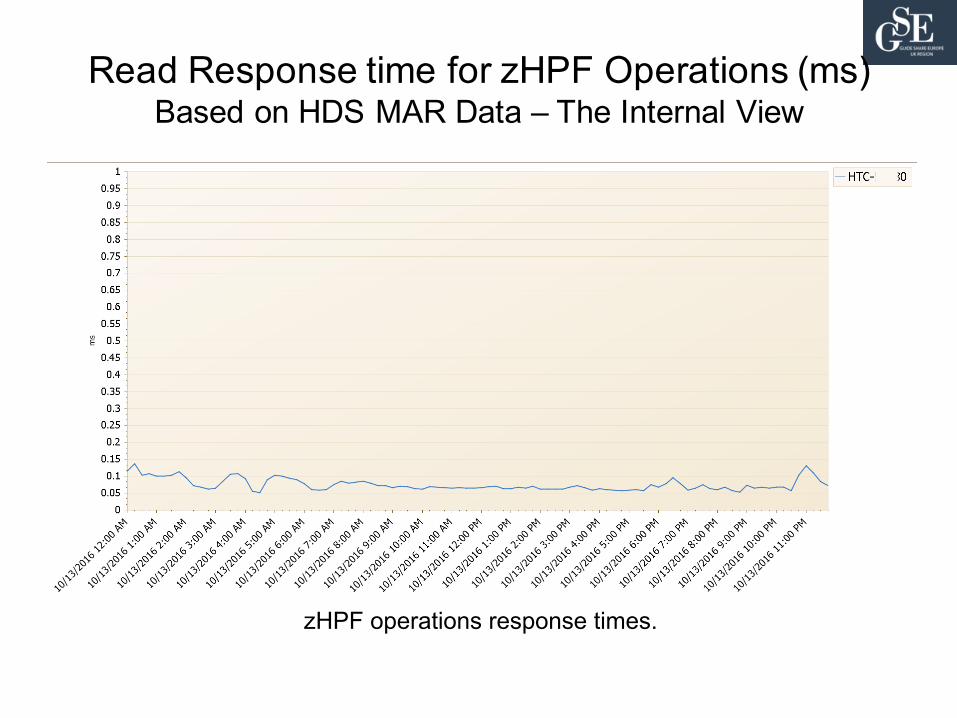
Read Response time for zHPF Operations (ms) Based on HDS MAR Data – The Internal View
zHPF operations response times.

Cache usage for Write Pending (%) Based on HDS MAR Data – The Internal View
Percentage of cache used for Write pending.

• Locate and define the metrics to be collected prior to monitoring storage systems for performance
• Identify the data to be used when planning for capacity growth and performance
• Configure system for performance while maintaining customer's requirements for Online and Batch Applications
• Apply concepts of Workload Profiles• Identify key areas to check and monitor when planning
for Mainframe scalability and capacity• Need to look at both Host and Back End Metrics
Summary

Session feedback
• Please submit your feedback at
http://conferences.gse.org.uk/2016/feedback/LE
• Session is LE