auvs and rovsauvs and rovs – global market prospects · auvs and rovsauvs and rovs – global...
TRANSCRIPT
AUVs and ROVsAUVs and ROVs ––AUVs and ROVs AUVs and ROVs
Global Market ProspectsGlobal Market Prospectspp
Paul NewmanPaul Newman
John WestwoodJohn Westwood
UUV OI London
1UUV OI, London13 Mar 2012
UUV OI London13 Mar 2012
www.dw‐1.com
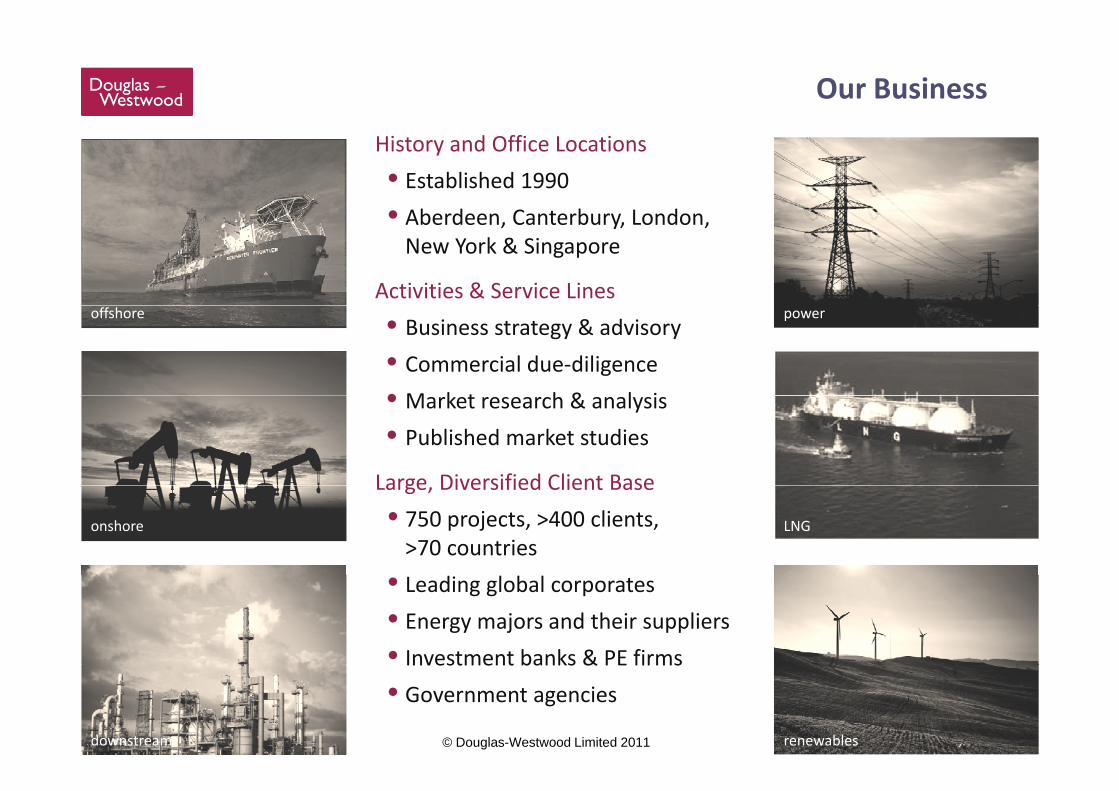
Our Business
History and Office Locations• Established 1990• Aberdeen Canterbury London• Aberdeen, Canterbury, London, New York & Singapore
Activities & Service Linesoffshore power• Business strategy & advisory
• Commercial due‐diligence• M k t h & l i• Market research & analysis• Published market studies
Large Diversified Client Base
LNGonshore LNG
Large, Diversified Client Base• 750 projects, >400 clients, >70 countries
• Leading global corporates• Energy majors and their suppliers• Investment banks & PE firms
2UUV OI, London13 Mar 2012downstream renewables
Investment banks & PE firms• Government agencies
© Douglas-Westwood Limited 2011
3UUV OI, London13 Mar 2012
4UUV OI, London13 Mar 2012

From man to machine
Market drivers
Work class ROVs
AUVs
C l iConclusions
5UUV OI, London13 Mar 2012
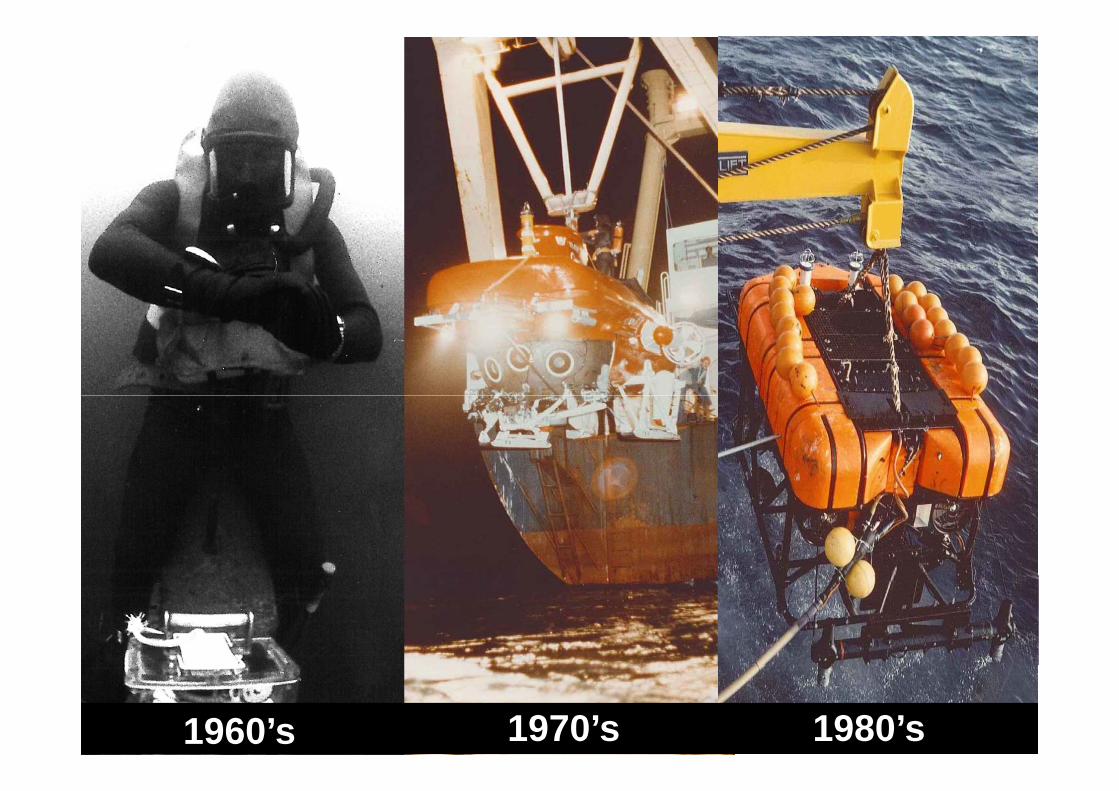
From man to machine
•Offshore•Offshore
6UUV OI, London13 Mar 2012 61960’s 1970’s 1980’s
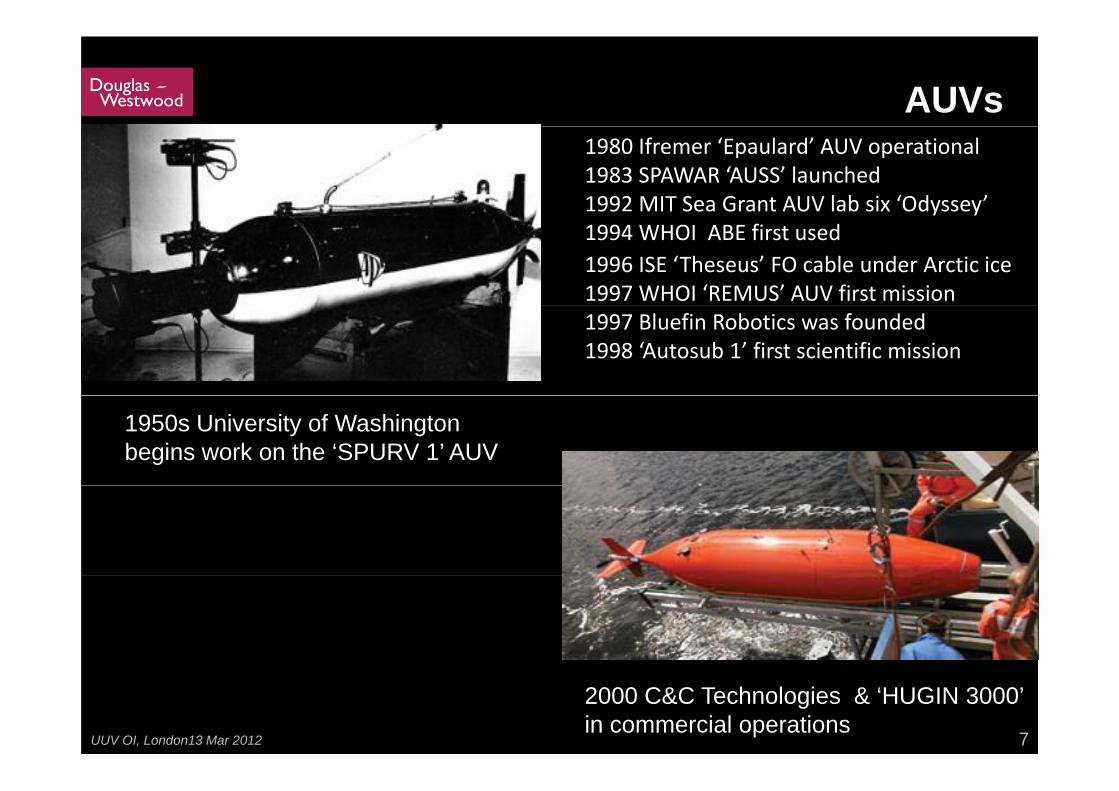
AUVs1980 Ifremer ‘Epaulard’ AUV operational1983 SPAWAR ‘AUSS’ launched1992 MIT Sea Grant AUV lab six ‘Odyssey’1994 WHOI ABE first used1996 ISE ‘Theseus’ FO cable under Arctic ice 1997 WHOI ‘REMUS’ AUV first mission1997 Bluefin Robotics was founded 1998 ‘Autosub 1’ first scientific mission
1950s University of Washington begins work on the ‘SPURV 1’ AUV
7UUV OI, London13 Mar 2012
2000 C&C Technologies & ‘HUGIN 3000’ in commercial operations
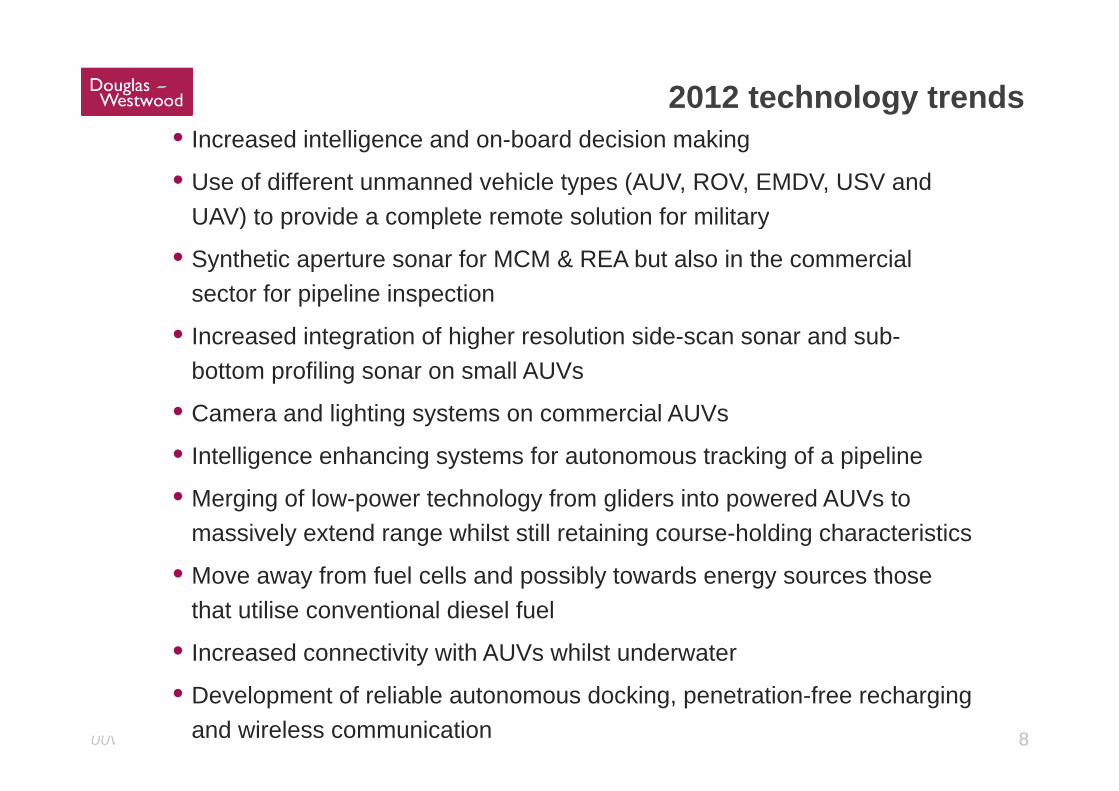
2012 technology trends• Increased intelligence and on-board decision making
• Use of different unmanned vehicle types (AUV, ROV, EMDV, USV and UAV) to provide a complete remote solution for militaryUAV) to provide a complete remote solution for military
• Synthetic aperture sonar for MCM & REA but also in the commercial sector for pipeline inspectionp p p
• Increased integration of higher resolution side-scan sonar and sub-bottom profiling sonar on small AUVs
• Camera and lighting systems on commercial AUVs
• Intelligence enhancing systems for autonomous tracking of a pipeline
• Merging of low-power technology from gliders into powered AUVs to massively extend range whilst still retaining course-holding characteristics
• Move away from fuel cells and possibly towards energy sources those• Move away from fuel cells and possibly towards energy sources those that utilise conventional diesel fuel
• Increased connectivity with AUVs whilst underwater
8UUV OI, London13 Mar 2012
y
• Development of reliable autonomous docking, penetration-free recharging and wireless communication
From man to machine
Market drivers
Work class ROVs
AUVs
C l iConclusions
9UUV OI, London13 Mar 2012
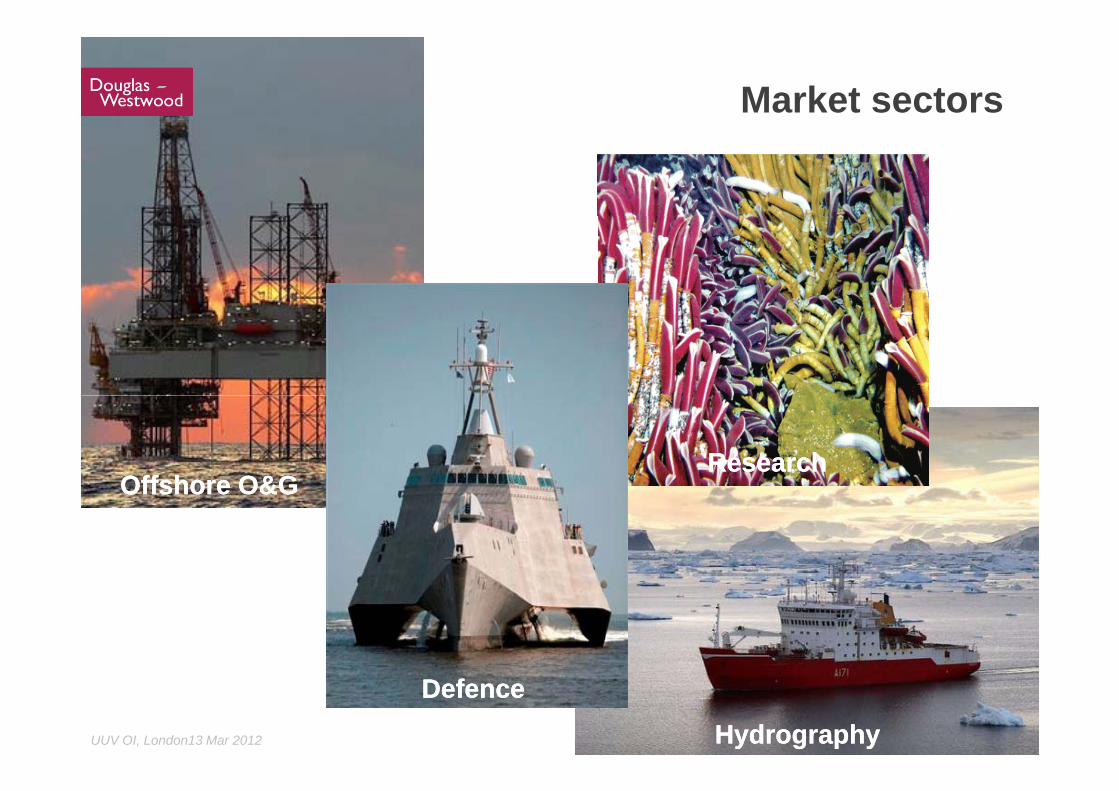
Three key marketsMarket sectors
Offshore O&GOffshore O&GResearchResearch
Offshore O&GOffshore O&G
10UUV OI, London13 Mar 2012
DefenceDefenceHydrographyHydrography
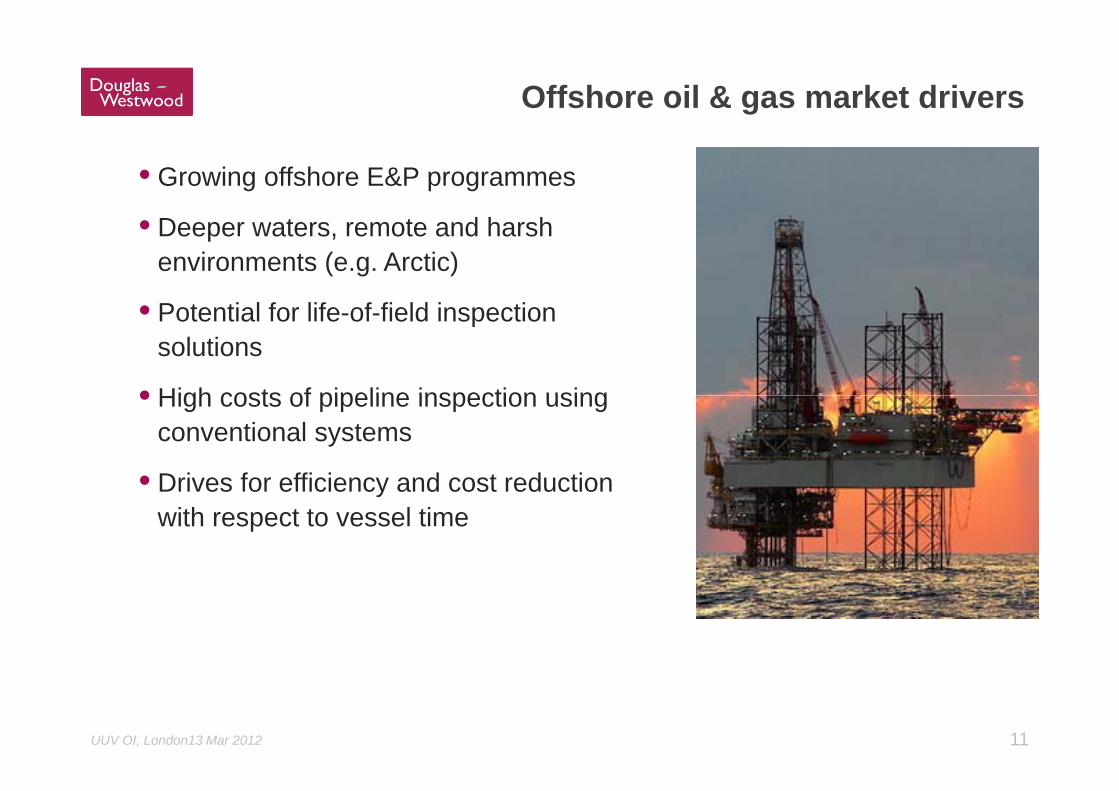
Offshore oil & gas market drivers
• Growing offshore E&P programmes
• Deeper waters, remote and harsh environments (e.g. Arctic)
• P t ti l f lif f fi ld i ti• Potential for life-of-field inspection solutions
• High costs of pipeline inspection using• High costs of pipeline inspection using conventional systems
• Drives for efficiency and cost reductionDrives for efficiency and cost reduction with respect to vessel time
11UUV OI, London13 Mar 2012
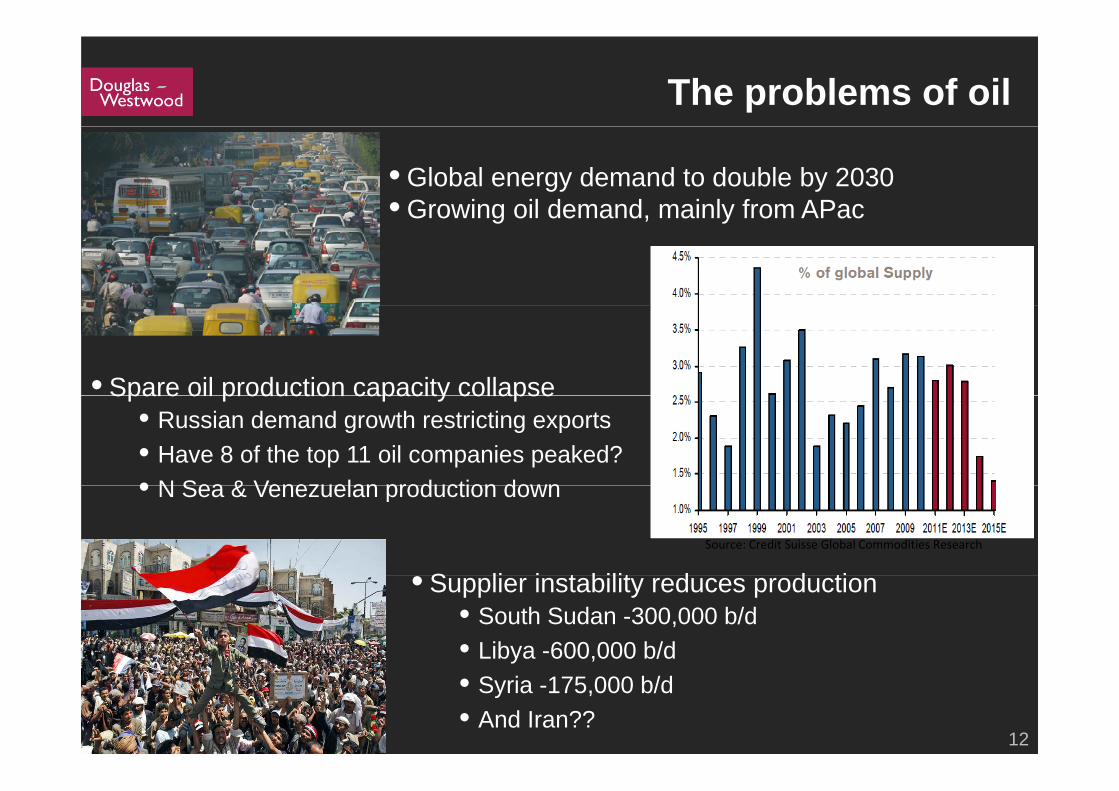
The problems of oil
• Global energy demand to double by 2030• Growing oil demand, mainly from APacGrowing oil demand, mainly from APac
• Spare oil production capacity collapseSpare oil production capacity collapse• Russian demand growth restricting exports• Have 8 of the top 11 oil companies peaked?• N Sea & Venezuelan production down• N Sea & Venezuelan production down
S li i t bilit d d tiSource: Credit Suisse Global Commodities Research
• Supplier instability reduces production• South Sudan -300,000 b/d• Libya -600,000 b/d
12UUV OI, London13 Mar 2012
• Syria -175,000 b/d• And Iran??
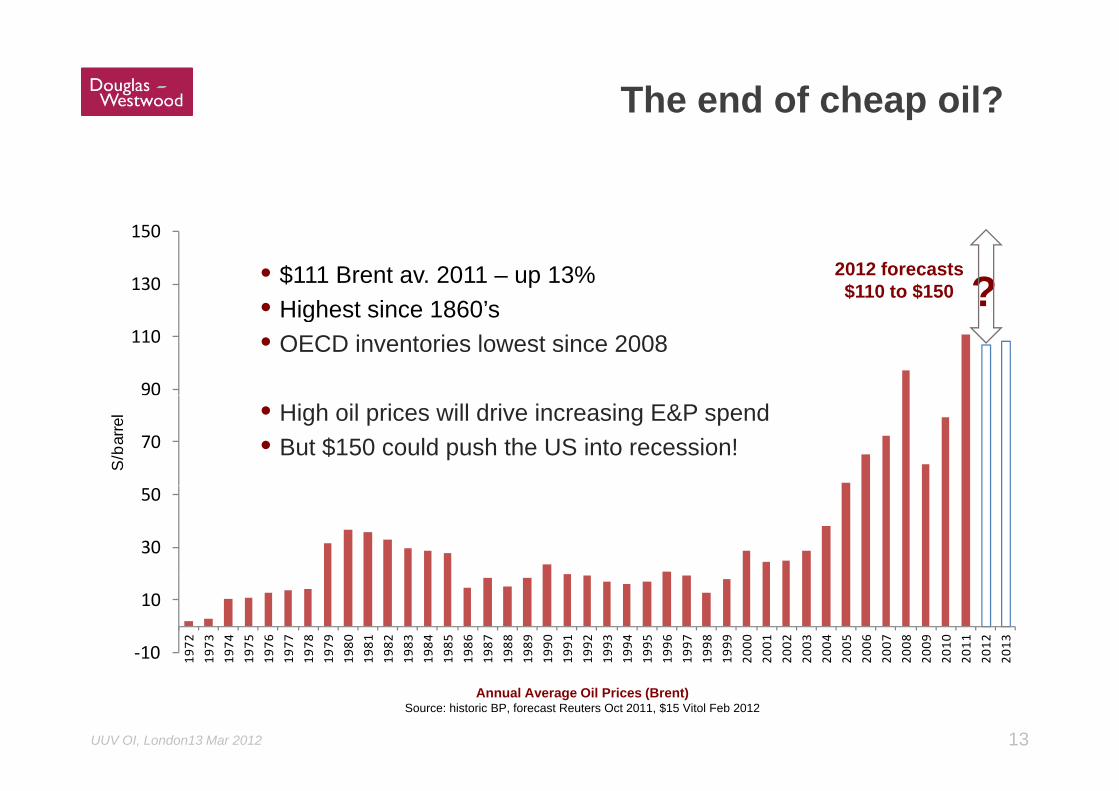
The end of cheap oil?
130
150
• $111 Brent av. 2011 – up 13%• Highest since 1860’s ?
2012 forecasts$110 to $150
90
110• Highest since 1860 s• OECD inventories lowest since 2008
?
70
S/b
arre
l • High oil prices will drive increasing E&P spend• But $150 could push the US into recession!
30
50
‐10
10
1972
1973
1974
1975
1976
1977
1978
1979
1980
1981
1982
1983
1984
1985
1986
1987
1988
1989
1990
1991
1992
1993
1994
1995
1996
1997
1998
1999
2000
2001
2002
2003
2004
2005
2006
2007
2008
2009
2010
2011
2012
2013
13UUV OI, London13 Mar 2012
Annual Average Oil Prices (Brent) Source: historic BP, forecast Reuters Oct 2011, $15 Vitol Feb 2012
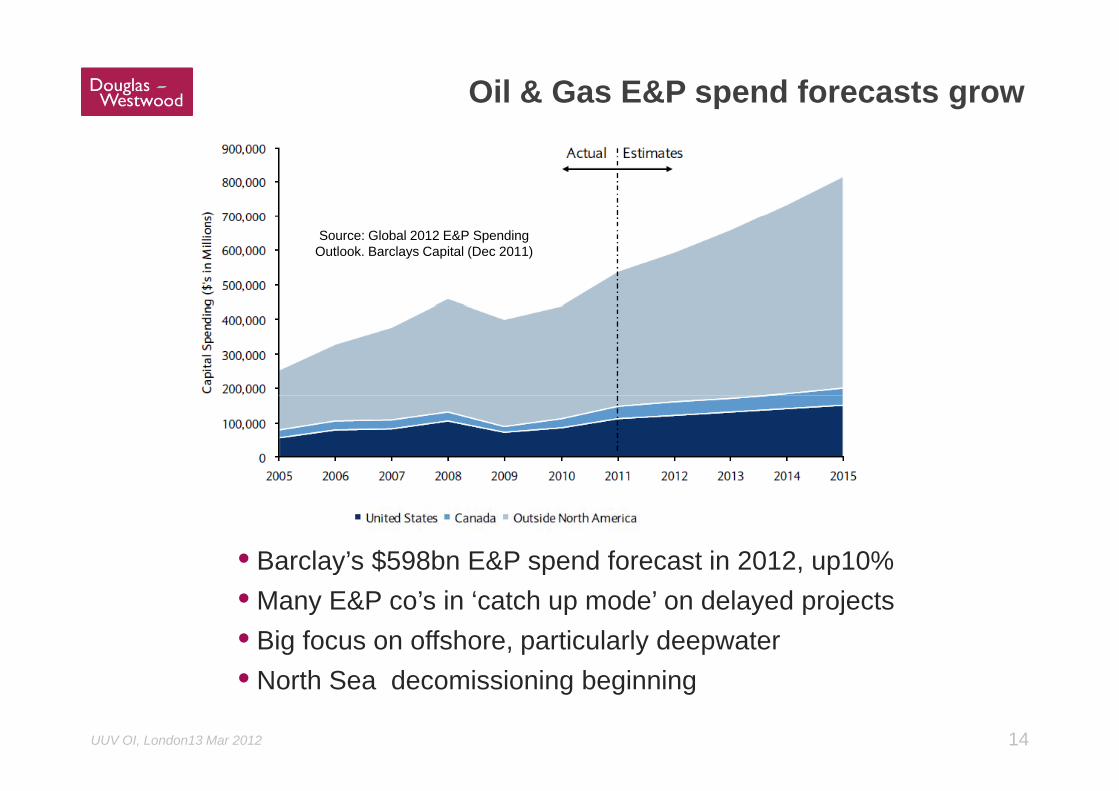
Oil & Gas E&P spend forecasts grow
Source: Global 2012 E&P Spending Outlook. Barclays Capital (Dec 2011)
• Barclay’s $598bn E&P spend forecast in 2012, up10%y• Many E&P co’s in ‘catch up mode’ on delayed projects• Big focus on offshore, particularly deepwater
14UUV OI, London13 Mar 2012
• North Sea decomissioning beginning
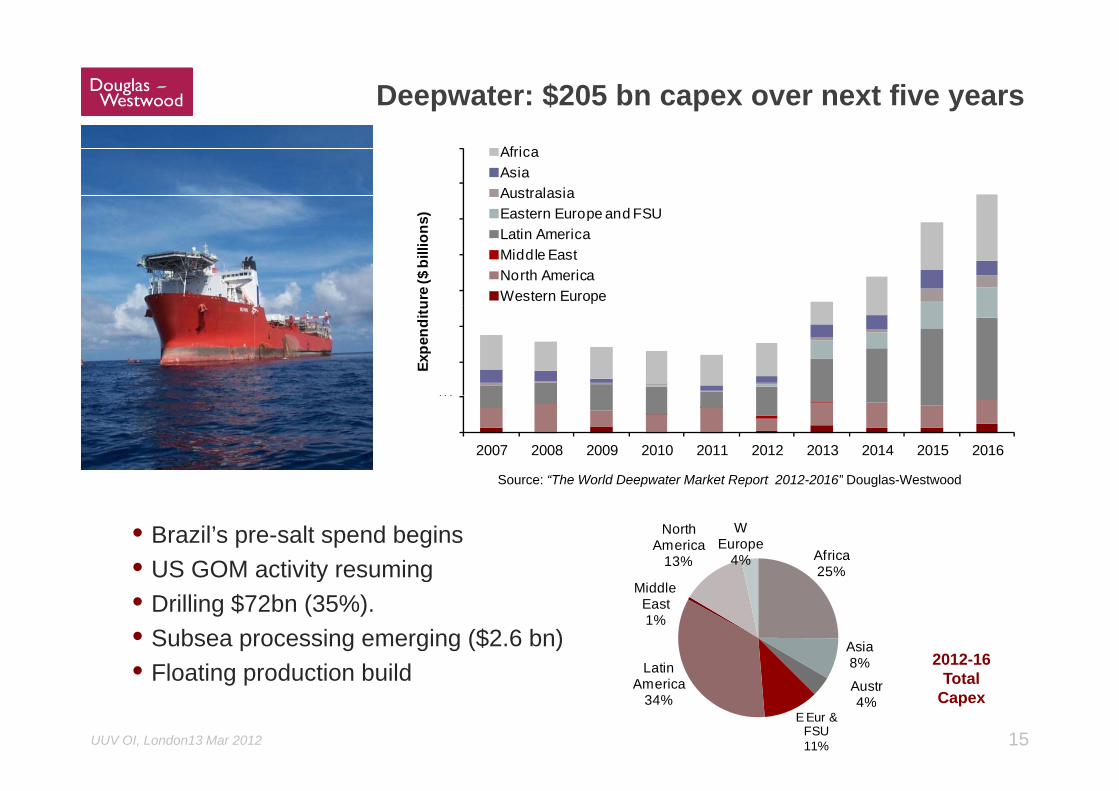
Deepwater: $205 bn capex over next five years
60
70
80
)
AfricaAsiaAustralasiaEastern Europe and FSU
40
50
60
ure
($ b
illio
ns
Eastern Europe and FSULatin AmericaMiddle EastNorth AmericaWestern Europe
10
20
30
Expe
nditu
Source: “The World Deepwater Market Report 2012-2016” Douglas-Westwood
0
10
2007 2008 2009 2010 2011 2012 2013 2014 2015 2016
p p g
Africa25%
North America
13%
W Europe
4%• Brazil’s pre-salt spend begins• US GOM activity resuming
2012-16
25%
Asia8%L ti
Middle East1%
US GOM activity resuming• Drilling $72bn (35%). • Subsea processing emerging ($2.6 bn)
Fl ti d ti b ild
15UUV OI, London13 Mar 2012
Total Capex
8%
Austr4%
E Eur & FSU11%
Latin America
34%
• Floating production build
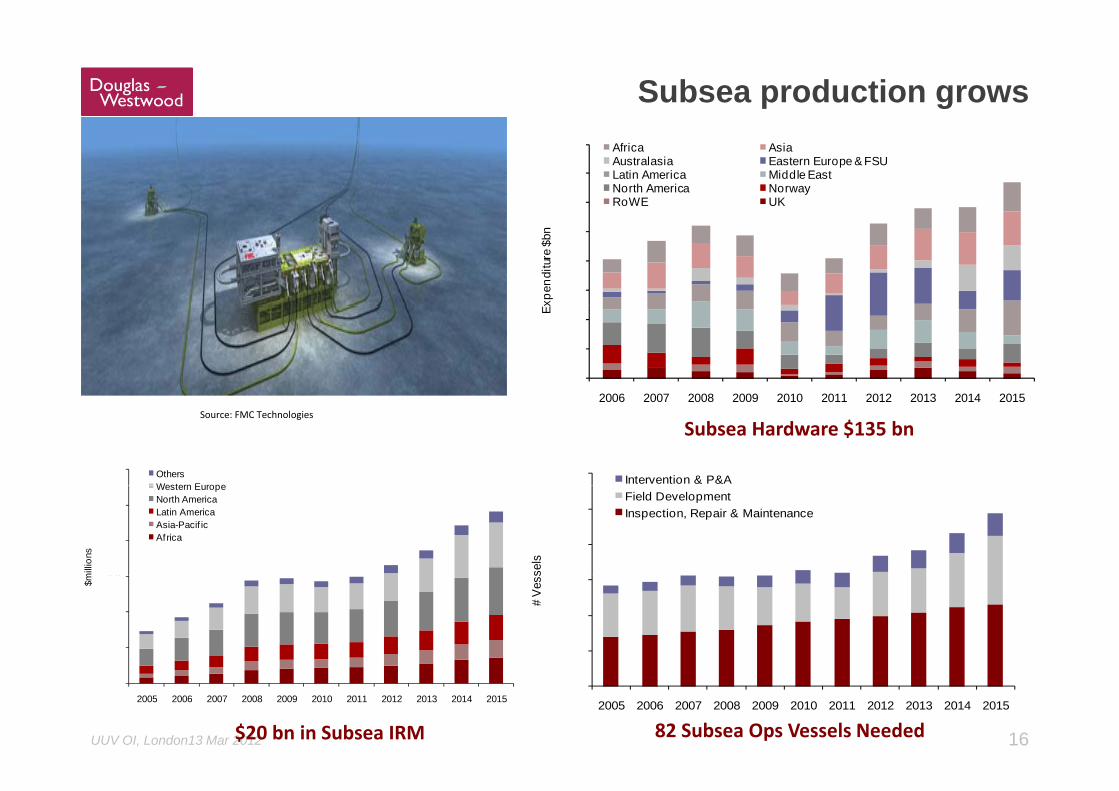
Subsea production grows
$30
$35
$40 Africa AsiaAustralasia Eastern Europe & FSULatin America Middle EastNorth America NorwayRoWE UK
$15
$20
$25
xpen
ditu
re $
bn
$0
$5
$10
2006 2007 2008 2009 2010 2011 2012 2013 2014 2015
Ex
2006 2007 2008 2009 2010 2011 2012 2013 2014 2015Source: FMC Technologies
Subsea Hardware $135 bn
300 Intervention & P&A6.0 Others
Western Europe
200
250
sels
Field DevelopmentInspection, Repair & Maintenance
3 0
4.0
5.0
mill
ions
Western EuropeNorth AmericaLatin AmericaAsia-Pacif icAfrica
50
100
150
# Ve
ss
1.0
2.0
3.0$m
16UUV OI, London13 Mar 2012
-2005 2006 2007 2008 2009 2010 2011 2012 2013 2014 2015
82 Subsea Ops Vessels Needed
0.02005 2006 2007 2008 2009 2010 2011 2012 2013 2014 2015
$20 bn in Subsea IRM
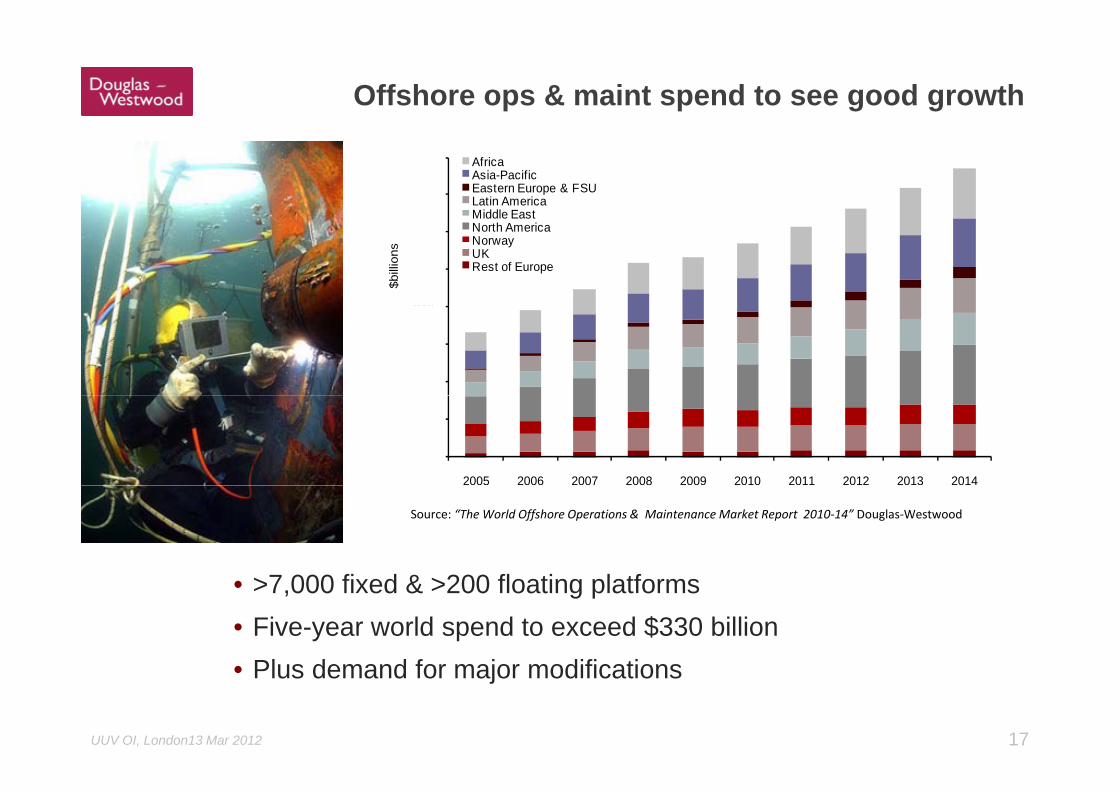
Offshore ops & maint spend to see good growth
$70
$80 AfricaAsia-PacificEastern Europe & FSULatin AmericaMiddle East
$40
$50
$60
$bill
ions
Middle EastNorth AmericaNorwayUKRest of Europe
$20
$30
$40
$0
$10
2005 2006 2007 2008 2009 2010 2011 2012 2013 2014
Source: “The World Offshore Operations & Maintenance Market Report 2010‐14” Douglas‐Westwood
7 000 fi d & 200 fl ti l tf• >7,000 fixed & >200 floating platforms• Five-year world spend to exceed $330 billion
Plus demand for major modifications
17UUV OI, London13 Mar 2012
• Plus demand for major modifications
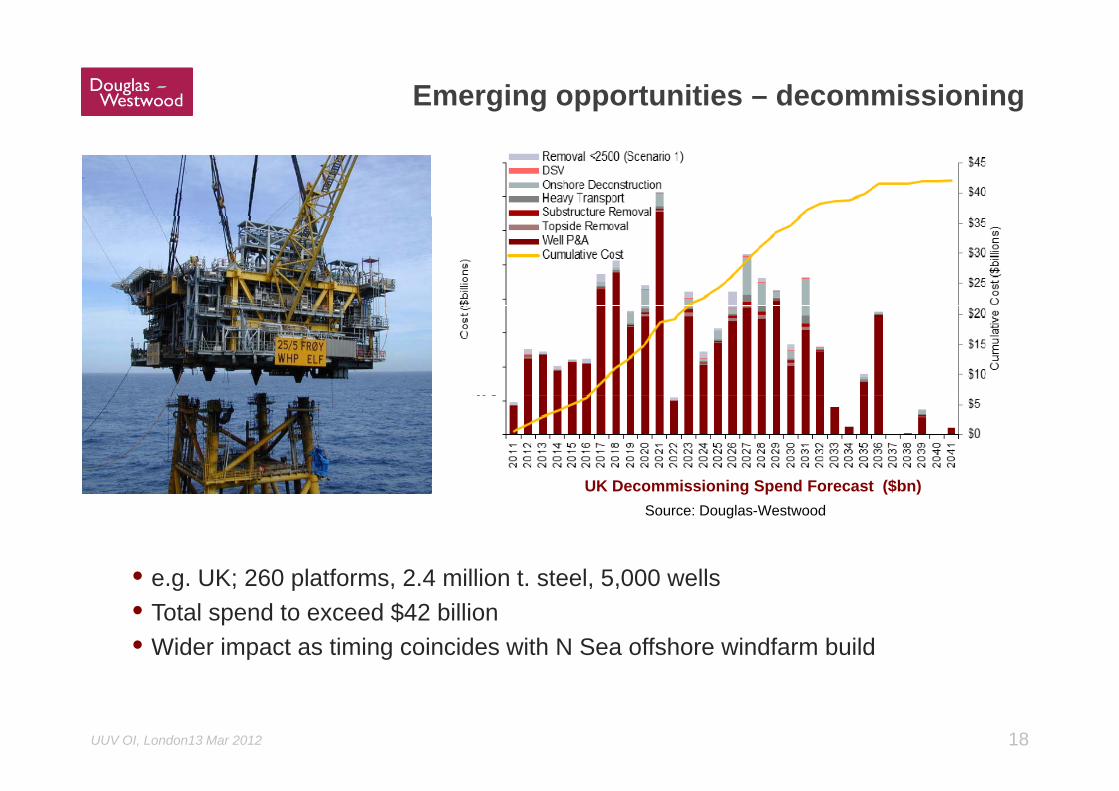
Emerging opportunities – decommissioning
UK Decommissioning Spend Forecast ($bn)
• e g UK; 260 platforms 2 4 million t steel 5 000 wells
Source: Douglas-WestwoodUK Decommissioning Spend Forecast ($bn)
• e.g. UK; 260 platforms, 2.4 million t. steel, 5,000 wells• Total spend to exceed $42 billion• Wider impact as timing coincides with N Sea offshore windfarm build
18UUV OI, London13 Mar 2012
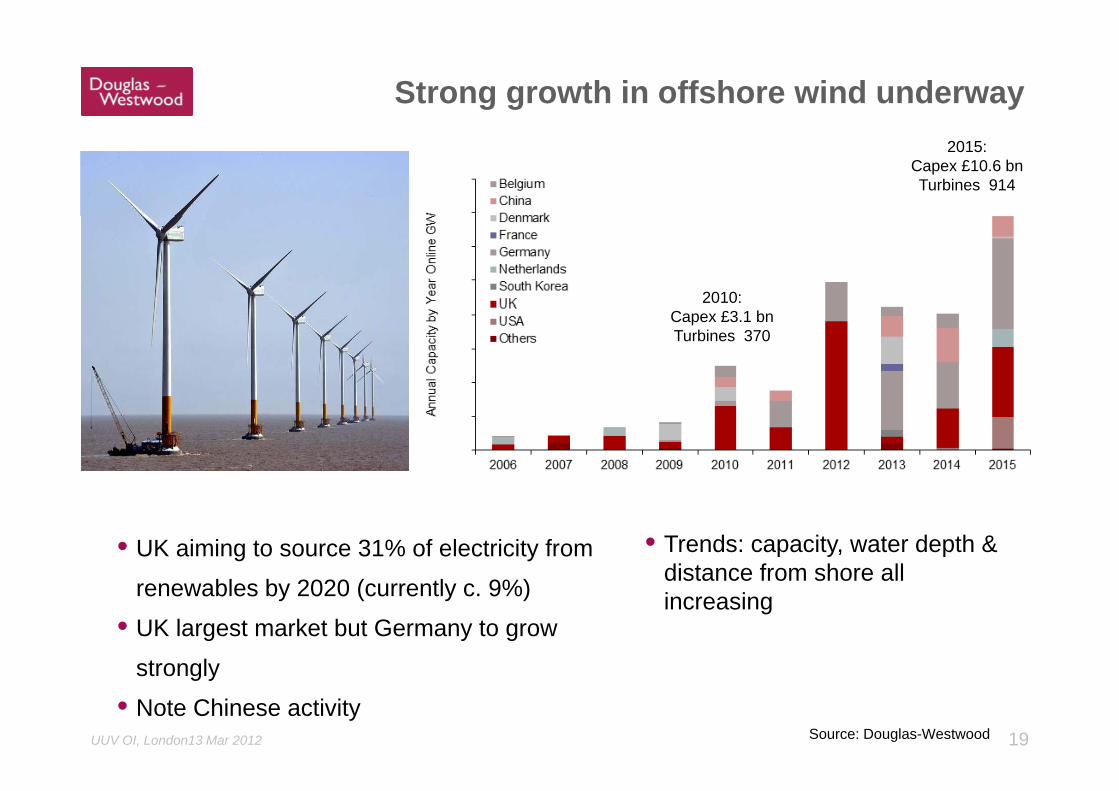
Strong growth in offshore wind underway2015:
Capex £10.6 bnTurbines 914
2010:Capex £3.1 bnTurbines 370
• UK aiming to source 31% of electricity from • Trends: capacity, water depth & distance from shore allrenewables by 2020 (currently c. 9%)
• UK largest market but Germany to grow
strongly
distance from shore all increasing
19UUV OI, London13 Mar 2012
strongly
• Note Chinese activity Source: Douglas-Westwood
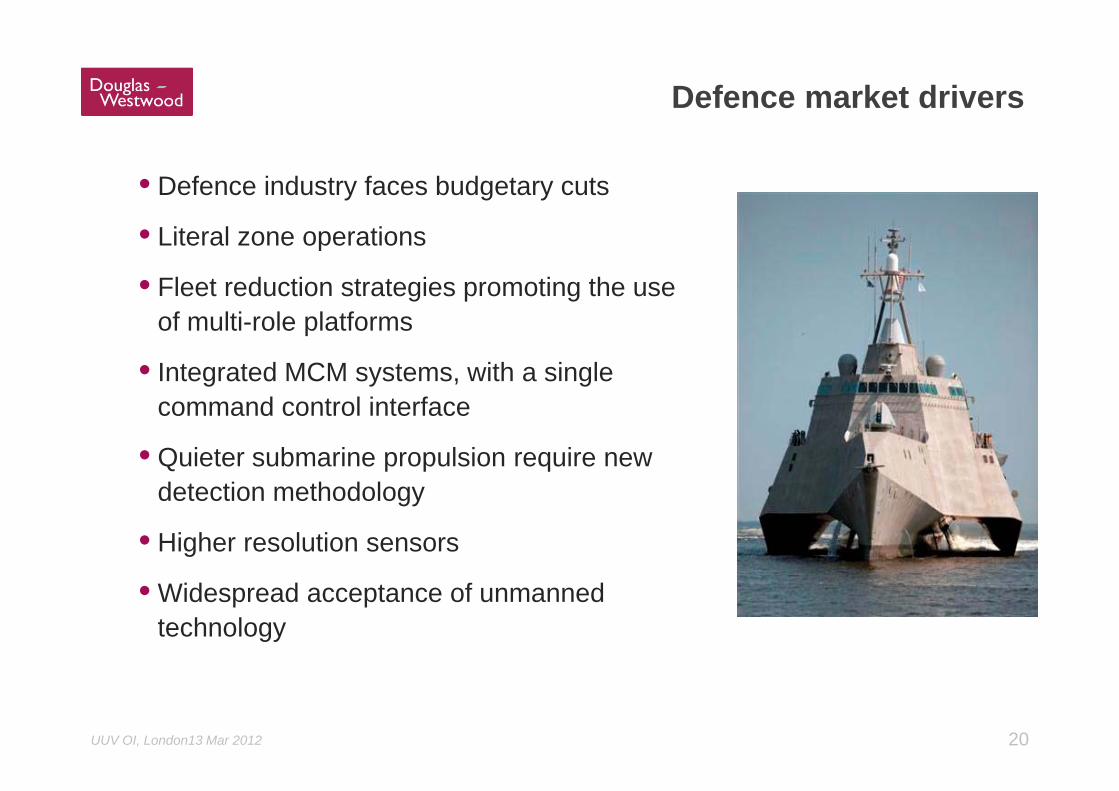
Defence market drivers
• Defence industry faces budgetary cuts
• Literal zone operations
• Fleet reduction strategies promoting the use of multi-role platforms
• Integrated MCM systems, with a single command control interface
• Quieter submarine propulsion require new d t ti th d ldetection methodology
• Higher resolution sensors
• Widespread acceptance of unmanned technology
20UUV OI, London13 Mar 2012
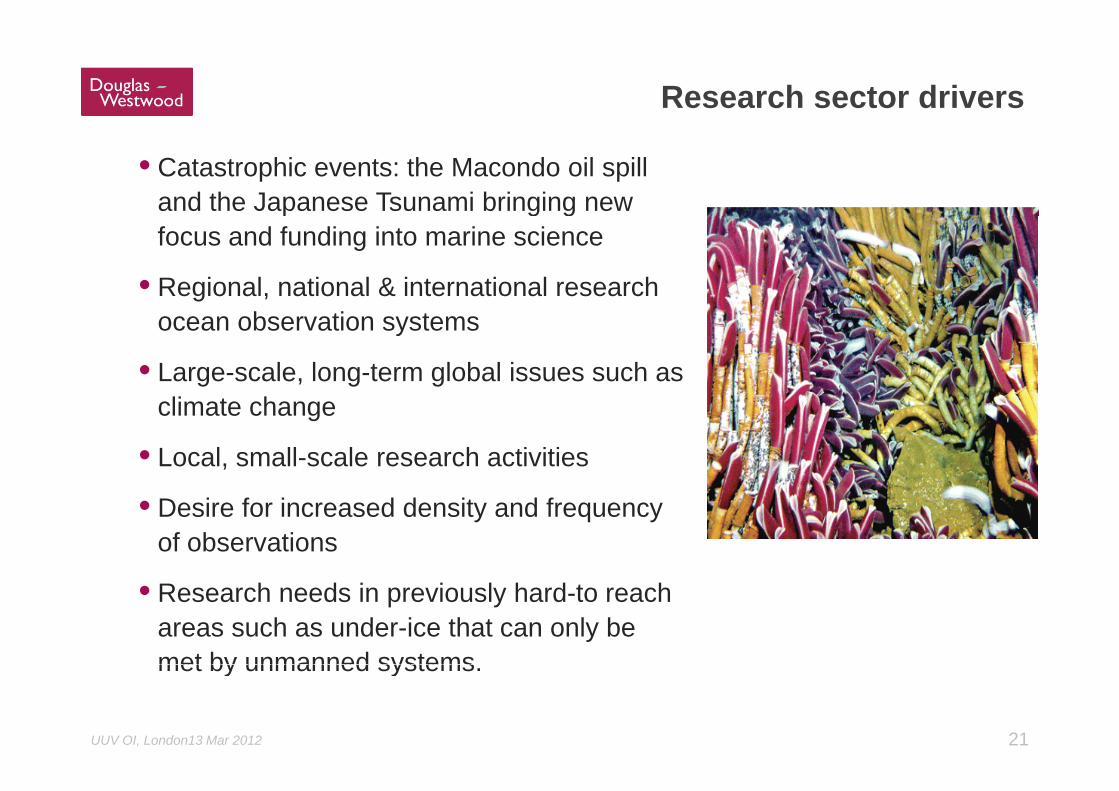
Research sector drivers
• Catastrophic events: the Macondo oil spill and the Japanese Tsunami bringing new p g gfocus and funding into marine science
• Regional, national & international research ocean observation systems
• Large-scale, long-term global issues such as climate change
• Local, small-scale research activities
• Desire for increased density and frequency of observations
• Research needs in previously hard-to reach areas such as under-ice that can only be met by unmanned systems
21UUV OI, London13 Mar 2012
met by unmanned systems.
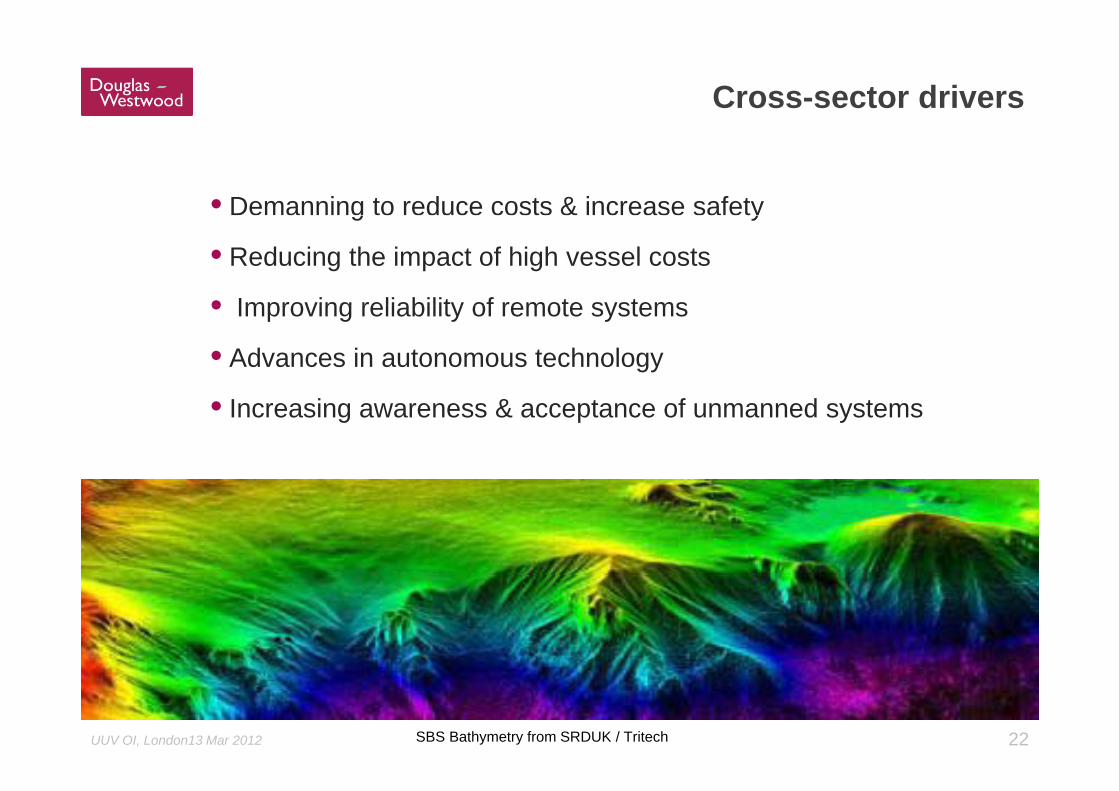
Cross-sector drivers
• Demanning to reduce costs & increase safetyg y
• Reducing the impact of high vessel costs
• Improving reliability of remote systems• Improving reliability of remote systems
• Advances in autonomous technology
• Increasing awareness & acceptance of unmanned systems
22UUV OI, London13 Mar 2012 SBS Bathymetry from SRDUK / Tritech
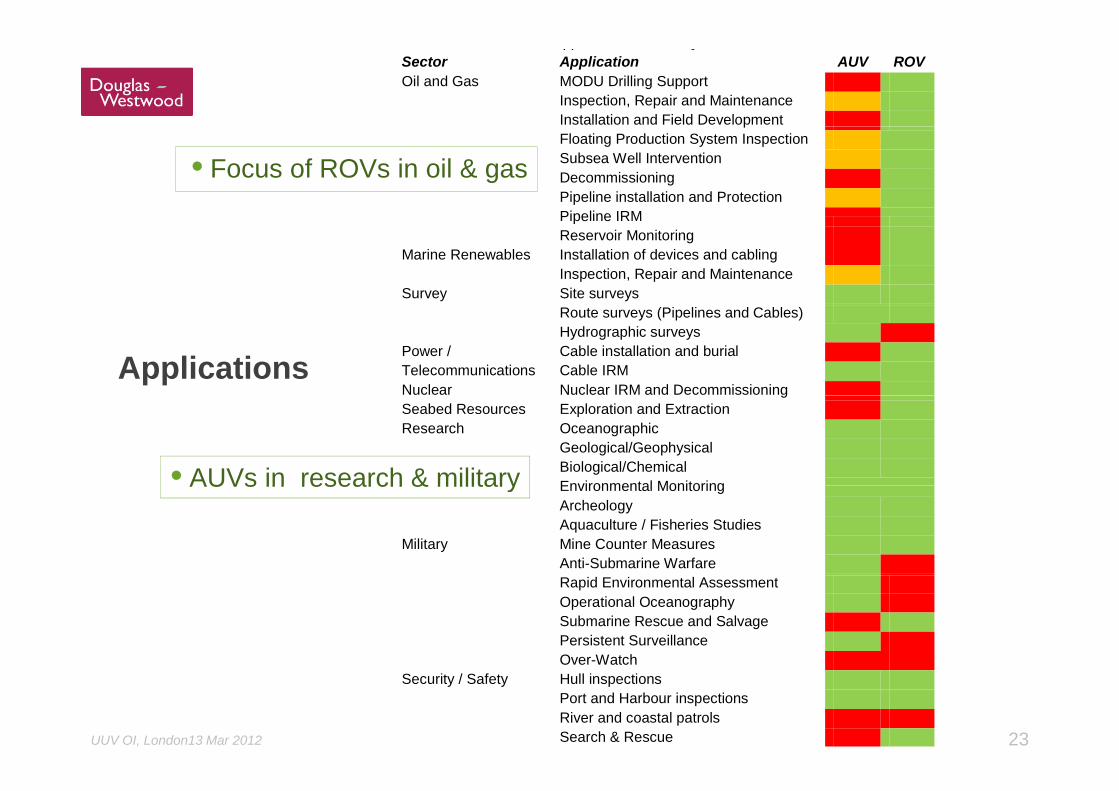
pp ySector Application AUV ROV Oil and Gas MODU Drilling Support
Inspection, Repair and Maintenance Installation and Field DevelopmentpFloating Production System Inspection Subsea Well Intervention Decommissioning Pipeline installation and Protection Pipeline IRM
• Focus of ROVs in oil & gasPipeline IRM Reservoir Monitoring
Marine Renewables Installation of devices and cabling Inspection, Repair and Maintenance
Survey Site surveys
Applications
Route surveys (Pipelines and Cables)Hydrographic surveys
Power / Telecommunications
Cable installation and burial Cable IRM
Nuclear Nuclear IRM and DecommissioninggSeabed Resources Exploration and Extraction Research Oceanographic
Geological/Geophysical Biological/Chemical Environmental Monitoring• AUVs in research & military Environmental MonitoringArcheology Aquaculture / Fisheries Studies
Military Mine Counter Measures Anti-Submarine Warfare
AUVs in research & military
Rapid Environmental AssessmentOperational Oceanography Submarine Rescue and Salvage Persistent Surveillance Over-Watch
23UUV OI, London13 Mar 2012
Security / Safety Hull inspections Port and Harbour inspections River and coastal patrols Search & Rescue
From man to machine
Market drivers
Work class ROVs
AUVs
C l iConclusions
24UUV OI, London13 Mar 2012
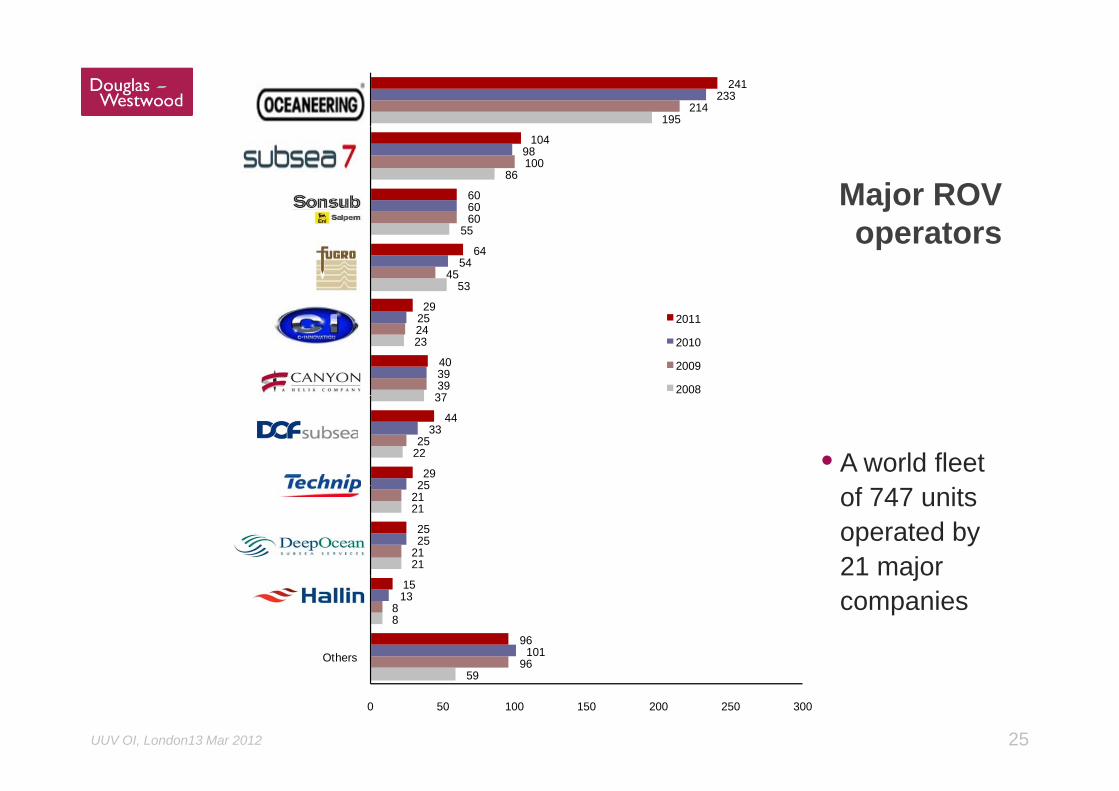
195214
233241
Oceaneering
Major ROV 86
60
100
60
98
60
104
Sonsub
Subsea 7 (inc. i-Tech)
operators53
55
45
60
54
29
64Fugro
Sonsub
37
23
39
24
39
25
40
29
Helix (Canyon)
C-Innovation 2011
2010
2009
2008
22
37
25
25
33
29
44DOF Subsea
• A world fleet
21
21
21
21
25
25
25Trico
Technip of 747 units operated by 21 major
8
96
8
101
13
96
15
Others
Hallin
21 major companies
25UUV OI, London13 Mar 2012
5996
0 50 100 150 200 250 300
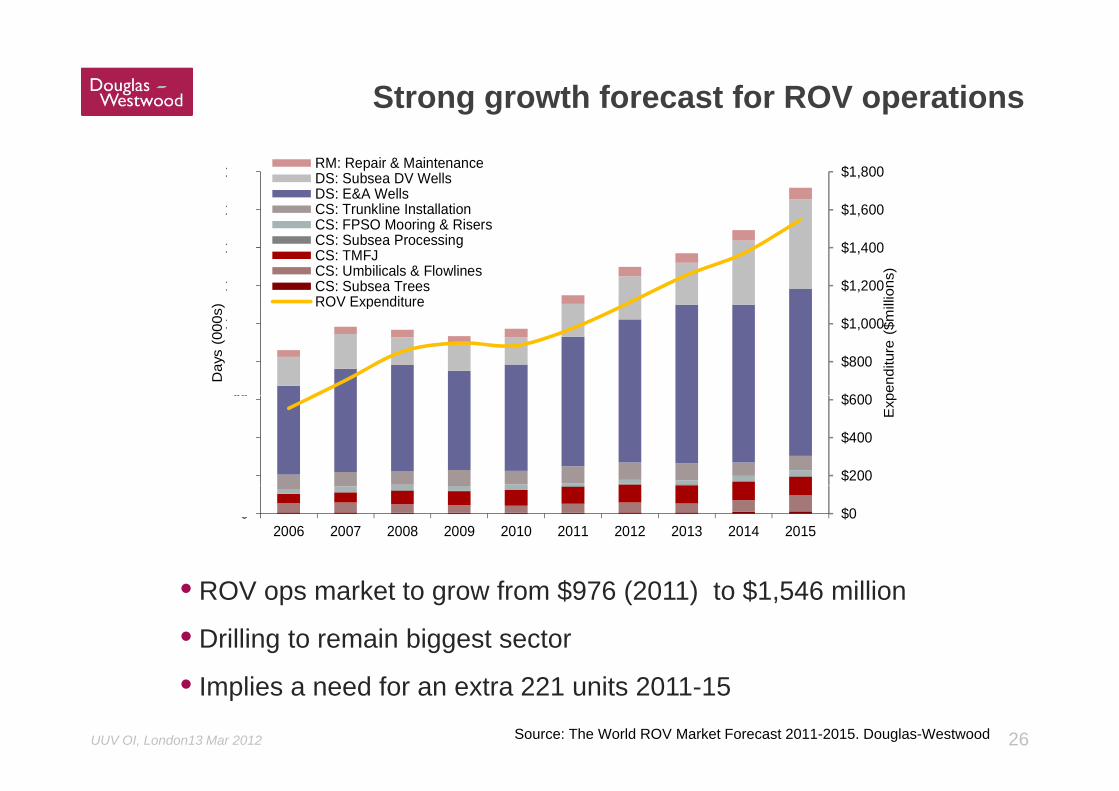
Strong growth forecast for ROV operations
$1,600
$1,800
160
180 RM: Repair & MaintenanceDS: Subsea DV WellsDS: E&A WellsCS: Trunkline Installation
$1,200
$1,400
,
120
140
llion
s)
)CS: FPSO Mooring & RisersCS: Subsea ProcessingCS: TMFJCS: Umbilicals & FlowlinesCS: Subsea TreesROV Expenditure
$600
$800
$1,000
60
80
100
pend
iture
($m
i
Day
s (0
00s ) ROV Expenditure
$200
$400
$600
20
40
60
Exp
$002006 2007 2008 2009 2010 2011 2012 2013 2014 2015
• ROV ops market to grow from $976 (2011) to $1,546 million
• Drilling to remain biggest sector
26UUV OI, London13 Mar 2012
• Implies a need for an extra 221 units 2011-15 Source: The World ROV Market Forecast 2011-2015. Douglas-Westwood
From man to machine
Market drivers
Work class ROVs
AUVs
C l iConclusions
27UUV OI, London13 Mar 2012
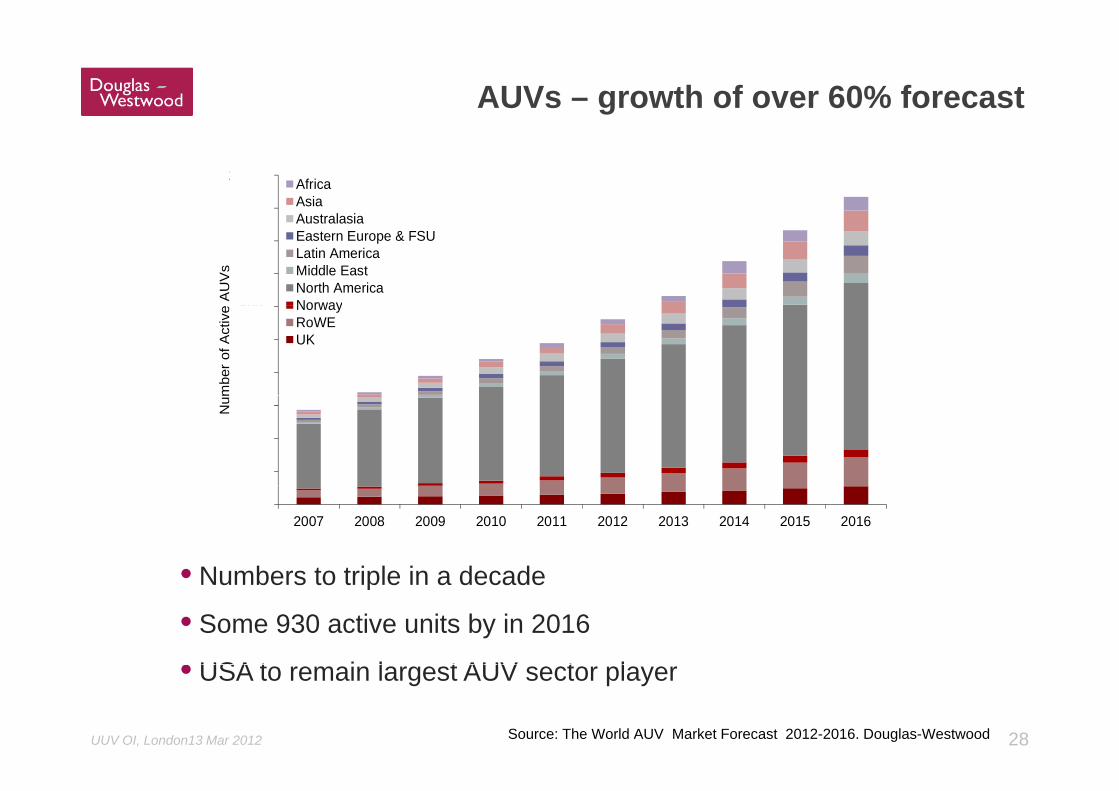
AUVs – growth of over 60% forecast
900
1,000 AfricaAsiaAustralasia
600
700
800 A
UV
sAustralasiaEastern Europe & FSULatin AmericaMiddle EastNorth AmericaNorway
400
500
600
mbe
r of A
ctiv
e NorwayRoWEUK
100
200
300Num
• Numbers to triple in a decade
02007 2008 2009 2010 2011 2012 2013 2014 2015 2016
• Numbers to triple in a decade
• Some 930 active units by in 2016
• USA t i l t AUV t l
28UUV OI, London13 Mar 2012
• USA to remain largest AUV sector player
Source: The World AUV Market Forecast 2012-2016. Douglas-Westwood
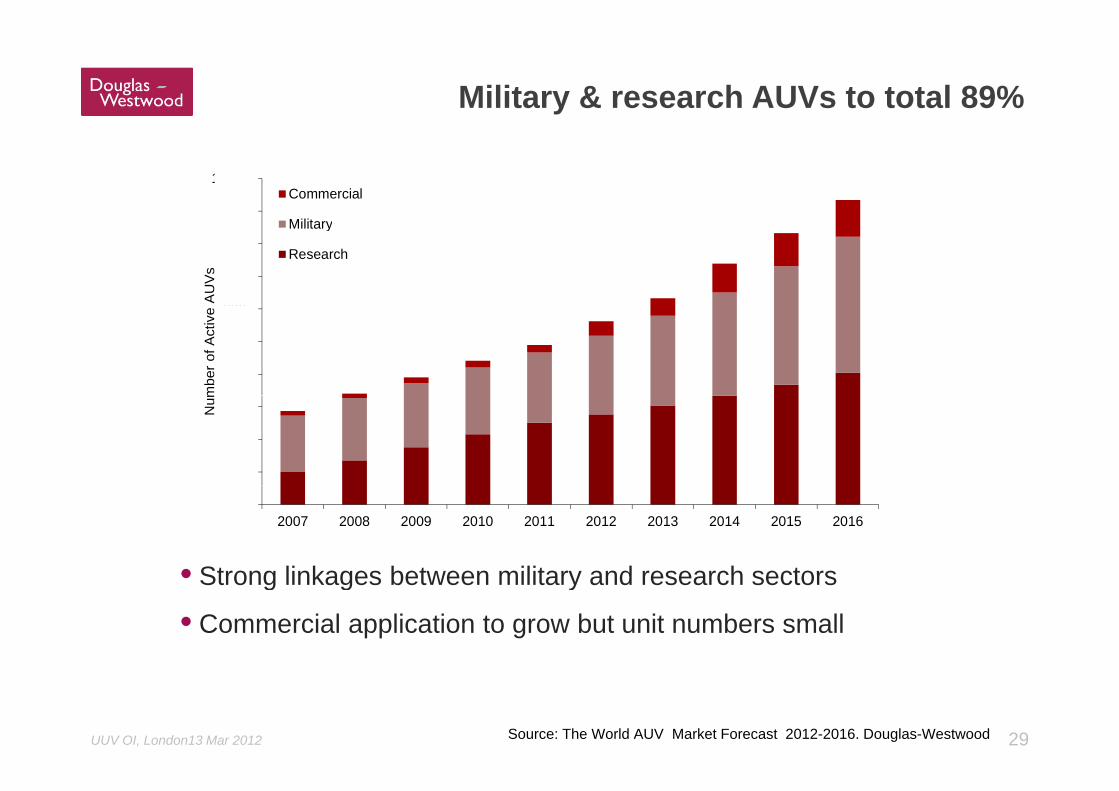
Military & research AUVs to total 89%
900
1,000Commercial
600
700
800
AU
Vs
Military
Research
400
500
600
mbe
r of A
ctiv
e
100
200
300Num
• Strong linkages between military and research sectors
02007 2008 2009 2010 2011 2012 2013 2014 2015 2016
• Strong linkages between military and research sectors
• Commercial application to grow but unit numbers small
29UUV OI, London13 Mar 2012 Source: The World AUV Market Forecast 2012-2016. Douglas-Westwood

From man to machine
Market drivers
Work class ROVs
AUVs
C l iConclusions
30UUV OI, London13 Mar 2012
AUV conclusions
• A strong & growing market for AUV deliveries
• Military & research sectors to hold 89% of market (CAGR 12% & 8%)
• Commercial sector 11% market, but CAGR of 20%
• Emerging markets: Renewables, Site Survey, Life of Field, Rig Moves and Hydrography
• Long-term subsea operations such as LOF demand new technology
• Manufacturers: Kongsberg likely to dominate for some years.Manufacturers: Kongsberg likely to dominate for some years.
• Companies with a large existing profile include Bluefin Robotics and ISE. Interesting developments in Cybernetix, Go Science & Subsea 7g p y
31UUV OI, London13 Mar 2012
ROV conclusions
• Strong growth in demand for work-class ROV operations
• Market expected to grow from $885 million to $1,546 in 2015
• ROV days for drilling support to grow at near 14% CAGR
• Construction support days growth of 6 % CAGRConstruction support days growth of 6 % CAGR.
• IRM activities to rise at 7%
A f th 221 it d d b 2011 2015• A further 221 units needed by 2011-2015
32UUV OI, London13 Mar 2012