automotive engineering: engine fuel map design · automotive engineering: engine fuel map design...
TRANSCRIPT
Automotive Engineering: Engine Fuel Map Design
George Alexandrov
Kaitlin Bergin
Xiao Ying Zhao
Rolih Ferdinand
Jeffrey Kowalski
Abstract
In order to understand how to
bring out the most power from a car’s
engine, we needed to learn how an
engine works. The main focus of this
research was to tune the engine and
create a fuel map that would allow it to
run at its optimum level. We used the
Win Tec-GT computer software to test
the performance of a 2002 Yamaha
YZFR6 engine that the Rutgers 2008
Racing Team uses in their car. To easily
test the engine we connected it to a
dynamometer that simulated a load on
the engine, making it do work and
simulate real life driving. The engine
included numerous sensors that relayed
information about conditions such as
crank position and coolant temperature,
allowing the Tec-GT to communicate
with the engine and adjust parameters.
Our main areas of interest with
the Tec-GT and the tuning of the engine
were the ignition advance and
volumetric advance tables. By changing
different values on these tables we were
able to adjust the amount of fuel that
entered the engine as well as the time of
injection. The two tables were adjusted
until the engine performed at its highest
potential at each possible variation of
load and RPM. However, even when this
map was completed some effects could
not be tested without driving the car,
such as acceleration changes in the
engine.
1. Introduction
Modern automotive technology
relies on electronically controlled
devices to monitor and operate the car’s
engine. An important automotive
process that determines the performance
of the engine is the fuel injection
process. Fuel injection is the process that
causes combustion in an engine by
combining fuel and air. The fuel
injection system was invented in the
1890s and was used in diesel engines,
aircraft, and tanks starting in the 1920s
through World War II; it began
appearing commercially in gasoline-
fueled cars in the 1950s (Mercedes Benz
and Chevy both had models using fuel
injection), and by the 1980s was the
standard combustion system used in
automobile engines in the United States
and Europe [2]. In the past, internal
combustion engines used carburetors to
mix the fuel and air to a combustible
state. As cars became more complex and
government regulations related to
exhaust emissions became stricter,
however, carburetors have been replaced
with electronic fuel injection systems,
which can more precisely control the
flow of fuel to the engine. The
efficiency of the fuel injection system
will determine how well the engine runs
and ultimately how well the car
performs.
Today’s automotive engines use
computer controlled systems to regulate
fuel injection, allowing for precise
mixing of fuel and air. This results in
optimum engine performance, better fuel
economy, and lower exhaust emissions.
In this project, we designed, tested, and
refined an engine fuel map utilizing
computer controlled systems, and
modified the engine in accordance with
our findings in order to achieve
improved engine performance. We
worked with the Rutgers Formula
Racing Team and their formula style
race car in order to maximize the
horsepower of their engine, utilizing the
Tec-GT software and dyno.
2. Background Information
A car engine is a machine whose
basic purpose is to convert fuel into
motion. An internal combustion engine
accomplishes this conversion by
isolating a small amount of fuel in a
contained space and igniting it,
converting it to an expanding gas that
releases energy. That energy gets
translated into motion by the many
different parts of the engine working
together in a precise and continuous
cycle of activity [3]. Understanding the
various parts of the engine and how they
work together is an important first step
in being able to improve the efficiency
and performance of the engine.
2.1 Parts of the Engine and What
They Do
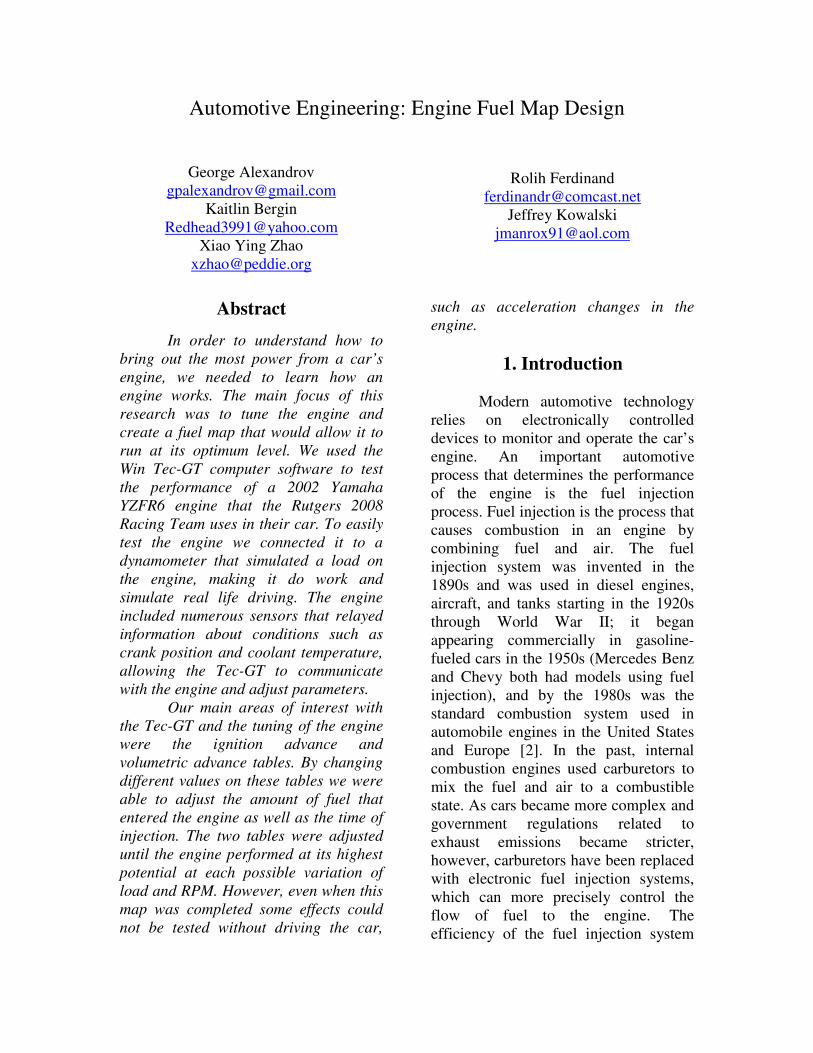
Some of the most important parts
of modern automobile engines include
the pistons, the crankshaft, the camshaft,
the engine control unit (ECU), the
injectors, the spark coil, the spark plugs
and the valves (See Figure 1).
Figure 1. Some of the Parts of a Four Stroke
Piston Engine
(E) Exhaust camshaft, (I) Intake camshaft, (S)
Spark plug, (V) Valves, (P) Piston, (R)
Connecting rod, (C) Crankshaft, (W) Water
jacket for coolant flow [10].
Inside the main body of the
engine (the engine block) are cylinders.
Modern cars have engines that have
four, six or eight cylinders. Inside each
cylinder is a piston that moves up and
down. When fuel is injected into the
cylinder, the movement of the piston
controls the volume of air within the
cylinder, providing space for the fuel
and air to mix and then compressing it to
aid in combustion. The pistons are
connected to the crankshaft by a
connecting rod. The crankshaft translates
the up and down movement of the
pistons into the rotational motion that
moves the car. On the crankshaft there is
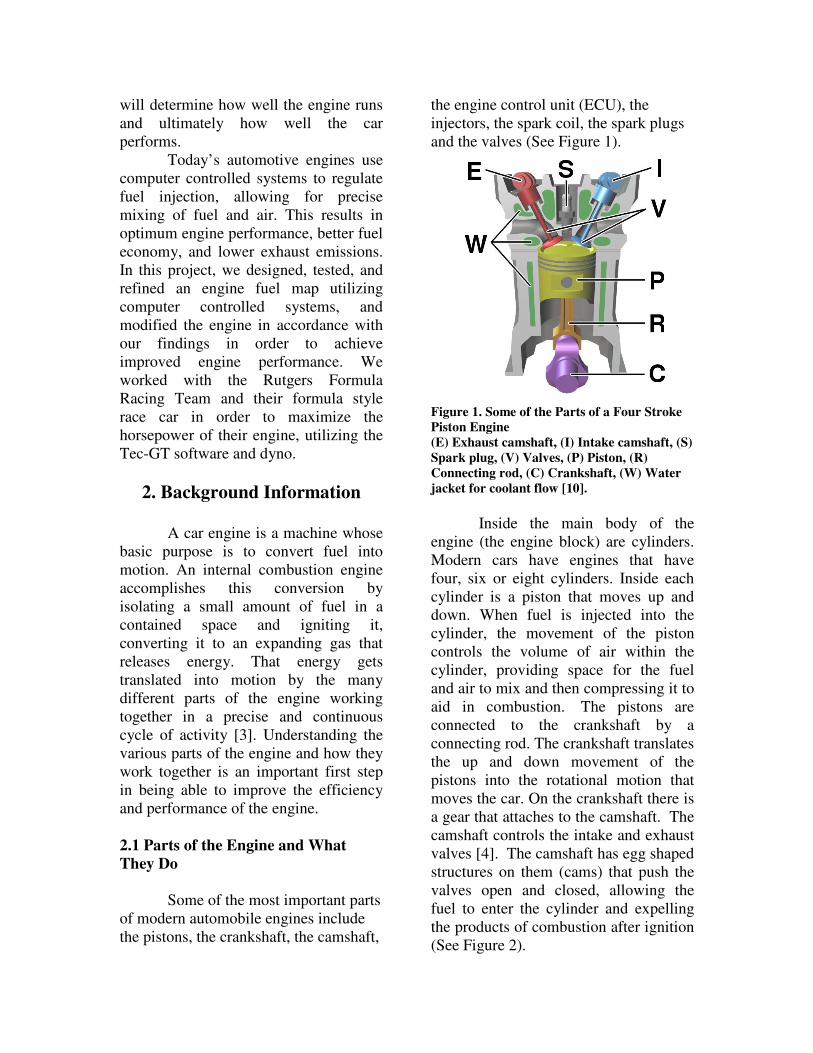
a gear that attaches to the camshaft. The
camshaft controls the intake and exhaust
valves [4]. The camshaft has egg shaped
structures on them (cams) that push the
valves open and closed, allowing the
fuel to enter the cylinder and expelling
the products of combustion after ignition
(See Figure 2).
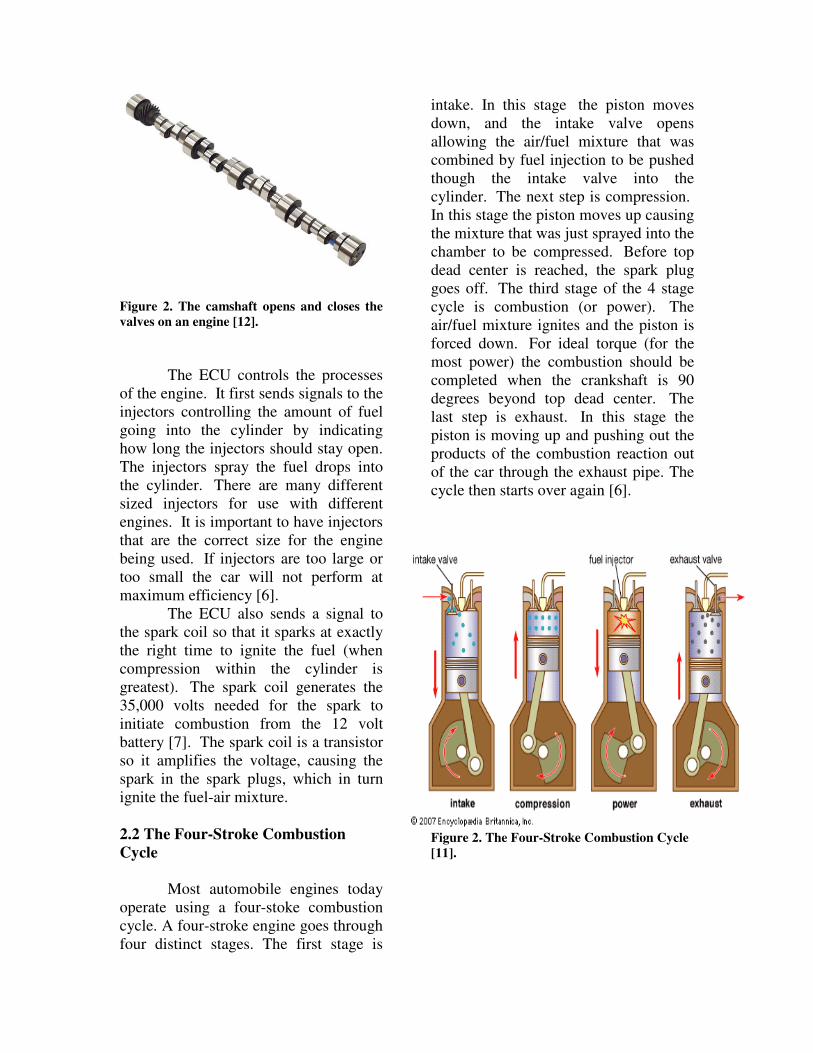
Figure 2. The camshaft opens and closes the
valves on an engine [12].
The ECU controls the processes
of the engine. It first sends signals to the
injectors controlling the amount of fuel
going into the cylinder by indicating
how long the injectors should stay open.
The injectors spray the fuel drops into
the cylinder. There are many different
sized injectors for use with different
engines. It is important to have injectors
that are the correct size for the engine
being used. If injectors are too large or
too small the car will not perform at
maximum efficiency [6].
The ECU also sends a signal to
the spark coil so that it sparks at exactly
the right time to ignite the fuel (when
compression within the cylinder is
greatest). The spark coil generates the
35,000 volts needed for the spark to
initiate combustion from the 12 volt
battery [7]. The spark coil is a transistor
so it amplifies the voltage, causing the
spark in the spark plugs, which in turn
ignite the fuel-air mixture.
2.2 The Four-Stroke Combustion
Cycle
Most automobile engines today
operate using a four-stoke combustion
cycle. A four-stroke engine goes through
four distinct stages. The first stage is
intake. In this stage the piston moves
down, and the intake valve opens
allowing the air/fuel mixture that was
combined by fuel injection to be pushed
though the intake valve into the
cylinder. The next step is compression.
In this stage the piston moves up causing
the mixture that was just sprayed into the
chamber to be compressed. Before top
dead center is reached, the spark plug
goes off. The third stage of the 4 stage
cycle is combustion (or power). The
air/fuel mixture ignites and the piston is
forced down. For ideal torque (for the
most power) the combustion should be
completed when the crankshaft is 90
degrees beyond top dead center. The
last step is exhaust. In this stage the
piston is moving up and pushing out the
products of the combustion reaction out
of the car through the exhaust pipe. The
cycle then starts over again [6].
Figure 2. The Four-Stroke Combustion Cycle
[11].
2.3 Optimizing Engine Performance
Using an Electronic Fuel Injection
System
Tuning the engine to achieve
maximum efficiency is a huge part of
getting the best performance out of the
race cars. Making adjustments to the fuel
injection system to change the amount
and release time of fuel, changing the
size or flow of fuel injectors, and
utilizing the many available engine
sensors to make other modifications can
all have a great impact on engine
horsepower and efficiency.
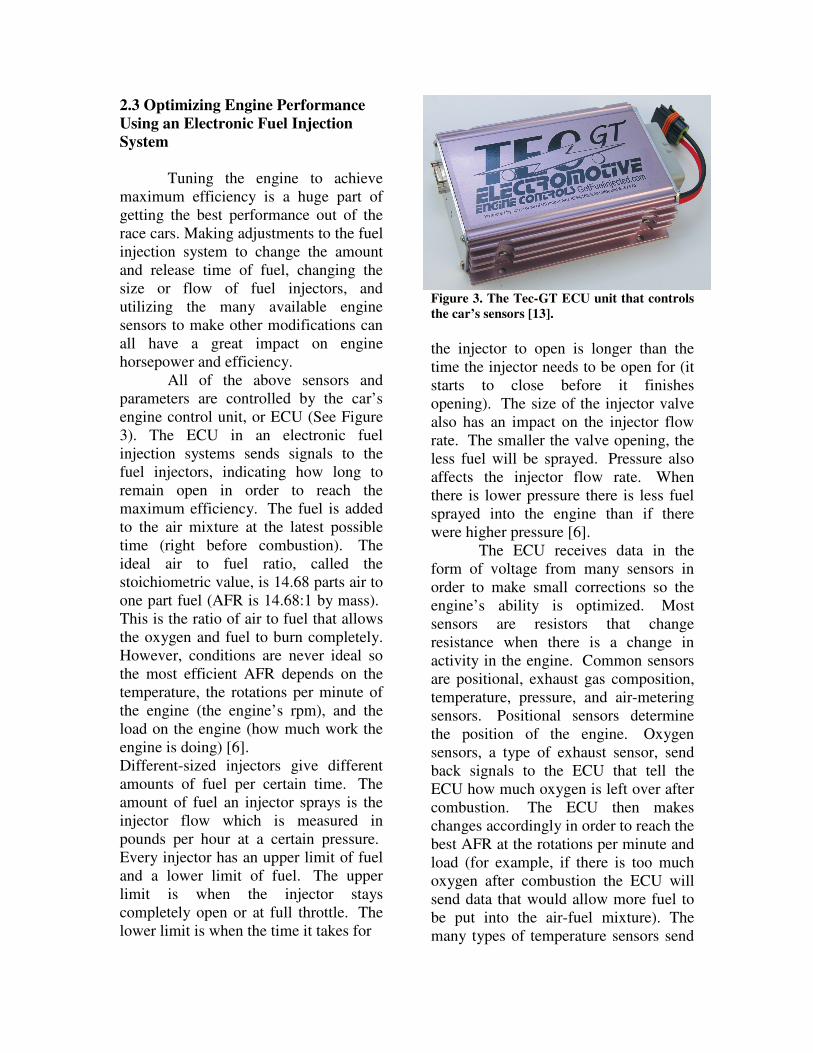
All of the above sensors and
parameters are controlled by the car’s
engine control unit, or ECU (See Figure
3). The ECU in an electronic fuel
injection systems sends signals to the
fuel injectors, indicating how long to
remain open in order to reach the
maximum efficiency. The fuel is added
to the air mixture at the latest possible
time (right before combustion). The
ideal air to fuel ratio, called the
stoichiometric value, is 14.68 parts air to
one part fuel (AFR is 14.68:1 by mass).
This is the ratio of air to fuel that allows
the oxygen and fuel to burn completely.
However, conditions are never ideal so
the most efficient AFR depends on the
temperature, the rotations per minute of
the engine (the engine’s rpm), and the
load on the engine (how much work the
engine is doing) [6].
Different-sized injectors give different
amounts of fuel per certain time. The
amount of fuel an injector sprays is the
injector flow which is measured in
pounds per hour at a certain pressure.
Every injector has an upper limit of fuel
and a lower limit of fuel. The upper
limit is when the injector stays
completely open or at full throttle. The
lower limit is when the time it takes for
Figure 3. The Tec-GT ECU unit that controls
the car’s sensors [13].
the injector to open is longer than the
time the injector needs to be open for (it
starts to close before it finishes
opening). The size of the injector valve
also has an impact on the injector flow
rate. The smaller the valve opening, the
less fuel will be sprayed. Pressure also
affects the injector flow rate. When
there is lower pressure there is less fuel
sprayed into the engine than if there
were higher pressure [6].
The ECU receives data in the
form of voltage from many sensors in
order to make small corrections so the
engine’s ability is optimized. Most
sensors are resistors that change
resistance when there is a change in
activity in the engine. Common sensors
are positional, exhaust gas composition,
temperature, pressure, and air-metering
sensors. Positional sensors determine
the position of the engine. Oxygen
sensors, a type of exhaust sensor, send
back signals to the ECU that tell the
ECU how much oxygen is left over after
combustion. The ECU then makes
changes accordingly in order to reach the
best AFR at the rotations per minute and
load (for example, if there is too much
oxygen after combustion the ECU will
send data that would allow more fuel to
be put into the air-fuel mixture). The
many types of temperature sensors send
the ECU data about the temperature of
the air, the engine, the oil, and exhaust
gas. The manifold absolute pressure
sensors determine the pressure in the
intake manifold. This can give the ECU
data as to how much air goes into the
engine (so the ECU knows how much
fuel should be added to mixture).
Similarly Barometric pressure sensors
tell the ECU the density of the
surrounding air. These data can be used
to find the absolute manifold pressure.
Air metering sensors send back data to
the ECU about the speed of the air.
There are many sensors that do the same
thing, but in a different way, so they can
be changed depending on the
surroundings and the other sensors on
the car [6].
2.4 Advanced Engine-Tuning
Technology
WinTec4 is the technology we
used for this project. WinTec4 works by
connecting to the ECU. WinTec4 allows
the user to see data from the engine and
make changes to the tables to achieve
maximum efficiency. The program
takes data from the engine and displays
them for the user. This information
includes data about the engine’s rpm and
ignition advance. Using this data,
different tables including volumetric
efficiency and ignition advance can be
adjusted to reach maximum horsepower.
The changes made to the table are made
immediately to the engine, so the user
can see how the change affected the
output of the engine.
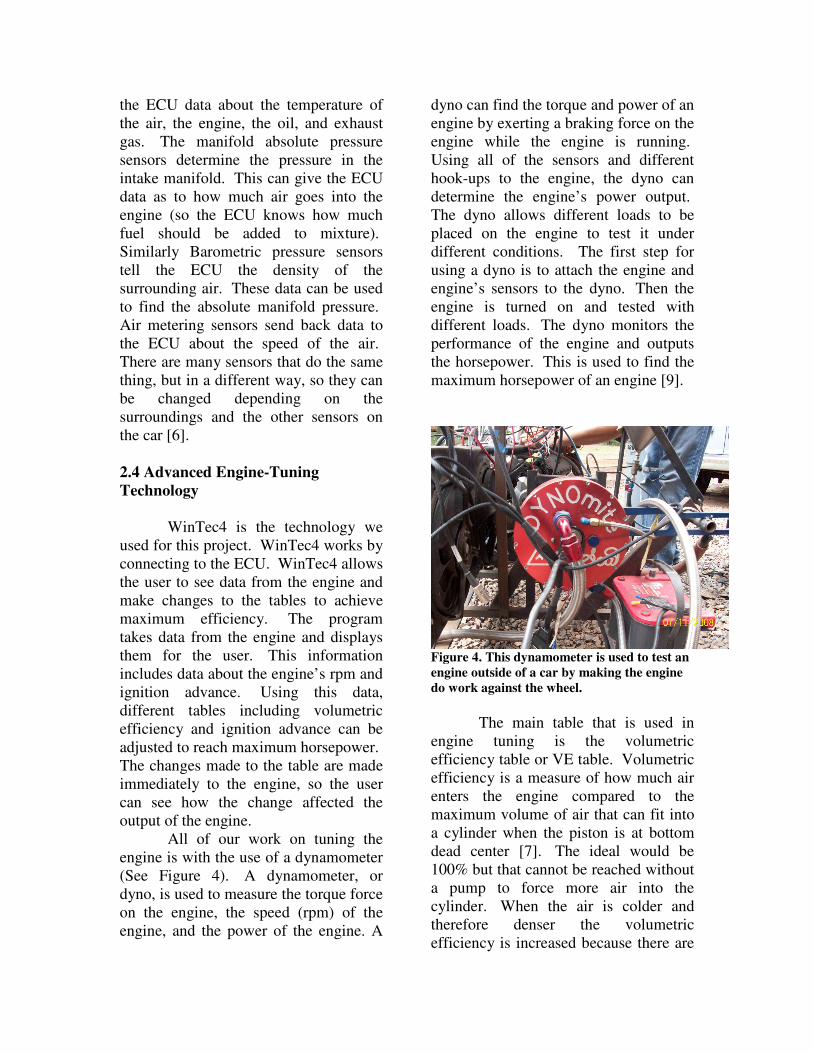
All of our work on tuning the
engine is with the use of a dynamometer
(See Figure 4). A dynamometer, or
dyno, is used to measure the torque force
on the engine, the speed (rpm) of the
engine, and the power of the engine. A
dyno can find the torque and power of an
engine by exerting a braking force on the
engine while the engine is running.
Using all of the sensors and different
hook-ups to the engine, the dyno can
determine the engine’s power output.
The dyno allows different loads to be
placed on the engine to test it under
different conditions. The first step for
using a dyno is to attach the engine and
engine’s sensors to the dyno. Then the
engine is turned on and tested with
different loads. The dyno monitors the
performance of the engine and outputs
the horsepower. This is used to find the
maximum horsepower of an engine [9].
Figure 4. This dynamometer is used to test an
engine outside of a car by making the engine
do work against the wheel.
The main table that is used in
engine tuning is the volumetric
efficiency table or VE table. Volumetric
efficiency is a measure of how much air
enters the engine compared to the
maximum volume of air that can fit into
a cylinder when the piston is at bottom
dead center [7]. The ideal would be
100% but that cannot be reached without
a pump to force more air into the
cylinder. When the air is colder and
therefore denser the volumetric
efficiency is increased because there are
more molecules of air per area. The
volumetric efficiency table represents
the engine’s intake efficiency under
different conditions. The VE table
should not have any extreme values that
do not fit with surrounding cells. The
VE graph should be a smooth graph
[6].
3. Experimental Design
An ideal fuel flow map for
Rutgers’s formula racecar would achieve
optimum horsepower and be
volumetrically efficient. To obtain this
ideal fuel flow map, the engine’s ECU
must be electronically configured, tested,
and observed. The engine needs to be
monitored while it is running, but it can
be difficult to track data if the engine is
in a moving vehicle. For this reason, we
used a dyno attached to a laptop in order
to monitor the engine.
Once we attached the racecar’s
engine to the dynamometer, the engine
was started and data was recorded.
Graphs could be created from volumetric
efficiency and AFR tables. We adjusted
values to produce a smoother transition
between bordering cells in the fuel table.
When the engine is not connected to
the dyno, there is no load because the
engine is in free revolution. Many things
could be adjusted once the engine was
connected to the dyno. The air-fuel
meter changes as the engine heats up and
calibrates. If fuel is taken away, the AFR
becomes too low. While the engine is on
the dynamometer, a volumetric
efficiency table in the program WinTEC
displays the percentage of air that is
being given or taken away. A red dot
shows where the computer is calculating,
and the position is determined by
pressure and rpm. The WinTEC program
operates by interpolating values of
bordering cells to calculate the optimal
fuel and ignition values. While running
the engine on the dynamometer, many
things need to be watched closely and
adjusted. Water temperature should
remain around 70 degrees Celsius
because if it gets much hotter, the engine
will not function properly. Other
necessary adjustments include the
placement of the throttle blade because it
changes the idle value. Also, fuel
pressure should be maintained between
40 and 45 psi (pounds per square inch)
because the fuel injectors are calibrated
for this value. Adding or taking away
fuel changes the temperature; when fuel
is taken away, the combustion temperate
increases.
We then took the car to the
practice course and the racing team
drove some laps while data was
recorded. The data could then be read in
WinTEC and analyzed. The way the race
team set up volumetric efficiency and
AFR tables optimized horse power,
torque, rpm, and cylinder pressures. The
engine was set to idle between 3000 and
3500 RPM. The initial advance was set
to 14 degrees before top dead center.
The spark is advanced to allow enough
time for the fuel to burn before exhaust.
If there was not a large enough advance,
some unburned fuel could escape
through the exhaust, lowering fuel
efficiency.
The engine control unit (ECU)
constantly monitors the conditions of the
engine. The various sensors include
position, exhaust, temperature, pressure,
and knock which all report back the
ECU allowing it to adjust the engine
accordingly. These sensors all help to
obtain the ideal AFR of 14.68:1. Any
value higher is lean with more air, and
any value lower than 14.68 is rich with
more fuel. Traditionally when racing,
AFR is ideal because when more fuel is
at hand, the fuel can get to the engine
faster. Also, it is found that when the
engine is cold, a richer mixture is needed
because fuel does not vaporize well in
the cold. These sensors control and
regulate all aspects of the car.
4. Results
We used a variety of sensors on
the dyno to measure the manifold
absolute pressure, the AFR, the throttle
position, the RPM, and the ignition
advance in order to calibrate the engine
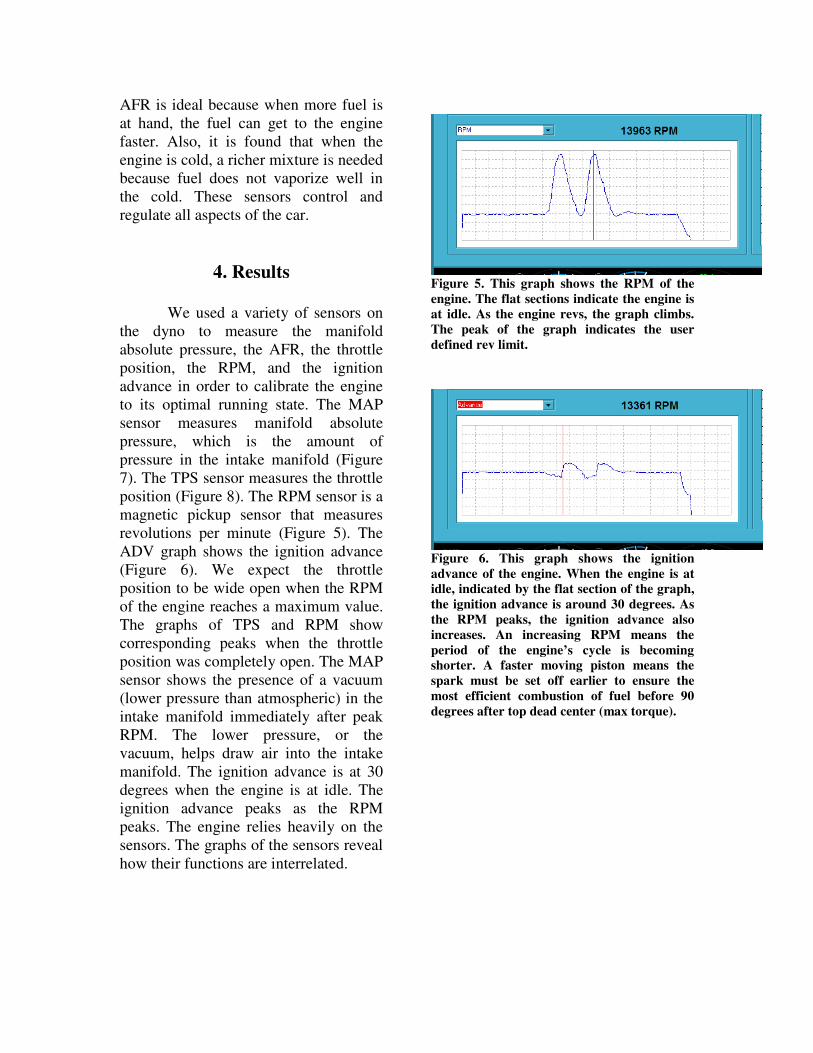
to its optimal running state. The MAP
sensor measures manifold absolute
pressure, which is the amount of
pressure in the intake manifold (Figure
7). The TPS sensor measures the throttle
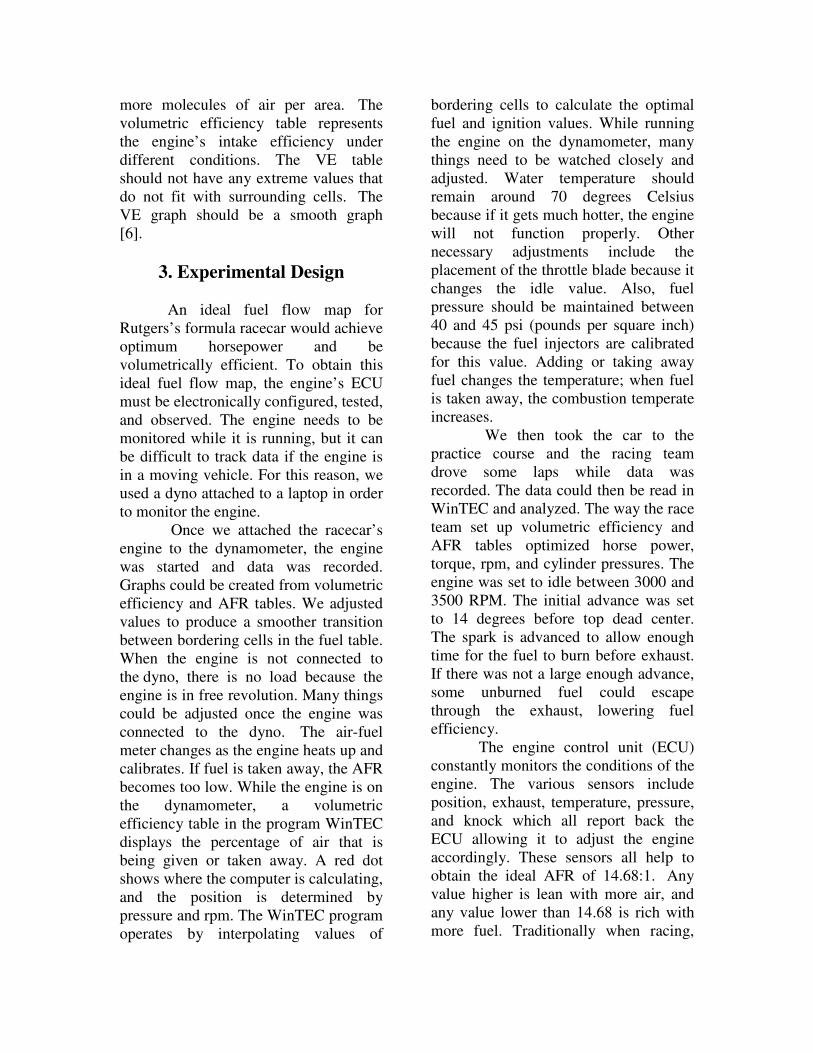
position (Figure 8). The RPM sensor is a
magnetic pickup sensor that measures
revolutions per minute (Figure 5). The
ADV graph shows the ignition advance
(Figure 6). We expect the throttle
position to be wide open when the RPM
of the engine reaches a maximum value.
The graphs of TPS and RPM show
corresponding peaks when the throttle
position was completely open. The MAP
sensor shows the presence of a vacuum
(lower pressure than atmospheric) in the
intake manifold immediately after peak
RPM. The lower pressure, or the
vacuum, helps draw air into the intake
manifold. The ignition advance is at 30
degrees when the engine is at idle. The
ignition advance peaks as the RPM
peaks. The engine relies heavily on the
sensors. The graphs of the sensors reveal
how their functions are interrelated.
Figure 5. This graph shows the RPM of the
engine. The flat sections indicate the engine is
at idle. As the engine revs, the graph climbs.
The peak of the graph indicates the user
defined rev limit.
Figure 6. This graph shows the ignition
advance of the engine. When the engine is at
idle, indicated by the flat section of the graph,
the ignition advance is around 30 degrees. As
the RPM peaks, the ignition advance also
increases. An increasing RPM means the
period of the engine’s cycle is becoming
shorter. A faster moving piston means the
spark must be set off earlier to ensure the
most efficient combustion of fuel before 90
degrees after top dead center (max torque).
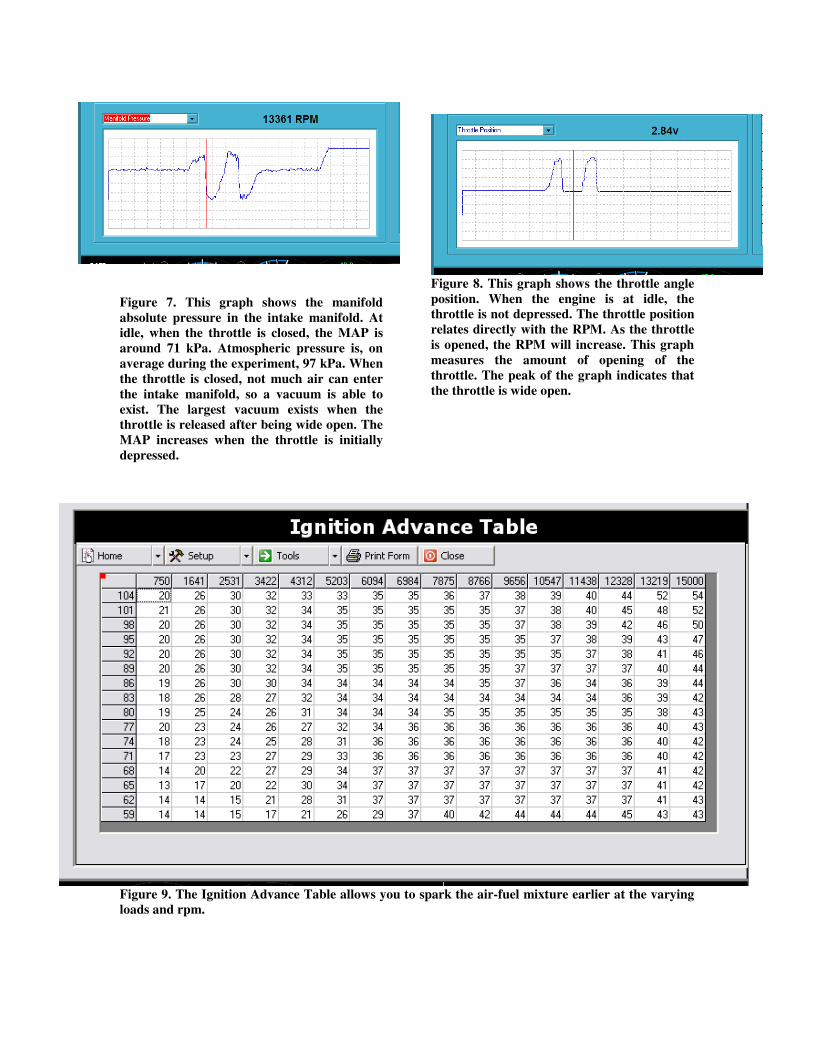
Figure 7. This graph shows the manifold
absolute pressure in the intake manifold. At
idle, when the throttle is closed, the MAP is
around 71 kPa. Atmospheric pressure is, on
average during the experiment, 97 kPa. When
the throttle is closed, not much air can enter
the intake manifold, so a vacuum is able to
exist. The largest vacuum exists when the
throttle is released after being wide open. The
MAP increases when the throttle is initially
depressed.
Figure 8. This graph shows the throttle angle
position. When the engine is at idle, the
throttle is not depressed. The throttle position
relates directly with the RPM. As the throttle
is opened, the RPM will increase. This graph
measures the amount of opening of the
throttle. The peak of the graph indicates that
the throttle is wide open.
Figure 9. The Ignition Advance Table allows you to spark the air-fuel mixture earlier at the varying
loads and rpm.
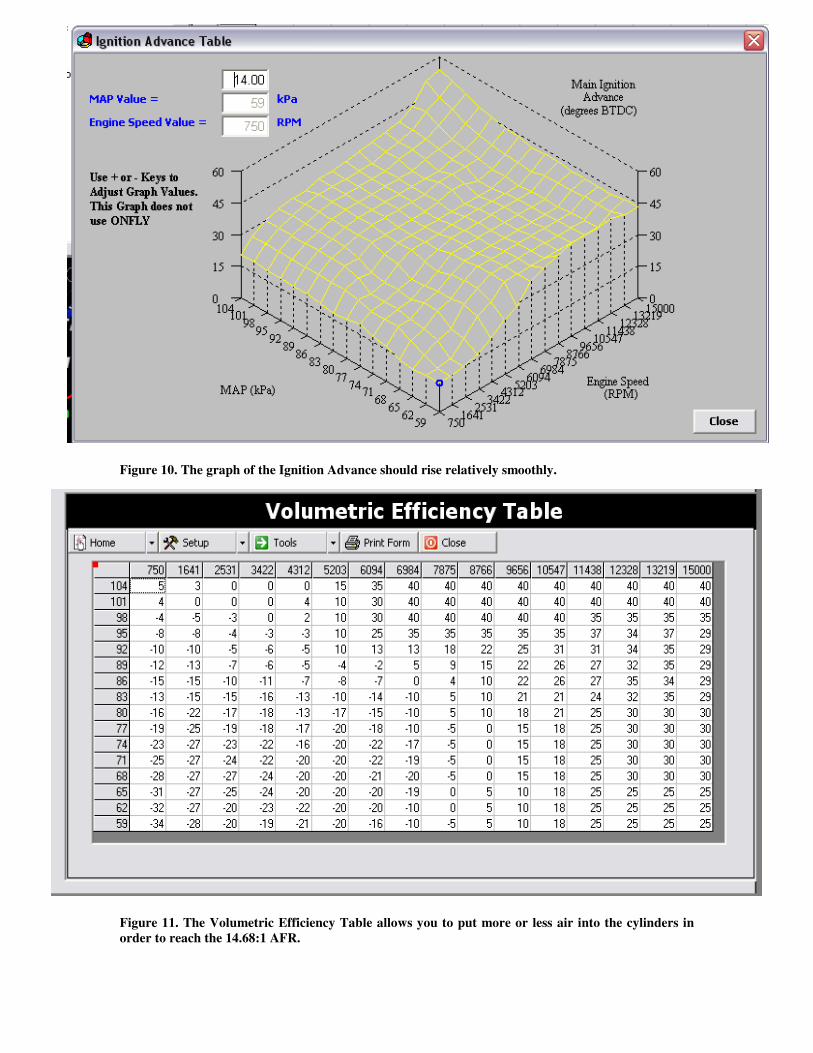
Figure 10. The graph of the Ignition Advance should rise relatively smoothly.
Figure 11. The Volumetric Efficiency Table allows you to put more or less air into the cylinders in
order to reach the 14.68:1 AFR.
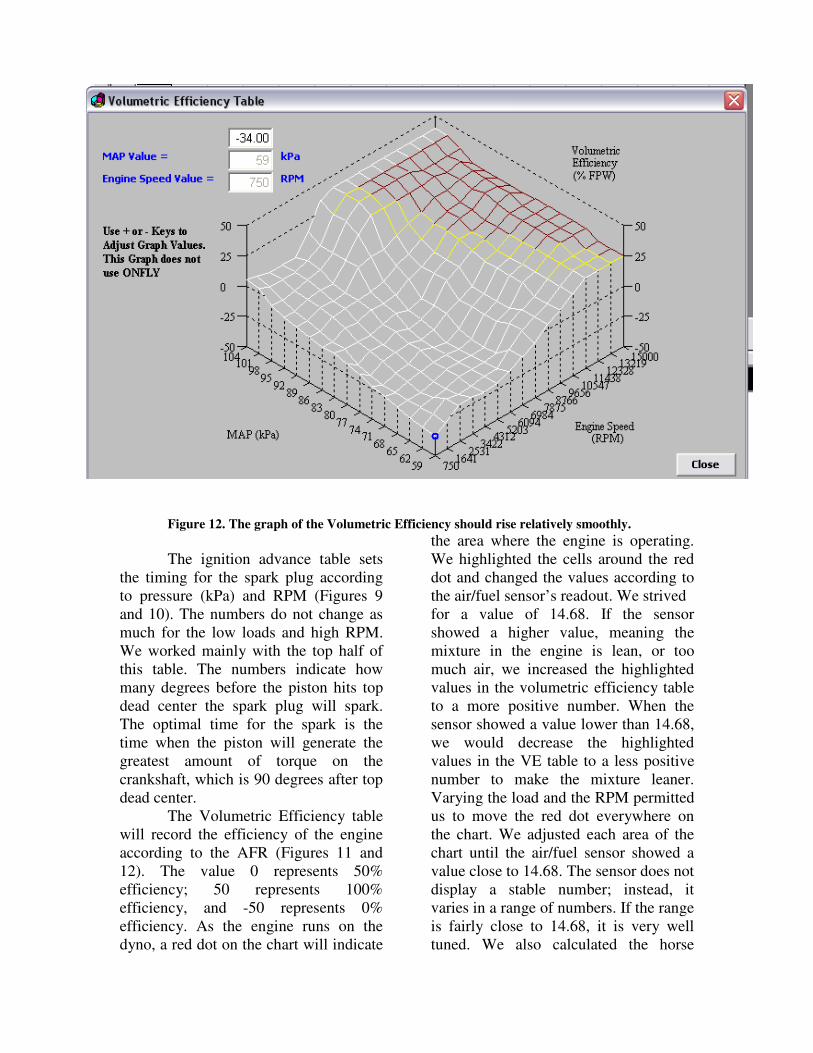
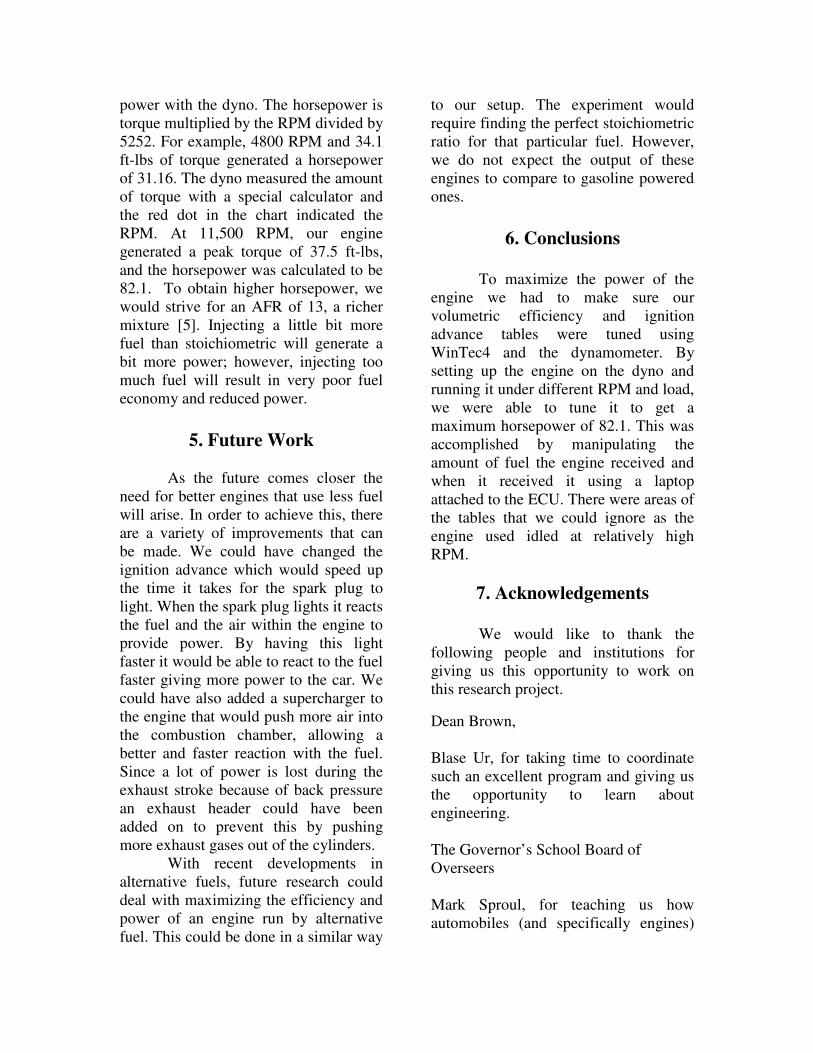
Figure 12. The graph of the Volumetric Efficiency should rise relatively smoothly.
The ignition advance table sets
the timing for the spark plug according
to pressure (kPa) and RPM (Figures 9
and 10). The numbers do not change as
much for the low loads and high RPM.
We worked mainly with the top half of
this table. The numbers indicate how
many degrees before the piston hits top
dead center the spark plug will spark.
The optimal time for the spark is the
time when the piston will generate the
greatest amount of torque on the
crankshaft, which is 90 degrees after top
dead center.
The Volumetric Efficiency table
will record the efficiency of the engine
according to the AFR (Figures 11 and
12). The value 0 represents 50%
efficiency; 50 represents 100%
efficiency, and -50 represents 0%
efficiency. As the engine runs on the
dyno, a red dot on the chart will indicate
the area where the engine is operating.
We highlighted the cells around the red
dot and changed the values according to
the air/fuel sensor’s readout. We strived
for a value of 14.68. If the sensor
showed a higher value, meaning the
mixture in the engine is lean, or too
much air, we increased the highlighted
values in the volumetric efficiency table
to a more positive number. When the
sensor showed a value lower than 14.68,
we would decrease the highlighted
values in the VE table to a less positive
number to make the mixture leaner.
Varying the load and the RPM permitted
us to move the red dot everywhere on
the chart. We adjusted each area of the
chart until the air/fuel sensor showed a
value close to 14.68. The sensor does not
display a stable number; instead, it
varies in a range of numbers. If the range
is fairly close to 14.68, it is very well
tuned. We also calculated the horse
power with the dyno. The horsepower is
torque multiplied by the RPM divided by
5252. For example, 4800 RPM and 34.1
ft-lbs of torque generated a horsepower
of 31.16. The dyno measured the amount
of torque with a special calculator and
the red dot in the chart indicated the
RPM. At 11,500 RPM, our engine
generated a peak torque of 37.5 ft-lbs,
and the horsepower was calculated to be
82.1. To obtain higher horsepower, we
would strive for an AFR of 13, a richer
mixture [5]. Injecting a little bit more
fuel than stoichiometric will generate a
bit more power; however, injecting too
much fuel will result in very poor fuel
economy and reduced power.
5. Future Work
As the future comes closer the
need for better engines that use less fuel
will arise. In order to achieve this, there
are a variety of improvements that can
be made. We could have changed the
ignition advance which would speed up
the time it takes for the spark plug to
light. When the spark plug lights it reacts
the fuel and the air within the engine to
provide power. By having this light
faster it would be able to react to the fuel
faster giving more power to the car. We
could have also added a supercharger to
the engine that would push more air into
the combustion chamber, allowing a
better and faster reaction with the fuel.
Since a lot of power is lost during the
exhaust stroke because of back pressure
an exhaust header could have been
added on to prevent this by pushing
more exhaust gases out of the cylinders.
With recent developments in
alternative fuels, future research could
deal with maximizing the efficiency and
power of an engine run by alternative
fuel. This could be done in a similar way
to our setup. The experiment would
require finding the perfect stoichiometric
ratio for that particular fuel. However,
we do not expect the output of these
engines to compare to gasoline powered
ones.
6. Conclusions
To maximize the power of the
engine we had to make sure our
volumetric efficiency and ignition
advance tables were tuned using
WinTec4 and the dynamometer. By
setting up the engine on the dyno and
running it under different RPM and load,
we were able to tune it to get a
maximum horsepower of 82.1. This was
accomplished by manipulating the
amount of fuel the engine received and
when it received it using a laptop
attached to the ECU. There were areas of
the tables that we could ignore as the
engine used idled at relatively high
RPM.
7. Acknowledgements
We would like to thank the
following people and institutions for
giving us this opportunity to work on
this research project.
Dean Brown,
Blase Ur, for taking time to coordinate
such an excellent program and giving us
the opportunity to learn about
engineering.
The Governor’s School Board of
Overseers
Mark Sproul, for teaching us how
automobiles (and specifically engines)
work, and for telling us countless stories
about his personal racing experiences.
Jaime Ennis, for giving up his free time
in order to let us work with the race car
and engine, as well as spend hours
setting up the dyno for us.
Alison Rankin, for driving us around and
helping us with this project and paper in
general.
The Rutgers Racing Team for allowing
us to use their engine and car, as well as
watching them test-drive the car.
Dean Ilene Rosen.
Rutgers University and the School of
Engineering.
Jane Oates.
Prudential, Morgan Stanley, Rutgers
University, The John and Margaret Post
Foundation, John and Laura Overdeck.
8. Works Cited
[1] “2008 Formula SAE Rules.” SAE International: Collegiate Design Series. 2007. 11
July 2008. http://students.sae.org/competitions/formulaseries/rules/rules.pdf
[2] Bohen, Jim. “History and Heritage: Fuel Injection.” 8 February 2008.
StarTribune.com. 14 July 2008. http://www.startribune.com/cars/15402191.html
[3] Brain, Marshall. "How Car Engines Work." 01 April 2000. HowStuffWorks.com. 16
July 2008. http://auto.howstuffworks.com/engine.htm
[4] “Camshaft Basics.” Oregon Cam Grinding, Inc. website. (no date) 11 July 2008.
http://www.oregoncamshaft.com/cam-basics.html
[5] Ennis, Jaime. Class notes. Governor’s School of Engineering and Technology,
Rutgers University, July 2008.
[6] Hartman, Jeff. How To Tune and Modify Engine Management Systems. St. Paul:
MBI Publishing Company, 2003.
[7] Sproul, Mark. Class notes. Governor’s School of Engineering and Technology,
Rutgers University, July 2008.
[8] “The Crankshaft And How It Works.” AutoEducation.com, 2005. 12 July 2008.
http://www.autoeducation.com/rm_preview/crankshaft.htm
[9]“What Is a Dynamometer?” DyneSystems, Inc. website. (no date) 8 July 2008.
http://www.dynesystems.com/what-is-a-dynamometer.htm
[10] “Image: Four Stroke Engine Diagram” Wikimedia Foundation, Inc. 24 June 2008.
16 July 2008.
http://commons.wikimedia.org/wiki/Image:Four_stroke_engine_diagram.jpg
[11] “Diesel Engine” Encyclopædia Britannica, Inc. (no date) 16 July 2008.
http://www.britannica.com/EBchecked/topic-art/226592/89315/An-internal-
combustion-engine-goes-through-four-strokes-intake-compression#tab=
active~checked%2 Citems~ checked
[12] “Camshafts and Valve Train Components”. Reher-Morrison Racing Engines. 2002.
16 July 2008.
http://www.rehermorrison.com/images/CamshaftValvetrain/Camshaft.jpg
[13] “Electromotive Engine Controls”. Electromotive, Inc. 2008. 16 July 2008.
http://www.distributorless.com/images/products/tecgt/tecgt-01.jpg