automatic myocardium segmentation in late-enhancement … · automatic myocardium segmentation in...
TRANSCRIPT
HAL Id: hal-00350565https://hal.archives-ouvertes.fr/hal-00350565
Submitted on 7 Jan 2009
HAL is a multi-disciplinary open accessarchive for the deposit and dissemination of sci-entific research documents, whether they are pub-lished or not. The documents may come fromteaching and research institutions in France orabroad, or from public or private research centers.
L’archive ouverte pluridisciplinaire HAL, estdestinée au dépôt et à la diffusion de documentsscientifiques de niveau recherche, publiés ou non,émanant des établissements d’enseignement et derecherche français ou étrangers, des laboratoirespublics ou privés.
Automatic myocardium segmentation inlate-enhancement MRI
Cybèle Ciofolo, Maxim Fradkin, Benoît Mory, Gilion Hautvast, MarcelBreeuwer
To cite this version:Cybèle Ciofolo, Maxim Fradkin, Benoît Mory, Gilion Hautvast, Marcel Breeuwer. Automatic my-ocardium segmentation in late-enhancement MRI. 5th IEEE International Symposium on BiomedicalImaging: From Nano to Macro, 2008. ISBI 2008., May 2008, Paris, France. IEEE, pp. 225-228, 2008,<10.1109/ISBI.2008.4540973>. <hal-00350565>
AUTOMATIC MYOCARDIUM SEGMENTATION IN LATE-ENHANCEMENT MRI
C. Ciofolo, M. Fradkin, B. Mory
Medisys Research Lab, Philips Healthcare51 rue Carnot, BP 301, 92156 Suresnes Cedex
France
G. Hautvast, M. Breeuwer
Philips Medical Systems Nederland B.V.Veenpluis 4, 5684 PC Best
The Netherlands
ABSTRACTWe propose a novel automatic method to segment the my-ocardium on late-enhancement cardiac MR (LE CMR) im-ages with a multi-step approach. First, in each slice of theLE CMR volume, a geometrical template is deformed so thatits borders fit the myocardial contours. The second step con-sists in introducing a shape prior of the left ventricle. Todo so, we use the cine MR sequence that is acquired alongwith the LE CMR volume. As the myocardial contours canbe more easily automatically obtained on this data, they areused to build a 3D mesh representing the left ventricle geom-etry and the underlying myocardium thickness. This mesh isregistered towards the contours obtained with the geometri-cal template, then locally adjusted to guarantee that scars areincluded inside the final segmentation. The quantitative eval-uation on 27 volumes (272 slices) shows robust and accurateresults.
Index Terms— Image Segmentation, Late-Enhancement,Magnetic Resonance Imaging, Cardiovascular System, Au-tomation.
1. INTRODUCTION
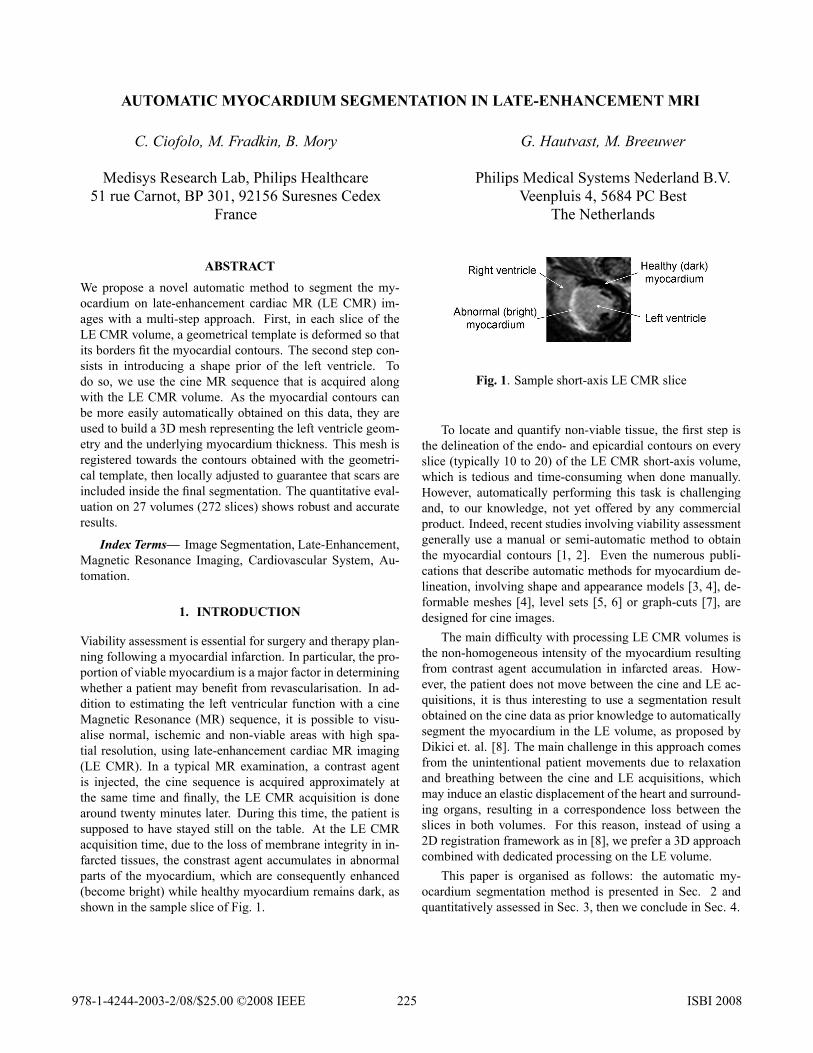
Viability assessment is essential for surgery and therapy plan-ning following a myocardial infarction. In particular, the pro-portion of viable myocardium is a major factor in determiningwhether a patient may benefit from revascularisation. In ad-dition to estimating the left ventricular function with a cineMagnetic Resonance (MR) sequence, it is possible to visu-alise normal, ischemic and non-viable areas with high spa-tial resolution, using late-enhancement cardiac MR imaging(LE CMR). In a typical MR examination, a contrast agentis injected, the cine sequence is acquired approximately atthe same time and finally, the LE CMR acquisition is donearound twenty minutes later. During this time, the patient issupposed to have stayed still on the table. At the LE CMRacquisition time, due to the loss of membrane integrity in in-farcted tissues, the constrast agent accumulates in abnormalparts of the myocardium, which are consequently enhanced(become bright) while healthy myocardium remains dark, asshown in the sample slice of Fig. 1.
Fig. 1. Sample short-axis LE CMR slice
To locate and quantify non-viable tissue, the first step isthe delineation of the endo- and epicardial contours on everyslice (typically 10 to 20) of the LE CMR short-axis volume,which is tedious and time-consuming when done manually.However, automatically performing this task is challengingand, to our knowledge, not yet offered by any commercialproduct. Indeed, recent studies involving viability assessmentgenerally use a manual or semi-automatic method to obtainthe myocardial contours [1, 2]. Even the numerous publi-cations that describe automatic methods for myocardium de-lineation, involving shape and appearance models [3, 4], de-formable meshes [4], level sets [5, 6] or graph-cuts [7], aredesigned for cine images.The main difficulty with processing LE CMR volumes is
the non-homogeneous intensity of the myocardium resultingfrom contrast agent accumulation in infarcted areas. How-ever, the patient does not move between the cine and LE ac-quisitions, it is thus interesting to use a segmentation resultobtained on the cine data as prior knowledge to automaticallysegment the myocardium in the LE volume, as proposed byDikici et. al. [8]. The main challenge in this approach comesfrom the unintentional patient movements due to relaxationand breathing between the cine and LE acquisitions, whichmay induce an elastic displacement of the heart and surround-ing organs, resulting in a correspondence loss between theslices in both volumes. For this reason, instead of using a2D registration framework as in [8], we prefer a 3D approachcombined with dedicated processing on the LE volume.This paper is organised as follows: the automatic my-
ocardium segmentation method is presented in Sec. 2 andquantitatively assessed in Sec. 3, then we conclude in Sec. 4.
225978-1-4244-2003-2/08/$25.00 ©2008 IEEE ISBI 2008
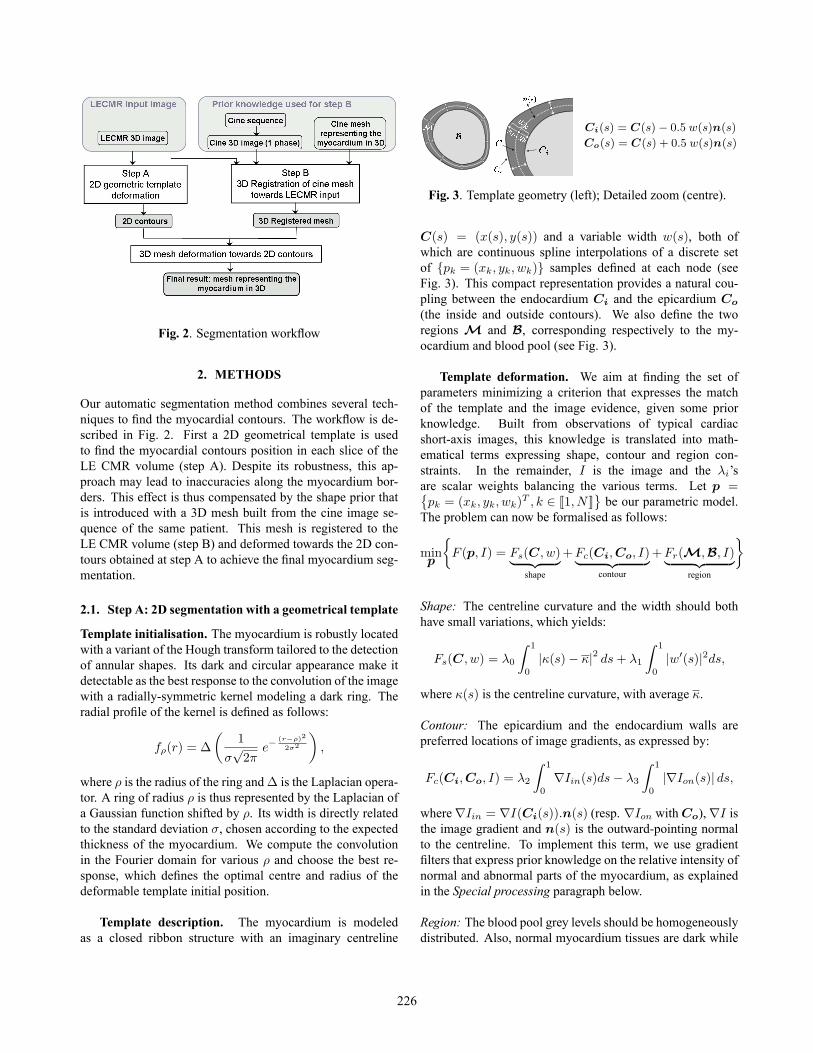
Fig. 2. Segmentation workflow
2. METHODS
Our automatic segmentation method combines several tech-niques to find the myocardial contours. The workflow is de-scribed in Fig. 2. First a 2D geometrical template is usedto find the myocardial contours position in each slice of theLE CMR volume (step A). Despite its robustness, this ap-proach may lead to inaccuracies along the myocardium bor-ders. This effect is thus compensated by the shape prior thatis introduced with a 3D mesh built from the cine image se-quence of the same patient. This mesh is registered to theLE CMR volume (step B) and deformed towards the 2D con-tours obtained at step A to achieve the final myocardium seg-mentation.
2.1. Step A: 2D segmentation with a geometrical template
Template initialisation. The myocardium is robustly locatedwith a variant of the Hough transform tailored to the detectionof annular shapes. Its dark and circular appearance make itdetectable as the best response to the convolution of the imagewith a radially-symmetric kernel modeling a dark ring. Theradial profile of the kernel is defined as follows:
fρ(r) = Δ
(1
σ√
2πe−
(r−ρ)2
2σ2
),
where ρ is the radius of the ring andΔ is the Laplacian opera-tor. A ring of radius ρ is thus represented by the Laplacian ofa Gaussian function shifted by ρ. Its width is directly relatedto the standard deviation σ, chosen according to the expectedthickness of the myocardium. We compute the convolutionin the Fourier domain for various ρ and choose the best re-sponse, which defines the optimal centre and radius of thedeformable template initial position.
Template description. The myocardium is modeledas a closed ribbon structure with an imaginary centreline
Ci(s) = C(s)− 0.5 w(s)n(s)
Co(s) = C(s) + 0.5 w(s)n(s)
Fig. 3. Template geometry (left); Detailed zoom (centre).
C(s) = (x(s), y(s)) and a variable width w(s), both ofwhich are continuous spline interpolations of a discrete setof {pk = (xk, yk, wk)} samples defined at each node (seeFig. 3). This compact representation provides a natural cou-pling between the endocardium Ci and the epicardium Co
(the inside and outside contours). We also define the tworegions M and B, corresponding respectively to the my-ocardium and blood pool (see Fig. 3).
Template deformation. We aim at finding the set ofparameters minimizing a criterion that expresses the matchof the template and the image evidence, given some priorknowledge. Built from observations of typical cardiacshort-axis images, this knowledge is translated into math-ematical terms expressing shape, contour and region con-straints. In the remainder, I is the image and the λi’sare scalar weights balancing the various terms. Let p ={pk = (xk, yk, wk)T , k ∈ �1, N�
}be our parametric model.
The problem can now be formalised as follows:
minp
{F (p, I) = Fs(C, w)︸ ︷︷ ︸
shape
+Fc(Ci,Co, I)︸ ︷︷ ︸contour
+Fr(M,B, I)︸ ︷︷ ︸region
}
Shape: The centreline curvature and the width should bothhave small variations, which yields:
Fs(C, w) = λ0
∫1
0
|κ(s)− κ|2 ds + λ1
∫1
0
|w′(s)|2ds,
where κ(s) is the centreline curvature, with average κ.
Contour: The epicardium and the endocardium walls arepreferred locations of image gradients, as expressed by:
Fc(Ci,Co, I) = λ2
∫1
0
∇Iin(s)ds− λ3
∫1
0
|∇Ion(s)| ds,
where∇Iin = ∇I(Ci(s)).n(s) (resp. ∇Ion withCo),∇I isthe image gradient and n(s) is the outward-pointing normalto the centreline. To implement this term, we use gradientfilters that express prior knowledge on the relative intensity ofnormal and abnormal parts of the myocardium, as explainedin the Special processing paragraph below.
Region: The blood pool grey levels should be homogeneouslydistributed. Also, normal myocardium tissues are dark while
226
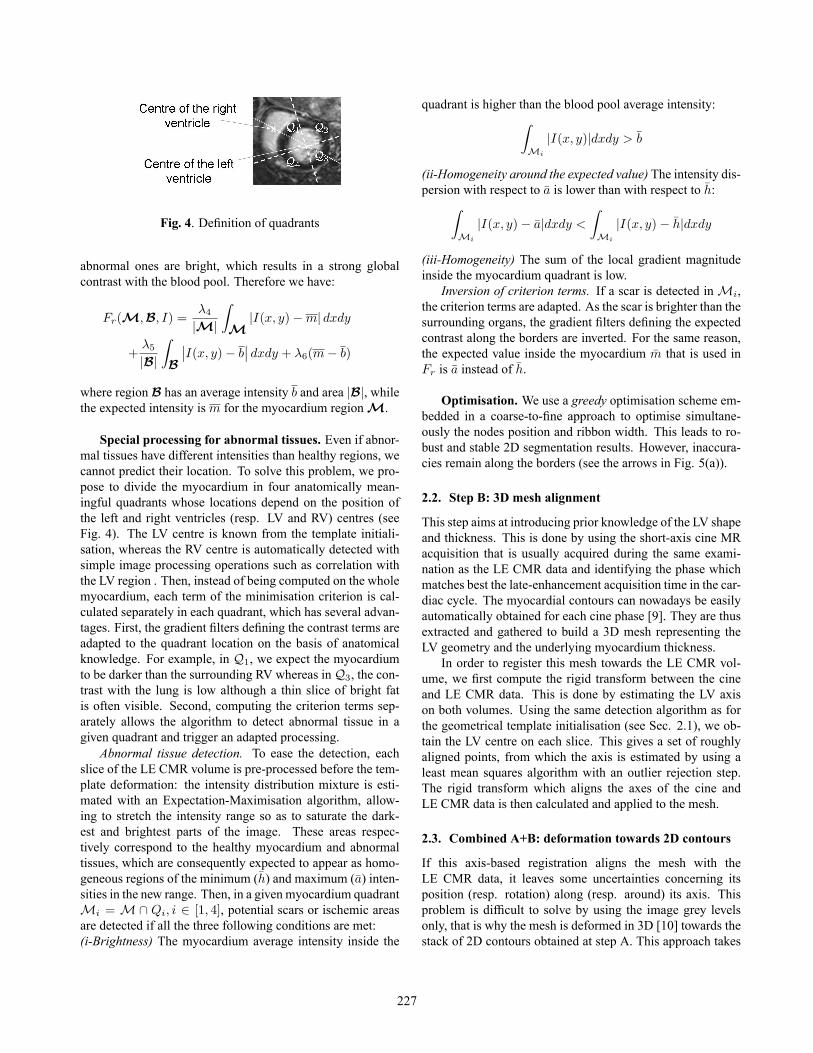
Fig. 4. Definition of quadrants
abnormal ones are bright, which results in a strong globalcontrast with the blood pool. Therefore we have:
Fr(M,B, I) =λ4
|M|∫M
|I(x, y)−m| dxdy
+λ5
|B|∫B
∣∣I(x, y)− b∣∣ dxdy + λ6(m− b)
where region B has an average intensity b and area |B|, whilethe expected intensity ism for the myocardium regionM.
Special processing for abnormal tissues. Even if abnor-mal tissues have different intensities than healthy regions, wecannot predict their location. To solve this problem, we pro-pose to divide the myocardium in four anatomically mean-ingful quadrants whose locations depend on the position ofthe left and right ventricles (resp. LV and RV) centres (seeFig. 4). The LV centre is known from the template initiali-sation, whereas the RV centre is automatically detected withsimple image processing operations such as correlation withthe LV region . Then, instead of being computed on the wholemyocardium, each term of the minimisation criterion is cal-culated separately in each quadrant, which has several advan-tages. First, the gradient filters defining the contrast terms areadapted to the quadrant location on the basis of anatomicalknowledge. For example, in Q1, we expect the myocardiumto be darker than the surrounding RV whereas inQ3, the con-trast with the lung is low although a thin slice of bright fatis often visible. Second, computing the criterion terms sep-arately allows the algorithm to detect abnormal tissue in agiven quadrant and trigger an adapted processing.Abnormal tissue detection. To ease the detection, each
slice of the LE CMR volume is pre-processed before the tem-plate deformation: the intensity distribution mixture is esti-mated with an Expectation-Maximisation algorithm, allow-ing to stretch the intensity range so as to saturate the dark-est and brightest parts of the image. These areas respec-tively correspond to the healthy myocardium and abnormaltissues, which are consequently expected to appear as homo-geneous regions of the minimum (h) and maximum (a) inten-sities in the new range. Then, in a given myocardium quadrantMi = M∩ Qi, i ∈ [1, 4], potential scars or ischemic areasare detected if all the three following conditions are met:(i-Brightness) The myocardium average intensity inside the
quadrant is higher than the blood pool average intensity:∫Mi
|I(x, y)|dxdy > b
(ii-Homogeneity around the expected value) The intensity dis-persion with respect to a is lower than with respect to h:∫
Mi
|I(x, y)− a|dxdy <
∫Mi
|I(x, y)− h|dxdy
(iii-Homogeneity) The sum of the local gradient magnitudeinside the myocardium quadrant is low.Inversion of criterion terms. If a scar is detected inMi,
the criterion terms are adapted. As the scar is brighter than thesurrounding organs, the gradient filters defining the expectedcontrast along the borders are inverted. For the same reason,the expected value inside the myocardium m that is used inFr is a instead of h.
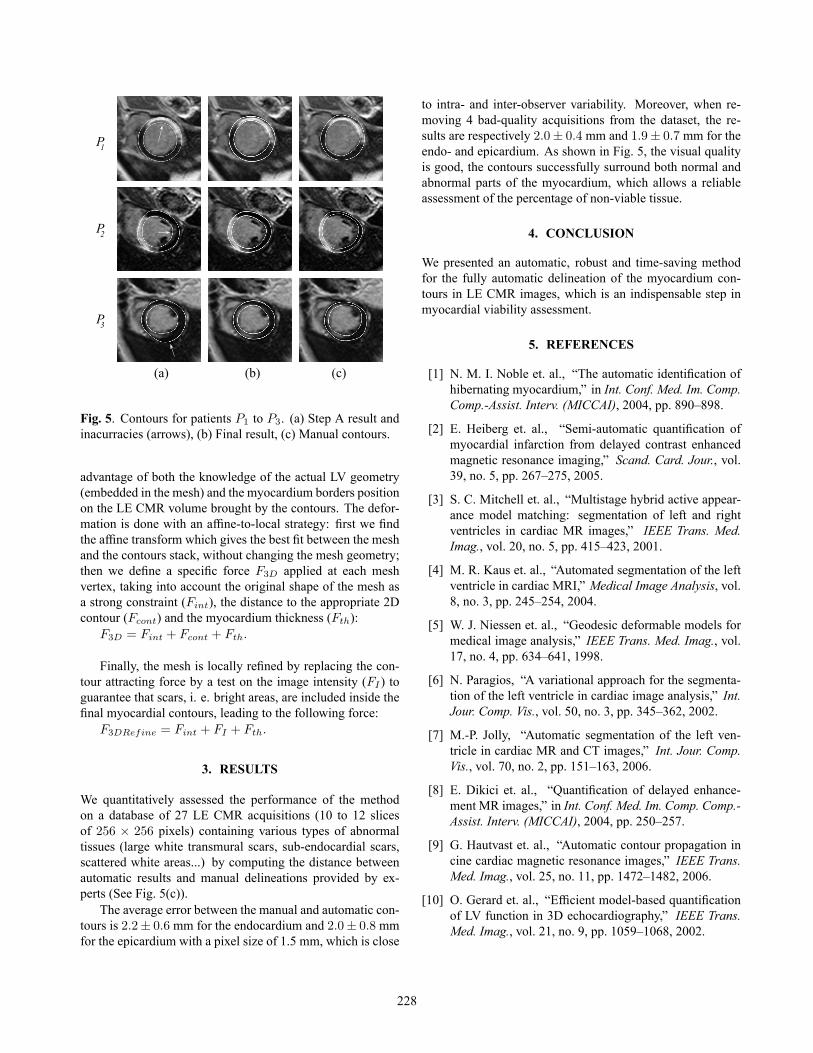
Optimisation. We use a greedy optimisation scheme em-bedded in a coarse-to-fine approach to optimise simultane-ously the nodes position and ribbon width. This leads to ro-bust and stable 2D segmentation results. However, inaccura-cies remain along the borders (see the arrows in Fig. 5(a)).
2.2. Step B: 3D mesh alignment
This step aims at introducing prior knowledge of the LV shapeand thickness. This is done by using the short-axis cine MRacquisition that is usually acquired during the same exami-nation as the LE CMR data and identifying the phase whichmatches best the late-enhancement acquisition time in the car-diac cycle. The myocardial contours can nowadays be easilyautomatically obtained for each cine phase [9]. They are thusextracted and gathered to build a 3D mesh representing theLV geometry and the underlying myocardium thickness.In order to register this mesh towards the LE CMR vol-
ume, we first compute the rigid transform between the cineand LE CMR data. This is done by estimating the LV axison both volumes. Using the same detection algorithm as forthe geometrical template initialisation (see Sec. 2.1), we ob-tain the LV centre on each slice. This gives a set of roughlyaligned points, from which the axis is estimated by using aleast mean squares algorithm with an outlier rejection step.The rigid transform which aligns the axes of the cine andLE CMR data is then calculated and applied to the mesh.
2.3. Combined A+B: deformation towards 2D contours
If this axis-based registration aligns the mesh with theLE CMR data, it leaves some uncertainties concerning itsposition (resp. rotation) along (resp. around) its axis. Thisproblem is difficult to solve by using the image grey levelsonly, that is why the mesh is deformed in 3D [10] towards thestack of 2D contours obtained at step A. This approach takes
227
(a)
P
P
P1
2
3
(c)(b)
Fig. 5. Contours for patients P1 to P3. (a) Step A result andinacurracies (arrows), (b) Final result, (c) Manual contours.
advantage of both the knowledge of the actual LV geometry(embedded in the mesh) and the myocardium borders positionon the LE CMR volume brought by the contours. The defor-mation is done with an affine-to-local strategy: first we findthe affine transform which gives the best fit between the meshand the contours stack, without changing the mesh geometry;then we define a specific force F3D applied at each meshvertex, taking into account the original shape of the mesh asa strong constraint (Fint), the distance to the appropriate 2Dcontour (Fcont) and the myocardium thickness (Fth):
F3D = Fint + Fcont + Fth.
Finally, the mesh is locally refined by replacing the con-tour attracting force by a test on the image intensity (FI ) toguarantee that scars, i. e. bright areas, are included inside thefinal myocardial contours, leading to the following force:
F3DRefine = Fint + FI + Fth.
3. RESULTS
We quantitatively assessed the performance of the methodon a database of 27 LE CMR acquisitions (10 to 12 slicesof 256 × 256 pixels) containing various types of abnormaltissues (large white transmural scars, sub-endocardial scars,scattered white areas...) by computing the distance betweenautomatic results and manual delineations provided by ex-perts (See Fig. 5(c)).The average error between the manual and automatic con-
tours is 2.2± 0.6 mm for the endocardium and 2.0± 0.8 mmfor the epicardium with a pixel size of 1.5 mm, which is close
to intra- and inter-observer variability. Moreover, when re-moving 4 bad-quality acquisitions from the dataset, the re-sults are respectively 2.0± 0.4 mm and 1.9± 0.7 mm for theendo- and epicardium. As shown in Fig. 5, the visual qualityis good, the contours successfully surround both normal andabnormal parts of the myocardium, which allows a reliableassessment of the percentage of non-viable tissue.
4. CONCLUSION
We presented an automatic, robust and time-saving methodfor the fully automatic delineation of the myocardium con-tours in LE CMR images, which is an indispensable step inmyocardial viability assessment.
5. REFERENCES
[1] N. M. I. Noble et. al., “The automatic identification ofhibernating myocardium,” in Int. Conf. Med. Im. Comp.Comp.-Assist. Interv. (MICCAI), 2004, pp. 890–898.
[2] E. Heiberg et. al., “Semi-automatic quantification ofmyocardial infarction from delayed contrast enhancedmagnetic resonance imaging,” Scand. Card. Jour., vol.39, no. 5, pp. 267–275, 2005.
[3] S. C. Mitchell et. al., “Multistage hybrid active appear-ance model matching: segmentation of left and rightventricles in cardiac MR images,” IEEE Trans. Med.Imag., vol. 20, no. 5, pp. 415–423, 2001.
[4] M. R. Kaus et. al., “Automated segmentation of the leftventricle in cardiac MRI,” Medical Image Analysis, vol.8, no. 3, pp. 245–254, 2004.
[5] W. J. Niessen et. al., “Geodesic deformable models formedical image analysis,” IEEE Trans. Med. Imag., vol.17, no. 4, pp. 634–641, 1998.
[6] N. Paragios, “A variational approach for the segmenta-tion of the left ventricle in cardiac image analysis,” Int.Jour. Comp. Vis., vol. 50, no. 3, pp. 345–362, 2002.
[7] M.-P. Jolly, “Automatic segmentation of the left ven-tricle in cardiac MR and CT images,” Int. Jour. Comp.Vis., vol. 70, no. 2, pp. 151–163, 2006.
[8] E. Dikici et. al., “Quantification of delayed enhance-ment MR images,” in Int. Conf. Med. Im. Comp. Comp.-Assist. Interv. (MICCAI), 2004, pp. 250–257.
[9] G. Hautvast et. al., “Automatic contour propagation incine cardiac magnetic resonance images,” IEEE Trans.Med. Imag., vol. 25, no. 11, pp. 1472–1482, 2006.
[10] O. Gerard et. al., “Efficient model-based quantificationof LV function in 3D echocardiography,” IEEE Trans.Med. Imag., vol. 21, no. 9, pp. 1059–1068, 2002.
228