automatedsleepscoringusingunsupervised learningofmeta-features · chapter1 introduction sleep is an...
TRANSCRIPT

Automated sleep scoring using unsupervisedlearning of meta-features
SEBASTIAN OLSSON
Master’s Thesis at CSCSupervisor: Pawel Herman
Examiner: Erik Fransén


AbstractSleep is an important part of life as it affects the performance of one’sactivities during all awake hours. The study of sleep and wakefulness istherefore of great interest, particularly to the clinical and medical fieldswhere sleep disorders are diagnosed. When studying sleep, it is com-mon to talk about different types, or stages, of sleep. A common taskin sleep research is to determine the sleep stage of the sleeping subjectas a function of time. This process is known as sleep stage scoring. Inthis study, I seek to determine whether there is any benefit to usingunsupervised feature learning in the context of electroencephalogram-based (EEG) sleep scoring. More specifically, the effect of generatingand making use of new feature representations for hand-crafted fea-tures of sleep data – meta-features – is studied. For this purpose, twoscoring algorithms have been implemented and compared. Both scor-ing algorithms involve segmentation of the EEG signal, feature extrac-tion, feature selection and classification using a support vector machine(SVM). Unsupervised feature learning was implemented in the form ofa dimensionality-reducing deep-belief network (DBN) which the featurespace was processed through. Both scorers were shown to have a classifi-cation accuracy of about 76 %. The application of unsupervised featurelearning did not affect the accuracy significantly. It is speculated thatwith a better choice of parameters for the DBN in a possible futurework, the accuracy may improve significantly.

ReferatAutomatiserad sömnmätning med användning av
oövervakad inlärning av meta-särdragSömn är en viktig del av livet eftersom den påverkar ens prestation underall vakna timmar. Forskning om sömn and vakenhet är därför av stortintresse, i synnerhet för de kliniska och medicinska områdena där sömn-besvär diagnostiseras. I forskning om sömn är det är vanligt att tala omolika typer av sömn, eller sömnstadium. En vanlig uppgift i sömnforsk-ning är att avgöra sömnstadiet av den sovande exemplaret som en funk-tion av tiden. Den här processen kallas sömnmätning. I den här studienförsöker jag avgöra om det finns någon fördel med att använda oöver-vakad inlärning av särdrag för att utföra elektroencephalogram-baserad(EEG) sömnmätning. Mer specifikt undersöker jag effekten av att ge-nerera och använda nya särdragsrepresentationer som härstammar frånhandgjorda särdrag av sömndata – meta-särdrag. Två sömnmätningsal-goritmer har implementerats och jämförts för det här syftet. Sömnmät-ningsalgoritmerna involverar segmentering av EEG-signalen, extraktionav särdragen, urval av särdrag och klassificering genom användning aven stödvektormaskin (SVM). Oövervakad inlärning av särdrag imple-menterades i form av en dimensionskrympande djuptrosnätverk (DBN)som användes för att bearbeta särdragsrymden. Båda sömnmätarna vi-sades ha en klassificeringsprecision av omkring 76 %. Användningen avoövervakad inlärning av särdrag hade ingen signifikant inverkan på pre-cisionen. Det spekuleras att precisionen skulle kunna höjas med ett merlämpligt val av parametrar för djuptrosnätverket.

AcknowledgementsI would like to thank
• Farhad Abtahi for providing and giving pointers to relevant liter-ature.
• Pawel Herman for ensuring that the thesis holds up to standardsby providing detailed and thought-provoking feedback.
• Andreas Olsson for designing the cover art.

Contents
1 Introduction 11.1 Problem statement . . . . . . . . . . . . . . . . . . . . . . . . . . . . 4
1.1.1 Goals . . . . . . . . . . . . . . . . . . . . . . . . . . . . . . . 41.2 Assumptions . . . . . . . . . . . . . . . . . . . . . . . . . . . . . . . 5
2 Background 72.1 EEG-based sleep scoring . . . . . . . . . . . . . . . . . . . . . . . . . 7
2.1.1 Data . . . . . . . . . . . . . . . . . . . . . . . . . . . . . . . . 72.1.2 Features . . . . . . . . . . . . . . . . . . . . . . . . . . . . . . 82.1.3 Classification . . . . . . . . . . . . . . . . . . . . . . . . . . . 10
2.2 Unsupervised feature learning with DBNs . . . . . . . . . . . . . . . 122.2.1 EEG waveforms . . . . . . . . . . . . . . . . . . . . . . . . . 132.2.2 Application to sleep . . . . . . . . . . . . . . . . . . . . . . . 132.2.3 Emotion classification . . . . . . . . . . . . . . . . . . . . . . 14
3 Method 153.1 Data . . . . . . . . . . . . . . . . . . . . . . . . . . . . . . . . . . . . 153.2 Scoring . . . . . . . . . . . . . . . . . . . . . . . . . . . . . . . . . . 16
3.2.1 Segmentation . . . . . . . . . . . . . . . . . . . . . . . . . . . 163.2.2 Feature extraction . . . . . . . . . . . . . . . . . . . . . . . . 183.2.3 Partitioning . . . . . . . . . . . . . . . . . . . . . . . . . . . . 193.2.4 Feature classification . . . . . . . . . . . . . . . . . . . . . . . 193.2.5 Feature selection . . . . . . . . . . . . . . . . . . . . . . . . . 20
3.3 Unsupervised processing . . . . . . . . . . . . . . . . . . . . . . . . . 223.3.1 Deep belief network . . . . . . . . . . . . . . . . . . . . . . . 22
3.4 Evaluation . . . . . . . . . . . . . . . . . . . . . . . . . . . . . . . . . 263.4.1 Scorer performance . . . . . . . . . . . . . . . . . . . . . . . . 263.4.2 Scorer comparison . . . . . . . . . . . . . . . . . . . . . . . . 273.4.3 Restricted search performance . . . . . . . . . . . . . . . . . 27
4 Results 29
5 Discussion 355.1 Classification performance . . . . . . . . . . . . . . . . . . . . . . . . 35

5.2 Scorer comparison . . . . . . . . . . . . . . . . . . . . . . . . . . . . 365.3 Future work . . . . . . . . . . . . . . . . . . . . . . . . . . . . . . . . 37
6 Conclusion 39
Bibliography 41
7 List of figures 47
Appendices 47
A Source code 49


Chapter 1
Introduction
Sleep is an important part of life as it affects the performance of one’s activitiesduring all awake hours. The study of sleep and wakefulness is therefore of greatinterest, particularly to the clinical and medical fields where sleep disorders arediagnosed. Sleep apnea is an example of a common disorder characterized by havingfrequent, short breathing pauses during sleep. If left untreated, this disorder canincrease the risk of more severe medical conditions such as stroke, diabetes, heartattack and even heart failure [1].
There are also commercial products that are based around the study of sleep. Anexample is the smartphone app SleepBot [4], which tracks the bed movements andsounds of the sleeping user in order to deduce the nature of his/her sleep. The appcan then use this information to set off the alarm when it deems that the user hasgotten enough sleep – this feature is often known as a smart alarm [5].
Movement tracking and audio recording are two among many types of measure-ments collected during sleep used for its post-hoc examination. Another way isto measure the electrical activity at the scalp over time, resulting in an electroen-cephalogram (EEG). Similarily, doing the same thing with a heart will result in anelectrocardiogram (ECG). These are commonly called biosignals, as they are theresult of measuring some physical quantity of a biological entity over time. Whenseveral biosignals are in place for recording a sleeping subject, the result is called apolysomnogram (PSG). An example of a PSG is illustrated in Figure 1.1.
When studying sleep, it is common to talk about different types, or stages, ofsleep. This has turned out to be practical since sleep is often considered to be aprocess where transitions are being made between several states that have differentcharacteristics. In 1937, scientist Alfred Lee Loomis was the first to describe fivedistinct sleep stages [3]. These were later standardized by Allan Rechtschaffen andAnthony Kales in a manual commonly referred to under the name “R&K.” In it, thestages were given the names REM, S1, S2, S3 and S4 [7]. In 2007, the American
1

CHAPTER 1. INTRODUCTION
Figure 1.1. Polysomnogram example consisting of signals for EEG, ECG and bloodpressure.
Academy of Sleep Medicine (AASM) published a revision of the R&K standardwhere S1 and S2 were renamed to N1 and N2. More importantly, S3 and S4 werecombined into a single stage named N3 [6].
A common task in sleep research is to, given a PSG, determine the sleep stageof the sleeping subject as a function of time. This process is called sleep stagescoring. Scoring sleep can be done manually by letting an expert physician inferthe sleep stage simply by inspecting the PSG, using the AASM or R&K standardas a guideline. This results in a hypnogram – a graph of the sleep stages over time.Figure 1.2 illustrates an example.
Scoring sleep manually has drawbacks. First of all, it requires an expert physicianto study the PSG and assign sleep stage labels to portions of it, which could be anexpensive and time-consuming process. Secondly, the hypnogram that this physicianproduces will generally differ from that of another physician. This is because sleepscoring standards such as the AASM manual define merely a set of guidelines –rather than objective critera – for doing manual scoring. Moreover, the sleep stagesand scoring guidelines are artificial and may not accurately model the true nature ofsleep. Because of these concerns, researchers have devised ways of carrying out thistask by machine. These so-called automatic sleep scorers are typically computerprograms that are based on some machine learning algorithm [55, p.95]. Such analgorithm takes as input some PSG, which often consists of data for only a singlebiosignal, often EEG. The task of the program is then to analyze the signal andgenerate a hypnogram for it. An important step in doing this is often to extractfeatures to quantify signal characteristics of the biosignal.
Some learning algorithms for sleep scoring are supervised in the sense that they aretrained on labeled data. This means that the algorithm takes as input a portion ofthe signal as well as a manually crafted hypnogram for this portion. This producesa classifier which is capable of assigning hypnograms to other portions of the signal.An example of this approach is presented in a sleep scoring research paper byGudmundsson et al. [24], where a support vector machine (SVM) classifier was
2

Figure 1.2. Hypnogram example based on the R&K classification of sleep stages.
trained on labeled EEG data according to the R&K standard. This classifier wasthen used for assigning unlabeled data to one of four categories: wakefulness, lightsleep, slow-wave sleep and REM-sleep.
Other approaches to sleep scoring are based purely on unsupervised learning, mean-ing that no class labels are involved in training the model. Such an approach wouldgroup the data into some sort of categories which then can be made to correspondto sleep stages, resulting in a hypnogram. The natural benefit of this type of ap-proach is that it enables the use of unlabeled data, which is generally abundant [8,p. 9]. Another reason for doing this could be that it is then no longer necessary totreat manually scored data as a ground truth reference for one’s study. Unsuper-vised learning techniques have also been used for detecting anomalies in the data,such as faulty measurements stemming from a loose electrode [8, p.7]. In his thesis[20], Jin Xing presents a fuzzy clustering algorithm as a proposed application ofthis approach. Based solely on the structure of the data, the algorithm success-fully separates the data into two fuzzy clusters grouped into wakefulness and sleep,respectively.
There also exist approaches that are supervised in nature but incorporate unsu-
3

CHAPTER 1. INTRODUCTION
pervised learning techniques in some way, often deep belief networks (DBN). D.F.Wulsin et al. [17] have demonstrated how DBNs can be applied in a semi-supervisedway for the classification of EEG data, among other things. In another paper byMartin Längkvist et al. [8], this idea is applied specifically to sleep scoring, wherethe authors explore how the addition of an unsupervised component consisting ofa DBN used for reorganizing the sleep data affects the performance compared to aregular supervised scorer. This particular application is especially relevant for thisstudy as I will rely on a similar experimental setup as in Längkvist et al. [8].
1.1 Problem statement
The purpose of this study is to find out if the addition of an unsupervised featurelearning component to a supervised sleep scorer for EEG enhances its classificationperformance, i.e. if it increases the similarity between the produced hypnogram andthe target hypnogram for a set of data. Classfication performance is here definedas the sleep scoring performance evaluated with reference to clinical annotations.The unsupervised feature learning component will be a DBN consisting of a set ofstacked Restricted Boltzmann machines (RBM).
My hypothesis is that the unsupervised feature learning component does help. Thepreviously discussed paper by Wulsin et al. [17] is based on a similar classificationapproach using a DBN, and the authors find the performance of this approach to becomparable to the other three supervised learning approches presented [17, p.11].More remarkably, this approach is shown to have the highest average performancefor one of the three used datasets [17, p.6]. This suggests that combining unsu-pervised and supervised methods could improve the classification accuracy. Likein the approach presented in this paper, unsupervised training is done first, in thiscase in the form of training a deep belief network (DBN) composed of RestrictedBoltzmann machines (RBM) followed by backpropagation. This DBN is then usedfor supervised learning, fine-tuned with backpropagation [17].
Längkvist’s study suggests a similar conclusion. Out of the three approaches tested,the DBN based approach named feat-DBN is shown to achieve the highest accuracy.It should be noted that this particular DBN based approach is similar to the onepresented in this study. The main difference is that while Längkvist’s study involvessupervised fine-tuning of the DBN, the DBN setup presented in this paper skips thisstep entirely – as such, this feature learning component becomes fully unsupervised.
1.1.1 Goals
The goal of this project is to implement a method for scoring sleep automaticallyusing biosignal data at the request of KTH School of Technology and Health. Twoscoring approaches are implemented and the program evaluates and compares their
4

1.2. ASSUMPTIONS
respective performances in order to address the scientific question posed above.The two approaches are identical except that one of the approaches includes anunsupervised learning algorithm that organizes the input biosignal feature spacebefore undergoing feature selection and classification. Organizing the feature spaceresults in a different representation of the feature space, from which new featurescan be extracted. These are then to be used for improving classification accuracy.
1.2 Assumptions
• Sleep stage annotations used in this project have been scored according toa manual and subjective process, and may contain what some sleep expertswould consider to be errors. In this paper I will assume that those annotationsreflect the nature of the data and treat them as the ground truth reference.
• I will disregard the fact that some EEG data may contain anomalies, such asfaulty measurements stemming from a loosely attached electrode.
• Annotations based on the R&K terminology can be translated into AASM-based annotations simply by replacing NREM stages 3 and 4 with the AASMequivalent N3.
5


Chapter 2
Background
Ever since the R&K guidelines were introduced as a standard for visual sleep scoring,the benefits of automatic sleep scoring have attracted many research groups. In thischapter, I will show how this study relates to previous work by giving an overviewof the state-of-the-art in automated sleep scoring with EEG. I will also go over therole of unsupervised feature learning in the context of sleep scoring.
2.1 EEG-based sleep scoring
Sleep scoring can roughly be dividied into three topics: collecting the biosignal data,extracting features from the data and doing classification to produce a hypnogram.
2.1.1 Data
The original recommendation presented in the R&K standard was to make use ofseveral biosignals for sleep scoring: one EEG lead, two EOG leads and an EMGlead [32]. Many studies today, however, make exclusive use of one or more EEGchannels since it is often thought of being sufficient for capturing the necessary sleepstage information [33, p.20]. Until recently, this may also have been done becauseof a lack of processing power, or in an effort to simplify the scoring algorithms [33,p.20].
Collecting EEG data is a fairly predictable process: you get hold of a number ofvolunteers, place electrodes along the scalp, measure the EEG activity while thesubjects are asleep and store the data in some format. In addition, an expertphysician may provide sleep stage labels for the data. The details of the making ofsuch a database are normally documented in a supplementary paper. One exampleis the MIT-BIH Polysomnographic Database [34], which involved 60 male subjects
7

CHAPTER 2. BACKGROUND
with a mean age of 40, some of which were suffering from sleep apnea syndrome. Thisdatabase was used by the previously mentioned Xing [20] for doing unsupervisedwake/sleep scoring.
2.1.2 Features
Automated sleep scoring usually involves extraction of some features of the biosignal.The types of features used in the literature and how they are extracted will now bediscussed.
Non-stationarity
Polysomnographic signals are by character non-stationary [27, p.24]. This entailsthat many signal processing techniques cannot be safely used, since a preconditionfor using them is often that the signals are stationary.
To work around this problem, a biosignal is usually divided into multiple intervals– segments – that are then examined individually. If a segment is small enough,the signal can be considered approximately stationary within that segment. Thedownside of short segments, however, is that the temporal resolution decreases,which negatively affects the reliability of signal processing algorithms. The segmentlength to choose is therefore always a tradeoff between these factors.
Sleep scoring researchers carry out segmentation in similar but slightly differentways. The most common approach is to partition the signal into equally long seg-ments (often 30 seconds long) with no overlap between the segments. This approachis employed in [11], where sleep EEG is segmented into non-overlapping uniform one-second segments that are used for identifying structure in EEG recordings. Despitethe simplicity of the segmentation method, the classifier achieves a mean accuracyof about 70 %, a figure the authors deem to be good performance [11, p. 5092].
An alternative to deciding on a fixed segment length beforehand is to adapt thelength of a segment to the location in the signal. Longer segments are justified inthe more stationary portions of the signal, while shorter segments should be usedwhen there are rapid changes. This approach provides a better balance betweenthe two factors described above, but also comes with increased complexity. Doingadaptive segmentation is a form of Catch-22: in order to do segmentation it isnecessary to examine the signal, but the reason for doing segmentation in the firstplace is to be able to examine the signal. For this reason, this step may need tobe more tied into the rest of the sleep scoring process. Praetorius et al. [35] werethe first to try adaptive segmentation in the context of EEG analysis. Creutzfeldtet al. [37] found the method satisfactory compared to uniform segmentation, andBarlow et al. [36] found it to minimize human bias in selecting segments.
8

2.1. EEG-BASED SLEEP SCORING
Temporal features
Temporal features are features of the signal in the time domain. These are normallyeasy to compute since transforms are not necessary. The simplest and most widelyused temporal features in EEG analysis are statistical measures such as mean, vari-ance, amplitude, skewness, kurtosis and mode [27, p.25].
Another popular choice of features for sleep scoring researchers are Hjorth parame-ters. More generally, these are widely used in EEG analysis where they originated[38]. They are widely used by sleep scoring researchers including Xing [20, p.21]and Gudmundsson. Prior to calculating these parameters, Gudmundsson appliesa 30 Hz high-cut filter to the signal – this is done because Hjorth parameters aresensitive to noise [24, p.4]. Xing does not appear to do any filtering, but it is unclearhow this affects the accuracy of his scorer.
Spectral features
The most common type of extracted features in EEG sleep analysis are spectralfeatures – parameters that characterize the signal in the frequency domain. Trans-forming a signal into the frequency domain usually relies on the signal being station-ary, making segmentation especially important [27, p.25]. The transformed signalis usually divided into five frequency bands, and spectral features are extractedfrom each band. This was done in Längkvist’s study, where five of the 28 extractedfeatures were relative power features, extracted from the five bands. Not all studiesinvolve five frequency bands: Gudmundsson’s study employs up to ten bands forextracting relative power features.
Two well-known features in sleep analysis are sleep spindles and K-complexes. Stan-dard transforms (Discrete or Fast Fourier) have been found to be unsuitable for these[39]. An alternative to these tranforms is the wavelet transform, which works betterwith non-stationary signals such as sleep EEG [40]. In [41], Malina et al. used thistransform for analyzing sleep spindles. In [42], Oropesa et al. used spectral featuresderived from the wavelet transform together with a neural network classifier to doautomated sleep scoring with 70 to 80 % accuracy, a result they deemed to be animprovement compared to using a Fourier transform.
Reduction and meta-features
Many approaches to sleep scoring involve a feature selection step. In [10], Löfhedeet al. extracted 22 handcrafted features for the purpose of classifying backgroundEEG in infants. In addition to these, however, another 88 so-called meta-featureswere extracted by computing the mean, variance, skewness and kurtosis of the 22feature signals. With this many features, it becomes necessary to discard some of
9

CHAPTER 2. BACKGROUND
them due to the curse of dimensionality. Finding out the optimal combination offeatures to choose is an intractable problem, so the authors describe a heuristicapproch based on a genetic algorithm.
Another way to reduce the number of features is to apply a transformation thatmaps the high-dimensional feature space to a low-dimensional one. In [20], Xingapplies principal component analysis (PCA) to his 19-dimensional feature space,resulting in a three-dimensional feature space which is then used for unsupervisedwake/sleep clustering. Xing also references a study by Peng et al. [12], where PCAis combined with an SVM classifier to discriminate certain sleep stages.
2.1.3 Classification
In their review of techniques for sleep analysis, Motamedi-Fakhr et al. [27] distin-guish between four kinds of classification used in state-of-the-art automated sleepscoring: neural-net-based, cluster-based, statistical, and fuzzy classification.
Classes
Before going into classification techniques, the classes themselves should be dis-cussed. Usually, an automated sleep scorer is given support to distinguish betweenall six sleep stages described in the R&K standard, or the five stages described inthe AASM standard. In some studies, however, one or more stages are bundledtogether for one reason or another. In [24], the authors use data annotated accord-ing to the R&K standard but combine stage 3 and 4 samples into a single stagewhich they call “slow-wave sleep” (SWS), with the motivation that their datasetcontains very few stage 3 samples. They also combine stage 1 and 2 samples into“light sleep” (LS). The reason for this is less clear and in fact makes the data setless balanced as roughly half of the sample space consists of LS samples.
In other cases, the reason for combining several stages lies in the research objective;it may for example sometimes be sufficent to be able to differentiate sleep fromwakefulness like in Xing’s study [20]. On a related note, if the objective is specificallyto distinguish sleep from wakefulness, there exist non-EEG-based methods whichmay or may not be more accurate, such as using actigraphs (instruments to measurewrist motor activity) [43, p.1].
Neural networks
An EEG signal is fundamentally a recording of the activity in the vast networkof biological neurons known as the brain. Considering the complexity of such anetwork, one would think that it is only appropriate to analyze a signal derivedfrom it by using a tool of similar complexity: an artifical neural network.
10

2.1. EEG-BASED SLEEP SCORING
In particular, the multi-layer perceptron (MLP) is often used for doing supervisedsleep stage classification. One advantage is its capability to deal with complexclassification problems, including those that are not linearly separable [27, p.28].This is demonstrated in a K-complex detection study by Bankman et al. [45],where the classification performance of different MLPs are compared to Fisher’slinear discriminant (LD), a statistical classifier. Four simple feature-based MLPsare studied, with 2, 3, 4, and 5 hidden layers, respectively. It is found that thefalse positive rate of Fisher’s LD is roughly twice as high as the four feature-basedMLP studied (around 19 % for a true positive rate of 90 %). As a side note, thestudy also evaluates an MLP consisting of 30 hidden layers which is based on rawdata instead of features of the data. It turns out to perform very poorly: the falsepositive rate is roughly 47 % for a true positive rate of 90 %. Besides classification,MLPs can be used for transient event detection and diagnosing obstructive sleepapneas [44].
Statistical classifiers
In the previously mentioned study by Gudmundsson et al. [24], two classificationmethods were compared: the SVM and the k-nearest-neighbor (k-NN) classifier.The number of clusters was fixed: k = 30. Although not expressed clearly, itappears that a radial-basis-function (RBF) kernel was used for the SVM. The twoclassifiers turned out to have roughly the same accuracy. However, this accuracyappeared to be strongly affected by the features set used. Three different featuresets were extracted:
• The set of three Hjorth parameters mentioned earlier. This feature set gaveSVM an accuracy of 71 % and k-NN 69%.
• Ten spectral features, each being the relative power of one of the ten frequencybands, along with an additional feature for the median frequency of the signaland one feature for the spectral entropy. This gave both classifiers an accuracyof 75 %.
• Histogram features based on amplitude and frequency distribution. This gaveSVM an accuracy of 76 % and k-NN 79 %.
This suggests that the set of histogram features gave the best results, for whichk-NN performed slightly better. In addition, a post-processing decision rule basedon posterior probabilities is used to further increase this accuracy up to 81 %. Theauthors comment that it has previously been found that inter-scorer agreement –i.e. the degree to which the manually scored annotations of medical experts agree– ranges from 67 % to 91 % [46]. The degree of agreeness is altered by severalfactors including the segment length and the people being involved. Because of thesignificant level of disagreement among people doing manual scoring, the authors
11
CHAPTER 2. BACKGROUND
argue that an accuracy of 81 % may be considered good enough to be clinicallyuseful [24, p.6].
Besides LDA and SVM, another common statistical classifier in EEG sleep analyis isthe hidden Markov model (HMM). It is often extended into a Gaussian observationHMM (GOHMM) to allow for continuous observation symbols. In [47], Flexer etal. use a 3-state GOHMM for sleep stage classification which turns out to performpoorly (41.5 % accuracy). The wakefulness and S4 stages are found to have a muchhigher true positive ratio (86 % and 81 %) than the other stages (around 20 %).Furthermore, S1 is often classified as wakefulness (53 % of the time), S2 is oftenmistaken for REM (43 %), and S3 is often mistaken for S4 (51 %), showing that somestages are more distinguishable than others. HMMs may work better when actingas a complement to another classifier. In Längkvist’s study, an GOHMM is used toaccurately capture sleep stage switching, improving the classification accuracy.
Clustering and fuzzy classifiers
Clustering is sometimes used in an unsupervised fashion for scoring sleep becauselabels are not available or because they originate from a subjective scoring process.Xing uses a form of fuzzy k-means clustering to separate wakefulness samples fromsleep samples without the need for labels [20, p.19]. This is also an example of afuzzy classifier, a type of classifier sometimes used in sleep EEG analysis becausethe boundaries between samples belonging to different sleep stages are sometimesnot clear. Of the 16 records used in the study, 14 give a satisfactory (above 75%) accuracy. Since it is usually valuable to divide sleep data into more than twoclusters, the author suggests as an extension to his study a hierachical clusteringapproach where the sleep cluster is further divided into a REM and NREM cluster,NREM is divided into N3 and N1/N2, and N1/N2 is divided into N1 and N2 [20,p.46]. This hierachy differs from that of another study [48], where sleep is insteaddivided into N1/REM and N2/N3. This hierarchy is probably more appropriatesince it is computationally generated via ascending hierarchical clustering (AHC)while Xing’s hierarchy is only a suggestion.
2.2 Unsupervised feature learning with DBNs
Unsupervised feature learning is the act of learning features from data without theuse of labels. Use in automated sleep scoring or EEG analysis has been very sparseand, to my knowledge, solely DBN-based. A recent study by Zheng [49] as wellas the previously mentioned papers by Wulsin and Längkvist, respectively, are theonly ones I found that involve this topic.
12

2.2. UNSUPERVISED FEATURE LEARNING WITH DBNS
2.2.1 EEG waveforms
In [17], Wulsin et al. demonstrated how deep learning can be used for classificationand anomaly detection of EEG waveforms. The authors commented that DBNsare traditionally used for two-dimensional image data such as the MNIST dataset.They are rarely applied to time-series data such as EEG, making this a largelyunexplored field. It was shown that a DBN composed of several stacked RBMsprove to have a performance comaparable to that of a standard classifier. In termsof execution time, the DBN prove to be significantly faster than an RBF-kernelSVM and a k-nearest-neighbors classifier. Unlike many other classfiers that rely onextracted features, the DBN was shown to perform well when operating on the rawdata, especially for anomaly measurement.
2.2.2 Application to sleep
Längkvist’s paper [8] expanded on Wulsin’s work and applied it specifically to au-tomated sleep scoring. Besides EEG, EOG and EMG biosignals were also used asinput. The idea was to study the ways a DBN can be used for feature selection inorder to eliminate the use of handcrafted features. He proposed three experimentalsetups for scoring sleep:
• feat-GOHMM : This approach relies on prior knowledge and does not make useof a DBN, but is used as a benchmark for the two other approaches. The rawdata undergoes feature extraction and selection, then PCA to further reducedimensionality, followed by a Gaussian mixture model, and lastly an HMMto increase performance. Feature selection is done greedily, using sequentialbackward selection (SBS). This approach has an accuracy of 63.9 %.
• raw-DBN : This approach does not make use of any features. Instead, the rawdata is immediately passed to a DBN composed of two RBMs with 200 hiddenlayer units in each, followed by an HMM. Unlike the MLP in the previouslymentioned study by Bankman [45], this approach actually turns out to have adecent accuracy of 67.4 % – even higher than the supervised and feature-basedGOHMM approach.
• feat-DBN : Similar to raw-DBN, but the raw data first undergoes feature ex-traction of 28 features. The biases of the hidden units are set to −4 to en-courage sparsity. Training the DBN consists of an unsupervised layerwise pre-training step, followed by unsupervised fine-tuning of the DBN with backprop-agation and finally supervised fine-tuning of the DBN with backpropagation.Like in the two other approaches, the output forms the input to an HMM.This approach has a 72.2 % accuracy.
The feat-DBN approach is particularly relevant to this study since the output ofthe DBN is a new feature representation which are meta-features of the extracted
13

CHAPTER 2. BACKGROUND
features. However, the DBN is not truly unsupervised since it involves a supervisedbackpropagation step, where labels are involved. The reason the authors still con-sider this to be an instance of unsupervised feature learning may be that the DBNis not built as a supervised DBN, e.g., there is no “labels layer” in the network thatdirectly corresponds to sleep stages. Wulsin instead uses the term “semi-supervised”[17, p.6].
2.2.3 Emotion classification
A recently published study by Zheng et al. [49] expands on Längkvist’s work byreusing Längkvist’s feat-DBN approach, albeit with a different DBN topology. Theresearch objective is different however: instead of classifying data according to sleepstages, it is classified into either positive or negative emotional states. Data iscollected by having the test subjects watch emotional movie clips, thereby elicitingpositive or negative emotions. Only EEG is used as input.
Feat-DBN is compared to four other experimental setups: one SVM-based, one k-NN-based, one based on a Graph regularized Extreme Learning Machine (GELM),and one that mimics feat-DBN but omits the HMM. The DBN-HMM and DBNapproaches were shown to be most accurate (87.62 % and 86.91 %) although theother approaches were not far behind (85.67 % for GELM, 84.08 % for SVM and69.66 % for k-NN).
14

Chapter 3
Method
This chapter aims to describe the biosignal data, the two scoring algorithms andhow their performances are compared. In section 3.2 I will go over the componentsof the scoring algorithm that does not include unsupervised feature learning – I willrefer to this algorithm as scorer A. The unsupervised feature learning componentof the other algorithm, named scorer B, is described in section 3.3.
3.1 Data
Ten records of the SHHS database have been used throughout this study. Thedatabase contains measurements of many biosignals including ECG, EMG and EOGas well as two EEG signals labeled EEG1 and EEG2. Only the EEG1 channel hasbeen used in this study for the sake of simplicity and because it is stated to be thevisually “cleaner” of the two [51]. This signal is derived bipolarly from applying agold cup electrode to the C4 region of the scalp and another electrode to the A1region (left ear) [50]. The sampling rate is 125 Hz and a high-pass filter of 0.15 Hzhas been applied.
For each record in the database there is an EDF file containing the biosignals and aCSV file associating a sleep stage to each epoch. There are also a couple of XML filescontaining additional information, such as the occurrence of hypopneas. The signaland annotations were read from these files. The ten EEG signals are divided into30 second epochs, with each epoch being labeled with a sleep stage. As the signalis labeled according to the R&K standard, sleep stages S3 and S4 were combinedinto a single stage, N3, to comply with the AASM standard.
Table 3.1 displays the number of epochs in each record and what sleep stage theyare associated with.
15

CHAPTER 3. METHOD
Table 3.1. The number of 30-second epochs assigned a certain sleep stage label foreach record and label.
N1 N2 N3 REM Wakefulness TotalSHHS1-200001 47 457 145 102 333 1084SHHS1-200002 3 239 61 61 715 1079SHHS1-200003 35 289 307 86 332 1049SHHS1-200004 18 177 315 92 273 875SHHS1-200005 42 508 99 91 344 1084SHHS1-200006 48 529 39 158 310 1084SHHS1-200007 18 459 40 148 254 919SHHS1-200008 15 362 213 81 288 959SHHS1-200009 38 298 236 131 383 1086SHHS1-200010 11 491 163 168 251 1084
3.2 Scoring
The sleep scoring algorithms were written in MATLAB. Figure 3.1 gives an overviewof the internals of scorer A and scorer B. Scorer B is similar to scorer A but includesan unsupervised processing step which is described in section 3.3. The scorers takeas input an EEG signal consisting of a sequence of 30-second epochs, along withsleep stage annotations associated to these epochs. Its performance is evaluated bycomparing the labels that the scorer predicts to the test set labels. The intermediatesteps will be described in more detail in the upcoming sections.
3.2.1 Segmentation
Because there is a 30 second interval between sleep stage labels in the signal, itis practical to divide the signal into 30/N second segments, where N is a positiveinteger. This way, there will be N segments for every 30 second epoch, and everysegment within that epoch gets the same label as the epoch. For this study I havechosen the simple approach of doing this with N = 1, i.e., the signal is partitionedinto segments of length 30 seconds with no overlap between the segments. In otherwords, a segment is here defined to be a 30-second epoch. This approach has beenemployed previously [11] [8].
Since the data was sampled with a sample rate of 125 Hz, each segment consists of30 · 125 = 3750 data points of the form (t, y) where t is the time at which the pointwas sampled relative to the start of the segment, and y is the measured voltage atthat time. Thus, a segment can be expressed formally as a function S that assignsa voltage S(t) to a time t in the domain set {0.00 s, 0.08 s, 0.16 s, . . . , 29.92 s}.
16

3.2. SCORING
Figure 3.1. Overview of scorer A and B. The two scorers have the same setupexcept that the step labeled Unsupervised processing is only performed for scorer B.The program loads the signal data and annotations from the database files, dividesthe signal into segments, extracts a vector of features from each segment, possiblyadds meta-features to the feature space, partitions the feature space into a trainingset and test set, and generates a set of trained classifiers of which the best is chosen.The classifier maps the test set to a set of predicted labels which are then comparedto the test set labels.
17
CHAPTER 3. METHOD
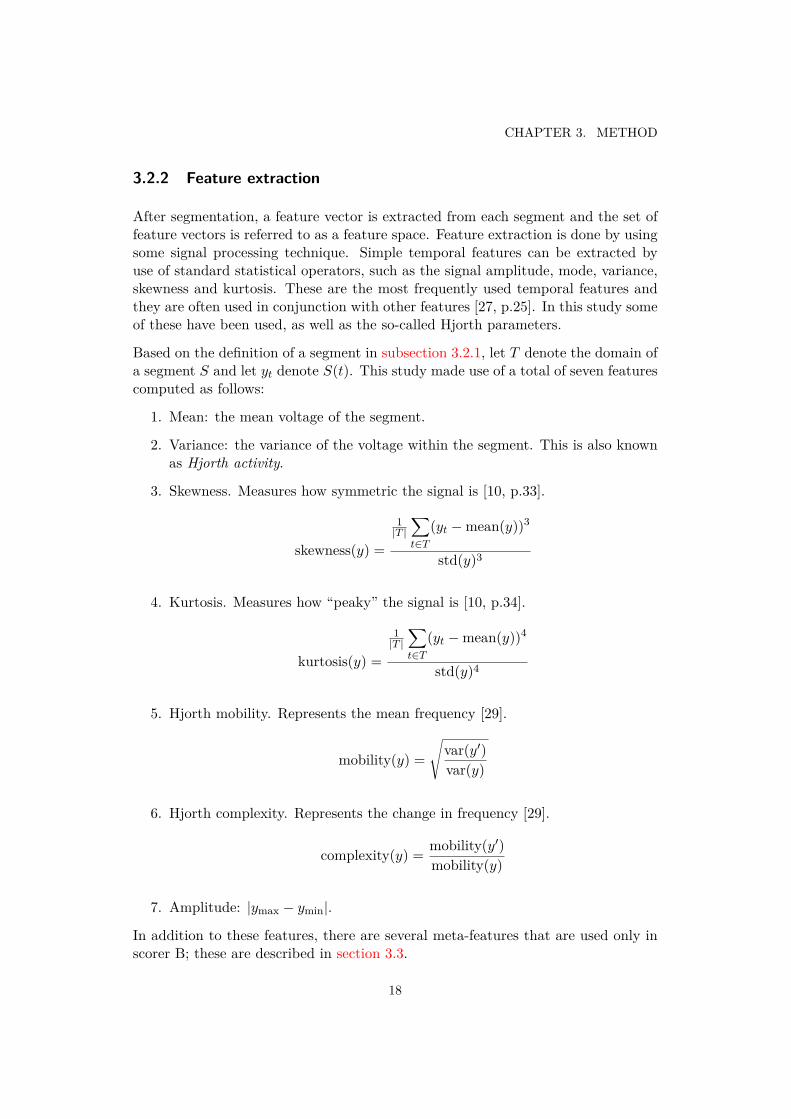
3.2.2 Feature extraction
After segmentation, a feature vector is extracted from each segment and the set offeature vectors is referred to as a feature space. Feature extraction is done by usingsome signal processing technique. Simple temporal features can be extracted byuse of standard statistical operators, such as the signal amplitude, mode, variance,skewness and kurtosis. These are the most frequently used temporal features andthey are often used in conjunction with other features [27, p.25]. In this study someof these have been used, as well as the so-called Hjorth parameters.
Based on the definition of a segment in subsection 3.2.1, let T denote the domain ofa segment S and let yt denote S(t). This study made use of a total of seven featurescomputed as follows:
1. Mean: the mean voltage of the segment.
2. Variance: the variance of the voltage within the segment. This is also knownas Hjorth activity.
3. Skewness. Measures how symmetric the signal is [10, p.33].
skewness(y) =
1|T |∑t∈T
(yt −mean(y))3
std(y)3
4. Kurtosis. Measures how “peaky” the signal is [10, p.34].
kurtosis(y) =
1|T |∑t∈T
(yt −mean(y))4
std(y)4
5. Hjorth mobility. Represents the mean frequency [29].
mobility(y) =√
var(y′)var(y)
6. Hjorth complexity. Represents the change in frequency [29].
complexity(y) = mobility(y′)mobility(y)
7. Amplitude: |ymax − ymin|.
In addition to these features, there are several meta-features that are used only inscorer B; these are described in section 3.3.
18
3.2. SCORING
3.2.3 Partitioning
The extracted feature space is randomly partitioned into a training set and a testset with a 3 : 1 size ratio. As the partitioning is random, the ratio of differentsleep stages in the training and test sets are roughly the same since they becomeapproximations of the ratio given in Table 3.1. The test set was chosen to berelatively large to make sure that it would contain an ample amount of samples.The training set is used for training a number of classifiers via a feature selectionprocess described in subsection 3.2.5.
3.2.4 Feature classification
The core of the scorer is the classifier, which maps feature vectors to labels (sleepstages) according to some model which is trained with some training set. A two-classsupport vector machine model was used for classification. As the model is two-class,the one-against-one approach [31] is used to support multiclass classification. Thatis, a two-class SVM model is built for each pair of different labels. Since there arefive AASM stages, 5 · (5− 1)/2 = 10 models are built. Then, whenever the programneeds to predict the AASM label for a feature vector, it selects the label that ispredicted by the maximal number of pairwise SVMs.
Two variations of SVM are put to use for the purpose of evaluating the scorers: onewith a linear kernel function and one with a radial basis function (RBF) kernel,with a soft margin parameter C = 1. The kernel coefficient parameter γ for theRBF kernel is automatically determined using an unspecified heuristic [30]. It isimplied in the documentation that this heuristic is a randomized algorithm:
The heuristic procedure uses subsampling. Therefore, to reproduceresults, set a random number seed using rng before training the clas-sifier.
As optimization routine, the classifiers use sequential minimal optimization (SMO)[52] with a gradient difference tolerance of 0.001.
Note that in order to classify a feature vector, it has to have the same dimensionas the training set that was used to train the classifier. As illustrated in Figure 3.1,the test set is fed into a classifier, which predicts a label for every vector in the testset. Before this happens, however, the dimension of the test set is reduced so thatit becomes compatible with the classifier. This is necessary since the classifier wastrained using a training set in which each feature vector consists of anywhere fromone to seven features (depending on the particular feature selection), while the testset still retains all seven features.
19

CHAPTER 3. METHOD
3.2.5 Feature selection
After partitioning, the training set undergoes feature selection. This means thatthe dimension of the feature space is reduced in some manner. More precisely, everyvector (x1, . . . , x7) in the feature space is reduced to a smaller vector (xa, . . . , xb)where {xa, . . . , xb} ⊆ {x1, . . . , x7}. It is often desirable to do this before doingclassification as a way to improve classification accuracy, since adding features thatare not related to the classification problem in question will only contribute noisewhich makes classification more difficult [10, p.57-58].
Deciding on which features to select can be done in a few ways. This is a searchproblem, where we in this case are searching for a feature combination for which theevaluated classification accuracy is as high as possible. The general idea is to createa number of copies of the training set, do a unique feature selection on each copy, usethe copy to train a classifier, and evaluate the classifier. The feature combinationthat the classifier with the highest accuracy originates from is then considered theoptimal one. Figure 3.2 illustrates this process. Training and evaluation is doneusing k-fold cross-validation with k = 5.
Two search algorithms have been implemented to solve this search problem: ex-haustive search and restrictive search.
Exhaustive search
The naive approach is to, for every possible combination of features, do featureselection on the training set using that combination. If we decide to select N outof n features, this amounts to
(n
N
)= n!N !(n−N)!
combinations. Furthermore, there are a total of 2n − 1 combinations involving atleast one feature.
The advantages of this approach is that it is simple to implement and it ensures thatthe optimum feature combination is selected. The obvious disadvantage is that thisbecomes computationally intractable for anything but a very low number of features[10, p.59]. This study involves 27−1 = 127 different non-empty subsets of the set ofseven features, which takes roughly 30 minutes to evaluate on a modern computerfor a single data record. It has therefore not been practical to use this approach forevaluating the accuracy of the scorers.
20

3.2. SCORING
Figure 3.2. Diagram of the process of evaluating a scorer from some data. 1. Theextracted feature space is partitioned into a training set and test set. 2. The trainingset is duplicated into N copies, where N is the number of feature selections. Thedimensionality of each set is reduced according to its associated selection. In thecase of restricted search (described further below), this step is more closely connectedwith steps 3 to 5. 3-4. Each of the N training sets undergoes a form of k-fold cross-validation where k classifiers are trained and evaluated. 5. The classifier with themedian accuracy is chosen as the average among the k classifiers. 6. The classifieramong the N evaluated median classifiers whose accuracy is highest is considered thebest classifier. 7. This classifier is evaluated using the test set from step 1. Thedimension of the test set is first reduced so that it is compatible with the classfier.
Restricted search with a genetic algorithim
We know that there exists at least one feature combination for which the scorer’saccuracy is maximal. Since an exhaustive search would take long time, an esti-mate of this combination was found by use of a genetic algorithm restricted searchheuristic. The heuristic, described in Figure 3.3, includes standard genetic algo-
21
CHAPTER 3. METHOD
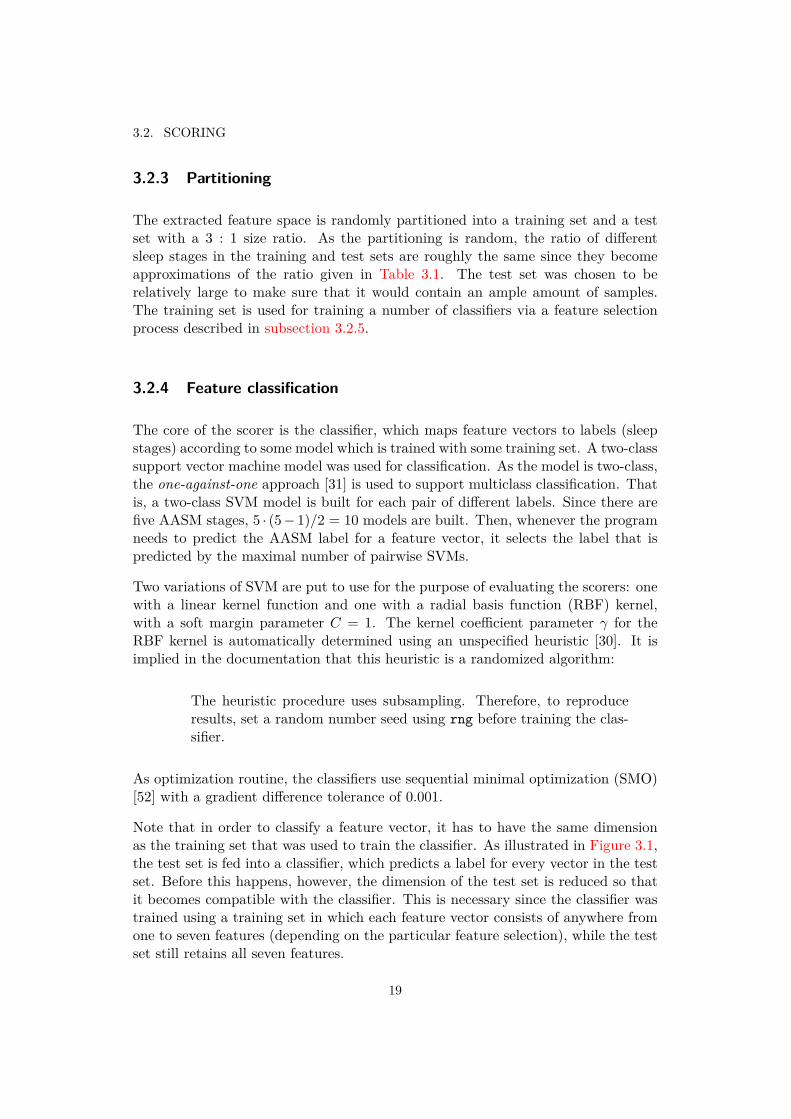
Table 3.2. Genetic algorithm parameters.
Mutation rate, M 0.2Crossover rate 1.0Number of generations, T 5Population size, N 5Chromosome length, D 7
rithm components: selection, crossing, mutation, and elitism. Its parameters areshown in Table 3.2. The algorithm uses binary vectors of length D (the numberof available features) as an encoding for feature combinations: the jth value in thevector equals 1 if and only if the jth feature is included in the combination.
Computing the fitness of a vector is done by first decoding the vector into a featurecombination, then decreasing the dimension of the training set with respect tothis combination, and lastly performing cross-validation on this set in the mannerdescribed in steps 3-5 of Figure 3.2.
The algorithm employed T generations, each containing N individuals, a mutationratio of M and a crossover probability of 100 %. It was shown empirically thatwith these parameters, the heuristic gives a good enough estimate of the optimalaccuracy of scorer A (same or at most 1 percentage point lower).
3.3 Unsupervised processing
Scorer B is identical to scorer A except that it includes an extra processing stepimmediately after the feature extraction step shown in Figure 3.1. The general ideaof this step is to use an unsupervised learning method to organize the feature spaceinto a representation from which new features can be extracted. These may becalled meta-features since they are features of the features themselves.
This extra step for scorer B works in the following way: Before undergoing featureselection, each vector (x1, . . . , x7) in the feature space is extended into a vector(x1, . . . , x7,m1, . . . ,mk), where each mi is a meta-feature. By increasing the dimen-sion of the feature space in this manner, the feature selection algorithm is given amore complex feature space to work with which hopefully improves the performanceof the scorer.
3.3.1 Deep belief network
A deep belief network was used for this purpose. The network consists of twostacked restricted Boltzmann machines, where the output of RBM 1 becomes theinput of RBM 2 as shown in Figure 3.4. RBM 1 and RBM 2 consist of 20 and 3
22

3.3. UNSUPERVISED PROCESSING
Figure 3.3. Flow chart of the genetic algorithm which selects an approximation ofthe optimal feature combination. 1. Generate N random binary vectors of lengthD. Let P1 denote this set, i.e. P1 ⊆ {0, 1}D. This is the “first generation”. 2.Compute the fitness of each member of P1 using the fitness function. 3. Constructthe rest of the T generations, denoted P2, P3, . . . , PT . 3.1. Construct generation Pt
by creating N individuals. 3.1.1. Pick two vectors x, y ∈ Pt using roulette wheelselection. 3.1.2. One-point crossover: Randomly pick a position i ∈ {1, . . . , D}. Theoffspring of x and y is then z = (x1, . . . , xi−1, yi, . . . , yD). 3.1.3. Let m be a binaryvector of length D in which each value has a probability of M of being equal to 1and 0 otherwise. Then z′ = z ⊕m is a mutation of the offspring. 3.1.4. Add z′to the set of offspring P ′t stemming from Pt. 3.2. Let the next generation, Pt+1, bedefined as the N fittest vectors of Pt ∪ P ′t . 4. Let s be the fittest vector of PT . Thisis considered to be the encoding for an approximation of the optimal combination offeatures. 5. Translate s into a feature combination in the following way: if the jthvector component is 1, the jth feature is included in the combination.
23

CHAPTER 3. METHOD
hidden layer units, respectively. The visible layer of RBM 1 consists of seven units– one for each feature.
Figure 3.4. DBN consisting of two stacked RBMs with 20 and 3 hidden layer units,respectively. Biases are not shown.
The two networks are Bernoulli RBMs. This means that all units are binary stochas-tic units, i.e. the value of each unit is real-valued between 0 and 1 signifying theprobability that a unit that it is connected to would turn on or off [2]. The proba-bility of a hidden unit hj being turned on given the visible layer v it is connectedto, or a visible unit vi turning on given the hidden layer h it is connected to, aregiven by:
P (hj |v) = 11 + ebj+
∑i
Wi,jvi
P (vi|h) = 1
1 + eci+∑
jWi,jhj
where b and c are the bias vectors for the hidden and visible layers, and W is theweight matrix for the network.
Before feeding each vector in the feature space into the visible layer of RBM 1, thevalues need to be scaled to values between 0 and 1. This is done by subtracting theminimum value from every value and then dividing by the maximum value. Thatis, for the jth feature and the feature space X, the new value of the vector’s jthfeature becomes
x′ij = xij −min{yj | (y1, . . . , y7) ∈ X}max{yj | (y1, . . . , y7) ∈ X} .
Like the feat-DBN approach described in Längkvist’s study [8, p.3], the featurespace is first used for unsupervised pre-training of the DBN, followed by unsuper-
24

3.3. UNSUPERVISED PROCESSING
vised fine-tuning. Unlike the aforementioned study, no supervised fine-tuning isperformed. Prior to pre-training and fine-tuning, the feature space is partitionedinto a training set and a five times smaller validation set which are used for thesesteps.
Unsupervised pre-training is done by performing greedy layer-wise training [58] ofthe RBMs in the following way:
1. The weights and biases of the RBM 1 are first initialized. Like in Längkvist’sstudy, the biases of the visible units are set to 0 while the biases of hiddenunits are set to −4 to encourage sparsity. Each entry in the weight matrix isset to the value
4√
6nv + nh
·X
where nv = 7 is the number of visible units, nh = 20 is the number of hiddenunits and X ∼ U(−1, 1).
2. The training set is divided into mini-batches of 100 vectors each. For eachbatch, the weights and biases are updated using single-step contrastive diver-gence (CD-1) [56]. This process is repeated for 50 epochs or until the modelconverges. The weights are updated as follows, for epoch e:
∆We = ε ·(V TH − V ′TH ′
100 − λWe−1
)+ αe∆We−1
where
• ε = 0.05 is the learning rate,
• λ = 0.0002 is the weight cost,
• αe is the momentum parameter, which is set to 0.5 during the first fiveepochs and is increased to 0.9 after that,
• V is the mini-batch of samples of the visible units, i.e. a 100× 7 matrix,
• V ′ and H are the visible and hidden activations, respectively, obtainedfrom performing one iteration of Gibbs sampling from V ,
• H ′ are the activations of the hidden units obtained from propagating V ′to the hidden layer, i.e. a 100× 20 matrix,
• ∆We is what will be added to the weight matrix during epoch e,
• ∆W0 is a zero matrix.
The update rules for the biases are similar:
∆be = ε · (|H| − |H ′|)− λbe + αe∆be−1
∆ce = ε · (|V | − |V ′|)− λce + αe∆ce−1
25

CHAPTER 3. METHOD
3. The values of the training and validation set propagated to the hidden layerof RBM 1 become the training and validation set, respectively, for RBM 2.
4. RBM 2 is initialized in the same fashion as RBM 1 in step 1.
5. RBM 2 is trained in the same fashion as RBM 1 in step 2.
After pre-training, the DBN undergoes unsupervised fine-tuning with backpropa-gation in the following way: The training data is divided into mini-batches of 100vectors each. Each batch is used to update the weights and biases of the DBN. Thisis done by minimizing the value of a cross-entropy loss function using conjugategradient minimization [57]. This function takes as input the weights and biases ofthe DBN. The function value is then computed by feeding the batch into the inputlayer of the DBN, propagating the activations to the top layer, then propagatingthem back to the bottom layer. The function value then becomes the cross-entropyerror [53] when comparing the original values to the reconstructed ones. This wholeprocess is repeated for 20 epochs or until the model converges.
After fine-tuning, each vector in the original feature space is propagated throughthe network. The values of the hidden units of RBM 2 then become the values ofthe three meta-features for that vector.
3.4 Evaluation
There are mainly two aspects to evaluate: the performance of the individual scorers,and how scorer B compares to scorer A.
3.4.1 Scorer performance
Once the SVM classifier is trained with the training set samples, the test set samples(but not labels) are fed into it. The classifier maps each of these to a sleep stagelabel. This mapping is then compared to the test set labels. The similarity betweenthe predicted labels and the test set labels is used as an estimate of the scorer’sperformance.
The performance of a classifier is presented in the form of a confusion matrix. Animportant metric of the scorer’s performance is its accuracy, which is defined asthe number of times a sample in the test set was correctly classified divided by thenumber of test set samples. For feature selection, accuracy was the sole metric usedfor finding an optimal combination of features.
26

3.4. EVALUATION
3.4.2 Scorer comparison
The effect of introducing these meta-features in the scoring process are studied intwo ways:
• By comparing the performance measures of scorer A and B, in particulartheir respective accuracies. This is the natural way of determining whetherone scorer performs better than the other.
• By observing the frequency at which these features are included in featureselections. Since the selection algorithm is driven toward selecting a featurecombination that gives the most promising results, a meta-feature that isbeneficial should be expected to be included in that combination often.
The scorers are evaluated by running both scorers on each data record three timeswith both a linear SVM kernel and an RBF kernel; this amounts to 2 · 2 · 10 · 3 =120 data record evaluations in total. The performance measures and the selectedfeature combination are saved for each evaluation. Then, the confusion matrix for aparticular scorer and a particular kernel is defined as the average confusion matrixof the corresponding 10 · 3 = 30 evaluations.
3.4.3 Restricted search performance
As a way to assess the effectiveness of the restricted search algorithm and validatethat it works as intended, the average number of features included in the selection foreach of the 120 evaluations is compared to doing an exhaustive search for the optimalfeature selection. Because of the huge computational demand of an exhaustivesearch, only scorer A is evaluated, with a linear kernel and only one data record(the SHHS-200001 record).
27


Chapter 4
Results
The following are the results of running the two scorers on the ten data records fora linear and an RBF SVM kernel, respectively.
Tables 4.1-4.4 display the average confusion matrices for the evaluated accuracyin the four cases. As with the estimated accuracies, there do not seem to be anystriking differences between scorer A and B when comparing the percentages in therespective table entries. The number of N1 samples correctly classified as N1 aresomewhat higher for scorer A than scorer B for both kernels (by 71 % and 56 %,respectively). This is however likely coincidental: because of the low number ofN1 samples in total (roughly 2.7 % of all samples in all ten records) and the lowN1-to-N1 percentage itself, the variance in the results is expected to be high. Asimilar case can be made for other entries. On the other hand, entries involving afair total number of samples and high percentages appear to be roughly the samein all four tables: the percentage of the REM-to-wakefulness predictions range from16.9 % to 18.6 %.
Table 4.1. Confusion matrix for scorer A with a linear SVM kernel.
% N1 N2 N3 R WN1 1.2 46.6 0.8 16.6 28.2N2 0 84.0 5.6 2.7 7.7N3 0 31.7 67.9 0.1 0.4R 0.2 48.2 4.7 29.2 17.7W 0.4 13.0 2.1 1.5 83.0
29

CHAPTER 4. RESULTS
Table 4.2. Confusion matrix for scorer B with a linear SVM kernel.
% N1 N2 N3 R WN1 0.7 52.0 1.0 15.6 27.5N2 0.1 84.8 5.7 2.1 7.4N3 0 35.1 64.4 0 0.5R 0 50.9 5.4 26.9 16.9W 0.4 12.6 2.0 1.1 83.9
Table 4.3. Confusion matrix for scorer A with an RBF SVM kernel.
% N1 N2 N3 R WN1 2.5 44.8 2.0 19.1 24.9N2 0.2 82.8 5.6 4.4 6.9N3 0 29.4 67.8 0 2.7R 1.0 42.3 3.7 35.9 17.0W 0.4 12.3 0.9 2.3 84.2
Table 4.4. Confusion matrix for scorer B with an RBF SVM kernel.
% N1 N2 N3 R WN1 1.6 37.0 1.8 20.4 29.2N2 0.1 84.1 5.8 4.2 5.9N3 0 30.5 67.9 0 1.6R 0.7 44.4 3.5 32.8 18.6W 0.2 11.8 1.0 2.6 84.5
Table 4.5 shows the estimated averages and standard deviations of the accuracyof the two scorers and kernels. In each of the four cases, the mean accuracy isestimated as the mean of the 30 accuracy measurements x1, . . . , x30 as describedin subsection 3.4.2:
x̄ = 130
30∑i=1
xi
The standard deviation is estimated as the unbiased estimation of the sample:
s =
√√√√ 129
30∑i=1
(xi − x̄)2
As shown in Table 4.5, there are no significant differences between the means.
The average number of features in a feature selection for each of the four categories isshown in Table 4.6. Figure 4.1 shows the minimum, maximum, and average accuracyof scorer A for all possible feature selections, grouped into seven categories. Theaverage number of features for scorer A is 4.0 and 4.4, which appears consistentwith Figure 4.1 where the highest scorer accuracies are attained for specific feature
30

Table 4.5. Estimated mean accuracies and standard deviations of scorer A and Bwith two kinds of SVM kernels, based on the 120 evaluations.
Mean accuracy Standard deviationScorer A, linear kernel 0.76 0.085Scorer B, linear kernel 0.76 0.092Scorer A, RBF kernel 0.77 0.075Scorer B, RBF kernel 0.77 0.068
selections containing 3-5 features. It is unclear how well features selected by meansof exhaustive search correlated with features selected by the genetic algorithm.
Table 4.6. Average number of features included in each feature selection for the 120evaluations, rounded to two significant digits.
Mean selection size Standard deviationScorer A, linear kernel 4.4 1.2Scorer B, linear kernel 5.9 1.4Scorer A, RBF kernel 4.0 1.0Scorer B, RBF kernel 6.1 1.4
Figures 4.2-4.3 show the frequency at which each feature was selected during the120 evaluations.
31

CHAPTER 4. RESULTS
Figure 4.1. Bar chart of the classification accuracies for all 127 feature selectionsfor scorer A with a linear kernel and the SHHS1-200001 record. The ith bar showsthe average, minimum and maximum of the accuracies evaluated from the
(7i
)feature
selections of size i.
32

Figure 4.2. Frequency of selected features for four groups of 30 evaluations each.The three meta-features are here labeled F1, F2, and F3. Note that since scorer Adoes not involve any of these three, their corresponding frequencies are zero.
33

CHAPTER 4. RESULTS
Figure 4.3. Frequency of selected features for two groups of 60 evaluations each,one for scorer A and one for scorer B.
34

Chapter 5
Discussion
The following is a discussion of how the scorer’s performance compares to state-of-the art scorers, the effect of the unsupervised feature learning step, and futurework.
5.1 Classification performance
Both scorers have a measured accuracy of about 76 % which is considerably higherthan 67 % and thus arguably good enough for clinical use according to the cri-terion mentioned earlier [46]. Notably, the accuracy is also about 4 percentagepoints higher than the similar feat-DBN approach from Längkvist’s study. It there-fore seems that the employed classification method shows promise. As alluded byFigure 4.1, the feature selection step may play an important role in increasing theaccuracy as the highest accuracy is 80 % which is roughly 9 percentage points higherthan if all seven features were retained. This is similar to Löfhede’s study, wherethe probability of classification error on the test set was found to be at its lowestwhen 10 out of 22 features were selected [10, p.145].
Tables 4.1-4.4 show that each label tended to be classified correctly, with a fewexceptions. Very few samples overall were classified as N1 – this may reflect thenature of the SHHS1 datasets used, where N1 samples are in minority. Most notably,Table 3.1 shows that in SHHS1-200002 only three out of 1079 samples were labeledN1. By the same token, N2 and wakefulness samples were the most plentiful andalso gave the highest accuracy (ca. 84 %). A tendency to confuse N1 for N2 orwakefulness is not uncommon – in the evaluation of Längkvist’s feat-DBN, 51.1 %of the samples are classified as either S2 or wakefulness [8, p.5]. In contrast toLängkvist’s study, however, many more N1 samples are classified as N2 than N1(46.6 % vs. 1.2 %), possibly because of the inequal amount of N1 samples comparedto N2 samples in our datasets involved in training, testing and validation.
35

CHAPTER 5. DISCUSSION
As for selection of features, figures 4.2-4.3 univocally agree that variance and Hjorthmobility were two popular choices of features. It is hard to tell how this relates toother classifiers in literature since a very specific set of features has been used inthis study and since not all studies employ feature selection. Similar to Löfhede’sstudy, however, the variance feature is often favored [10, p.146].
As shown in Table 4.5, there was no significant difference between using a linearSVM kernel and using an RBF kernel for classification. Perhaps the choice of kernelscaling method is good enough to ensure good accuracy regardless of kernel – in theearly stages of this study it was shown empirically that the kernel scaling parameterdrastically affected the classification accuracy, while using different kernels had littleimpact.
Lastly, the variance in the classification performance measures shown in Table 4.5and especially figures 4.2-4.3 originate from four sources of randomness:
• Partitioning of the whole feature space into a training set and test set. Al-though the ratio between the number of training samples and test samplesis determined by the user, the assignment of each feature vector to either atraining set or test set is random.
• Partitioning of the training set into a smaller training set and validation set.This is random in the same manner as above.
• The genetic algorithm that carries out feature selection is random.
• The SVM classifier uses a kernel scaling heuristic which is slightly random, asmentioned in subsection 3.2.4.
5.2 Scorer comparison
As the results for the scorers show, there is no significant difference between theaccuracies of the scorers, regardless of kernel function. Since the estimated accu-racies alone cannot reveal whether the introduction of meta-features was beneficialor harmful, we may need to look for an answer in the feature selection frequen-cies. Figure 4.3 shows that all three meta-features were quite popular during theselection step in scorer B. The second meta-feature, F2, took third place while F1shared the fourth place with amplitude. This could indicate that the introductionof meta-features actually improves the classifier accuracy, since if they did not, theywould not have been selected during the feature selection step so often. However,there is no way to tell if this benefit is overturned by the negative factor of expand-ing the search space. It should also be noted that making inferences on data basedon the frequency of selected features is not as reliable as doing it on the estimatedaccuracy since there is no guarantee that a feature is included in the best foundfeature combination only because it has a high overall frequency. That is, we do not
36

5.3. FUTURE WORK
take into account how one feature is combined with several others to give a certainaccuracy, only the number of times it happened to be selected.
Regardless if the use of meta-features help or not, it is clear that the difference is justtoo small to matter in practice. Supposedly, this is because I was unable to find anappropriate choice of parameters for the DBN, and not because unsupervised featurelearning is inherently ineffective. To my knowledge there is no previous literatureto date which is based on pure unsupervised feature learning in the context ofEEG-based sleep research, but the benefit of this type of feature learning has beendemonstrated in other domains. In [54], DBNs were applied to auditory data inan unsupervised manner and the resulting feature representations were shown toequal or surpass the original features in performance [54, p.8]. It may therefore bepossible to enhance the classification accuracy significantly if the parameters for theDBN are adjusted. Specifically, the DBN can be adjusted in regards to:
• Number of RBMs
• Number of hidden layers
• Number of training epochs
• Initial biases
In addition, it could also help to build an additional scorer, C, which would be iden-tical to B except that it would include supervised fine-tuning similar to Längkvist’sfeat-DBN. By comparing the two scorers, one could then determine whether theDBN in scorer B was sufficiently pre-trained in the unsupervised phase.
5.3 Future work
Besides exploring different parameters for the DBN and implementing a third scorer,a possible extension to this study would be to optimize the performance bottlenecksof the implementation. These are the genetic algorithm and, to a lesser extent, theDBN pre-training and backpropagation algorithms. The author of the DBN toolboxhimself stated that the code is “very un-optimized” [18]. One of the major challengesduring this study was to choose parameters that would demand a reasonable amountof computer resources, and optimizing these bottlenecks would therefore be useful.
It would also be a good idea to make some extensions to the implementation toexpand the scope of possible objects to study. An important extension would beto increase the number of hand-crafted features – many other studies make useof 20-30 features (e.g. 22 in [10], 28 in [8]). Using a more balanced dataset inregard to the distribution of sleep stage labels could perhaps increase the chance ofthe N1 and REM labels being correctly classified. In regards to the results, othermeasures could be presented and analyzed, e.g. F-scores. Finally, the unsupervised
37

CHAPTER 5. DISCUSSION
learning component could be based on something entirely other than a DBN, e.g.a clustering approach.
38

Chapter 6
Conclusion
The addition of an unsupervised feature learning step did not affect the sleep scoringperformance significantly. It is unclear whether this application of unsupervisedfeature learning improves or worsens performance, but it is clear that the differenceis too small to be useful in practice. Although the added meta-feature was oftenfavored during feature selection, the scorer accuracy did not improve substantially.A proposed explanation for this is that the added benefit of having three extrafeatures to choose from was largely cancelled out by the fact that the search spacefor the restricted search heuristic became larger, which made it more difficult tofind the optimal feature combinations during selection.
However, since unsupervised feature learning has been successful for classificationin other domains, there may still be hope for improvement. Since this study hasexploited a rather specific experimental setup to attempt to answer a broad question,it is difficult to arrive at a comprehensive conclusion from the results alone. Witha more appropriate choice of parameters for the DBN and the restricted searchalgorithm, the accuracy may improve significantly.
39


Bibliography
[1] http://www.nhlbi.nih.gov/health/health-topics/topics/sleepapnea
[2] http://scikit-learn.org/stable/modules/neural_networks.html
[3] A.L. Loomis, E.N. Harvey, G.A. Hobart. (1937). Cerebral states during sleep,as studied by humna brain potentials. Journal of Experimental Psychology. Vol21(2). 127-144.
[4] Web page. Available online: https://mysleepbot.com
[5] Web page. Available online: https://mysleepbot.com/tour/
[6] C. Iber, S. Ancoli-Israel, A.L. Chesson Jr., S.F. Quan. (2007). The AASM Man-ual for the Scoring of Sleep and Associated Events. American Academy of SleepMedicine.
[7] A. Rechtschaffen, A. Kales. (1968). A Manual of Standardized Terminology,Techniques and Scoring System for Sleep Stages of Human Subjects. BIS/BRIUniversity of California.
[8] M. Längkvist, L. Karlsson, A. Loutfi. (2012). Sleep Stage Classification UsingUnsupervised Feature Learning. Center for Applied Autonomous Sensor Systems,Örebro University.
[9] F. Yaghouby, P. Modur, S. Sunderam. (2014). Naive scoring of human sleepbased on a hidden Markov model of the electroencephalogram. IEEE-EMBS.
[10] J. Löfhede. The EEG of the Neonatal Brain – Classification of BackgroundActivity. Chalmers Tekniska Högskola, University of Borås. ISBN 978-91-7385-339-2.
[11] A. Van Esbroeck, B. Westover. (2012). Data-Driven Modeling of Sleep Statesfrom EEG. 34th Annual International Conference of the IEEE EMBS. San Diego,California USA.
41

BIBLIOGRAPHY
[12] Zhou Peng, Li Xiangxin, Zhang Yi, Xue Ranting. (2012). Re-search on sleep staging based on individual difference with PrincipalComponent Analysis and Support Vector Machine. Available online:http://www.paper.edu.cn/releasepaper/content/201201-785.
[13] F. Yaghouby, S. Sunderam. (2015). Quasi-supervised scoring of human sleepin polysomnograms using augmented input variables. Department of BiomedicalEngineering, University of Kentucky, Lexington.
[14] S. Roberts, L. Tarassenko. (1992). Analysis of the sleep EEG using a multilayernetwork with spatial organisation. IEE Proceedings-F. Vol. 139. No. 6. December.
[15] A.F. Farag, S.M. El-Metwally, A.A. Morsy. (2014). A Sleep Scoring Sys-tem Using EEG Combined Spectral and Detrended Fluctuation Analysis Fea-tures. J. Biomedical Science and Engineering, 7. 584-592. Avilable online:http://dx.doi.org/10.4236/jbise.2014.78059
[16] A. Flexer, P. Sykacek, I. Rezek, G. Dorffner. (2000). Using Hidden MarkovModels to build an automatic, continuous and probabilistic sleep stager. AustrianRes. Inst. for Artificial Intelligence, Vienna. Proceedings of the IEEE-INNS-ENNS International Joint Conference. Vol. 3.
[17] D.F. Wulsin, J.R. Gupta, R. Mani, J.A. Bianco, B. Litt. (2011). ModelingEEG Waveforms with Semi-Supervised Deep Belief Nets: Fast Classificationand Anomaly Measurement. National Institutes of Health.
[18] Web page. Available online: http://www.seas.upenn.edu/ wulsin/docs/DBNToolbox_v1.0.zip
[19] J.S. Barlow, O.D. Creutzfeldt, D. Michael, J. Houchin, H. Epelbaum. (1981).Automatic adaptive segmentation of clinical EEGs. Electroencephalography andclinical neurophysiology, Vol.51(5), pp.512-25.
[20] Jin Xing. (2014). An unsupervised method for wake/sleep scoring. Case West-ern Reserve University, Department of Electrical Engineering and ComputerScience.
[21] J.Y. Tian, J.Q. Liu, (2005). Automated Sleep Staging by a Hybrid System Com-prising Neural Network and Fuzzy Rule-based Reasoning. Proceedings of the 2005IEEE. Engineering in Medicine and Biology 27th Annual Conference. Shanghai,China. 0-7803-8740-6/05.
[22] Johan Löfhede, Magnus Thordstein, Nils Löfgren, Anders Flisberg, ManuelRosa-Zurera, Ingemar Kjellmer, Kaj Lindecrantz. (2010). Automatic classifi-cation of background EEG activity in healthy and sick neonates. University ofBorås, School of Engineering, Borås, Sweden.
42

[23] N. Acir, C. Guzelis. (2004). Automatic recognition of sleep spindles in EEG byusing artificial neural networks. Expert systems with Applications, 27, 451-458.
[24] S. Gudmundsson, T.P. Runarsson, S. Sigurdsson. (2005). Automatic sleep stag-ing using support vector machines with posterior probability estimates. Interna-tional Conference on Computational Intelligence for Modelling, Control and Au-tomation, 2005 and International Conference on Intelligent Agents, Web Tech-nologies and Internet Commerce, in: M. Mohammadian (Ed.), IEEE, Vienna,Austria, p.6.
[25] M. Corsi-Cabrera, M.A. Guevara, Y. del Rio-Portilla, Brain activity and tem-poral coupling related to eye movements during REM sleep: EEG and MEGresults. Brain Res., 1235 (2008) 82-91.
[26] C.M. Crainiceanu, B.S. Caffo, C.Z. Di, N.M. Punjabi, Nonparametric SignalExtraction and Measurement Error in the Analysis of ElectroencephalographicActivity During Sleep, J. Am. Stat. Assoc., 104 (2009) 541-555.
[27] S. Motamedi-Fakhr, M. Moshrefi-Torbati, M. Hill, C.M. Hill, P.R. White.(2014). Signal processing techniques applied to human sleep EEG signals – Areview. Elsevier. Biomedical Signal Processing and Control 10: 21-33.
[28] M. Ronzhina, O. Janousek, J. Kolarova, M. Novakova, P. Honzikz, I. Provaznik.(2012). Sleep scoring using artifical neural networks. Elsevier. Sleep MedicineReviews 16: 251-263.
[29] Seung-Hyeon Oh, Yu-Ri Lee, Hyoung-Nam Kim. (2014). A Novel EEG FeatureExtraction Method Using Hjorth Parameter. Pusan National University, Depart-ment of Electrical & Computer Engineering. Busan, Republic of Korea.
[30] Web page. Available online: http://se.mathworks.com/help/stats/fitcsvm.html
[31] Web page. Available online: https://hal.archives-ouvertes.fr/inria-00103955/document
[32] Web page. Available online: http://emedicine.medscape.com/article/1188142-overview
[33] Jessie Y. Maggard. (2009). Automation of Sleep Staging. University of Water-loo.
[34] Y. Ichimaru, G.B. Moody. (1999). Development of the polysomnographicdatabase on CD-ROM. Psychiatry and Clinical Neurosciences. 53, 175-177.
[35] H.M. Praetorius, G. Bodenstein, O.D. Creutzfeldt. (1977). Adaptive segmen-tation of EEG records: A new approach to automatic EEG analysis. Electroen-ceph. clin. Neurophysiol. 42:84-94.
43

BIBLIOGRAPHY
[36] J.S. Barlow, O.D. Creutzfeldt, D. Michael, J. Houchin, H. Epelbaum, (1981).Automatic segmentation of clinical EEGs. Electroenceph. clin. Neurophysiol.51:512-525.
[37] O.D. Creutzfeldt, G. Bodenstein, J.S. Barlow. (1985). Computerized EEG pat-tern classification by adaptive segmentation and probability density function clas-sification. Clinical evaluation. Electroenceph. clin. Neurophysiol. 60:373-393.
[38] Bo Hjorth. (1970). EEG analysis based on time domain properties. Elema-Schönander AB, Research and Development Laboratory, Solna, Sweden. Elec-troenceph. clin. Neurophysiol. 29:306-310.
[39] J. Hasan. (1996). Past and future of computer-assisted sleep analysis anddrowsiness assessment. Journal Clinical Neurophysiology. 13(4): 295-313.
[40] A. Akin, T. Akgul. (1998). Detection of sleep spindles by discrete wavelet trans-form. Proceedings of the IEEE 24th Annual Northeast Bioengineering Confer-ence.
[41] T. Malina, A. Folkers, U.G. Hofmann. (2002). Real-time EEG proceeding basedon wavelet trasnform.
[42] E. Oropesa, H.L. Cycon, M. Jobert. (1999). Sleep staging classification usingwavelet transform and neural network. Technical Report TR-99-008, Berkeley,California.
[43] Luciane de Souza, Ana Amélia Benedito-Silva, Maria Laura Nogueira Pires,Dalva Poyares, Sergio Tufik, Helena Maria Calil. (2003). Further Validation ofActigraphy for Sleep Studies. SLEEP 2003;1:81-5.
[44] N. Sezgin, M.E. Tagluk. (2009). Energy-based feature extraction for classifica-tion of sleep apnea syndrome. Comput. Biol. Med., 39. 1043-1050.
[45] Isaac N. Bankman, Vincent G. Sigillito, Robert A. Wise, Philip L. Smith.(1992). Feature-based detection of the K-Complex wave in the human electroen-cephalogram using neural networks. IEEE Transactions on biomedical engineer-ing. Vol. 39. No. 12.
[46] Rajeev Agarwal, Jean Gotman. (2001). Computer-assisted sleep staging. IEEETransactions on biomedical engineering. Vol. 48. No. 12.
[47] A. Flexer, P. Sykacek, I. Rezek, G. Dorffner. (2000). Using Hidden MarkovModels to build an automatic, continuous and probabilistic sleep stager. TheAustrian Research Institute for Artificial Intelligence. Schottengasse 3, A-1010Vienna, Austria.
44

[48] Tarek Lajnef, Sahbi Chaibi, Perrine Ruby, Pierre-Emmanuel Aguera, Jean-Bapiste Eichenlaub, Mounir Samet, Abdennaceur Kachouri, Karim Jerbi.(2015). Journal of Neuroscience Methods 250. 94-105.
[49] Wei-Long Zheng, Jia-Yi Zhu, Yong Peng, Bao-Liang Lu. (2014). EEG-basedemotion classification using deep belief networks. Multimedia and Expo (ICME),2014 IEEE International Conference on. IEEE.
[50] Web page. Available online:https://sleepdata.org/datasets/shhs/pages/5-montage-and-sampling-rate-information-shhs1.md
[51] Web page. Available online:https://sleepdata.org/datasets/shhs/pages/4-equipment-shhs1.md
[52] Web page. Available online:http://se.mathworks.com/help/stats/svmtrain.html
[53] Web page. Available online:http://www.cse.unsw.edu.au/ billw/cs9444/crossentropy.html
[54] Honglak Lee, Yan Largman, Peter Pham, Andrew Y. Ng. (2009). Unsupervised featurelearning for audio classification using convolutional deep belief networks. Multimediaand Expo (ICME), 2014 IEEE International Conference on. IEEE. Advances in neuralinformation processing systems (pp. 1096-1104).
[55] Tarek Lajnef, Sahbi Chaibi, Perrine Ruby, Pierre-Emmanuel Aguera, Jean-BaptisteEichenlaub, Mounir Samet, Abdennaceur Kachouri, Karim Jerbi. (2014). Learning ma-chines and sleeping brains: Automatic sleep stage classification using decision-tree multi-class support vector machines. Elsevier. Journal of Neuroscience Methods 250 (2015)94-105.
[56] Geoffrey E. Hinton. (2002). Training Products of Experts by Minimizing ContrastiveDivergence. Gatsby Computational Neuroscience Unit, University College London, Lon-don. WC1N 3AR, U.K.
[57] Terry Anthony Straeter. (1971). On the extension of the Davidon-Broyden class ofrank one, quasi-Newton minimization methods to an infinite dimensional Hilbert spacewith applications to optimal control problems. Graduate Faculty of North Carolina StateUniversity at Raleigh. Department of Mathematics.
[58] Yoshua Bengio, Pascal Lamblin, Dan Popovici, Hugo Larochelle. (2007). Greedy Layer-Wise Training of Deep Networks. Université de Montréal. Montréal, Québec.
45


Chapter 7
List of figures
1.1 Own work.
1.2 “HYPNOGRAM created by Natasha k” by Tash510 is licensed under CC BY-SA 3.0. Available at:http://commons.wikimedia.org/wiki/File:HYPNOGRAM_created_by_Natasha_k.jpg.License available at: http://creativecommons.org/licenses/by-sa/3.0/deed.en.
3.1 Own work.
3.2 Own work.
3.3 Own work.
3.4 Own work.
4.2 Own work.
4.3 Own work.
4.1 Own work.
47


Appendix A
Source code
The source code for the implementation including evaluation code can be found at
https://github.com/Sebelino/hypnoscorer/
The commit with checksum c0c2dd3929a4f1febaad115007cfefdd8cc2cb0d wasthe state of the implementation at the time the evaluations were carried out.
To repeat the experiment described in this paper, install the software and datasetsand then run the file multievaler.m in MATLAB 2014b. This should generateMAT-files containing the results. Then run listresults.m to display the results.
49