author: arpita ghosh - iibf · author: arpita ghosh assistant professor, ... figure 16: sector-wise...
TRANSCRIPT

1
Title of the Research Report - Asset Quality of banks: Evidence from India
Author: Arpita Ghosh
Assistant Professor, IIM Calcutta (Finance and Control Group)
Macro Research 2013-14
INDIAN INSTITUTE OF BANKING & FINANCE
2
Table of Contents
LIST OF FIGURES ............................................................................................................................................................. 3 LIST OF TABLES .............................................................................................................................................................. 4
CHAPTER I: INTRODUCTION AND RESEARCH QUESTIONS ................................................................................ 5 I. STABILITY OF BANKING SYSTEM AND NPA THREAT ....................................................................................................... 5 II. INDIAN BANKING STRUCTURE IN BRIEF ....................................................................................................................... 8 III. WHAT IS MEANT BY NON-PERFORMING ASSET (NPA) IN INDIA - EVOLVING DEFINITIONS .................................................... 9 IV. WHY WORRY ABOUT NPAS? : POTENTIAL CONSEQUENCES ........................................................................................ 11 V. TRENDS IN NPA .................................................................................................................................................. 13 VI. RESEARCH QUESTIONS.......................................................................................................................................... 16 VII. DO PSBS ALWAYS BEAR THE HIGHER BURDEN OF NPA THAN PRIVATE SECTOR BANKS? ..................................................... 17
CHAPTER–II: LITERATURE SURVEY, HYPOTHESIS DEVELOPMENT AND RESEARCH DESIGN................................ 22 I. LITERATURE SURVEY ............................................................................................................................................. 23 II. RESEARCH DESIGN, DATA AND METHODOLOGY ......................................................................................................... 33 III. HYPOTHESIS DEVELOPMENT .................................................................................................................................. 34 IV. BANK SPECIFIC FACTORS USED IN THIS STUDY ............................................................................................................. 34 V. INDUSTRY LEVEL FACTORS ..................................................................................................................................... 47 VI. MACRO-ECONOMIC FACTORS ................................................................................................................................ 51
CHAPTER III: ANALYSIS OF RESULTS ................................................................................................................ 61 I. ANALYSIS OF THE BANK LEVEL VARIABLES ................................................................................................................. 61 II. ANALYSIS OF INDUSTRY LEVEL FACTORS ................................................................................................................... 70 III. ANALYSIS OF MACRO-ECONOMIC VARIABLES ............................................................................................................. 72 IV. LISTED VERSUS UNLISTED BANKS ............................................................................................................................ 77 V. CONCLUSIONS ..................................................................................................................................................... 77
CHAPTER IV: CORPORATE GOVERNANCE OF BANKS IN INDIA ......................................................................... 79 I. INTRODUCTION ................................................................................................................................................... 79 II. A BRIEF OVERVIEW ON CORPORATE GOVERNANCE ..................................................................................................... 80 III. CORPORATE GOVERNANCE IN BANKS ....................................................................................................................... 84 IV. CORPORATE GOVERNANCE IN BANKS IN INDIA ........................................................................................................... 88 V. CORPORATE GOVERNANCE FACTORS FOR BANKS IN INDIA............................................................................................. 93 V. ANALYSIS OF CORPORATE GOVERNANCE FACTORS ...................................................................................................... 96 VI. CONCLUSION .................................................................................................................................................... 101
CHAPTER V: HANDLING NPAS ............................................................................................................................ 103 I. INTRODUCTION AND INITIATIVES BY GOVERNMENT, RBI AND BANKS ........................................................................... 103 I. REDUCTION IN NPAS: COMPOSITION – WRITE- OFFS, RECOVERIES AND UPGRADATIONS ................................................ 107 II. ANALYSIS OF NPAS RECOVERED THROUGH VARIOUS CHANNELS .................................................................................. 112 IV. RESTRUCTURING OF ASSETS ................................................................................................................................. 118 V. NEW INITIATIVES AND RECOMMENDATIONS FOR HANDLING NPAS .............................................................................. 122
A) Preventive Measures: ................................................................................................................................... 122
B) Corrective Measures: .................................................................................................................................... 126
VI. CHALLENGES AND SUGGESTIVE MEASURES GOING FORWARD: ..................................................................................... 129 VII. CONCLUSION .................................................................................................................................................... 132
SUMMARY OF ALL THE FINDINGS IN THE STUDY ................................................................................................ 135 Bibliography ...................................................................................................................................................... 138
3
List of Figures
Figure 1: GNPA to Gross Advances .............................................................................................................................. 13
Figure 2: Growth in GNPA and Gross Advances for All SCBs ....................................................................................... 14
Figure 3: Asset-wise Loan Classification of all scheduled commercial banks in India ................................................. 14
Figure 4: Bank Group-wise: Gross GNPA to Gross Advances ratio .............................................................................. 15
Figure 5: Bank Group-wise share of gross advances ................................................................................................... 18
Figure 6: Bank Group-wise share of GNPAs ................................................................................................................. 18
Figure 7: Slippage Ratio: All SCBs ................................................................................................................................. 19
Figure 8: GNPA Ratio and Slippage Ratio: Pre and Post Crisis ..................................................................................... 20
Figure 9: CRAR and GNPA ratio.................................................................................................................................... 38
Figure 10: Foreign borrowings to Total Assets ............................................................................................................ 39
Figure 11: Inter-Bank Loans to Borrowings ratio ......................................................................................................... 39
Figure 12: Bank Group wise borrowings as a percentage of total assets .................................................................... 40
Figure 13: Secured Advances as a percentage of Advances ........................................................................................ 44
Figure 14: Sector-wise composition of NPAs: All SCBs (%) .......................................................................................... 45
Figure 15: Sector-wise composition of NPLs: Private Sector Banks (%) ...................................................................... 45
Figure 16: Sector-wise composition of NPLs - PSBs (%) ............................................................................................... 46
Figure 17: Advances to sensitive sector ...................................................................................................................... 46
Figure 18: Credit to and NPLs in Infrastructure ........................................................................................................... 48
Figure 19: Share of largest 3 banks .............................................................................................................................. 50
Figure 20: GDP Growth ................................................................................................................................................ 52
Figure 21: Growth in Advances .................................................................................................................................... 52
Figure 22: Asset Prices (SENSEX) ................................................................................................................................. 53
Figure 23: Movements in WPI and Call Rates .............................................................................................................. 55
Figure 24: Current Account Balance /GDP % ............................................................................................................... 56
Figure 25: Capital Flows ............................................................................................................................................... 57
Figure 26: External Debt to GDP Ratio ......................................................................................................................... 57
Figure 27: Exchange Rates Movements ....................................................................................................................... 59
Figure 28: Financial Health Index: 5 sectors ................................................................................................................ 70
Figure 29: Movements in GNPA ................................................................................................................................ 108
Figure 30: Reductions as a percentage of (Opening GNPA & Additions to GNPA) .................................................... 108
Figure 31: Reductions as a percentage of (Opening GNPA & Additions to GNPA) – PVSO and SB ........................... 109
Figure 32: Composition of NPA reduction ................................................................................................................. 110
Figure 33: Write-offs and Recoveries from written offs: All banks ........................................................................... 111
Figure 34: Bank GroupWise NPA write-offs and recoveries from written offs .......................................................... 111
Figure 35: Non-Performing Assets (NPAs) Recovered by PSBs in India ..................................................................... 112
Figure 36: NPAs of SCBs Recovered through Various Channels (Number of cases referred) .................................... 113
Figure 37: NPAs of SCBs Recovered through Various Channels (Amount Recovered) .............................................. 114
Figure 38: NPAs of SCBs Recovered through Various Channels- Amount Recovered/Amount involved .................. 116
Figure 39: Share of Institutions in Total Securitized Receipts of SCs/RCs ................................................................. 118
Figure 40: Restructured Assets as a percentage of Gross Advances –All Banks ........................................................ 119
Figure 41: Restructured Assets as a percentage of Gross Advances – PSBs Vs Private Sector Banks ....................... 119
Figure 42: Percentage of Total Restructured Assets ................................................................................................. 120
Figure 43: Bank group-wise corporate debt restructuring (CDR) .............................................................................. 121
4
List of Tables
Table 1: Descriptive Statistics of Bank level factors .................................................................................................... 61
Table 2: Correlation Coefficients- Bank level Factors .................................................................................................. 62
Table 3: Panel Regressions: Bank Level Variables - 2005 to 2013 ............................................................................... 64
Table 4: Panel Regressions: Bank Level Variables - Pre-Crisis and Post-crisis ............................................................. 67
Table 5: Panel Regressions - Industry level variables .................................................................................................. 71
Table 6 : Descriptive Statistics – Macro-economic factors .......................................................................................... 72
Table 7 : Macro-Economic Variables- Pre and Post Crisis ............................................................................................ 73
Table 8: Correlation coefficients - Macro-Economic Variables ................................................................................... 73
Table 9 : Panel Regressions - Macro-economic Variables ........................................................................................... 75
Table 10: Descriptive Statistics - CG variables ............................................................................................................. 97
Table 11: CG Variables - PSBS Vs. Private Sector Banks .............................................................................................. 97
Table 12: Correlation Coefficients - CG variables ........................................................................................................ 98
Table 13: Panel Regressions - CG Variables ................................................................................................................. 98
Table 14: Panel Regressions - CG Variables - Pre & Post Crisis .................................................................................... 99
Table 15 : Panel Regressions - PVSO .......................................................................................................................... 100
Table 16: One Time Settlement (OTS) ....................................................................................................................... 117
5
Chapter I: Introduction and Research Questions
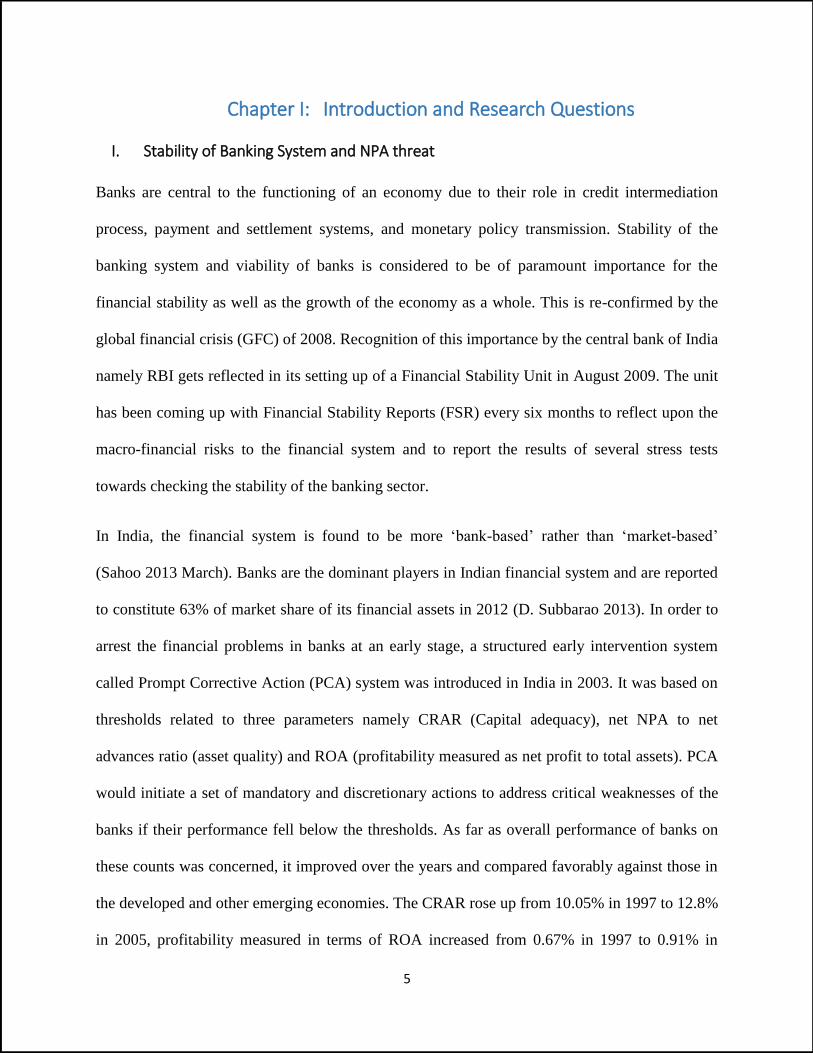
I. Stability of Banking System and NPA threat
Banks are central to the functioning of an economy due to their role in credit intermediation
process, payment and settlement systems, and monetary policy transmission. Stability of the
banking system and viability of banks is considered to be of paramount importance for the
financial stability as well as the growth of the economy as a whole. This is re-confirmed by the
global financial crisis (GFC) of 2008. Recognition of this importance by the central bank of India
namely RBI gets reflected in its setting up of a Financial Stability Unit in August 2009. The unit
has been coming up with Financial Stability Reports (FSR) every six months to reflect upon the
macro-financial risks to the financial system and to report the results of several stress tests
towards checking the stability of the banking sector.
In India, the financial system is found to be more ‘bank-based’ rather than ‘market-based’
(Sahoo 2013 March). Banks are the dominant players in Indian financial system and are reported
to constitute 63% of market share of its financial assets in 2012 (D. Subbarao 2013). In order to
arrest the financial problems in banks at an early stage, a structured early intervention system
called Prompt Corrective Action (PCA) system was introduced in India in 2003. It was based on
thresholds related to three parameters namely CRAR (Capital adequacy), net NPA to net
advances ratio (asset quality) and ROA (profitability measured as net profit to total assets). PCA
would initiate a set of mandatory and discretionary actions to address critical weaknesses of the
banks if their performance fell below the thresholds. As far as overall performance of banks on
these counts was concerned, it improved over the years and compared favorably against those in
the developed and other emerging economies. The CRAR rose up from 10.05% in 1997 to 12.8%
in 2005, profitability measured in terms of ROA increased from 0.67% in 1997 to 0.91% in
6
2005, and the asset quality improved in terms of decline in ‘net NPA to net advances ratio’ from
8.1 % in 1997 to 2% in 2005. The improvement in performance continued till the year the banks
in India were hit by the effects of Global Financial Crisis (GFC) in 2008-09. In 2008, CRAR
improved to 13%, ROA rose to 1% and net NPA ratio came down to 1%.
Even though the banking system in India showed remarkable resilience during the crisis period
when compared to its counterparts in developed countries, FSR Dec 2011 reported deterioration
in the financial soundness indicators during post-crisis period. FSR Dec 2013 reported all major
risk dimensions in Banking Stability Indicator (BSI) to have shown increasing vulnerabilities in
the Indian banking sector. It also underscored the need to tackle the NPAs in Indian banks on a
priority basis. The biggest challenge emerged in the form of high NPAs, particularly in public
sector banks (PSBs).
Media Attention: Lately banks in India have drawn a lot of media attention due to a steep rise in
NPAs and a sharp increase in assets restructured, predominantly in PSBs. Moody’s Investors
Service lowered its outlook on the financial strength of State Bank of India, the dominant player
in the Indian banking industry from ‘stable’ to ‘negative’ (ET, Sep 2013)1.
Higher NPA levels also caused deposits or bonds of 24 PSBs to be ‘ineligible’ as safe
investments by Employees Provident Fund Organization (EPFO) as per their investment
guidelines. Consequently these public sector banks lost out on annual inflow of funds worth
around Rs50,000 crores from EPFO (ET Bureau 20 Jun 2014).
It might be impossible to eliminate non-performing assets (NPAs) from the books of the banks,
which are into the business of taking credit risks when granting loans. But high levels of NPAs
1 http://articles.economictimes.indiatimes.com/2013-09-24/news/42361347_1_global-ratings-firm-asset-quality-sbi
7
can pose a big threat to the viability of the banks and can lead to bank failures (Barr and Siems
1994; Demirgüç-Kunt and Detragiache 1998). Bank failures in turn, through its
interconnectedness can threaten the stability of the financial system of an economy as a whole. A
number of papers in the literature have found increase in NPAs to be associated with contraction
of credit, slowdown in economic activity, depreciation of exchange rate (Bock and Demyanets
2012, Klein 2013) as well as increase in unemployment and inflation (Klein, 2013). For India,
RBI discussion paper (Mishra et al. 2013 Jan) has indeed found the stress in banking sector to be
able to explain the stress in its financial sector.
The potential damage emanating from higher NPAs in India seems more threatening because
India traditionally has fiscal deficits. The current account deficit (CAD) of India reached an all-
time high of 4.8% of GDP in 2012-13. High level of NPAs combined with large current account
deficit is often found to be associated with banking crises (Leaven and Valencia, 2008, Kauko,
K. 2012). The context makes it imperative to examine the NPAs of Indian banking system.
Policy Implications : Investigating into the drivers of NPAs will help regulators understand
whether the impact of macro-economic factors are greater than bank-specific factors, and which
are the most dominant factors influencing NPAs in banks. This would help the bank regulators
devise preventive micro or macro prudential measures to contain future NPAs in banks.
Depending upon which bank-specific factors are found most important driver of NPA, micro-
prudential measures can be devised, for example to discourage banks from high risk lending,
encouraging banks to improve upon their lending practices. If macro-economic factors are
dominant, macro-prudential measures can be, for example in the form of increasing capital
and/or liquidity buffers, countercyclical provisioning so as to make the banks equipped enough
to absorb macro-economic shocks. Regulators can also learn whether there is need to strengthen
8
bank supervision and if so, how to make the supervision more efficient by focusing on the most
important factors. A quick review of the past NPA handling by the banks and the regulators
would also help them in deciding on the most effective corrective mechanism towards resolving
the current NPA over-hang. A better knowledge of the NPA drivers can also help improve upon
the existing stress testing exercise of the bank supervisor.
II. Indian Banking Structure in brief
Before we start enquiring into the NPA behavior of banks in India it is important to have a basic
understanding of the structure of Indian banking system. The banking sector in India comprises of
Scheduled Commercial Banks (SCBs) 2, Cooperative Banks and Local Area Banks. The
Scheduled Commercial Banks (SCBs) comprise 92.4 percent of the total assets of the entire
banking system and hence are the most dominant in the banking system (Subbarao 2013). SCBs
can be public sector banks, private sector banks, foreign banks and regional rural banks.
Nationalized banks and State bank of India (SBI) along with its subsidiaries are called the public
sector banks (PSBs). Private sector banks are further divided into old private sector banks and
new private sector banks.
Public sector banks were born in nationalization waves of 1969 and 1980. The new private sector
scheduled banks came into existence after the reforms of 1992 permitted their entry. Some more
new banks in the private sector are expected get their license of operation from RBI in the near
future. The foreign banks are the Indian branches or subsidiaries of banks incorporated outside
India and they started entering India in 1994, following the entry of new private sector banks.
2 Scheduled commercial banks are the banks which are included in second schedule of RBI Act, 1934 and thereby operate under the overall supervision of RBI to primarily carry the banking business in India. They must maintain a paid up capital and reserves of not less than Rs 5 Lakhs and must satisfy RBI that they their affairs are not conducted in a manner detrimental to the depositors’ interests.
9
As on 31st March 2013, there were 26 PSBs comprising of 19 nationalized banks, SBI with its 5
associate banks and 1 other public sector bank. There were 20 private sector banks, out of which
13 were old private sector banks and 7 were new private sector banks. This study focuses on the
public sector and private sector scheduled commercial banks in India.
III. What is meant by Non-Performing Asset (NPA) in India - Evolving definitions
It is important to understand the meaning and definition of Non-Performing Asset (NPA) at the
outset of the study. The term ‘non-performing asset’ (NPA) used in India corresponds to the
term ‘non-performing loans’ (NPL) in the academic literature. So we would be using these two
terms interchangeably in our study.
In India, a Health code system was introduced in 1985 for continuous evaluation of the quality
of advance portfolio (loan portfolio) of banks, its effective monitoring and adequate
provisioning. It classified advances into eight codes namely (1) Satisfactory & (2) Irregular–
accounts for which safety was not suspected, (3) Viable/ under nursing, (4) Non-viable/sticky,
(5) Advances recalled, (6) Suit filed, and (7) Decreed debts - accounts reflecting serious
irregularities, (8) Bad and doubtful debts where recoverability of banks dues become doubtful
due to shortfall in the value of security or inability/unwillingness of the borrower to repay the
dues. But the health code system suffered from lack of transparency, objectivity and uniformity
of yardstick for measuring NPA.
In order to bring in transparency as well as to move towards international best practice,
prudential norms related to asset classification and provisioning was introduced by RBI in India
in 1992-93 following Narasimham Committee-I recommendations. The norms brought in
quantification and objectivity to assessment of NPAs.
10
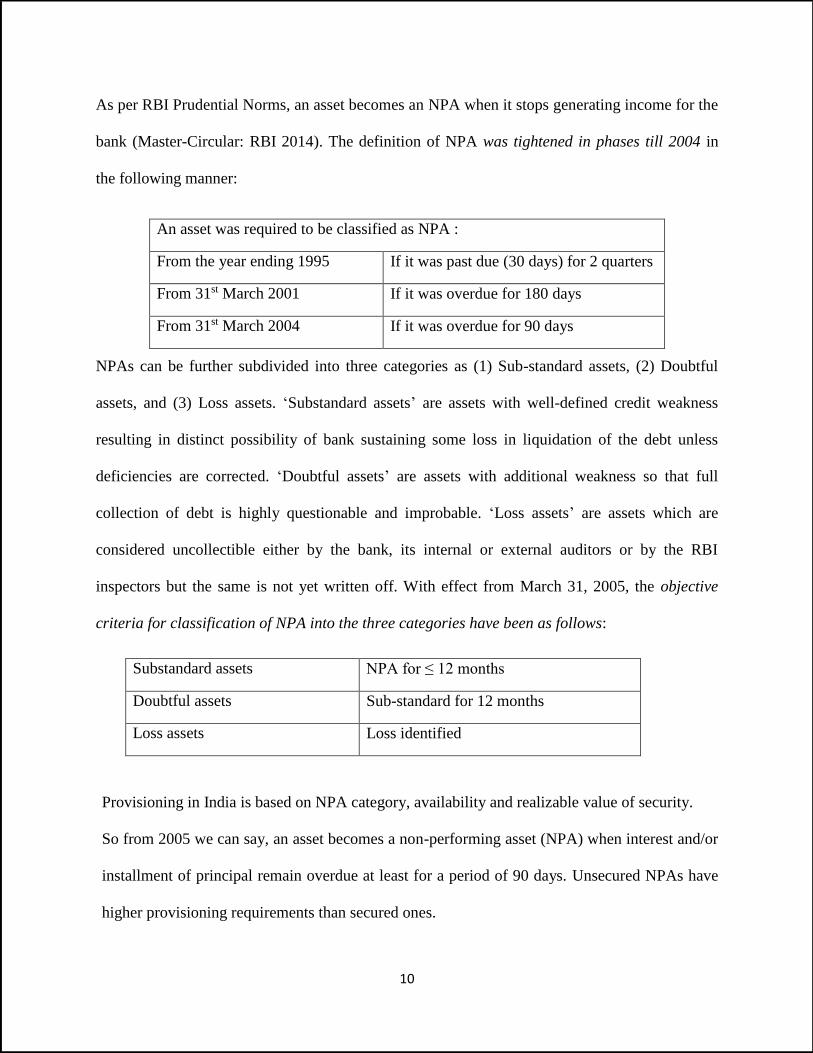
As per RBI Prudential Norms, an asset becomes an NPA when it stops generating income for the
bank (Master-Circular: RBI 2014). The definition of NPA was tightened in phases till 2004 in
the following manner:
An asset was required to be classified as NPA :
From the year ending 1995 If it was past due (30 days) for 2 quarters
From 31st March 2001 If it was overdue for 180 days
From 31st March 2004 If it was overdue for 90 days
NPAs can be further subdivided into three categories as (1) Sub-standard assets, (2) Doubtful
assets, and (3) Loss assets. ‘Substandard assets’ are assets with well-defined credit weakness
resulting in distinct possibility of bank sustaining some loss in liquidation of the debt unless
deficiencies are corrected. ‘Doubtful assets’ are assets with additional weakness so that full
collection of debt is highly questionable and improbable. ‘Loss assets’ are assets which are
considered uncollectible either by the bank, its internal or external auditors or by the RBI
inspectors but the same is not yet written off. With effect from March 31, 2005, the objective
criteria for classification of NPA into the three categories have been as follows:
Substandard assets NPA for ≤ 12 months
Doubtful assets Sub-standard for 12 months
Loss assets Loss identified
Provisioning in India is based on NPA category, availability and realizable value of security.
So from 2005 we can say, an asset becomes a non-performing asset (NPA) when interest and/or
installment of principal remain overdue at least for a period of 90 days. Unsecured NPAs have
higher provisioning requirements than secured ones.
11
IV. Why worry about NPAs? : Potential Consequences
Empirically high level of NPAs has been found to be associated with contraction of credit,
slowdown of GDP growth, depreciation of exchange rates, inflation and unemployment (Bock
and Demyanets 2012, Klein 2013). The impact starts with the pressure NPAs create on the
income statement and balance sheet of banks.
Profitability: NPAs affect the profitability of the banks adversely by way of affecting both
income and expenses. A high NPA means the asset is not performing or bringing in the interest
income it was expected to bring. Income from NPAs can be booked only on actual realization of
the same and not on accrual basis. So this will have an adverse impact on bank’s interest
income. A lower interest income would lead to lower total income and hence lower net profits.
From expenses point of view, a high NPA means higher provisioning requirements as well as
higher expenses involved in NPA recovery process (like litigation and administrative costs),
both of which would reduce the net profits.
Capital Adequacy: Reduction in profits due to high NPA is likely to result in lower retained
earnings, which in turn is likely to create adverse effect on Tier 1 component of CRAR.
Moreover, Total Risk Weighted Assets (TRWA) increase because of the risks attached to NPA
portion of the total asset composition. Increase in TRWA with absolute amount of capital funds
remaining intact is likely to bring down CRAR.
Liquidity and Credit growth: Lower profits or earnings arising from NPAs also boils down to
lower cash inflow, thereby impairing bank’s liquidity. Poor liquidity together with pressure on
profits and capital adequacy adversely affects the willingness and ability of the banks to expand
its loan portfolio. Reluctance on the part of banks to grant loans can spill over to the economy in
the form of credit rationing and credit crunch.
12
Stock prices and Solvency: High NPA signals weakness in asset quality of banks and is likely
to bring down the stock prices of banks because the investors would perceive assets of such
banks to be of high risk.
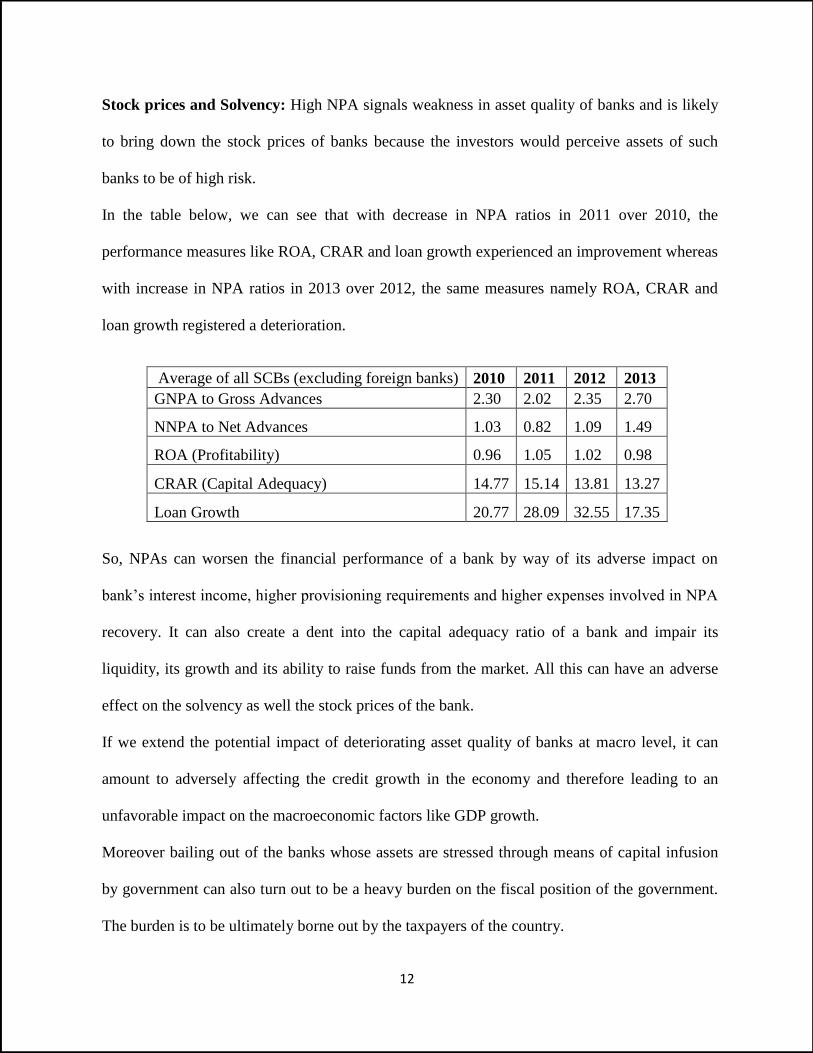
In the table below, we can see that with decrease in NPA ratios in 2011 over 2010, the
performance measures like ROA, CRAR and loan growth experienced an improvement whereas
with increase in NPA ratios in 2013 over 2012, the same measures namely ROA, CRAR and
loan growth registered a deterioration.
So, NPAs can worsen the financial performance of a bank by way of its adverse impact on
bank’s interest income, higher provisioning requirements and higher expenses involved in NPA
recovery. It can also create a dent into the capital adequacy ratio of a bank and impair its
liquidity, its growth and its ability to raise funds from the market. All this can have an adverse
effect on the solvency as well the stock prices of the bank.
If we extend the potential impact of deteriorating asset quality of banks at macro level, it can
amount to adversely affecting the credit growth in the economy and therefore leading to an
unfavorable impact on the macroeconomic factors like GDP growth.
Moreover bailing out of the banks whose assets are stressed through means of capital infusion
by government can also turn out to be a heavy burden on the fiscal position of the government.
The burden is to be ultimately borne out by the taxpayers of the country.
Average of all SCBs (excluding foreign banks) 2010 2011 2012 2013
GNPA to Gross Advances 2.30 2.02 2.35 2.70
NNPA to Net Advances 1.03 0.82 1.09 1.49
ROA (Profitability) 0.96 1.05 1.02 0.98
CRAR (Capital Adequacy) 14.77 15.14 13.81 13.27
Loan Growth 20.77 28.09 32.55 17.35

13
V. Trends in NPA
As per Valencia and Laeven (2008), the non-performing assets of public sector banks in India
had reached a peak of 20% in 1995. Under the circumstances, Narasimham Committee-II
(1998) on banking sector reforms and Tarapore Committee (1997) on capital account
convertibility had pressed upon the need to reduce NPAs in banks in India. In line with the
recommendations of these committees, several initiatives were taken to bring down the levels of
NPAs. ‘Gross NPA as a percentage Gross Advances’ showed a consistent decline from 17.8%
in financial Year 1996-97 to 2.7% in financial Year 2006-07, thereby reflecting significant
improvements in asset quality of banks (Trends and Progress reports of RBI). The Figure 1
below reflects the secular decline from 2002 till 2007.
Figure 1: GNPA to Gross Advances
The global financial crisis (GFC) hit the banks and the economies in 2008-09. But the Figure 1
above shows that the GNPA ratio of all scheduled commercial banks in India taken together did
not experience a sharp increase during 2008-09.
10.4
9.1
7.2
4.9
3.52.7 2.39 2.45 2.51 2.36
2.94 3.42
0
2
4
6
8
10
12
20
02
20
03
20
04
20
05
20
06
20
07
20
08
20
09
20
10
20
11
20
12
20
13
Pe
rce
nta
ge
Year
GNPA to Gross Advances ratio: All SCBs
All Scheduled Commercial Banks

14
Figure 2: Growth in GNPA and Gross Advances for All SCBs
However, Figure 2 above shows that during the post-crisis years, the GNPA of the banks were
growing at an alarming rate (45.67% and 34.1% during 2012 and 2013 respectively when the
advances grew only at around 15%). During the period 2003 to 2007 however, the growth in
GNPA had been highly negative on the face of significantly high positive growth in advances.
Figure 3: Asset-wise Loan Classification of all scheduled commercial banks in India
-0.90
-7.70
-11.33 -10.95
-1.85
10.74
22.4819.93
15.05
45.67
34.10
14
.05
16
.16
29
.84
25
.81
28
.50
23
.14
19
.59
17
.09 2
2.2
7
16
.89
15
.10
-20.00
-10.00
0.00
10.00
20.00
30.00
40.00
50.00
2003 2004 2005 2006 2007 2008 2009 2010 2011 2012 2013
Pe
rce
nta
ge
Year
All Scheduled Commercial Banks
Growth in GNPA Growth in gross advances
95
.1 96
.5
97
.3
97
.61
97
.55
97
.49
97
.64
97
.06
96
.58
1.2
1
1.1 1.1
2
1.2
9
1.2
6
1
1.4
5
1.5
93.12
1.3 1.04 0.96 1 1.12 1.28 1.630.6 0.4 0.3 0.23 0.2 0.24 0.24 0.21 0.21
90
92
94
96
98
100
102
2005 2006 2007 2008 2009 2010 2011 2012 2013
Pe
rce
nta
ge
Year
Loan Classification- All Banks
loss_adv_perc doubt_adv_perc substd_adv_per std_adv_per
15
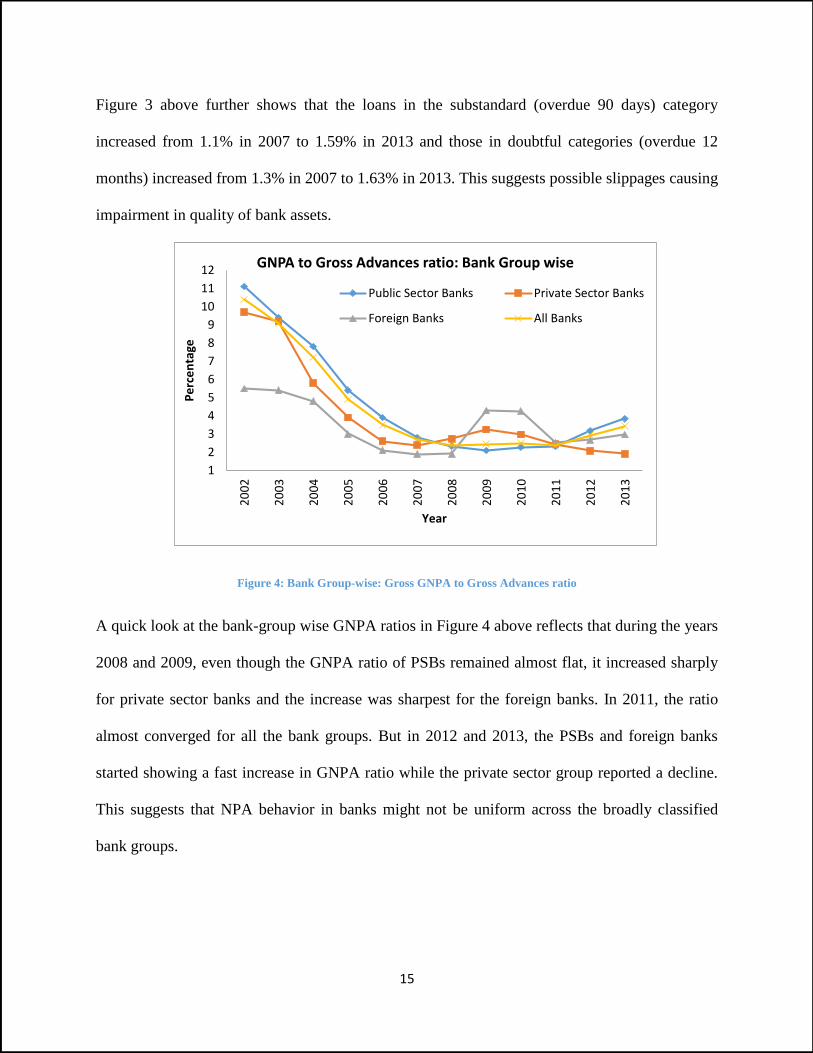
Figure 3 above further shows that the loans in the substandard (overdue 90 days) category
increased from 1.1% in 2007 to 1.59% in 2013 and those in doubtful categories (overdue 12
months) increased from 1.3% in 2007 to 1.63% in 2013. This suggests possible slippages causing
impairment in quality of bank assets.
Figure 4: Bank Group-wise: Gross GNPA to Gross Advances ratio
A quick look at the bank-group wise GNPA ratios in Figure 4 above reflects that during the years
2008 and 2009, even though the GNPA ratio of PSBs remained almost flat, it increased sharply
for private sector banks and the increase was sharpest for the foreign banks. In 2011, the ratio
almost converged for all the bank groups. But in 2012 and 2013, the PSBs and foreign banks
started showing a fast increase in GNPA ratio while the private sector group reported a decline.
This suggests that NPA behavior in banks might not be uniform across the broadly classified
bank groups.
1
2
3
4
5
6
7
8
9
10
11
12
20
02
20
03
20
04
20
05
20
06
20
07
20
08
20
09
20
10
20
11
20
12
20
13
Pe
rce
nta
ge
Year
GNPA to Gross Advances ratio: Bank Group wise
Public Sector Banks Private Sector Banks
Foreign Banks All Banks
16
VI. Research Questions
The context provides motivation to enquire into the behavior of the asset quality of banks in
India across bank-groups during three phases: the boom phase just before the global financial
crisis of 2008-09, during the crisis year, as well as during the post crisis period. The primary
goal of this research is to identify the factors which can explain the NPA behavior and the
divergence in the same, if any across bank groups and over the phases.
In addition to above, this study also aims to critically analyze initiatives taken to contain NPAs
at macro and micro levels and comment on their effectiveness. This analysis is likely to help us
identify the challenges in containing NPAs in Indian banks and providing suggestions for
handling the same. So, the specific research questions sought to be addressed by the study can
be laid down as follows:
1. Do PSBs always bear a higher burden of NPAs than that of Private Sector banks?
2. Whether factors which drive the NPAs for PSBs are different from the factors which drive
the NPAs for private sector banks
3. Whether factors which drive the NPAs for listed banks are different from factors which
drive NPAs for non-listed banks
4. What is the impact of secured loans and priority sector lending on NPAs
5. Whether macro-economic variables play a more significant role than bank specific factors in
determining NPA levels
6. Whether corporate governance factors like board composition and ownership affect NPAs
7. How effective are the channels of recoveries of the past like Lok Adalats, OTS, DRTs,
SARFAESI.

17
The results would inform and help policy makers (RBI) in devising their future policies
particularly those related to supervision and governance of banks. Banks and supervisors can
draw insights towards improving on their NPA handling. Understanding the causes of NPA
would make the depositors and investors of the banks better informed helping them in their
financial decisions with respect to the bank under their consideration. Sub-dividing the analysis
over three broad periods would also help the stakeholders understand whether the NPA
determining factors have changed over the periods and how the change can be incorporated in
decisions related to management, supervision and investment in banks. Decomposing the
analysis by bank-groups might help the stakeholders understand if the banks need to be
treated/considered differently and if so how.
We will handle the listed questions one by one. So, let us start with the first question.
VII. Do PSBs always bear the higher burden of NPA than Private Sector banks?
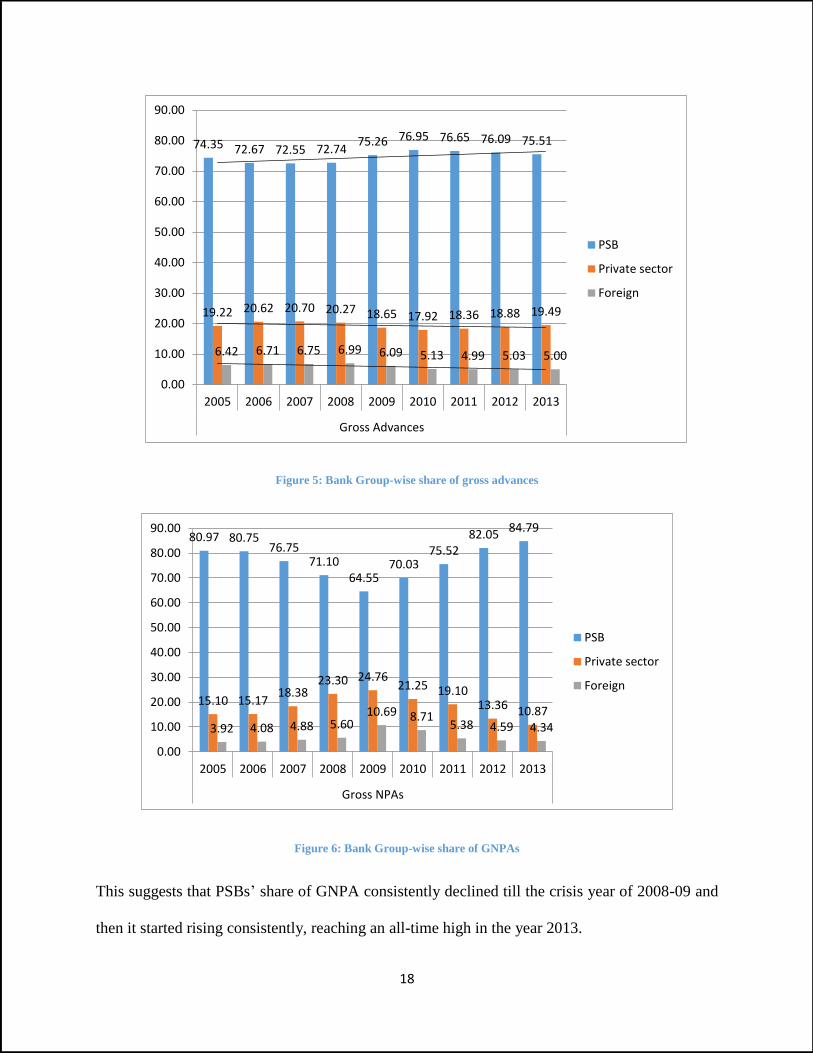
Figure 5 and Figure 6 below show that in 2005, PSBs’ share of gross advances as a percentage of
total gross advances of all SCBs stood at 74.35% though their share of GNPA was much higher
at 80.97%.
In 2009, PSBs’ share of gross advances increased to 75.26% but their share of GNPA decreased
drastically to 64.55%. However in 2013, PSB’s share of GNPA was highest across all the years
at 84.79% even though the share of gross advances remained at 75.51%, very close to its share in
the previous years.
18
Figure 5: Bank Group-wise share of gross advances
Figure 6: Bank Group-wise share of GNPAs
This suggests that PSBs’ share of GNPA consistently declined till the crisis year of 2008-09 and
then it started rising consistently, reaching an all-time high in the year 2013.
74.35 72.67 72.55 72.7475.26 76.95 76.65 76.09 75.51
19.22 20.62 20.70 20.27 18.65 17.92 18.36 18.88 19.49
6.42 6.71 6.75 6.99 6.09 5.13 4.99 5.03 5.00
0.00
10.00
20.00
30.00
40.00
50.00
60.00
70.00
80.00
90.00
2005 2006 2007 2008 2009 2010 2011 2012 2013
Gross Advances
PSB
Private sector
Foreign
80.97 80.7576.75
71.1064.55
70.0375.52
82.0584.79
15.10 15.1718.38
23.30 24.7621.25 19.10
13.36 10.87
3.92 4.08 4.88 5.6010.69 8.71
5.38 4.59 4.34
0.00
10.00
20.00
30.00
40.00
50.00
60.00
70.00
80.00
90.00
2005 2006 2007 2008 2009 2010 2011 2012 2013
Gross NPAs
PSB
Private sector
Foreign
19
0.41 0.41
0.65
0.59
1.12 1.09
0.95
1.22
1.26
0.0
00
.50
1.0
01
.50
2005 2006 2007 2008 2009 2010 2011 2012 2013
Slippage Ratio
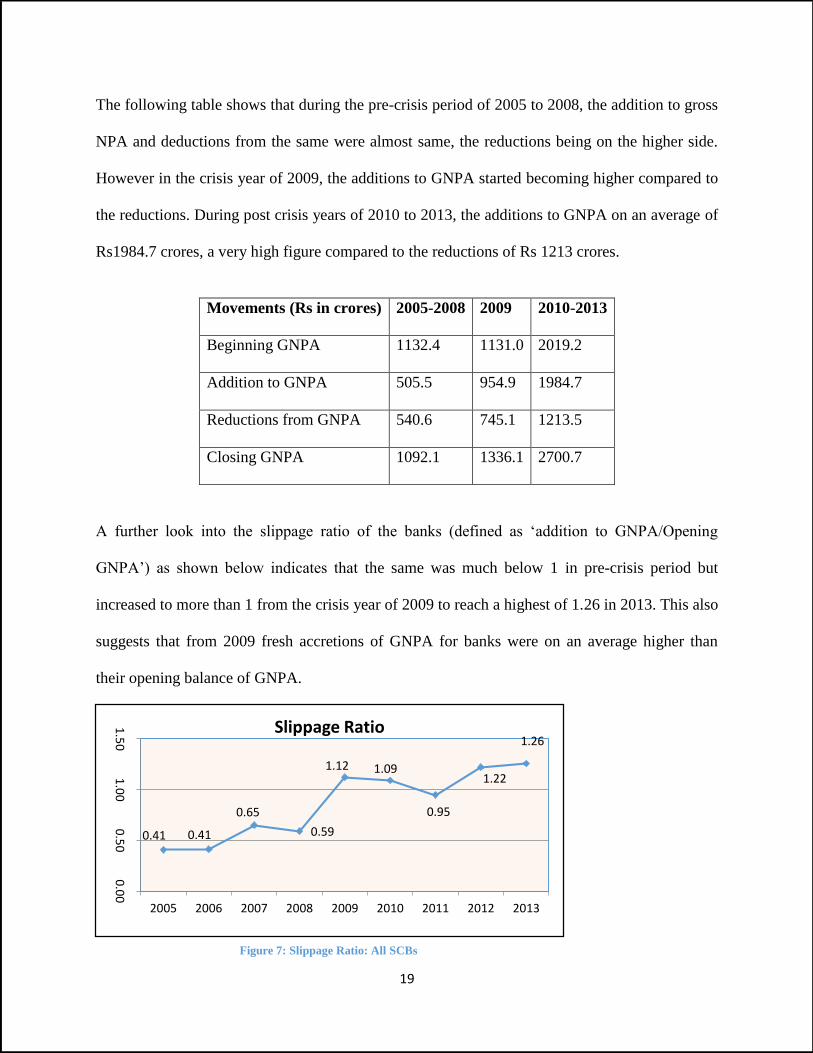
The following table shows that during the pre-crisis period of 2005 to 2008, the addition to gross
NPA and deductions from the same were almost same, the reductions being on the higher side.
However in the crisis year of 2009, the additions to GNPA started becoming higher compared to
the reductions. During post crisis years of 2010 to 2013, the additions to GNPA on an average of
Rs1984.7 crores, a very high figure compared to the reductions of Rs 1213 crores.
Movements (Rs in crores) 2005-2008 2009 2010-2013
Beginning GNPA 1132.4 1131.0 2019.2
Addition to GNPA 505.5 954.9 1984.7
Reductions from GNPA 540.6 745.1 1213.5
Closing GNPA 1092.1 1336.1 2700.7
A further look into the slippage ratio of the banks (defined as ‘addition to GNPA/Opening
GNPA’) as shown below indicates that the same was much below 1 in pre-crisis period but
increased to more than 1 from the crisis year of 2009 to reach a highest of 1.26 in 2013. This also
suggests that from 2009 fresh accretions of GNPA for banks were on an average higher than
their opening balance of GNPA.
Figure 7: Slippage Ratio: All SCBs

20
Bank group-wise and crisis based period-wise analysis plotted in the graph below shows that
during the pre-crisis period as well as during the crisis year, both the ‘GNPA ratio’ and ‘Slippage
ratio’ of PSBs were lower compared to that of private sector banks. However, during the post-
crisis period the behavior of these two ratios just reversed and was significantly higher for PSBs
compared to private sector banks.
Figure 8: GNPA Ratio and Slippage Ratio: Pre and Post Crisis
Further it is interesting to note in the table below that among all bank-groups, it was the new
private sector banks (PVSN) which on an average had experienced the highest slippage of 3.13
and highest GNPA ratio of 3.25 in the crisis year of 2009. The highest GNPA and slippage ratio
during the post crisis was that of state banks (SB) followed by nationalized banks (NB). In the
pre-crisis period however, as far as GNPA ratio was concerned the old private sector banks
(PVSO) had it highest at 5.48% whereas in terms of slippage ratio it was the new private sector
(PVSN) which was leading the pack.
0.00
1.00
2.00
3.00
4.00
5.00
pre
_cr
isis
cris
is
po
st_
cris
is
pre
_cr
isis
cris
is
po
st_
cris
isGNPA Ratio slippage_ratio
3.30
1.73
2.54
0.440.82
1.24
4.72
2.64
2.09
0.62
1.52
0.99
psb
pvt
21
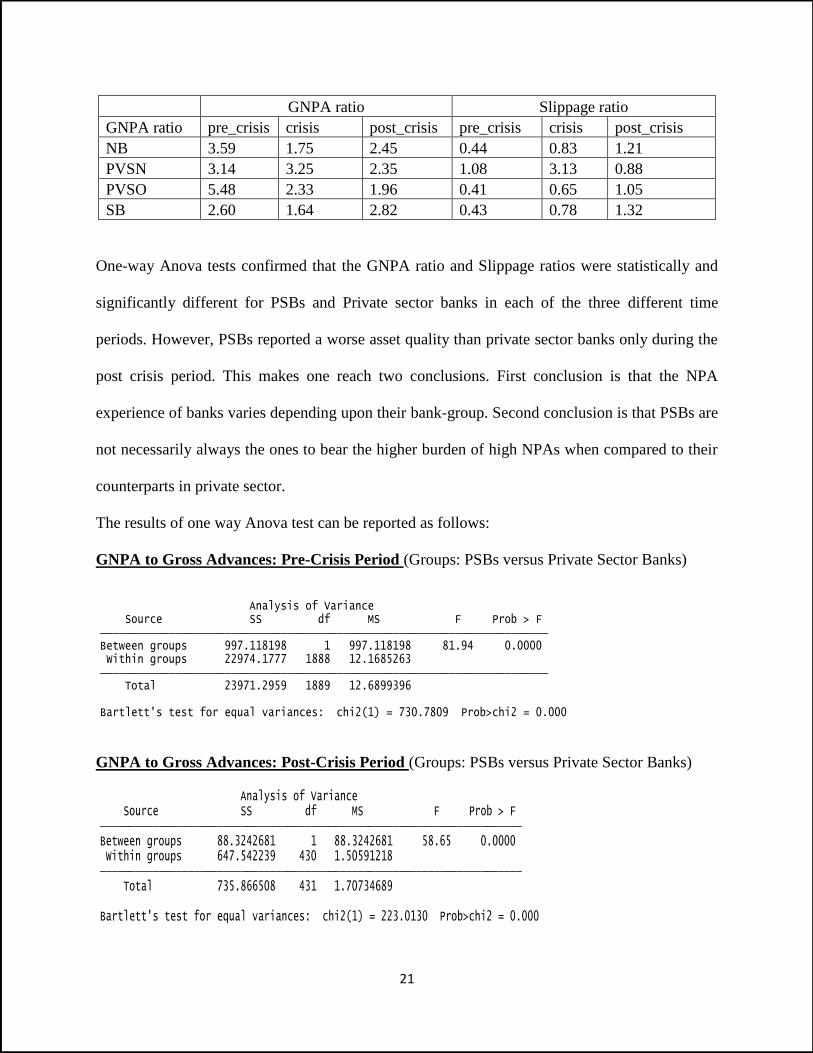
GNPA ratio Slippage ratio
GNPA ratio pre_crisis crisis post_crisis pre_crisis crisis post_crisis
NB 3.59 1.75 2.45 0.44 0.83 1.21
PVSN 3.14 3.25 2.35 1.08 3.13 0.88
PVSO 5.48 2.33 1.96 0.41 0.65 1.05
SB 2.60 1.64 2.82 0.43 0.78 1.32
One-way Anova tests confirmed that the GNPA ratio and Slippage ratios were statistically and
significantly different for PSBs and Private sector banks in each of the three different time
periods. However, PSBs reported a worse asset quality than private sector banks only during the
post crisis period. This makes one reach two conclusions. First conclusion is that the NPA
experience of banks varies depending upon their bank-group. Second conclusion is that PSBs are
not necessarily always the ones to bear the higher burden of high NPAs when compared to their
counterparts in private sector.
The results of one way Anova test can be reported as follows:
GNPA to Gross Advances: Pre-Crisis Period (Groups: PSBs versus Private Sector Banks)
GNPA to Gross Advances: Post-Crisis Period (Groups: PSBs versus Private Sector Banks)
Bartlett's test for equal variances: chi2(1) = 730.7809 Prob>chi2 = 0.000
Total 23971.2959 1889 12.6899396 Within groups 22974.1777 1888 12.1685263Between groups 997.118198 1 997.118198 81.94 0.0000 Source SS df MS F Prob > F Analysis of Variance
Bartlett's test for equal variances: chi2(1) = 223.0130 Prob>chi2 = 0.000
Total 735.866508 431 1.70734689 Within groups 647.542239 430 1.50591218Between groups 88.3242681 1 88.3242681 58.65 0.0000 Source SS df MS F Prob > F Analysis of Variance
22
Chapter–II: Literature Survey, Hypothesis Development and Research design
Given the threat high levels of NPAs can pose to bank solvencies and the potential of the bank
failures disrupting the financial stability of an economy, it is very important for the regulatory
authorities to have a track of NPAs in banks. It is crucial for the regulators to understand the
factors which underlie high levels of NPAs in banks so that they can accordingly devise
prudential measures towards NPA prevention and containment. The bank supervisors would also
need to take their resource allocation decisions towards selecting banks for on-site inspections so
that banks with potential problem loans can be detected early. So, a better understanding of the
NPA behavior of banks would help the supervisor allocate their resources more efficiently.
Stress testing and forecasting exercises by the bank supervisor can also be improved depending
upon the factors which are found to be most important in driving the levels of NPAs.
So the questions we are seeking to address in this section are as follows: Firstly, what are the
macro-level and micro-level factors determining NPAs in Indian Banks. This will help us
understand whether macro-economic variables play a more significant role than bank specific
factors in determining NPA levels. The introduction chapter shows bank group wise divergence
in NPA behavior. So the next question would be whether factors which drive the NPAs for PSBs
are different from the factors which drive the NPAs for private sector banks and whether factors
which drive the NPAs for listed banks are different from factors which drive NPAs for non-listed
banks. We would also check whether the variables which explain the NPAs in banks remain
same or are different across the two phases: before the global financial crisis and after the crisis.
This part of the study would start with a detailed literature survey. This would be followed by
research design and data, hypothesis development and the results.
23
I. Literature Survey
There is a large body of literature attempting to identify the determinants of loan quality in
banks. Enquiry has been made into bank-specific factors as well as macro-economic factors.
Keeton and Morris (1987) was one of the early studies on NPLs which found that local economic
conditions and unusually poor performance of particular industries (like agriculture and energy)
could explain a significant portion and bank’s risk taking tendencies (captured through equity to
assets ratio) to explain some portion of the variation in loan losses across 2500 banks in US.
Bank- level factors: Some studies exclusively focused on micro-level bank specific factors in
understanding non-performing loans (NPLs) behavior in banks (Berger & Deyoung, 1997b;
Keeton & Morris, 1987; Podpiera & Weill, 2008; Rossi, Schwaiger, & Winkler, 2005; Williams,
2004).
Berger and Deyoung 1997 examined US commercial banks during a period spanning 1985 to
1994 for intertemporal links between cost efficiency, bank capital and problem loans using
Granger causality approach. They found support for their ‘Bad luck hypothesis’ according to
which higher NPLs (primarily caused by uncontrollable external events) temporally precede
higher operating costs. The argument was that the administration of problem loans requires extra
costs associated with additional monitoring; workout arrangements; realization of collaterals;
defending bank’s stability to the regulator and market participants; and diverson of
management’s attention from other operational issues. They also found evidence supporting ‘bad
management hypothesis’ wherein the temporal ordering was opposite because lower operational
efficiency, acting as a proxy for poor credit appraisal skills and credit monitoring practices of a
bank, was expected to lead to higher NPLs in future.
24
However, they also postulated ‘skimping hypothesis’ arguing that reduced costs incurred in credit
appraisal and monitoring can make the bank look cost efficient in short run while it can lead to
higher NPLs in future. They also argued that thinly capitalised banks have ‘moral hazard’
incentives to increase risks in their loan portfolio, thereby leading to higher future NPLs. Their
evidence for skimping hypothesis was limited to banks which were consistently efficient over
time and that for moral hazard incentives was limited to banks which had capital ratio below the
sample median.
Williams (2004) applied Berger and Young’s granger causuality approach to European banks
between 1990 to 1998 and found support for ‘bad management’ hypothesis though their result
did not support the ‘bad luck’, ‘skimping’ or ‘moral hazard’ hypotheses. One of the reasons for
the difference in results was attributed to use of ‘loan loss provisons’ in their study rather than
NPLs for capturing problem loans.
Podpiera and Weill (2008) tested similar hypothesis on Czech banks between 1994 to 2005 using
a GMM panel data estimator and found support for ‘bad management’ hypothesis but they found
no support for ‘bad luck’ or ‘skimping’ hypothesis.
However, when Rossi, Schwaiger, and Winkler (2005) examined nine Central and East European
countries during 1995 to 2002, they found support for ‘bad luck’ hypothesis rather than for ‘bad
management’. Based on this they concluded that the lower level of efficiency found in CEECs
can be attributed to uncontrollable external factors.
Macro-economic factors: However another stream of literature evolved which attempted to
understand the variation in asset quality in banks in terms of macro-economic variables. The
25
theory related to pro-cyclicality of bank credit provided the background for this stream of
research.
Pro-cyclicality of bank credit: An economic boom typically results in increase in real wages for
households and decline in unemployment. This increases the purchasing power of households
and results in increase in consumer demand. Increase in consumer demand expands product
markets for companies who therefore need bank credit to fund their expansion. So during the
boom phase, bank credit expands. The NPLs and provisions are very low due to companies
earning higher profits and individuals earning higher income. However, during periods of
economic boom when the economy is expanding with credit growth, risks tend to creep into the
bank portfolio in the form of poor quality assets, due to credit appraisals becoming less stringent.
Jimenez and Saurina (2005) found evidence of credit terms becoming lenient during economic
boom both in terms of loan appraisal as well as collateral requirements, which translates into
expansionary credit policies. They concluded that the lenient credit terms might be explained
with theoretical models based on disaster myopia (Guttentag et al., 1986), herd behavior (Rajan,
1994) or, institutional memory and agency problems coupled with pressure due to increasing
bank competition. Disaster myopia relates to credit expansion before a negative future event due
to uncertainty associated with its potential impact. Herd behavior explains that banks accept
negative NPV projects during boom because the credit mistakes which are common at the
industry level are judged leniently. Principal agency problem can encourage bank managers to go
for excessive credit growth if the managers are motivated to increase their social presence/power
and particularly if managerial rewards are growth based. Institutional memory explains that the
learning experience from a loan bust gets lost with passing of time so that the managers expand
their loan portfolio having forgotten to avoid risky borrowers. Festić, Kavkler, and Repina
26
(2011) found credit growth to affect bank performance adversely due to soft loan constraints and
overheating of economies.
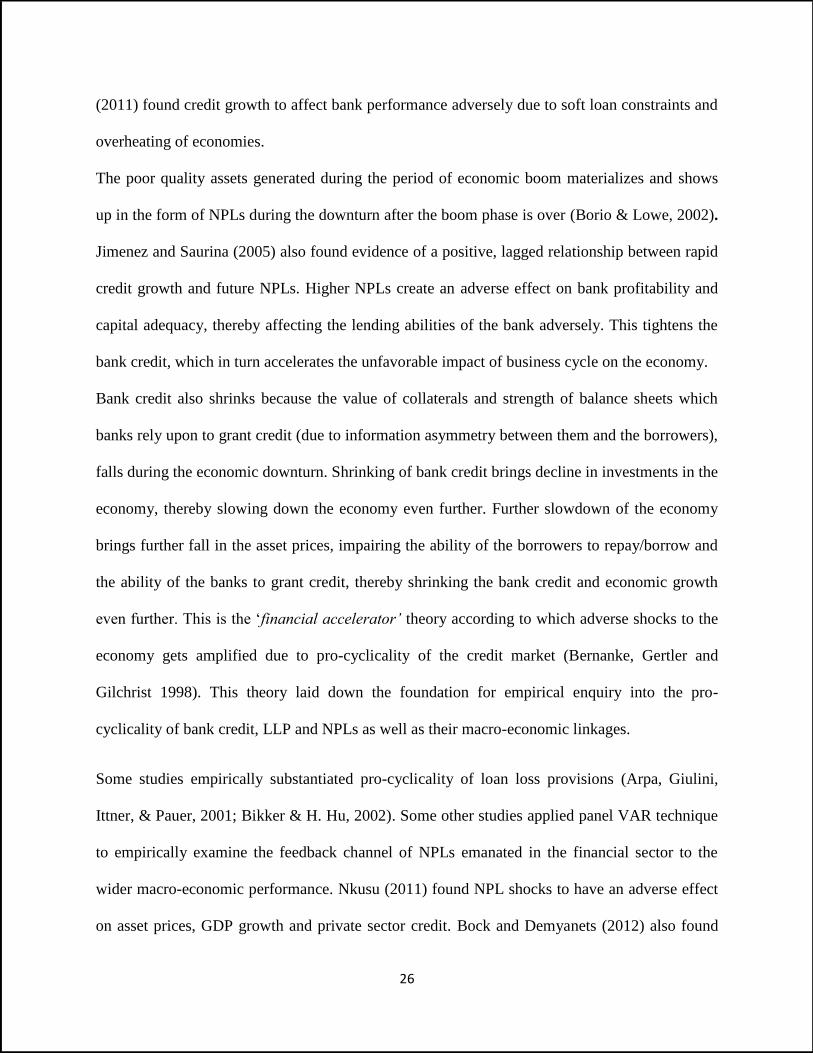
The poor quality assets generated during the period of economic boom materializes and shows
up in the form of NPLs during the downturn after the boom phase is over (Borio & Lowe, 2002).
Jimenez and Saurina (2005) also found evidence of a positive, lagged relationship between rapid
credit growth and future NPLs. Higher NPLs create an adverse effect on bank profitability and
capital adequacy, thereby affecting the lending abilities of the bank adversely. This tightens the
bank credit, which in turn accelerates the unfavorable impact of business cycle on the economy.
Bank credit also shrinks because the value of collaterals and strength of balance sheets which
banks rely upon to grant credit (due to information asymmetry between them and the borrowers),
falls during the economic downturn. Shrinking of bank credit brings decline in investments in the
economy, thereby slowing down the economy even further. Further slowdown of the economy
brings further fall in the asset prices, impairing the ability of the borrowers to repay/borrow and
the ability of the banks to grant credit, thereby shrinking the bank credit and economic growth
even further. This is the ‘financial accelerator’ theory according to which adverse shocks to the
economy gets amplified due to pro-cyclicality of the credit market (Bernanke, Gertler and
Gilchrist 1998). This theory laid down the foundation for empirical enquiry into the pro-
cyclicality of bank credit, LLP and NPLs as well as their macro-economic linkages.
Some studies empirically substantiated pro-cyclicality of loan loss provisions (Arpa, Giulini,
Ittner, & Pauer, 2001; Bikker & H. Hu, 2002). Some other studies applied panel VAR technique
to empirically examine the feedback channel of NPLs emanated in the financial sector to the
wider macro-economic performance. Nkusu (2011) found NPL shocks to have an adverse effect
on asset prices, GDP growth and private sector credit. Bock and Demyanets (2012) also found
27
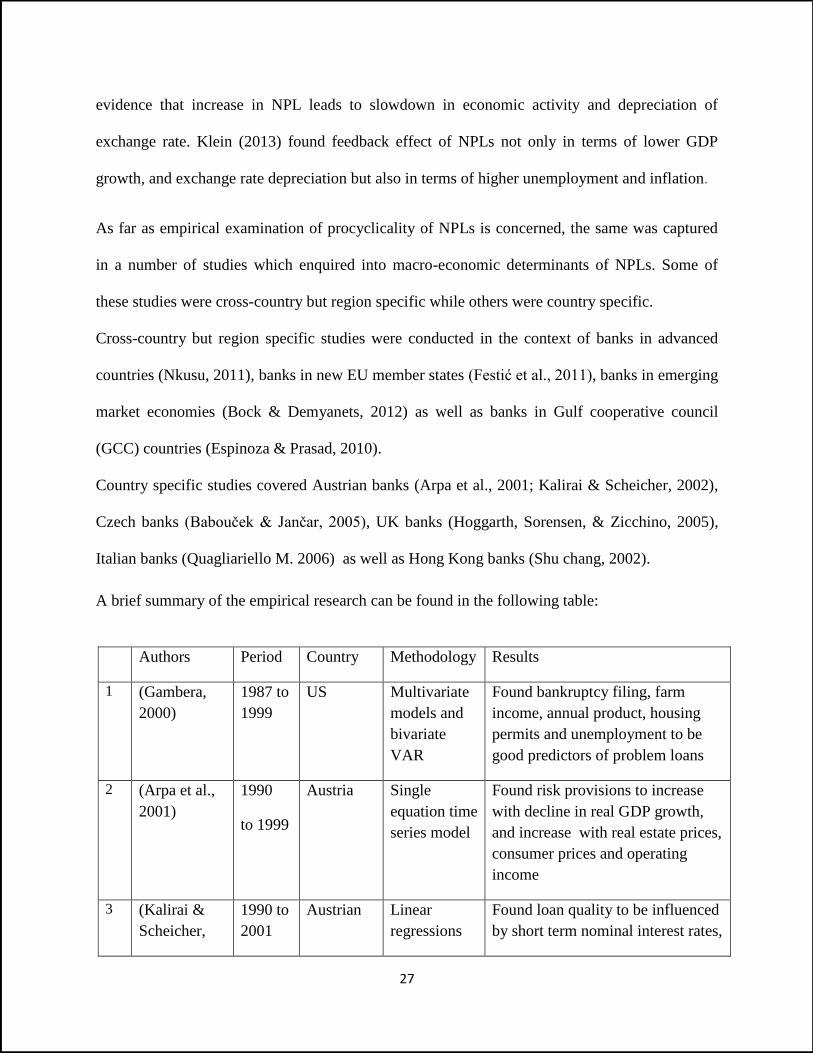
evidence that increase in NPL leads to slowdown in economic activity and depreciation of
exchange rate. Klein (2013) found feedback effect of NPLs not only in terms of lower GDP
growth, and exchange rate depreciation but also in terms of higher unemployment and inflation.
As far as empirical examination of procyclicality of NPLs is concerned, the same was captured
in a number of studies which enquired into macro-economic determinants of NPLs. Some of
these studies were cross-country but region specific while others were country specific.
Cross-country but region specific studies were conducted in the context of banks in advanced
countries (Nkusu, 2011), banks in new EU member states (Festić et al., 2011), banks in emerging
market economies (Bock & Demyanets, 2012) as well as banks in Gulf cooperative council
(GCC) countries (Espinoza & Prasad, 2010).
Country specific studies covered Austrian banks (Arpa et al., 2001; Kalirai & Scheicher, 2002),
Czech banks (Babouček & Jančar, 2005), UK banks (Hoggarth, Sorensen, & Zicchino, 2005),
Italian banks (Quagliariello M. 2006) as well as Hong Kong banks (Shu chang, 2002).
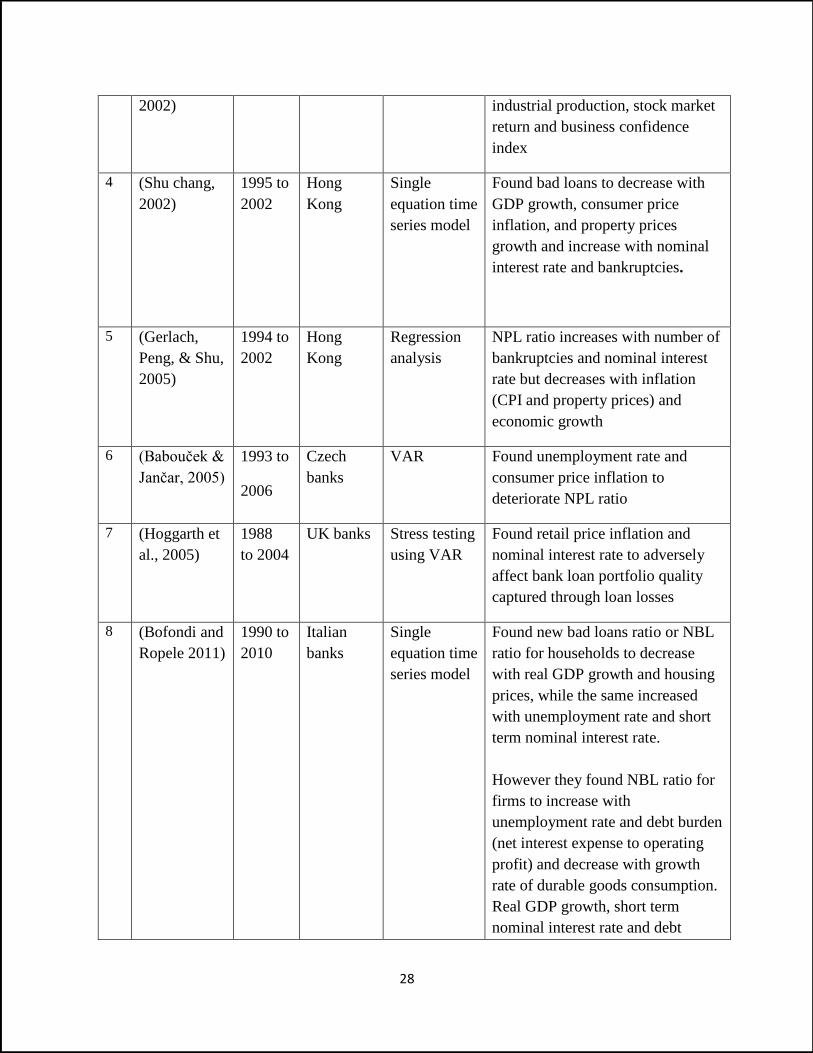
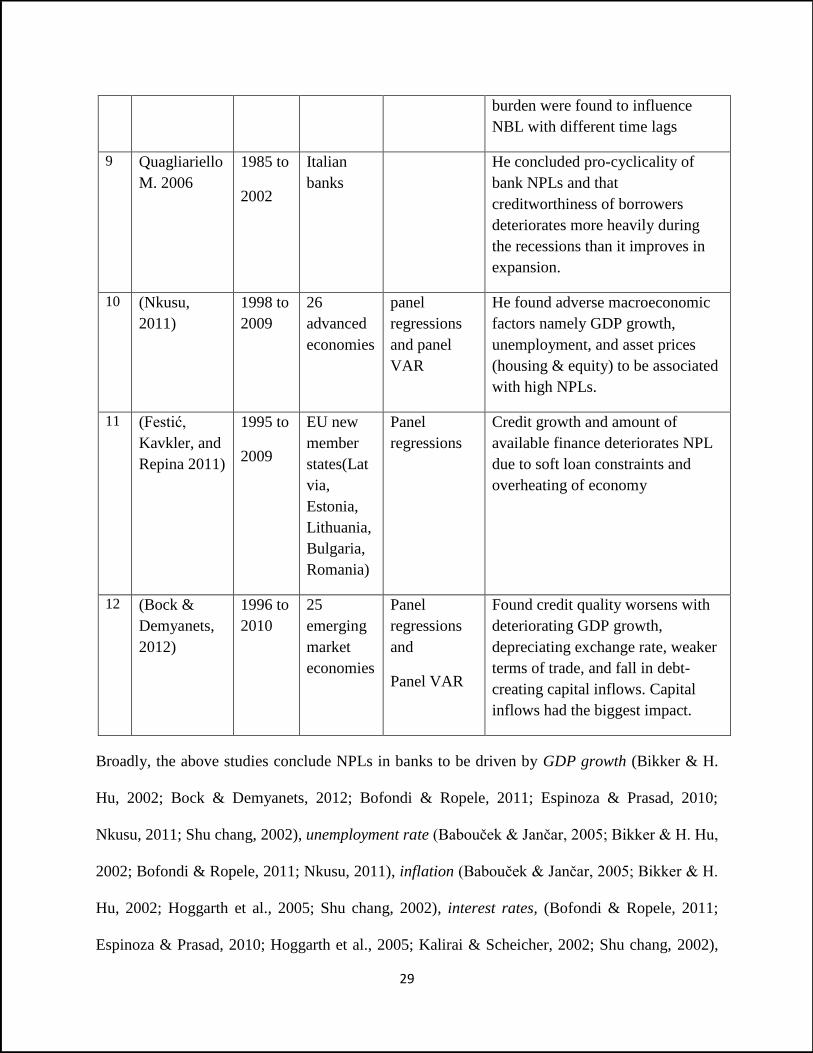
A brief summary of the empirical research can be found in the following table:
Authors Period Country Methodology Results
1 (Gambera,
2000)
1987 to
1999
US Multivariate
models and
bivariate
VAR
Found bankruptcy filing, farm
income, annual product, housing
permits and unemployment to be
good predictors of problem loans
2 (Arpa et al.,
2001)
1990
to 1999
Austria Single
equation time
series model
Found risk provisions to increase
with decline in real GDP growth,
and increase with real estate prices,
consumer prices and operating
income
3 (Kalirai &
Scheicher,
1990 to
2001
Austrian Linear
regressions
Found loan quality to be influenced
by short term nominal interest rates,
28
2002) industrial production, stock market
return and business confidence
index
4 (Shu chang,
2002)
1995 to
2002
Hong
Kong
Single
equation time
series model
Found bad loans to decrease with
GDP growth, consumer price
inflation, and property prices
growth and increase with nominal
interest rate and bankruptcies.
5 (Gerlach,
Peng, & Shu,
2005)
1994 to
2002
Hong
Kong
Regression
analysis
NPL ratio increases with number of
bankruptcies and nominal interest
rate but decreases with inflation
(CPI and property prices) and
economic growth
6 (Babouček &
Jančar, 2005)
1993 to
2006
Czech
banks
VAR Found unemployment rate and
consumer price inflation to
deteriorate NPL ratio
7 (Hoggarth et
al., 2005)
1988
to 2004
UK banks Stress testing
using VAR
Found retail price inflation and
nominal interest rate to adversely
affect bank loan portfolio quality
captured through loan losses
8 (Bofondi and
Ropele 2011)
1990 to
2010
Italian
banks
Single
equation time
series model
Found new bad loans ratio or NBL
ratio for households to decrease
with real GDP growth and housing
prices, while the same increased
with unemployment rate and short
term nominal interest rate.
However they found NBL ratio for
firms to increase with
unemployment rate and debt burden
(net interest expense to operating
profit) and decrease with growth
rate of durable goods consumption.
Real GDP growth, short term
nominal interest rate and debt
29
burden were found to influence
NBL with different time lags
9 Quagliariello
M. 2006
1985 to
2002
Italian
banks
He concluded pro-cyclicality of
bank NPLs and that
creditworthiness of borrowers
deteriorates more heavily during
the recessions than it improves in
expansion.
10 (Nkusu,
2011)
1998 to
2009
26
advanced
economies
panel
regressions
and panel
VAR
He found adverse macroeconomic
factors namely GDP growth,
unemployment, and asset prices
(housing & equity) to be associated
with high NPLs.
11 (Festić,
Kavkler, and
Repina 2011)
1995 to
2009
EU new
member
states(Lat
via,
Estonia,
Lithuania,
Bulgaria,
Romania)
Panel
regressions
Credit growth and amount of
available finance deteriorates NPL
due to soft loan constraints and
overheating of economy
12 (Bock &
Demyanets,
2012)
1996 to
2010
25
emerging
market
economies
Panel
regressions
and
Panel VAR
Found credit quality worsens with
deteriorating GDP growth,
depreciating exchange rate, weaker
terms of trade, and fall in debt-
creating capital inflows. Capital
inflows had the biggest impact.
Broadly, the above studies conclude NPLs in banks to be driven by GDP growth (Bikker & H.
Hu, 2002; Bock & Demyanets, 2012; Bofondi & Ropele, 2011; Espinoza & Prasad, 2010;
Nkusu, 2011; Shu chang, 2002), unemployment rate (Babouček & Jančar, 2005; Bikker & H. Hu,
2002; Bofondi & Ropele, 2011; Nkusu, 2011), inflation (Babouček & Jančar, 2005; Bikker & H.
Hu, 2002; Hoggarth et al., 2005; Shu chang, 2002), interest rates, (Bofondi & Ropele, 2011;
Espinoza & Prasad, 2010; Hoggarth et al., 2005; Kalirai & Scheicher, 2002; Shu chang, 2002),
30
asset prices and returns (housing and/or equity) (Bofondi & Ropele, 2011; Kalirai & Scheicher,
2002; Nkusu, 2011; Shu chang, 2002) and exchange rates (Bock & Demyanets, 2012).
One of the recent studies by Bock and Demyanets (2012) conducted in the context of emerging
market economies also found credit quality to worsen with weaker terms of trade and fall in
debt-creating capital inflows. Bank and foreign portfolio inflows were found to have the biggest
impact implying that an abrupt reversal of the capital inflows would cause a sharp increase in
NPL.
Combined effect of Micro and Macro economic factors
There were other studies which combined the two sets of factors to get a comprehensive
understanding of NPLs (Louzis, Vouldis, & Metaxas, 2012; Salas & Saurina, 2002). Most of
these studies controlled for macro-economic factors as exogenous variables or started with
macro-economic variables based model and then added bank level variables.
Salas and Saurina (2002) found that bank level variables could explain the variation in problem
loans for banks in Spain during 1985-1997 even after controlling for macroeconomic factors like
GDP growth, indebtedness of family & firm. They examined the determinants of NPLs for
Commercial banks and Savings banks separately because the two types of banks were different
in terms of their ownership concentration, customers-type and extent of geographical
diversification. For Savings banks they found the NPL to be determined by growth (in branch
and credit), inefficiency, loan composition (non-collateralized loan), management incentives
(Net interest margin), and market share. While for Commercial banks, they found NPLs to be
explained by fewer and other factors like branch expansion, size, and capital ratio. They
concluded that micro-factors had more explanatory power for savings banks, commercial banks
31
were more sensitive to business cycles, and that ownership factors had an influence on size of the
coefficients.
Pain (2003) examined loan loss provisions for major UK banks during 1978-2000 and found
macro-economic factors like real GDP growth, real interest rates, and lagged aggregate lending
growth as well as bank specific factors like lending to riskier sectors to be the determinants.
Fofack (2005) used Granger causality and pseudo panel-based prediction models in banks of
sub-Saharan Africa during 1990s. They also found macro-economic variables like real interest
rate, real GDP per capita growth, and banking variables like net interest margin, return on assets
and interbank loans (loans at prohibitively high interest rates accessed by banks to meet their
short term liquidity needs) to be the leading causes of NPLs.
Quagliariello M. (2006) examined around 200 Italian banks during 1985-2002 using static and
dynamic models and confirmed that it is interaction between banks specific characteristics like
efficiency (cost to income ratio), riskiness (ratio of interest income to total assets) and, lagged
credit growth as well as macro-economic factors like GDP growth and interest rates which drives
NPLs and provisioning of banks.
Espinoza and Prasad (2010) examined 80 banks in GCC banking system over 1995 to 2008 using
dynamic panel estimators. They found NPL to decrease with non-oil GDP growth and increase
with interest rates and risk aversion (arising from tight global financial conditions). They also
found firm specific factors like efficiency, credit growth and capital size to affect NPL. Using a
panel VAR model, they concluded the feedback effect of NPLs on growth to be strong though
short-lived.
32
Louzis, Vouldis, and Metaxas (2012) started with a baseline model which included only macro-
economic factors to examine the determinants of NPLs in Greek banking sector during 2003 to
2009. They used dynamic panel estimators and examined the three different loan categories
(consumer, mortgages and business loans) separately. The macro-economic variables namely
GDP growth rate, unemployment rate, lending rate and sovereign debt (each included with two
lags) were found to have strong effect on NPL levels. They also found bank specific variables
like cost inefficiency and performance to be leading indicators of NPL, thereby supporting ‘bad
management’ hypothesis consistent with Berger and Deyoung 1997. However they failed to find
support for either ‘moral hazard hypothesis’ captured through solvency ratio (like Williams
2004) or ‘diversification hypothesis’ captured through size and alternatively through non-interest
income ratio. In contrast to the hypothesis of ‘tight control’, they found NPLs to increase with
ownership concentration.
Klein (2013) investigated into bank specific factors as well macro-economic factors for
explanation of variation in NPLs in 16 Central, Eastern and South Eastern Europe (CESEE)
during 1998-2011. As far as macro-economic factors are concerned he found higher
unemployment, exchange rate depreciation, higher inflation to contribute to higher NPLs while
higher GDP to lead to lower NPLs. Regarding the bank-specific factors, he found management
quality captured through ROA to lower NPLs whereas moral hazard incentive captured in low
Equity to Assets ratio and excessive risk taking measured through Loan to Assets and loan
growth to worsen NPLs.
There were other studies which found support for the postulations that a variety of institutions
affect NPLs in banks. Breuer J.B. (2006) argued that NPLs might be affected by the conflicts of
interest bank managers experience due to the principal-agent relationship banks have with their
33
borrowers as well as with their depositors. After having controlled for economic factors like
GDP growth and level of economic development for banks in 52 countries in the year 2000, they
found legal institutions (like legal origin), sociological institutions (like corruption, degree of
ethnic heterogeneity), and banking institutions (like restrictions on participation in securities and
real estate activities, deposit insurance, off-balance sheet disclosure, sanctions, ownership) to be
able to explain problem loans.
The above survey of the papers in the literature show that there is inadequate research in
examining NPLs when both macro-economic and bank specific varibales are put together,
particulalry after the global financial crisis of 2008-09 and for banks in emerging market
economies like India. This paper intneds to fill in this research gap.
II. Research Design, Data and Methodology
Sample and Data: The study intends to cover 4 years before the year the global financial crisis
had hit India, the crisis-hit year of 2008-09, as well as 4 years after the crisis year. So, the study
would encompass a period of nine years from 2004-05 to 2012-13. The international best
practice to classify NPA based on 90 days became effective in India in 2003-04. RBI mandate of
having secured lending to the tune of 85% was revoked in 2004. We expect the effect of these
new norms to have got stabilized by 2004-05. One of the other reasons for starting with 2004-05
is the beginning by banks in India of significant use of innovative financial instruments like
derivatives and securitization. The complexity of these instruments has often been blamed as one
of the factors leading to the global financial crisis. The data for the study is collected from
publicly available sources like RBI websites, Annual Reports of banks and Bankscope database
(subscribed by IIMC).
34
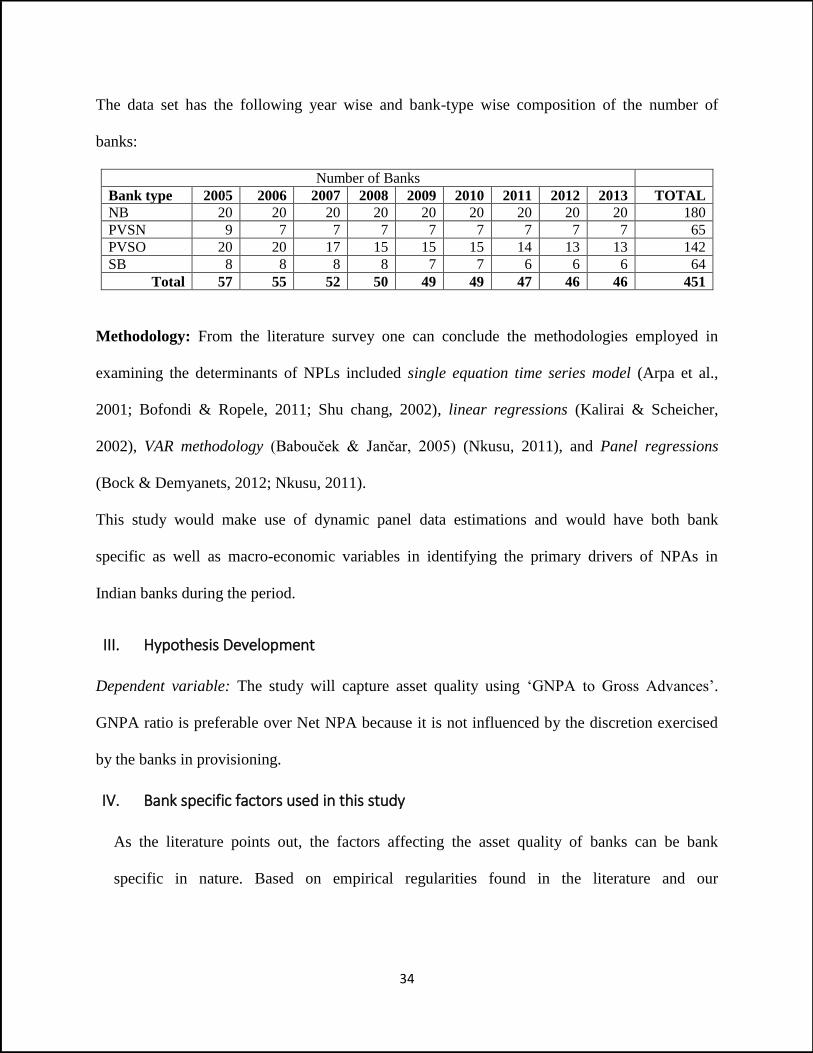
The data set has the following year wise and bank-type wise composition of the number of
banks:
Number of Banks
Bank type 2005 2006 2007 2008 2009 2010 2011 2012 2013 TOTAL
NB 20 20 20 20 20 20 20 20 20 180
PVSN 9 7 7 7 7 7 7 7 7 65
PVSO 20 20 17 15 15 15 14 13 13 142
SB 8 8 8 8 7 7 6 6 6 64
Total 57 55 52 50 49 49 47 46 46 451
Methodology: From the literature survey one can conclude the methodologies employed in
examining the determinants of NPLs included single equation time series model (Arpa et al.,
2001; Bofondi & Ropele, 2011; Shu chang, 2002), linear regressions (Kalirai & Scheicher,
2002), VAR methodology (Babouček & Jančar, 2005) (Nkusu, 2011), and Panel regressions
(Bock & Demyanets, 2012; Nkusu, 2011).
This study would make use of dynamic panel data estimations and would have both bank
specific as well as macro-economic variables in identifying the primary drivers of NPAs in
Indian banks during the period.
III. Hypothesis Development
Dependent variable: The study will capture asset quality using ‘GNPA to Gross Advances’.
GNPA ratio is preferable over Net NPA because it is not influenced by the discretion exercised
by the banks in provisioning.
IV. Bank specific factors used in this study
As the literature points out, the factors affecting the asset quality of banks can be bank
specific in nature. Based on empirical regularities found in the literature and our
35
understanding of the Indian banks, we have considered the following bank-level factors in
understanding their NPA behavior.
1. Operational Efficiency:
The quality of management is considered to be critical for the long-run success of any
company in general. It is more important for banks in particular due to the dynamicity in the
banking industry caused by factors like regulatory changes, technology advancements, and
macro-economic cause-and- effect linkages. If the management quality is poor, it is likely to
get reflected in bank’s credit appraisal decisions as well as monitoring of its collaterals and
borrowers. Efficiency is often used in the literature as a proxy for management quality. So a
poor management quality, captured through lower levels of operational efficiency, can be an
indication of poor credit management in a bank (Bad Management hypothesis) and hence
cause higher NPLs (Berger & Deyoung, 1997).
However (Berger & Deyoung, 1997) also argued that higher level of operational efficiency
might be associated with lesser resources spent in credit appraisals and therefore can result in
higher NPLs in future (Skimping Hypothesis). So, a higher operating costs might be an
indication that the bank has high quality but expensive credit evaluation mechanism (Pain,
2003)
Berger and Deyoung (1997) also proposed ‘bad luck’ hypothesis, according to which
problem loans (caused by uncontrollable factors) can lead to higher future operating costs
associated with NPL management.
In this study, we would measure ‘Cost Efficiency’ through ‘cost to income ratio’ calculated
as percentage of operating expenses to total income. Lower the ratio, higher is the level of
cost efficiency suggesting better quality management.
36
Thus according to ‘bad management hypothesis’, higher the operational costs (i.e. lower the
efficiency) higher would be the NPLs. But according to skimping hypothesis, lower
operational costs (i.e. higher the efficiency) would cause higher NPLs in future (Berger &
Deyoung, 1997b). ‘Bad luck’ hypothesis would however suggest higher NPLs to temporally
precede higher operational costs (or lower efficiency). We will examine whether any of these
hypotheses holds for Indian Banks.
There is evidence in the literature supporting bad management hypothesis (Williams, 2004)
as well as bad luck hypothesis in the context of European banks (Rossi et al., 2005) while
bad management hypothesis is found to be supported for Czech banks (Podpiera & Weill,
2008). Several other studies found cost efficiency to be an important determinant of NPLs in
banks (Espinoza & Prasad, 2010; Louzis et al., 2012; Quagliariello M., 2006; Salas &
Saurina, 2002)
Over and above ‘cost efficiency’ we would also test bad management hypothesis using
‘Revenue Efficiency’ captured through alternative measures like ‘Return on advances’. A
better management reflected in higher revenue efficiency can be expected to have a negative
impact on NPLs.
2. Earnings Management: Bank managers motivated by their short term reputation concerns
might have an incentive to signal strong performance through higher ROA or ROE3 (Louzis et
al., 2012). But this higher ROA or ROE might have been obtained through lower loan loss
provisioning. A higher ROA or ROE can also be achieved if the bank resorts to liberalizing its
credit policy and goes for risky or negative NPV lending. In such cases a current higher ROA
can be expected to come back in future as high levels of NPLs.
3 ROA, ROE and NIM are key performance indicators of PSBs which are assigned 20 points out of 100 (http://pib.nic.in/newsite/mbErel.aspx?relid=126074)

37
Klein (2013) however used ROA or ROE as proxies for management quality. One can capture
the earnings management tendency through ‘Net interest Margin/Total Assets’. In the
literature, interest income has been associated with riskiness of loan portfolio through two
different arguments. Salas and Saurina (2002) argued that if interest income falls, it might
provide incentive to managers to shift to riskier credit policy, which might lead to higher
NPLs in future. So they expected a negative coefficient on lags of net interest margin.
Quagliariello M. 2006 on the other hand contended that higher interest rates would typically
be charged by banks for customers with low creditworthiness, and hence associated with high
NPLs. So they expected a positive coefficient on interest income. It seems difficult to use this
variable to capture the earnings management tendency clearly. So, we would use ROA as a
proxy for earnings management. A higher lagged ROA can be expected to be associated with
higher future NPAs. If high ROA is an indication of good performance, managers need not go
for risky loans to bring a boost to the performance. If this argument holds, we can expect a
negative relation between ROA and NPAs.
3. Risk taking behavior (Capital Adequacy Ratio): A bank with relatively lower levels of
capital has moral hazard incentives to undertake higher risks. So, well-capitalized banks
might be risk-averse. A number of papers have argued and found evidence of banks with
poor ‘Equity to Assets ratio’ to have gone for higher risks in their loan portfolios reflected in
higher NPLs (Berger & Deyoung, 1997a; Keeton & Morris, 1987; Klein, 2013; Salas &
Saurina, 2002). Higher risk taking tendency associated with moral hazard can alternatively be
captured through leverage measured as ‘total assets/ equity’. In line with the literature we
expect banks with lower capital adequacy ratio or alternatively higher leverage to lead to
higher NPLs.
38
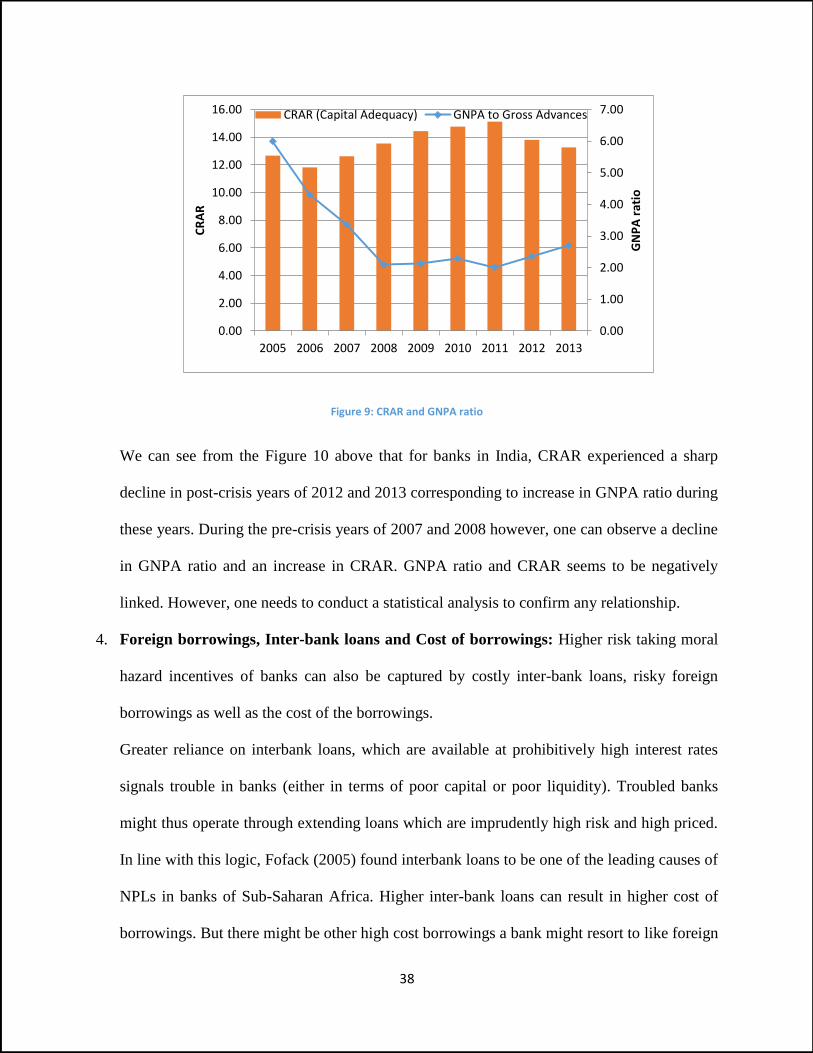
Figure 9: CRAR and GNPA ratio
We can see from the Figure 10 above that for banks in India, CRAR experienced a sharp
decline in post-crisis years of 2012 and 2013 corresponding to increase in GNPA ratio during
these years. During the pre-crisis years of 2007 and 2008 however, one can observe a decline
in GNPA ratio and an increase in CRAR. GNPA ratio and CRAR seems to be negatively
linked. However, one needs to conduct a statistical analysis to confirm any relationship.
4. Foreign borrowings, Inter-bank loans and Cost of borrowings: Higher risk taking moral
hazard incentives of banks can also be captured by costly inter-bank loans, risky foreign
borrowings as well as the cost of the borrowings.
Greater reliance on interbank loans, which are available at prohibitively high interest rates
signals trouble in banks (either in terms of poor capital or poor liquidity). Troubled banks
might thus operate through extending loans which are imprudently high risk and high priced.
In line with this logic, Fofack (2005) found interbank loans to be one of the leading causes of
NPLs in banks of Sub-Saharan Africa. Higher inter-bank loans can result in higher cost of
borrowings. But there might be other high cost borrowings a bank might resort to like foreign
0.00
1.00
2.00
3.00
4.00
5.00
6.00
7.00
0.00
2.00
4.00
6.00
8.00
10.00
12.00
14.00
16.00
2005 2006 2007 2008 2009 2010 2011 2012 2013
GN
PA
rat
io
CR
AR
CRAR (Capital Adequacy) GNPA to Gross Advances
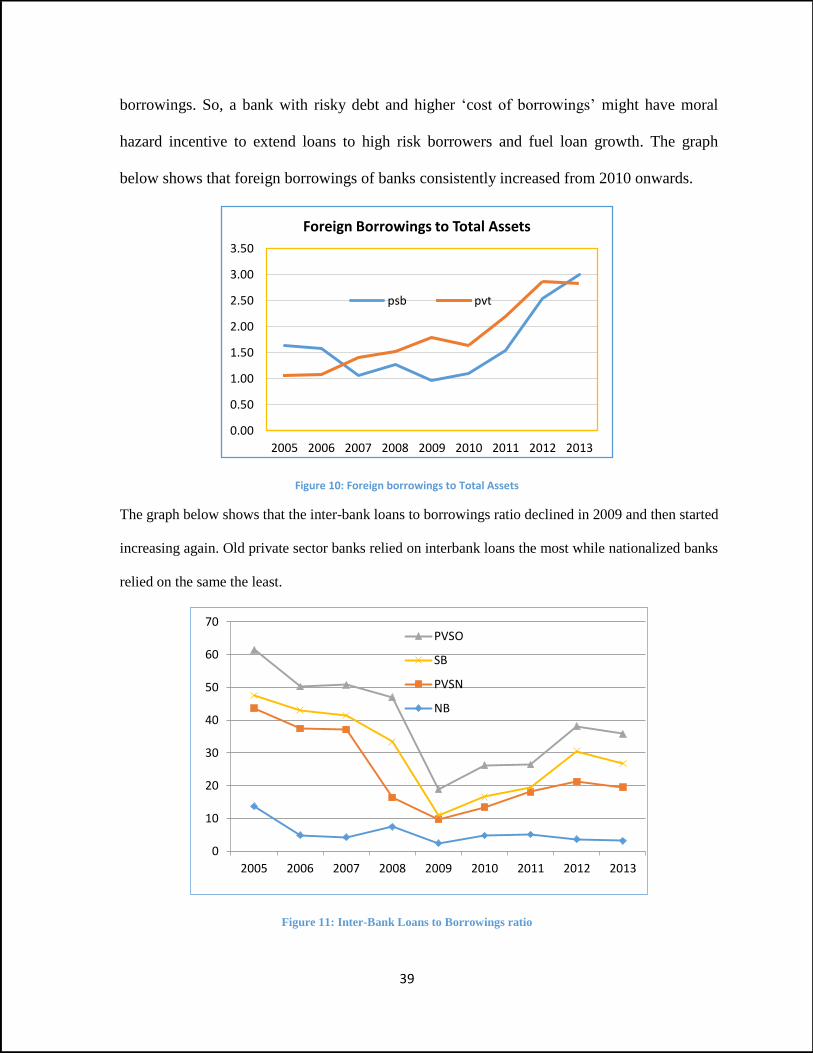
39
0.00
0.50
1.00
1.50
2.00
2.50
3.00
3.50
2005 2006 2007 2008 2009 2010 2011 2012 2013
Foreign Borrowings to Total Assets
psb pvt
0
10
20
30
40
50
60
70
2005 2006 2007 2008 2009 2010 2011 2012 2013
PVSO
SB
PVSN
NB
borrowings. So, a bank with risky debt and higher ‘cost of borrowings’ might have moral
hazard incentive to extend loans to high risk borrowers and fuel loan growth. The graph
below shows that foreign borrowings of banks consistently increased from 2010 onwards.
Figure 10: Foreign borrowings to Total Assets
The graph below shows that the inter-bank loans to borrowings ratio declined in 2009 and then started
increasing again. Old private sector banks relied on interbank loans the most while nationalized banks
relied on the same the least.
Figure 11: Inter-Bank Loans to Borrowings ratio
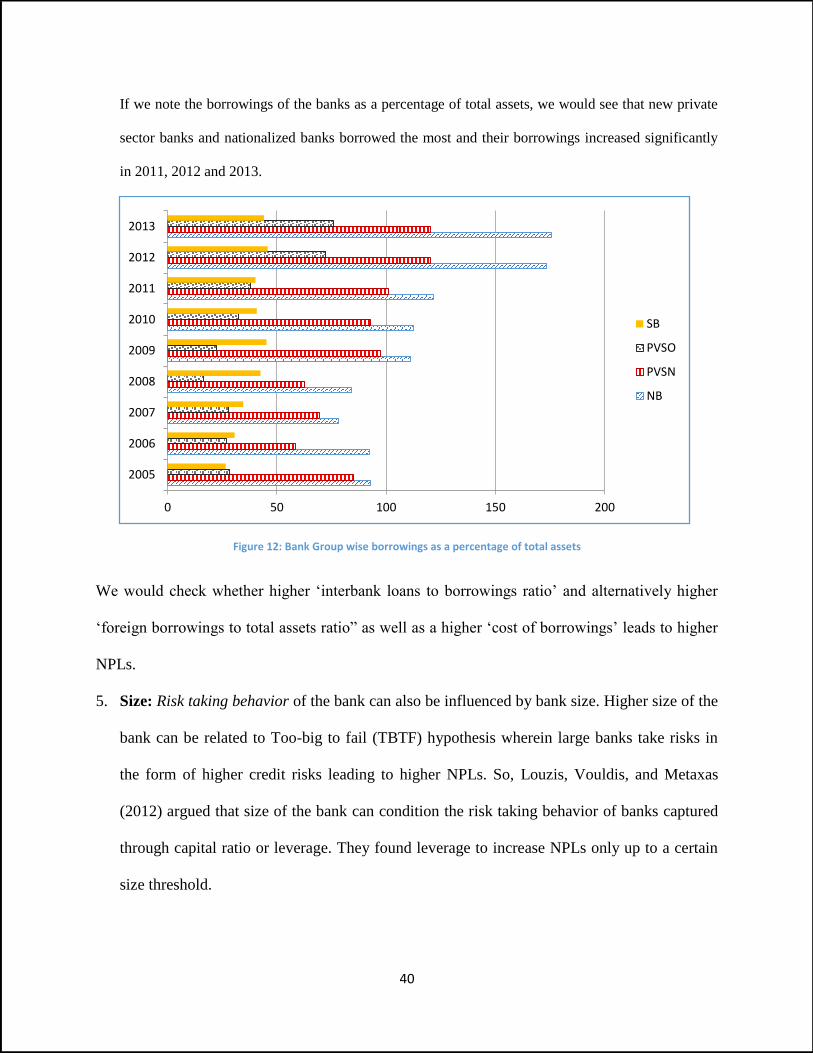
40
If we note the borrowings of the banks as a percentage of total assets, we would see that new private
sector banks and nationalized banks borrowed the most and their borrowings increased significantly
in 2011, 2012 and 2013.
Figure 12: Bank Group wise borrowings as a percentage of total assets
We would check whether higher ‘interbank loans to borrowings ratio’ and alternatively higher
‘foreign borrowings to total assets ratio” as well as a higher ‘cost of borrowings’ leads to higher
NPLs.
5. Size: Risk taking behavior of the bank can also be influenced by bank size. Higher size of the
bank can be related to Too-big to fail (TBTF) hypothesis wherein large banks take risks in
the form of higher credit risks leading to higher NPLs. So, Louzis, Vouldis, and Metaxas
(2012) argued that size of the bank can condition the risk taking behavior of banks captured
through capital ratio or leverage. They found leverage to increase NPLs only up to a certain
size threshold.
0 50 100 150 200
2005
2006
2007
2008
2009
2010
2011
2012
2013
SB
PVSO
PVSN
NB
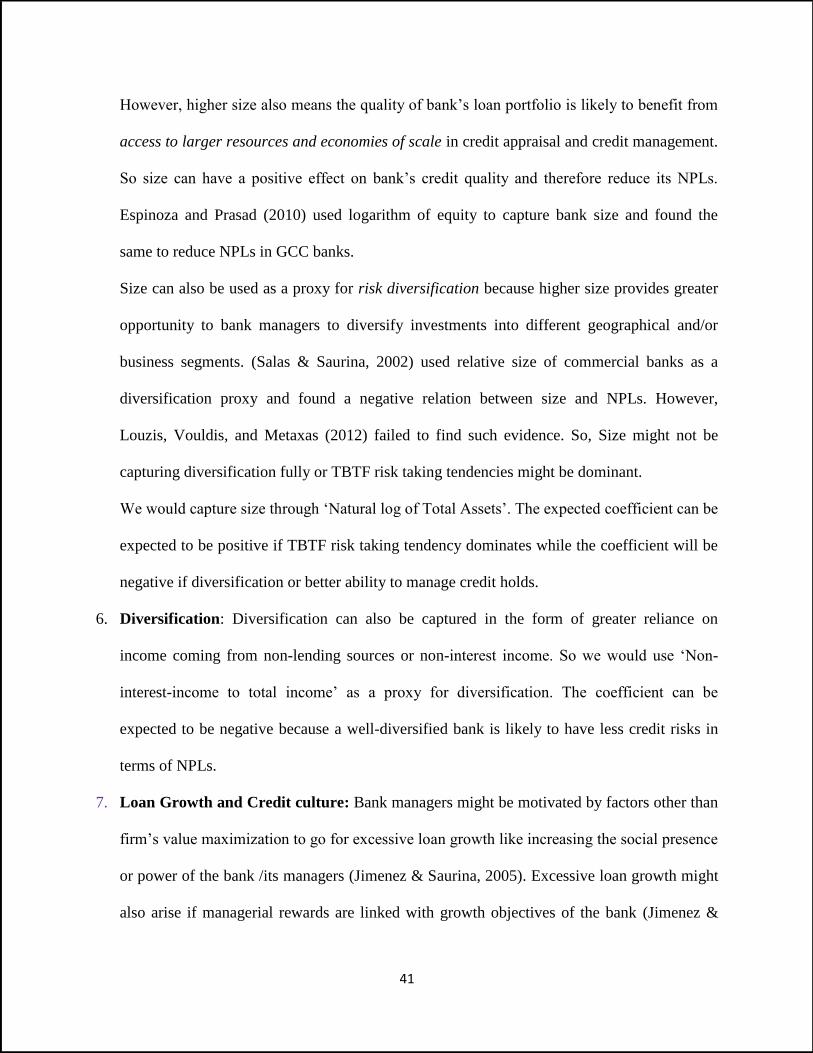
41
However, higher size also means the quality of bank’s loan portfolio is likely to benefit from
access to larger resources and economies of scale in credit appraisal and credit management.
So size can have a positive effect on bank’s credit quality and therefore reduce its NPLs.
Espinoza and Prasad (2010) used logarithm of equity to capture bank size and found the
same to reduce NPLs in GCC banks.
Size can also be used as a proxy for risk diversification because higher size provides greater
opportunity to bank managers to diversify investments into different geographical and/or
business segments. (Salas & Saurina, 2002) used relative size of commercial banks as a
diversification proxy and found a negative relation between size and NPLs. However,
Louzis, Vouldis, and Metaxas (2012) failed to find such evidence. So, Size might not be
capturing diversification fully or TBTF risk taking tendencies might be dominant.
We would capture size through ‘Natural log of Total Assets’. The expected coefficient can be
expected to be positive if TBTF risk taking tendency dominates while the coefficient will be
negative if diversification or better ability to manage credit holds.
6. Diversification: Diversification can also be captured in the form of greater reliance on
income coming from non-lending sources or non-interest income. So we would use ‘Non-
interest-income to total income’ as a proxy for diversification. The coefficient can be
expected to be negative because a well-diversified bank is likely to have less credit risks in
terms of NPLs.
7. Loan Growth and Credit culture: Bank managers might be motivated by factors other than
firm’s value maximization to go for excessive loan growth like increasing the social presence
or power of the bank /its managers (Jimenez & Saurina, 2005). Excessive loan growth might
also arise if managerial rewards are linked with growth objectives of the bank (Jimenez &
42
Saurina, 2005). In such situations managers might extend loans without proper credit
appraisals or with leniency in credit appraisals. This opens up the window for bad quality
loans getting in bank’s loan portfolio. Klein (2013) indeed found excessive lending leads to
higher NPLs though they had moral hazard argument of higher risks taken by banks. Salas
and Saurina (2002) argue that if a bank in order to capture greater market share expands its
credit into new geographical area or sector, it will face high adverse selection problem and
will be visited by worst quality borrowers first. In line with this argument, Espinoza and
Prasad (2010) found lagged credit growth to be among the firm specific determinants of
NPLs in GCC banking system. Quagliariello M. (2006) however reasoned that rapid credit
growth might not automatically imply future problems because the growth might be demand
led reflecting a positive phase of the business cycle (boom). So, one can expect excessive
growth in advances to lead to higher NPLs. But whether loans are excessive can be judged
based on the deposits base a bank has. A higher Credit-Deposit ratio suggests banks
extending higher loans Vis-a Vis its deposit base. So we would use ‘Credit Deposit ratio’ of
banks to capture the riskiness in its credit culture. A higher credit deposit ratio can be
expected to lead to higher NPAs.
8. Loan Composition: NPLs can also be influenced by the composition of loan portfolio.
a. Secured Loan: Granting secured loans or loans backed by borrowers’ assets/collaterals has
been suggested in the literature as a solution to adverse selection and moral hazard problems
arising out of information asymmetry between borrowers and the lending banks (Boot and
Thakor 1994). Banks are found to use collaterals for granting loans to borrowers with poor
credit quality (Berger and Udell 1990, 1995; Jimenez et al. 2006), probably to take care of the
higher credit risks associated with these loans. So going by this argument, one can say higher
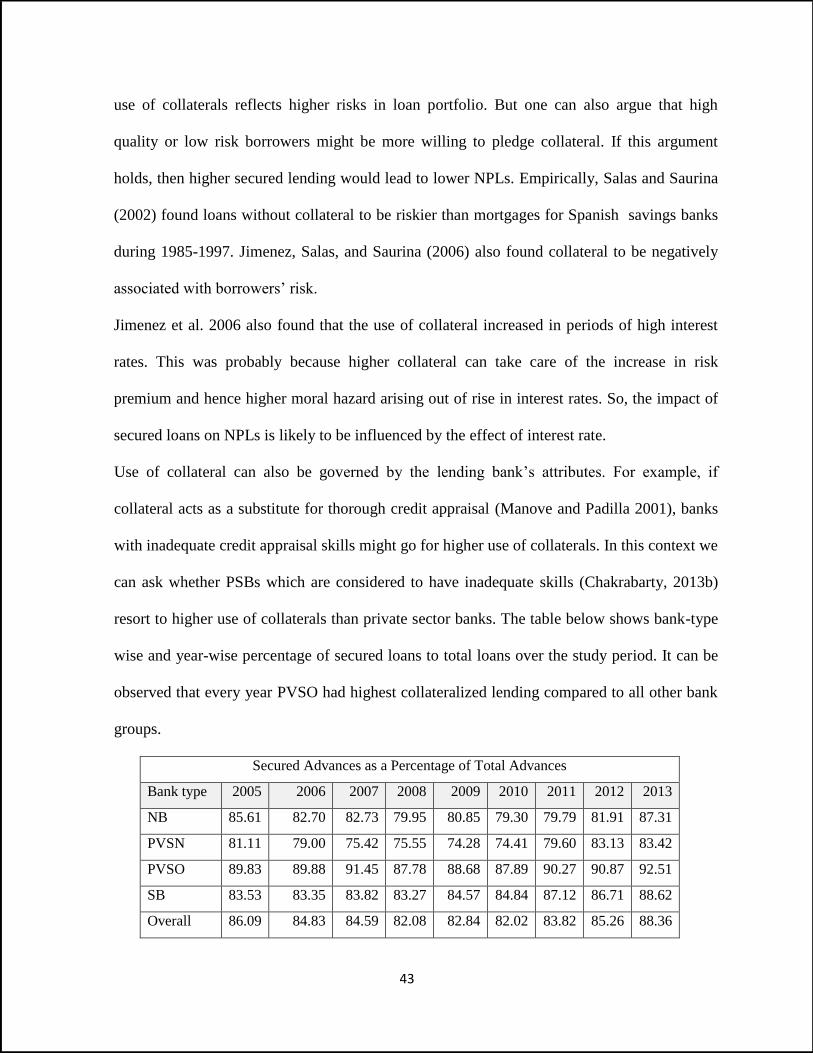
43
use of collaterals reflects higher risks in loan portfolio. But one can also argue that high
quality or low risk borrowers might be more willing to pledge collateral. If this argument
holds, then higher secured lending would lead to lower NPLs. Empirically, Salas and Saurina
(2002) found loans without collateral to be riskier than mortgages for Spanish savings banks
during 1985-1997. Jimenez, Salas, and Saurina (2006) also found collateral to be negatively
associated with borrowers’ risk.
Jimenez et al. 2006 also found that the use of collateral increased in periods of high interest
rates. This was probably because higher collateral can take care of the increase in risk
premium and hence higher moral hazard arising out of rise in interest rates. So, the impact of
secured loans on NPLs is likely to be influenced by the effect of interest rate.
Use of collateral can also be governed by the lending bank’s attributes. For example, if
collateral acts as a substitute for thorough credit appraisal (Manove and Padilla 2001), banks
with inadequate credit appraisal skills might go for higher use of collaterals. In this context we
can ask whether PSBs which are considered to have inadequate skills (Chakrabarty, 2013b)
resort to higher use of collaterals than private sector banks. The table below shows bank-type
wise and year-wise percentage of secured loans to total loans over the study period. It can be
observed that every year PVSO had highest collateralized lending compared to all other bank
groups.
Secured Advances as a Percentage of Total Advances
Bank type 2005 2006 2007 2008 2009 2010 2011 2012 2013
NB 85.61 82.70 82.73 79.95 80.85 79.30 79.79 81.91 87.31
PVSN 81.11 79.00 75.42 75.55 74.28 74.41 79.60 83.13 83.42
PVSO 89.83 89.88 91.45 87.78 88.68 87.89 90.27 90.87 92.51
SB 83.53 83.35 83.82 83.27 84.57 84.84 87.12 86.71 88.62
Overall 86.09 84.83 84.59 82.08 82.84 82.02 83.82 85.26 88.36
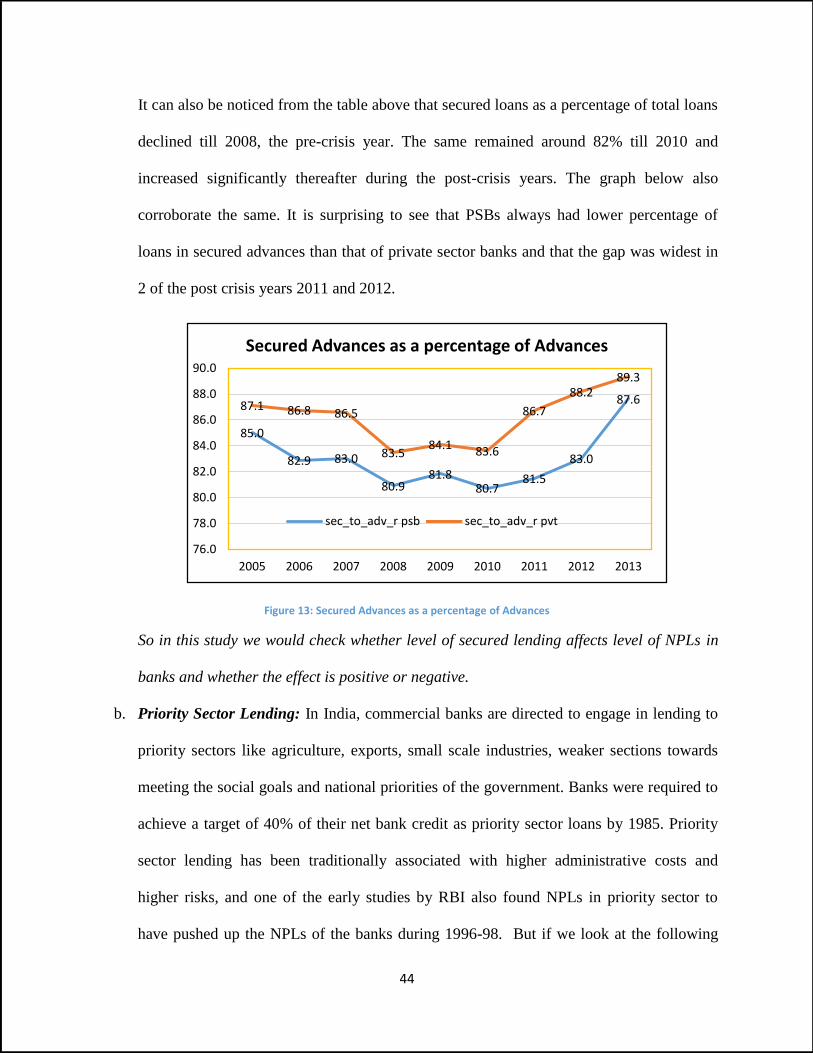
44
It can also be noticed from the table above that secured loans as a percentage of total loans
declined till 2008, the pre-crisis year. The same remained around 82% till 2010 and
increased significantly thereafter during the post-crisis years. The graph below also
corroborate the same. It is surprising to see that PSBs always had lower percentage of
loans in secured advances than that of private sector banks and that the gap was widest in
2 of the post crisis years 2011 and 2012.
Figure 13: Secured Advances as a percentage of Advances
So in this study we would check whether level of secured lending affects level of NPLs in
banks and whether the effect is positive or negative.
b. Priority Sector Lending: In India, commercial banks are directed to engage in lending to
priority sectors like agriculture, exports, small scale industries, weaker sections towards
meeting the social goals and national priorities of the government. Banks were required to
achieve a target of 40% of their net bank credit as priority sector loans by 1985. Priority
sector lending has been traditionally associated with higher administrative costs and
higher risks, and one of the early studies by RBI also found NPLs in priority sector to
have pushed up the NPLs of the banks during 1996-98. But if we look at the following
85.0
82.9 83.0
80.981.8
80.781.5
83.0
87.687.1 86.8 86.5
83.584.1 83.6
86.7
88.289.3
76.0
78.0
80.0
82.0
84.0
86.0
88.0
90.0
2005 2006 2007 2008 2009 2010 2011 2012 2013
Secured Advances as a percentage of Advances
sec_to_adv_r psb sec_to_adv_r pvt
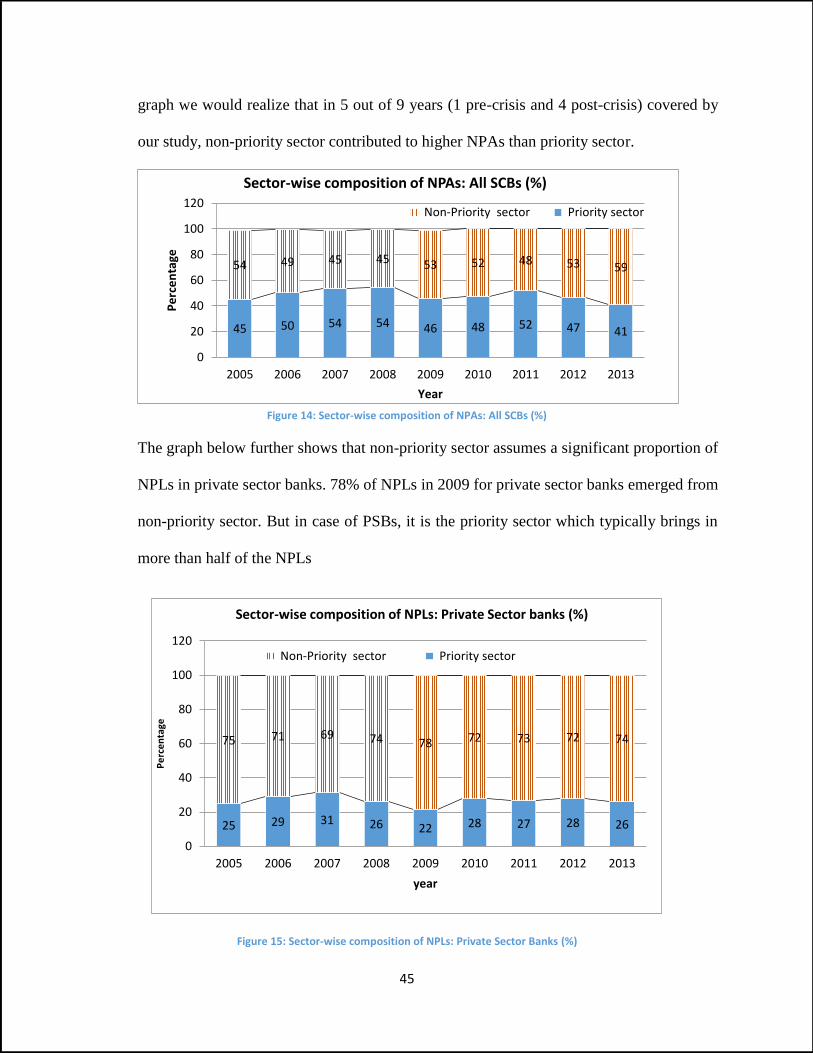
45
45 50 54 54 46 48 52 47 41
54 49 45 45 53 52 48 53 59
0
20
40
60
80
100
120
2005 2006 2007 2008 2009 2010 2011 2012 2013
Pe
rce
nta
ge
Year
Sector-wise composition of NPAs: All SCBs (%)
Non-Priority sector Priority sector
graph we would realize that in 5 out of 9 years (1 pre-crisis and 4 post-crisis) covered by
our study, non-priority sector contributed to higher NPAs than priority sector.
Figure 14: Sector-wise composition of NPAs: All SCBs (%)
The graph below further shows that non-priority sector assumes a significant proportion of
NPLs in private sector banks. 78% of NPLs in 2009 for private sector banks emerged from
non-priority sector. But in case of PSBs, it is the priority sector which typically brings in
more than half of the NPLs
Figure 15: Sector-wise composition of NPLs: Private Sector Banks (%)
25 29 31 26 22 28 27 28 26
75 71 69 74 78 72 73 72 74
0
20
40
60
80
100
120
2005 2006 2007 2008 2009 2010 2011 2012 2013
Pe
rce
nta
ge
year
Sector-wise composition of NPLs: Private Sector banks (%)
Non-Priority sector Priority sector
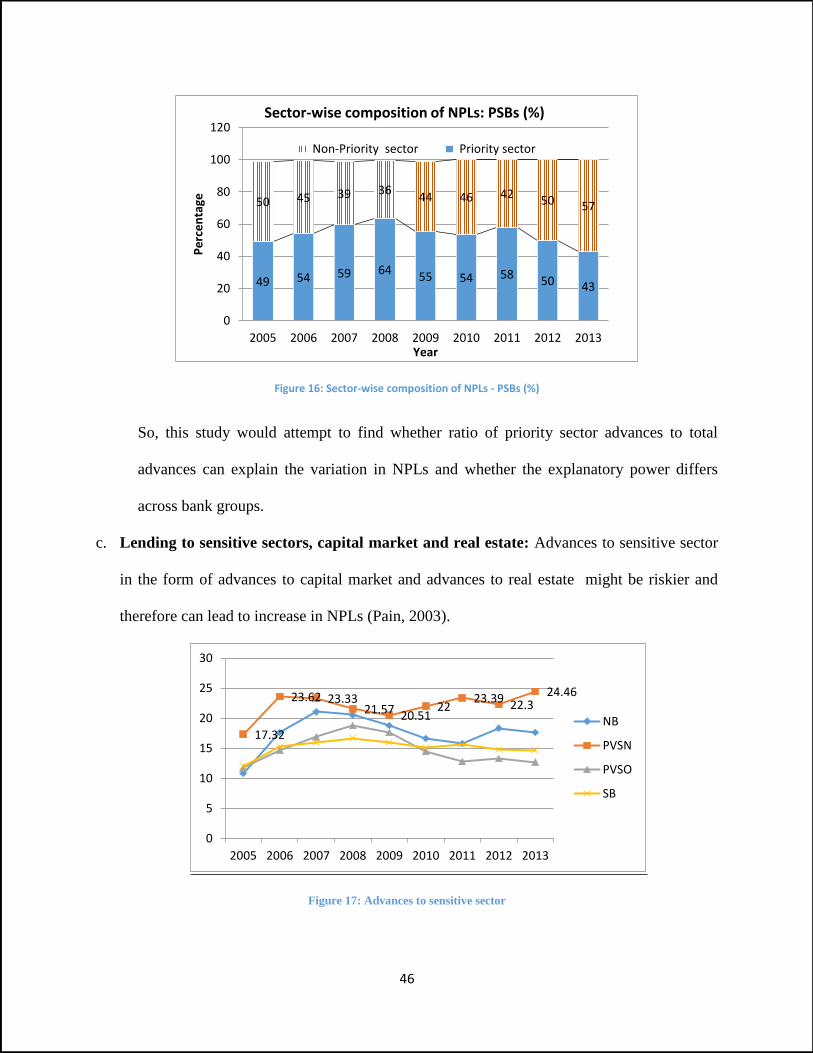
46
Figure 16: Sector-wise composition of NPLs - PSBs (%)
So, this study would attempt to find whether ratio of priority sector advances to total
advances can explain the variation in NPLs and whether the explanatory power differs
across bank groups.
c. Lending to sensitive sectors, capital market and real estate: Advances to sensitive sector
in the form of advances to capital market and advances to real estate might be riskier and
therefore can lead to increase in NPLs (Pain, 2003).
Figure 17: Advances to sensitive sector
49 54 59 6455 54 58 50 43
50 45 39 3644 46 42 50 57
0
20
40
60
80
100
120
2005 2006 2007 2008 2009 2010 2011 2012 2013
Pe
rce
nta
ge
Year
Sector-wise composition of NPLs: PSBs (%)
Non-Priority sector Priority sector
17.32
23.62 23.3321.57 20.51
2223.39 22.3
24.46
0
5
10
15
20
25
30
2005 2006 2007 2008 2009 2010 2011 2012 2013
NB
PVSN
PVSO
SB
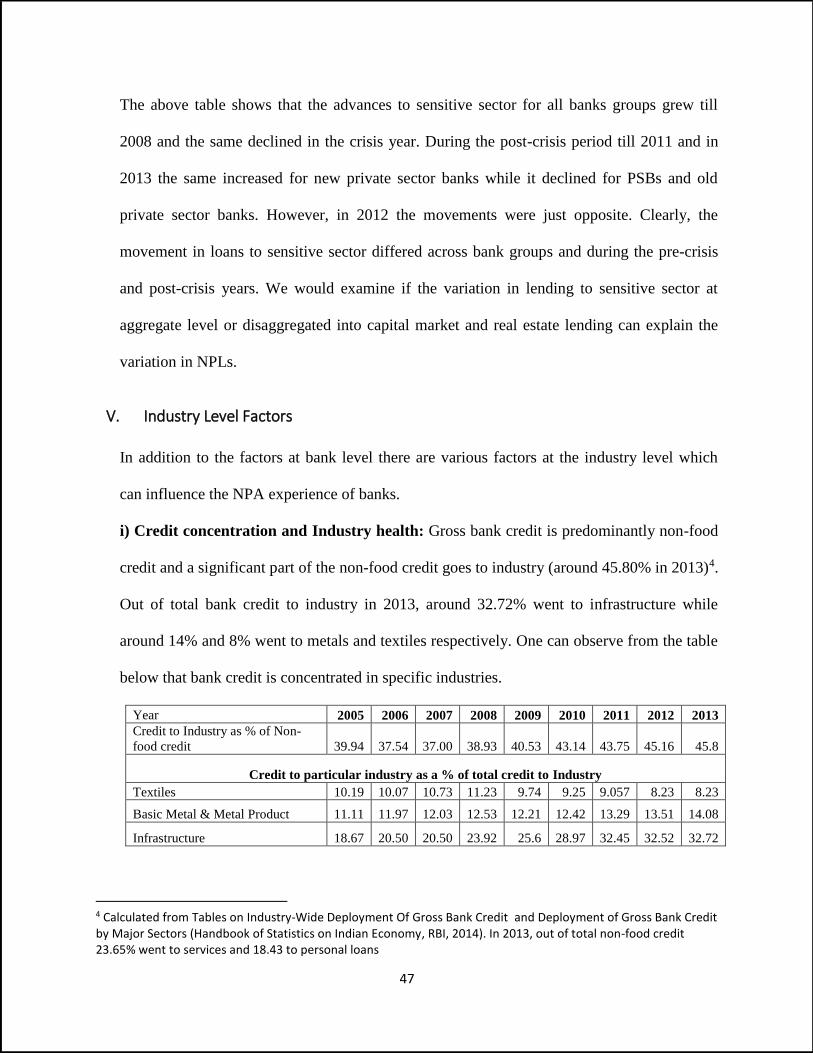
47
The above table shows that the advances to sensitive sector for all banks groups grew till
2008 and the same declined in the crisis year. During the post-crisis period till 2011 and in
2013 the same increased for new private sector banks while it declined for PSBs and old
private sector banks. However, in 2012 the movements were just opposite. Clearly, the
movement in loans to sensitive sector differed across bank groups and during the pre-crisis
and post-crisis years. We would examine if the variation in lending to sensitive sector at
aggregate level or disaggregated into capital market and real estate lending can explain the
variation in NPLs.
V. Industry Level Factors
In addition to the factors at bank level there are various factors at the industry level which
can influence the NPA experience of banks.
i) Credit concentration and Industry health: Gross bank credit is predominantly non-food
credit and a significant part of the non-food credit goes to industry (around 45.80% in 2013)4.
Out of total bank credit to industry in 2013, around 32.72% went to infrastructure while
around 14% and 8% went to metals and textiles respectively. One can observe from the table
below that bank credit is concentrated in specific industries.
Year 2005 2006 2007 2008 2009 2010 2011 2012 2013
Credit to Industry as % of Non-
food credit 39.94 37.54 37.00 38.93 40.53 43.14 43.75 45.16 45.8
Credit to particular industry as a % of total credit to Industry
Textiles 10.19 10.07 10.73 11.23 9.74 9.25 9.057 8.23 8.23
Basic Metal & Metal Product 11.11 11.97 12.03 12.53 12.21 12.42 13.29 13.51 14.08
Infrastructure 18.67 20.50 20.50 23.92 25.6 28.97 32.45 32.52 32.72
4 Calculated from Tables on Industry-Wide Deployment Of Gross Bank Credit and Deployment of Gross Bank Credit by Major Sectors (Handbook of Statistics on Indian Economy, RBI, 2014). In 2013, out of total non-food credit 23.65% went to services and 18.43 to personal loans
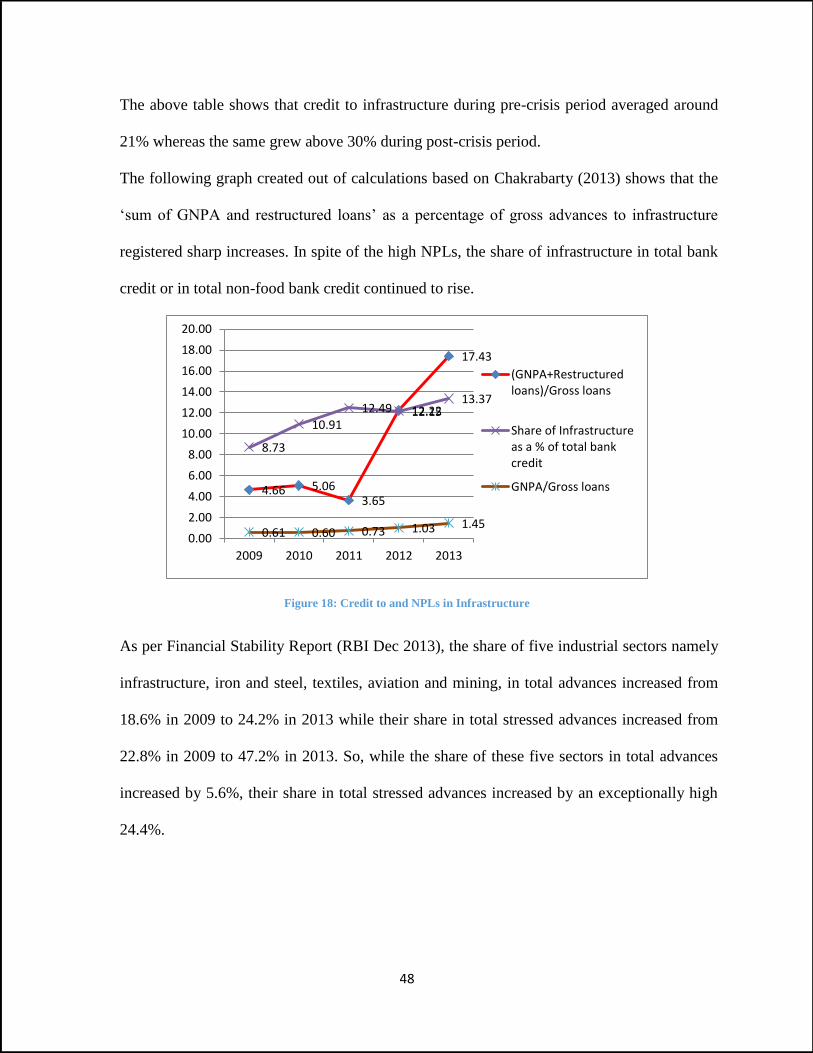
48
The above table shows that credit to infrastructure during pre-crisis period averaged around
21% whereas the same grew above 30% during post-crisis period.
The following graph created out of calculations based on Chakrabarty (2013) shows that the
‘sum of GNPA and restructured loans’ as a percentage of gross advances to infrastructure
registered sharp increases. In spite of the high NPLs, the share of infrastructure in total bank
credit or in total non-food bank credit continued to rise.
Figure 18: Credit to and NPLs in Infrastructure
As per Financial Stability Report (RBI Dec 2013), the share of five industrial sectors namely
infrastructure, iron and steel, textiles, aviation and mining, in total advances increased from
18.6% in 2009 to 24.2% in 2013 while their share in total stressed advances increased from
22.8% in 2009 to 47.2% in 2013. So, while the share of these five sectors in total advances
increased by 5.6%, their share in total stressed advances increased by an exceptionally high
24.4%.
4.66 5.063.65
12.22
17.43
8.73
10.91
12.49 12.1513.37
0.61 0.60 0.73 1.03 1.450.00
2.00
4.00
6.00
8.00
10.00
12.00
14.00
16.00
18.00
20.00
2009 2010 2011 2012 2013
(GNPA+Restructuredloans)/Gross loans
Share of Infrastructureas a % of total bankcredit
GNPA/Gross loans
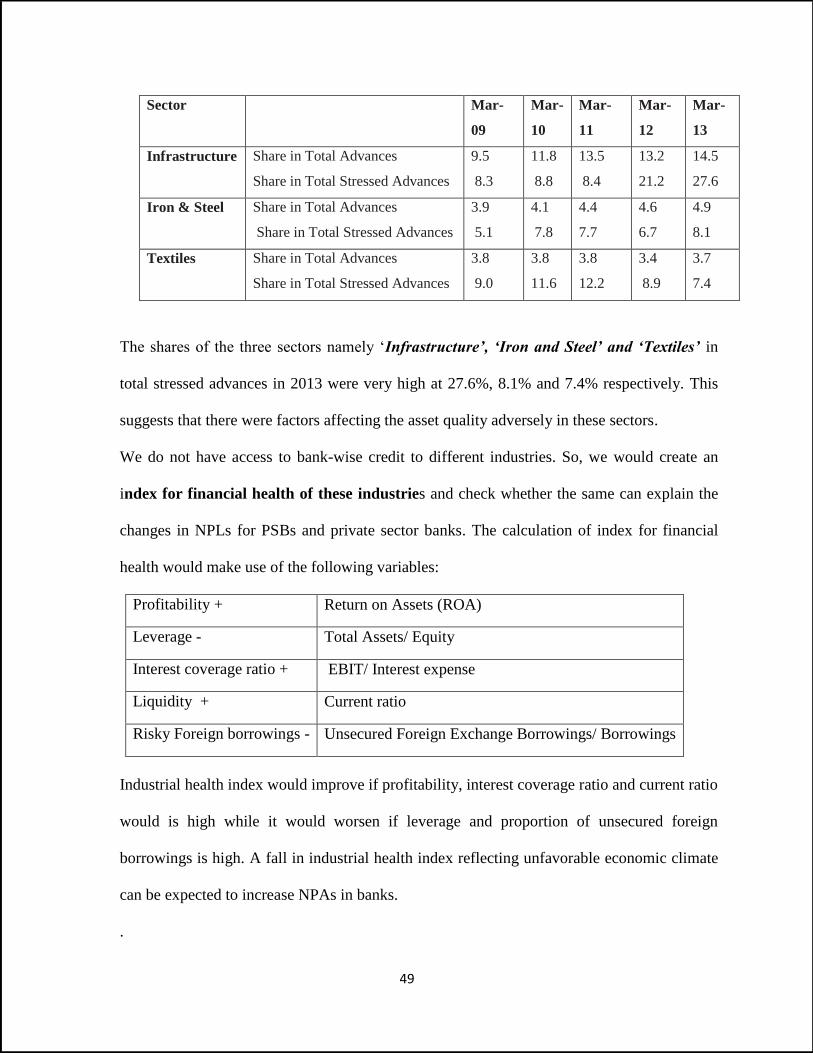
49
Sector Mar-
09
Mar-
10
Mar-
11
Mar-
12
Mar-
13
Infrastructure Share in Total Advances
Share in Total Stressed Advances
9.5
8.3
11.8
8.8
13.5
8.4
13.2
21.2
14.5
27.6
Iron & Steel Share in Total Advances
Share in Total Stressed Advances
3.9
5.1
4.1
7.8
4.4
7.7
4.6
6.7
4.9
8.1
Textiles Share in Total Advances
Share in Total Stressed Advances
3.8
9.0
3.8
11.6
3.8
12.2
3.4
8.9
3.7
7.4
The shares of the three sectors namely ‘Infrastructure’, ‘Iron and Steel’ and ‘Textiles’ in
total stressed advances in 2013 were very high at 27.6%, 8.1% and 7.4% respectively. This
suggests that there were factors affecting the asset quality adversely in these sectors.
We do not have access to bank-wise credit to different industries. So, we would create an
index for financial health of these industries and check whether the same can explain the
changes in NPLs for PSBs and private sector banks. The calculation of index for financial
health would make use of the following variables:
Profitability + Return on Assets (ROA)
Leverage - Total Assets/ Equity
Interest coverage ratio + EBIT/ Interest expense
Liquidity + Current ratio
Risky Foreign borrowings - Unsecured Foreign Exchange Borrowings/ Borrowings
Industrial health index would improve if profitability, interest coverage ratio and current ratio
would is high while it would worsen if leverage and proportion of unsecured foreign
borrowings is high. A fall in industrial health index reflecting unfavorable economic climate
can be expected to increase NPAs in banks.
.
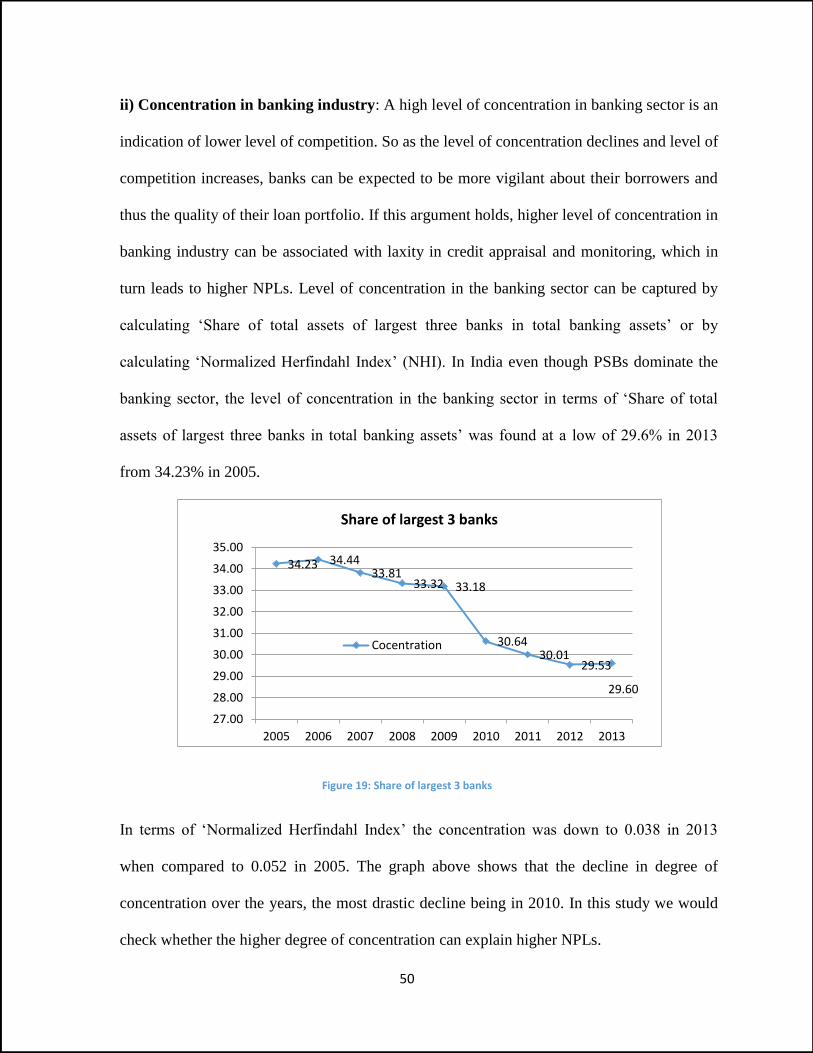
50
ii) Concentration in banking industry: A high level of concentration in banking sector is an
indication of lower level of competition. So as the level of concentration declines and level of
competition increases, banks can be expected to be more vigilant about their borrowers and
thus the quality of their loan portfolio. If this argument holds, higher level of concentration in
banking industry can be associated with laxity in credit appraisal and monitoring, which in
turn leads to higher NPLs. Level of concentration in the banking sector can be captured by
calculating ‘Share of total assets of largest three banks in total banking assets’ or by
calculating ‘Normalized Herfindahl Index’ (NHI). In India even though PSBs dominate the
banking sector, the level of concentration in the banking sector in terms of ‘Share of total
assets of largest three banks in total banking assets’ was found at a low of 29.6% in 2013
from 34.23% in 2005.
Figure 19: Share of largest 3 banks
In terms of ‘Normalized Herfindahl Index’ the concentration was down to 0.038 in 2013
when compared to 0.052 in 2005. The graph above shows that the decline in degree of
concentration over the years, the most drastic decline being in 2010. In this study we would
check whether the higher degree of concentration can explain higher NPLs.
34.23 34.4433.81
33.32 33.18
30.6430.01
29.53
29.60
27.00
28.00
29.00
30.00
31.00
32.00
33.00
34.00
35.00
2005 2006 2007 2008 2009 2010 2011 2012 2013
Share of largest 3 banks
Cocentration
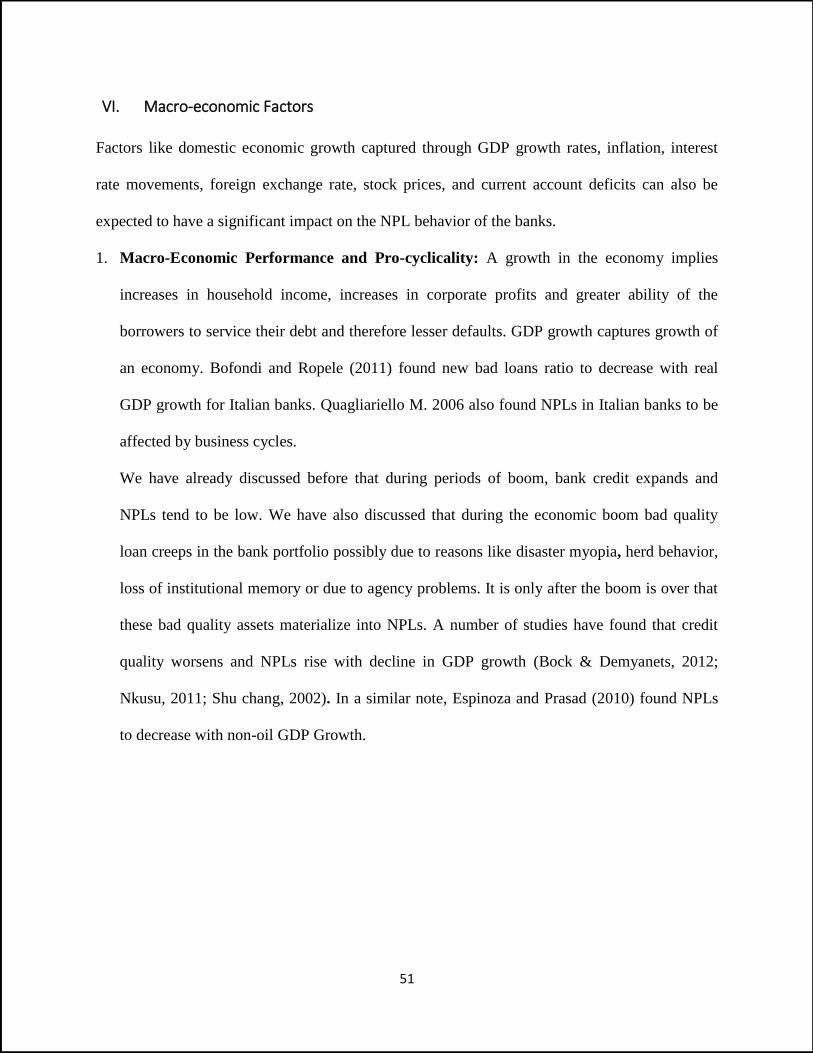
51
VI. Macro-economic Factors
Factors like domestic economic growth captured through GDP growth rates, inflation, interest
rate movements, foreign exchange rate, stock prices, and current account deficits can also be
expected to have a significant impact on the NPL behavior of the banks.
1. Macro-Economic Performance and Pro-cyclicality: A growth in the economy implies
increases in household income, increases in corporate profits and greater ability of the
borrowers to service their debt and therefore lesser defaults. GDP growth captures growth of
an economy. Bofondi and Ropele (2011) found new bad loans ratio to decrease with real
GDP growth for Italian banks. Quagliariello M. 2006 also found NPLs in Italian banks to be
affected by business cycles.
We have already discussed before that during periods of boom, bank credit expands and
NPLs tend to be low. We have also discussed that during the economic boom bad quality
loan creeps in the bank portfolio possibly due to reasons like disaster myopia, herd behavior,
loss of institutional memory or due to agency problems. It is only after the boom is over that
these bad quality assets materialize into NPLs. A number of studies have found that credit
quality worsens and NPLs rise with decline in GDP growth (Bock & Demyanets, 2012;
Nkusu, 2011; Shu chang, 2002). In a similar note, Espinoza and Prasad (2010) found NPLs
to decrease with non-oil GDP Growth.
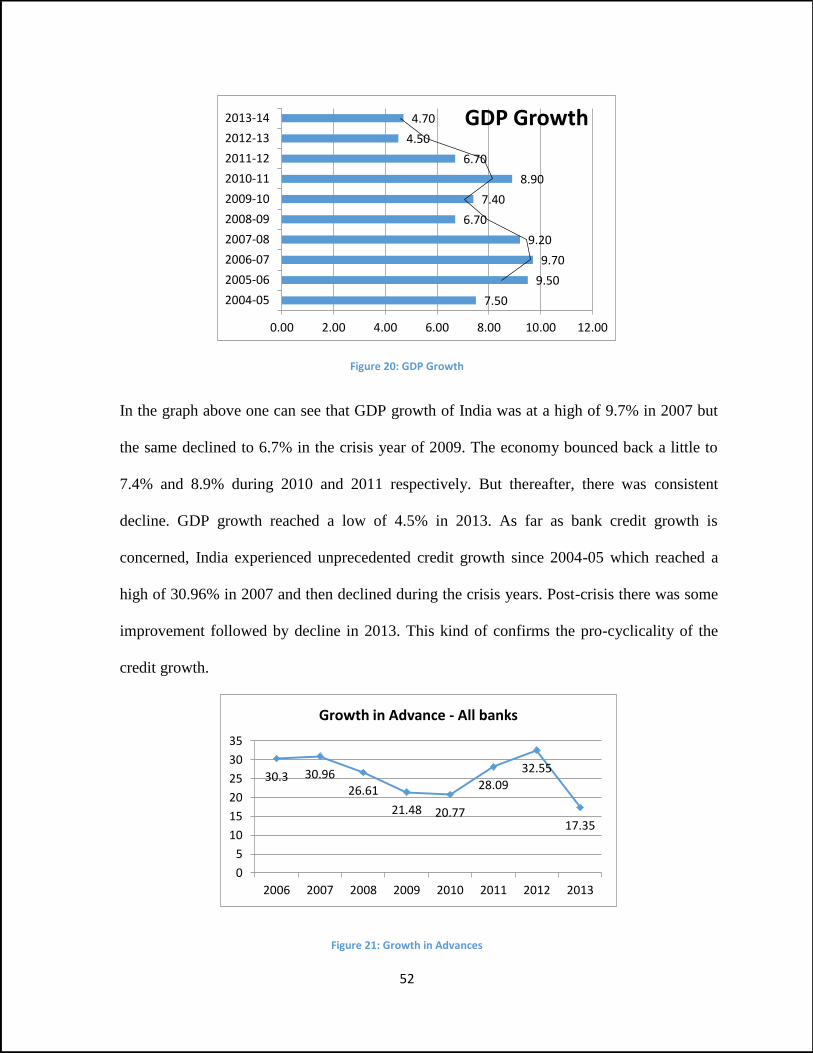
52
Figure 20: GDP Growth
In the graph above one can see that GDP growth of India was at a high of 9.7% in 2007 but
the same declined to 6.7% in the crisis year of 2009. The economy bounced back a little to
7.4% and 8.9% during 2010 and 2011 respectively. But thereafter, there was consistent
decline. GDP growth reached a low of 4.5% in 2013. As far as bank credit growth is
concerned, India experienced unprecedented credit growth since 2004-05 which reached a
high of 30.96% in 2007 and then declined during the crisis years. Post-crisis there was some
improvement followed by decline in 2013. This kind of confirms the pro-cyclicality of the
credit growth.
Figure 21: Growth in Advances
7.50
9.50
9.70
9.20
6.70
7.40
8.90
6.70
4.50
4.70
0.00 2.00 4.00 6.00 8.00 10.00 12.00
2004-05
2005-06
2006-07
2007-08
2008-09
2009-10
2010-11
2011-12
2012-13
2013-14 GDP Growth
30.3 30.9626.61
21.48 20.77
28.09
32.55
17.35
0
5
10
15
20
25
30
35
2006 2007 2008 2009 2010 2011 2012 2013
Growth in Advance - All banks
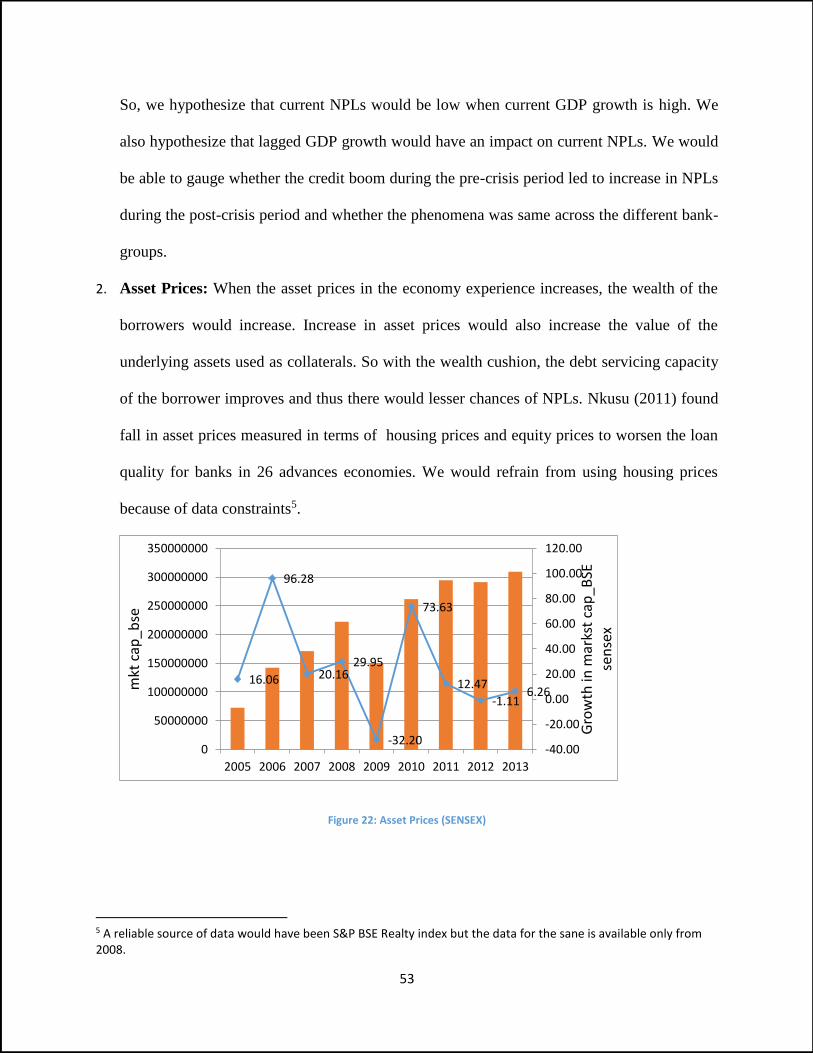
53
So, we hypothesize that current NPLs would be low when current GDP growth is high. We
also hypothesize that lagged GDP growth would have an impact on current NPLs. We would
be able to gauge whether the credit boom during the pre-crisis period led to increase in NPLs
during the post-crisis period and whether the phenomena was same across the different bank-
groups.
2. Asset Prices: When the asset prices in the economy experience increases, the wealth of the
borrowers would increase. Increase in asset prices would also increase the value of the
underlying assets used as collaterals. So with the wealth cushion, the debt servicing capacity
of the borrower improves and thus there would lesser chances of NPLs. Nkusu (2011) found
fall in asset prices measured in terms of housing prices and equity prices to worsen the loan
quality for banks in 26 advances economies. We would refrain from using housing prices
because of data constraints5.
Figure 22: Asset Prices (SENSEX)
5 A reliable source of data would have been S&P BSE Realty index but the data for the sane is available only from 2008.
16.06
96.28
20.1629.95
-32.20
73.63
12.47
-1.116.26
-40.00
-20.00
0.00
20.00
40.00
60.00
80.00
100.00
120.00
0
50000000
100000000
150000000
200000000
250000000
300000000
350000000
2005 2006 2007 2008 2009 2010 2011 2012 2013
Gro
wth
in m
arks
t ca
p_B
SE
sen
sex
mkt
cap
_bse
54
We would use ‘market capitalization’ of S&P Bombay Stock Exchange Sensitive Index and
alternatively ‘growth in the market capitalization’ of the index to capture the movements in
stock market prices. We can see in the graph above that the market capitalization and its
growth shrank in the crisis year of 2009. The growth recovered a year after but again fell
down in subsequent years. Increase in stock prices reflects a positive outlook about the
financial position and performance of most important companies in the market. Increase in
stock prices also means higher returns to investors. Both are likely to bring down borrower
default possibilities. Lokare (2014) found increase in stock prices to bring decline in NPLs in
Indian banks after a lag of 2 quarters. Therefore, we would expect higher market
capitalization of BSE Sensex to be associated with lower NPLs. We will use a natural log of
the market capitalization.
3. Price Stability: Rise in inflation can reduce the real value of the loan if the loan is
denominated in nominal terms (Bofondi & Ropele, 2011) thereby making it easy for the
borrower to service it. Shu chang (2002) and Gerlach, Peng, and Shu (2005) indeed found
bad loans in Hong kong banks to decline with consumer price inflation.
But it is also argued that inflation can have an adverse effect on borrowers’ real income and
real value of assets thus affects their repaying capacity adversely. Rising inflation can lead to
increase in the interest rates, making the debt servicing more difficult. In line with this
argument Babouček and Jančar (2005) and Klein (2013) found rising inflation to contribute
to higher NPLs .Consistent with this logic, Hoggarth, Sorensen, and Zicchino (2005) found
bank’s write-off ratio to go up after rise in retail price inflation. Lokare (2014) found rise in
WPI inflation to increase to increase NPLs in Indian banks after a lag of 5 quarters.
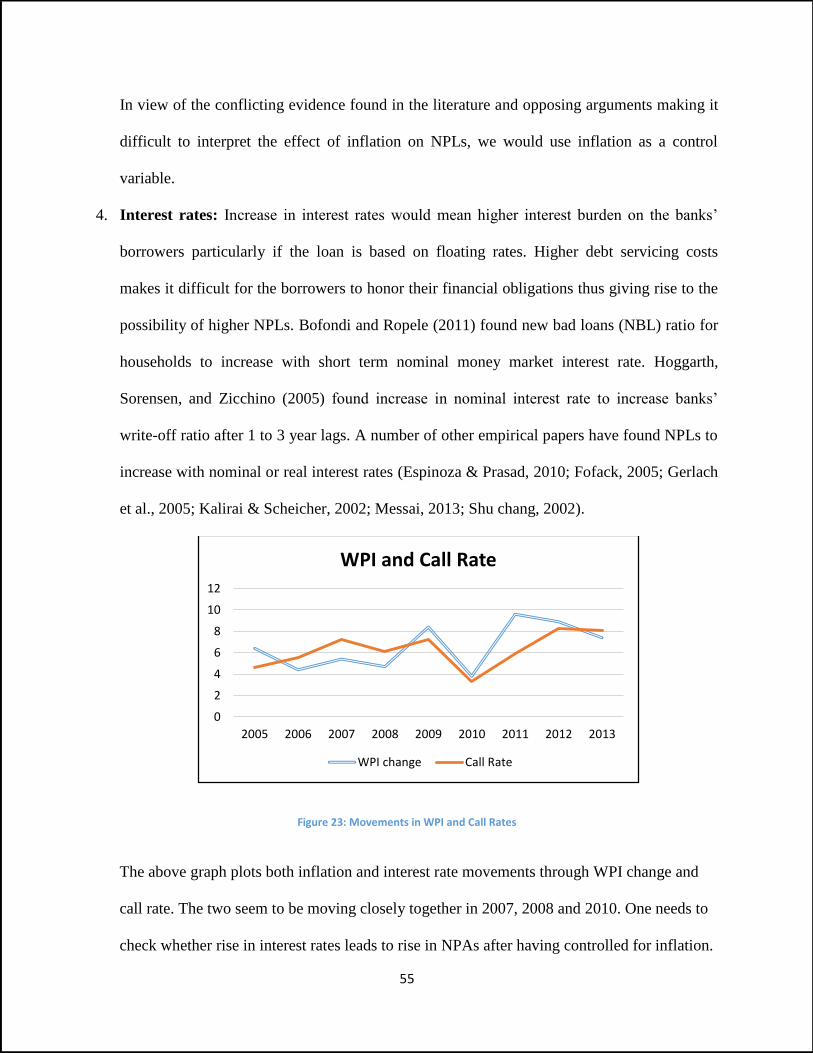
55
In view of the conflicting evidence found in the literature and opposing arguments making it
difficult to interpret the effect of inflation on NPLs, we would use inflation as a control
variable.
4. Interest rates: Increase in interest rates would mean higher interest burden on the banks’
borrowers particularly if the loan is based on floating rates. Higher debt servicing costs
makes it difficult for the borrowers to honor their financial obligations thus giving rise to the
possibility of higher NPLs. Bofondi and Ropele (2011) found new bad loans (NBL) ratio for
households to increase with short term nominal money market interest rate. Hoggarth,
Sorensen, and Zicchino (2005) found increase in nominal interest rate to increase banks’
write-off ratio after 1 to 3 year lags. A number of other empirical papers have found NPLs to
increase with nominal or real interest rates (Espinoza & Prasad, 2010; Fofack, 2005; Gerlach
et al., 2005; Kalirai & Scheicher, 2002; Messai, 2013; Shu chang, 2002).
Figure 23: Movements in WPI and Call Rates
The above graph plots both inflation and interest rate movements through WPI change and
call rate. The two seem to be moving closely together in 2007, 2008 and 2010. One needs to
check whether rise in interest rates leads to rise in NPAs after having controlled for inflation.
0
2
4
6
8
10
12
2005 2006 2007 2008 2009 2010 2011 2012 2013
WPI and Call Rate
WPI change Call Rate
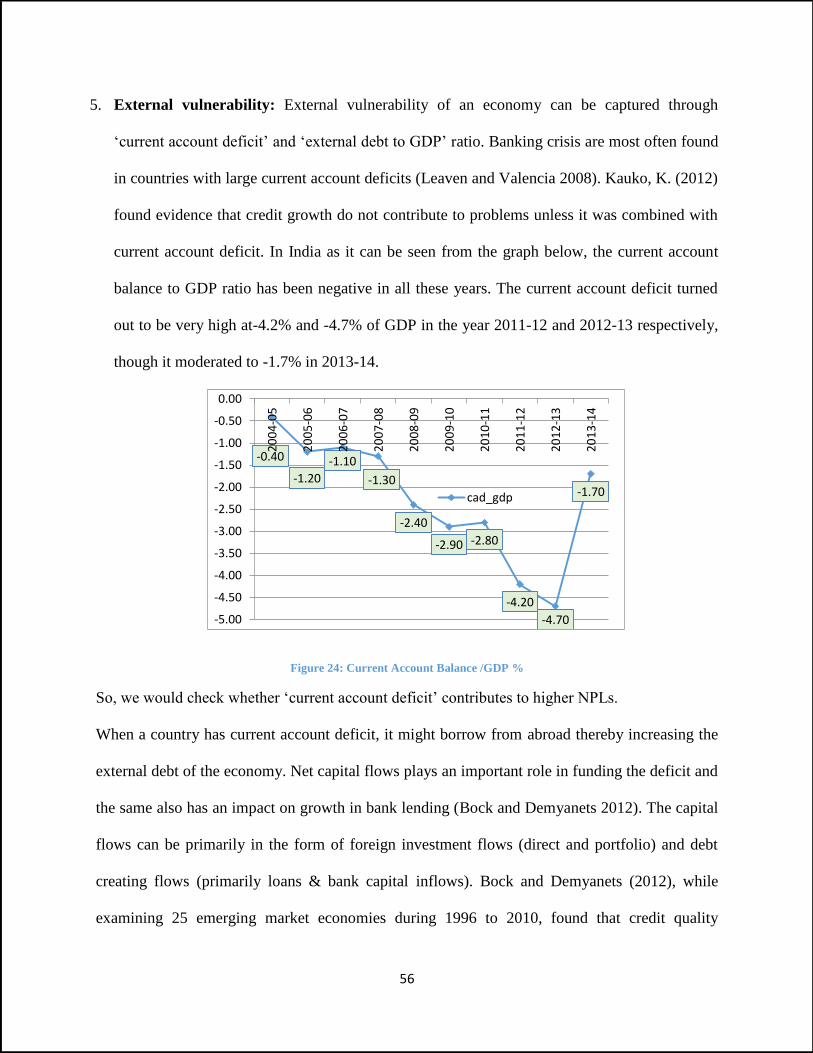
56
5. External vulnerability: External vulnerability of an economy can be captured through
‘current account deficit’ and ‘external debt to GDP’ ratio. Banking crisis are most often found
in countries with large current account deficits (Leaven and Valencia 2008). Kauko, K. (2012)
found evidence that credit growth do not contribute to problems unless it was combined with
current account deficit. In India as it can be seen from the graph below, the current account
balance to GDP ratio has been negative in all these years. The current account deficit turned
out to be very high at-4.2% and -4.7% of GDP in the year 2011-12 and 2012-13 respectively,
though it moderated to -1.7% in 2013-14.
Figure 24: Current Account Balance /GDP %
So, we would check whether ‘current account deficit’ contributes to higher NPLs.
When a country has current account deficit, it might borrow from abroad thereby increasing the
external debt of the economy. Net capital flows plays an important role in funding the deficit and
the same also has an impact on growth in bank lending (Bock and Demyanets 2012). The capital
flows can be primarily in the form of foreign investment flows (direct and portfolio) and debt
creating flows (primarily loans & bank capital inflows). Bock and Demyanets (2012), while
examining 25 emerging market economies during 1996 to 2010, found that credit quality
-0.40
-1.20
-1.10
-1.30
-2.40
-2.90 -2.80
-4.20
-4.70
-1.70
-5.00
-4.50
-4.00
-3.50
-3.00
-2.50
-2.00
-1.50
-1.00
-0.50
0.00
20
04
-05
20
05
-06
20
06
-07
20
07
-08
20
08
-09
20
09
-10
20
10
-11
20
11
-12
20
12
-13
20
13
-14
cad_gdp
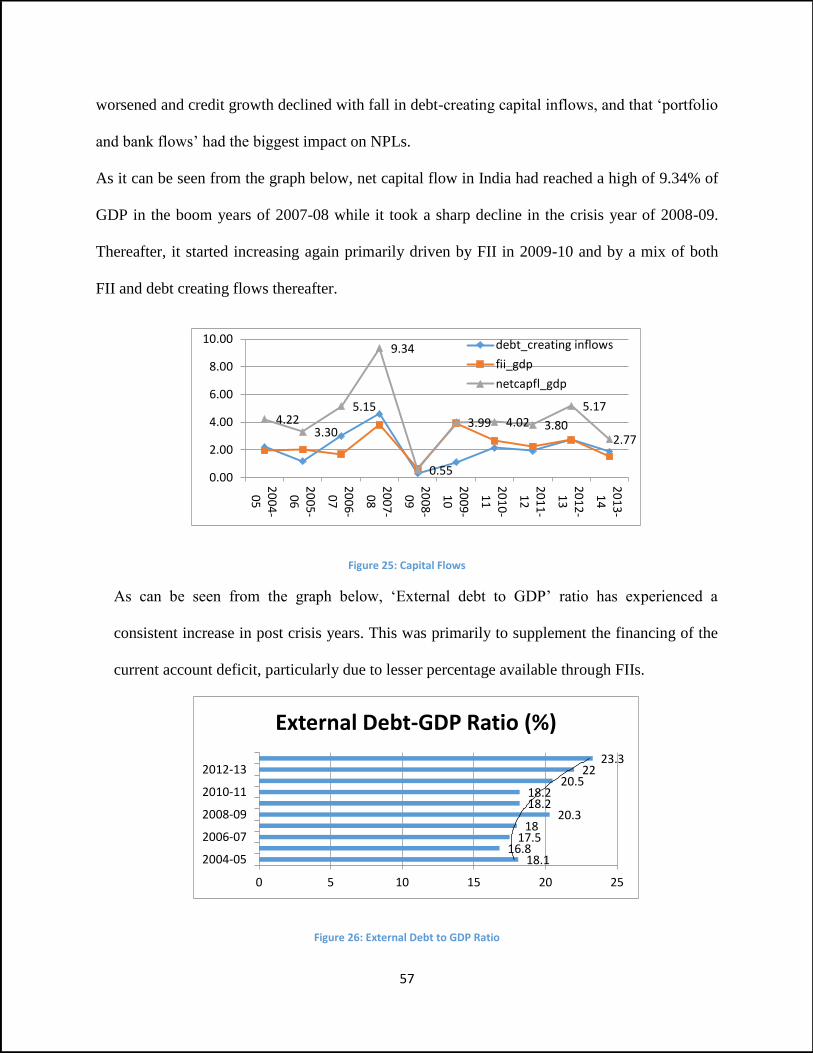
57
worsened and credit growth declined with fall in debt-creating capital inflows, and that ‘portfolio
and bank flows’ had the biggest impact on NPLs.
As it can be seen from the graph below, net capital flow in India had reached a high of 9.34% of
GDP in the boom years of 2007-08 while it took a sharp decline in the crisis year of 2008-09.
Thereafter, it started increasing again primarily driven by FII in 2009-10 and by a mix of both
FII and debt creating flows thereafter.
Figure 25: Capital Flows
As can be seen from the graph below, ‘External debt to GDP’ ratio has experienced a
consistent increase in post crisis years. This was primarily to supplement the financing of the
current account deficit, particularly due to lesser percentage available through FIIs.
Figure 26: External Debt to GDP Ratio
4.223.30
5.15
9.34
0.55
3.99 4.02 3.80
5.17
2.77
0.00
2.00
4.00
6.00
8.00
10.00
20
04
-0
5
20
05
-0
6
20
06
-0
7
20
07
-0
8
20
08
-0
9
20
09
-1
0
20
10
-1
1
20
11
-1
2
20
12
-1
3
20
13
-1
4
debt_creating inflows
fii_gdp
netcapfl_gdp
18.116.8
17.518
20.318.218.2
20.522
23.3
0 5 10 15 20 25
2004-05
2006-07
2008-09
2010-11
2012-13
External Debt-GDP Ratio (%)
58
As per the breakup provided on external debt in Annual Report of RBI for 2013-14 (Table 2.2
and Table 2.7), the composition of India’s external debt is undergoing a change. At the end of
2013, the debt inflows were primarily in the form of external commercial borrowings and
non-resident Indian deposits. In terms of borrower classification, the share of non-government
debt in total external debt increased above 80% in 2012-13 and 2013-14.
All this implies that the rise in borrowing of corporate sector is playing a dominant role in
external debt of the country going up. So, in this study we would check whether variables like
‘Debt-creating flows to GDP’ and/or ‘external debt to GDP’ can act as a driver for NPLs.
6. Exchange Rate: If exchange rate appreciates, firms which are in export oriented sectors and
which are therefore earning in foreign currency will have a negative impact on their revenues
and profits. So, if the export oriented sectors dominate as bank borrowers, an appreciation in
domestic currency can give rise to possibility of higher NPLs. Consistent with this logic,
Fofack (2005) found real effective exchange rate appreciation to have a positive impact on
NPLs in Sub-Saharan countries during 1990s.
However if domestic currency depreciates vis-à-vis foreign currency, the debt servicing
capacity of the bank borrowers who have obtained foreign currency denominated debt will
worsen, due to foreign exchange fluctuation losses impairing their profits and net worth. If
banks have borrowed in foreign currency, and have extended loans in domestic currency, the
domestic currency depreciation will impair its ability to service the foreign debt. This will
have an adverse impact on banks’ ability to extend loans which is turn will make it difficult
for the borrowers to renew their loans thereby affecting the borrowers’ ability to repay. So, if
bank and/or its borrowers have significant foreign borrowings (unhedged), exchange rate
depreciation will have a negative effect on quality of loan assets. Consistent with this
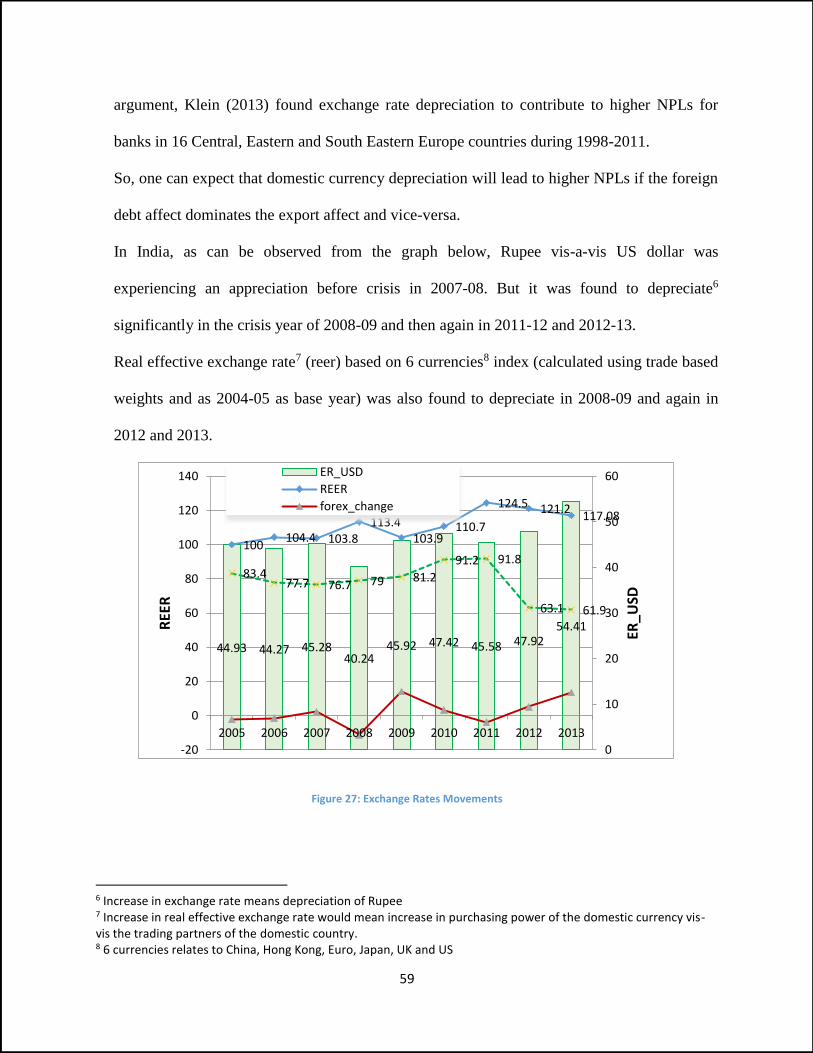
59
argument, Klein (2013) found exchange rate depreciation to contribute to higher NPLs for
banks in 16 Central, Eastern and South Eastern Europe countries during 1998-2011.
So, one can expect that domestic currency depreciation will lead to higher NPLs if the foreign
debt affect dominates the export affect and vice-versa.
In India, as can be observed from the graph below, Rupee vis-a-vis US dollar was
experiencing an appreciation before crisis in 2007-08. But it was found to depreciate6
significantly in the crisis year of 2008-09 and then again in 2011-12 and 2012-13.
Real effective exchange rate7 (reer) based on 6 currencies8 index (calculated using trade based
weights and as 2004-05 as base year) was also found to depreciate in 2008-09 and again in
2012 and 2013.
Figure 27: Exchange Rates Movements
6 Increase in exchange rate means depreciation of Rupee 7 Increase in real effective exchange rate would mean increase in purchasing power of the domestic currency vis-vis the trading partners of the domestic country. 8 6 currencies relates to China, Hong Kong, Euro, Japan, UK and US
44.93 44.27 45.2840.24
45.92 47.42 45.58 47.9254.41
100104.4 103.8
113.4103.9
110.7
124.5 121.2117.08
83.477.7 76.7 79 81.2
91.2 91.8
63.1 61.9
0
10
20
30
40
50
60
-20
0
20
40
60
80
100
120
140
2005 2006 2007 2008 2009 2010 2011 2012 2013
ER_U
SD
REE
R
ER_USD
REER
forex_change
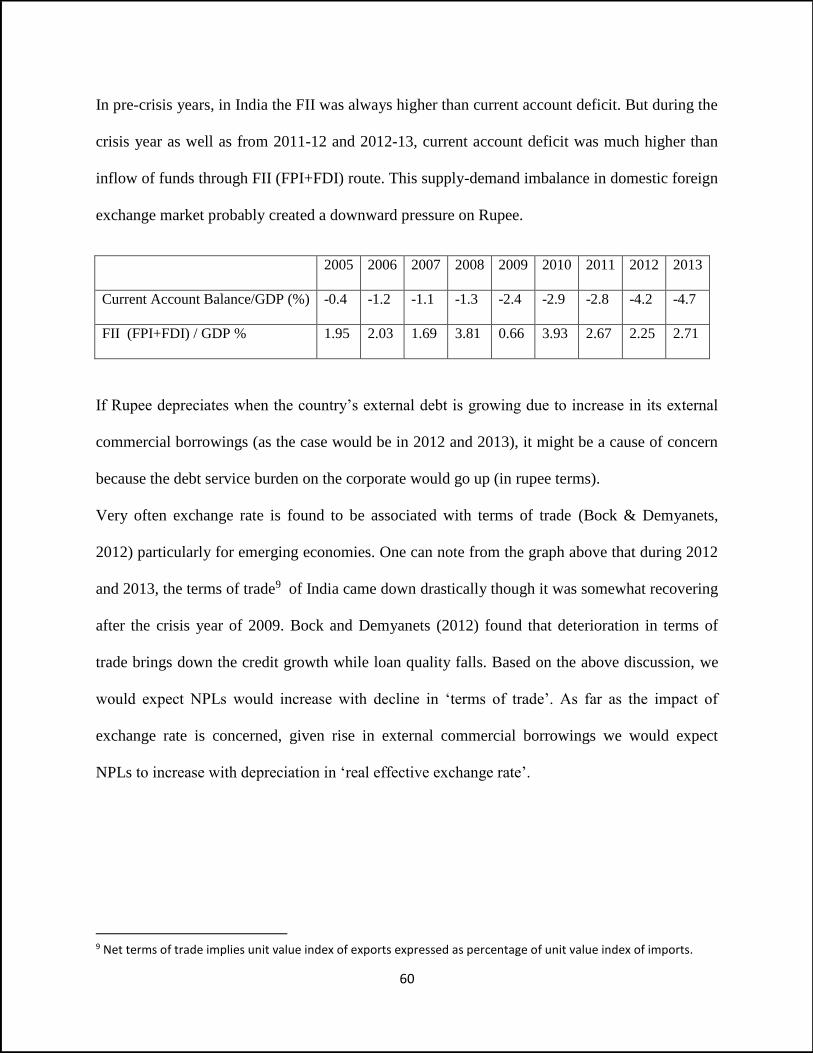
60
In pre-crisis years, in India the FII was always higher than current account deficit. But during the
crisis year as well as from 2011-12 and 2012-13, current account deficit was much higher than
inflow of funds through FII (FPI+FDI) route. This supply-demand imbalance in domestic foreign
exchange market probably created a downward pressure on Rupee.
2005 2006 2007 2008 2009 2010 2011 2012 2013
Current Account Balance/GDP (%) -0.4 -1.2 -1.1 -1.3 -2.4 -2.9 -2.8 -4.2 -4.7
FII (FPI+FDI) / GDP % 1.95 2.03 1.69 3.81 0.66 3.93 2.67 2.25 2.71
If Rupee depreciates when the country’s external debt is growing due to increase in its external
commercial borrowings (as the case would be in 2012 and 2013), it might be a cause of concern
because the debt service burden on the corporate would go up (in rupee terms).
Very often exchange rate is found to be associated with terms of trade (Bock & Demyanets,
2012) particularly for emerging economies. One can note from the graph above that during 2012
and 2013, the terms of trade9 of India came down drastically though it was somewhat recovering
after the crisis year of 2009. Bock and Demyanets (2012) found that deterioration in terms of
trade brings down the credit growth while loan quality falls. Based on the above discussion, we
would expect NPLs would increase with decline in ‘terms of trade’. As far as the impact of
exchange rate is concerned, given rise in external commercial borrowings we would expect
NPLs to increase with depreciation in ‘real effective exchange rate’.
9 Net terms of trade implies unit value index of exports expressed as percentage of unit value index of imports.
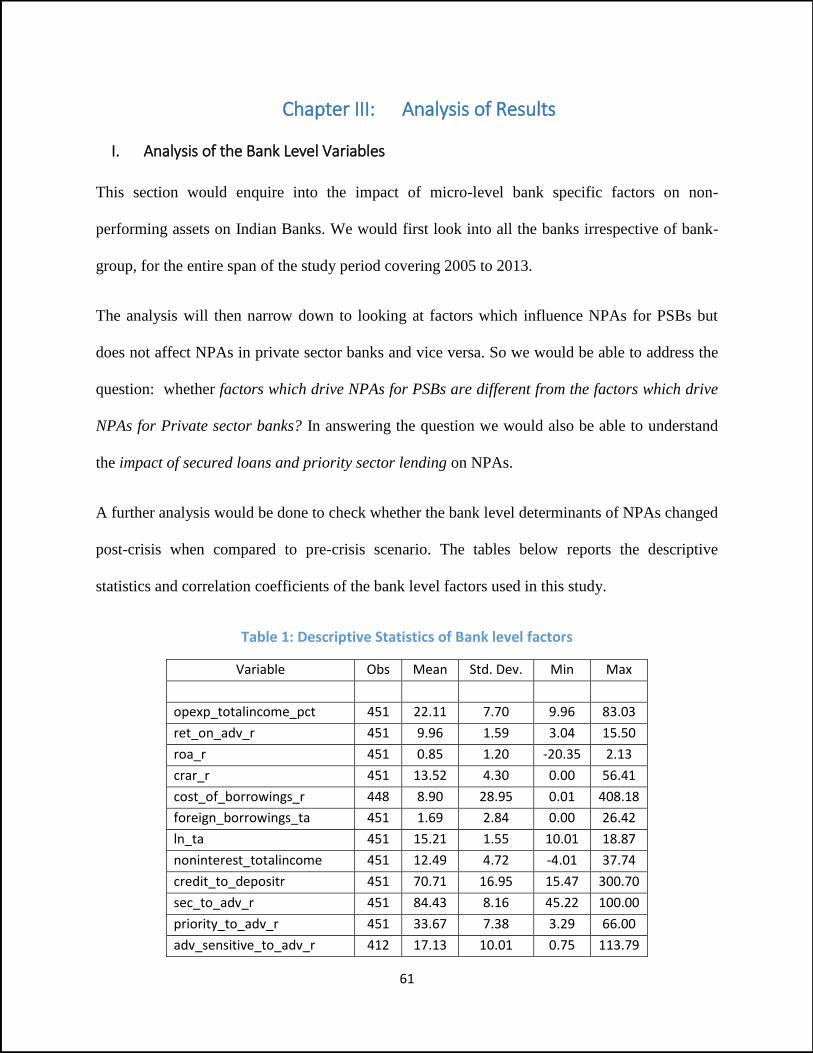
61
Chapter III: Analysis of Results
I. Analysis of the Bank Level Variables
This section would enquire into the impact of micro-level bank specific factors on non-
performing assets on Indian Banks. We would first look into all the banks irrespective of bank-
group, for the entire span of the study period covering 2005 to 2013.
The analysis will then narrow down to looking at factors which influence NPAs for PSBs but
does not affect NPAs in private sector banks and vice versa. So we would be able to address the
question: whether factors which drive NPAs for PSBs are different from the factors which drive
NPAs for Private sector banks? In answering the question we would also be able to understand
the impact of secured loans and priority sector lending on NPAs.
A further analysis would be done to check whether the bank level determinants of NPAs changed
post-crisis when compared to pre-crisis scenario. The tables below reports the descriptive
statistics and correlation coefficients of the bank level factors used in this study.
Table 1: Descriptive Statistics of Bank level factors
Variable Obs Mean Std. Dev. Min Max
opexp_totalincome_pct 451 22.11 7.70 9.96 83.03
ret_on_adv_r 451 9.96 1.59 3.04 15.50
roa_r 451 0.85 1.20 -20.35 2.13
crar_r 451 13.52 4.30 0.00 56.41
cost_of_borrowings_r 448 8.90 28.95 0.01 408.18
foreign_borrowings_ta 451 1.69 2.84 0.00 26.42
ln_ta 451 15.21 1.55 10.01 18.87
noninterest_totalincome 451 12.49 4.72 -4.01 37.74
credit_to_depositr 451 70.71 16.95 15.47 300.70
sec_to_adv_r 451 84.43 8.16 45.22 100.00
priority_to_adv_r 451 33.67 7.38 3.29 66.00
adv_sensitive_to_adv_r 412 17.13 10.01 0.75 113.79
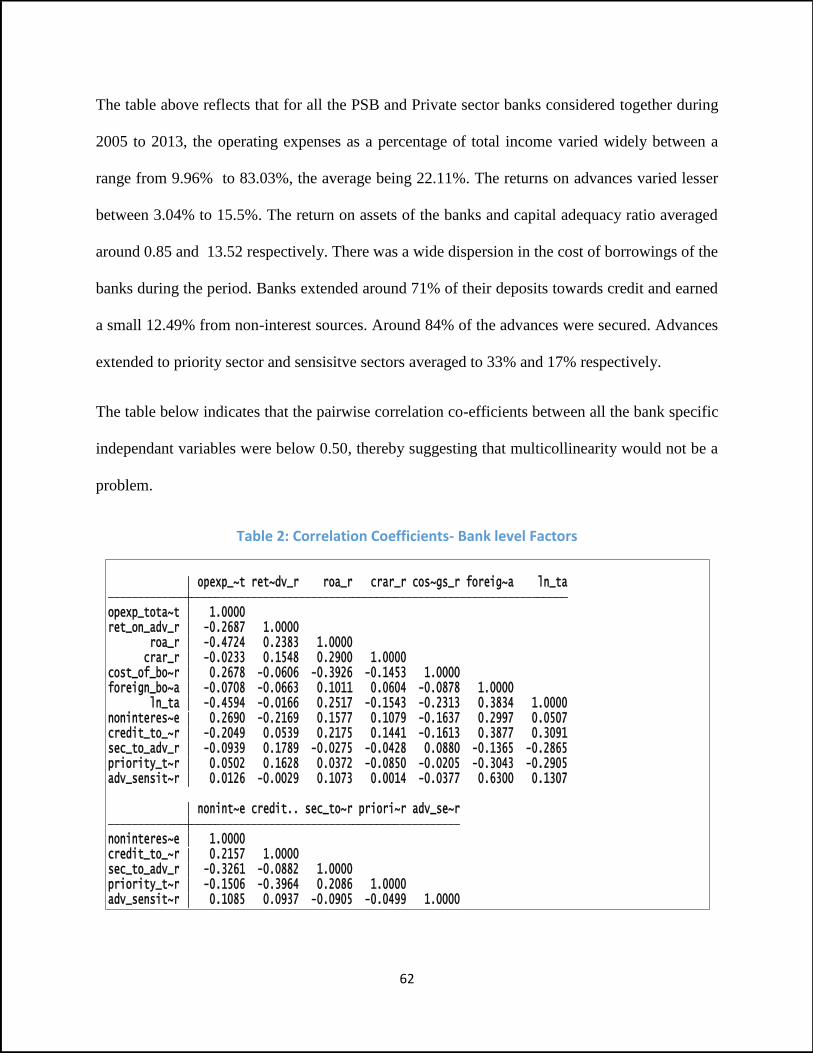
62
The table above reflects that for all the PSB and Private sector banks considered together during
2005 to 2013, the operating expenses as a percentage of total income varied widely between a
range from 9.96% to 83.03%, the average being 22.11%. The returns on advances varied lesser
between 3.04% to 15.5%. The return on assets of the banks and capital adequacy ratio averaged
around 0.85 and 13.52 respectively. There was a wide dispersion in the cost of borrowings of the
banks during the period. Banks extended around 71% of their deposits towards credit and earned
a small 12.49% from non-interest sources. Around 84% of the advances were secured. Advances
extended to priority sector and sensisitve sectors averaged to 33% and 17% respectively.
The table below indicates that the pairwise correlation co-efficients between all the bank specific
independant variables were below 0.50, thereby suggesting that multicollinearity would not be a
problem.
Table 2: Correlation Coefficients- Bank level Factors
adv_sensit~r 0.1085 0.0937 -0.0905 -0.0499 1.0000 priority_t~r -0.1506 -0.3964 0.2086 1.0000 sec_to_adv_r -0.3261 -0.0882 1.0000 credit_to_~r 0.2157 1.0000 noninteres~e 1.0000 nonint~e credit.. sec_to~r priori~r adv_se~r
adv_sensit~r 0.0126 -0.0029 0.1073 0.0014 -0.0377 0.6300 0.1307 priority_t~r 0.0502 0.1628 0.0372 -0.0850 -0.0205 -0.3043 -0.2905 sec_to_adv_r -0.0939 0.1789 -0.0275 -0.0428 0.0880 -0.1365 -0.2865 credit_to_~r -0.2049 0.0539 0.2175 0.1441 -0.1613 0.3877 0.3091 noninteres~e 0.2690 -0.2169 0.1577 0.1079 -0.1637 0.2997 0.0507 ln_ta -0.4594 -0.0166 0.2517 -0.1543 -0.2313 0.3834 1.0000 foreign_bo~a -0.0708 -0.0663 0.1011 0.0604 -0.0878 1.0000 cost_of_bo~r 0.2678 -0.0606 -0.3926 -0.1453 1.0000 crar_r -0.0233 0.1548 0.2900 1.0000 roa_r -0.4724 0.2383 1.0000 ret_on_adv_r -0.2687 1.0000 opexp_tota~t 1.0000 opexp_~t ret~dv_r roa_r crar_r cos~gs_r foreig~a ln_ta
63
The results for the panel regressions for all the banks put together for the entire period from 2005
to 2013 are shown in Table 3 below. These regressions were also run with dummy variables for
PSBs and dummy variable for crisis. The overall results in terms of the significance and direction
of influence of the independent variables remained the same, with the magnitudes of the
coefficients experiencing some changes.
Analysis: In the literature survey and hypothesis development section, we saw that a better
quality of management is expected to have better ability to appraise and monitor credit and
therefore can be associated with lower NPAs. Quality of management is typically captured
through operational efficiency. Our results show that as far as the operational efficiency captured
through ‘Cost to Income ratio’10 (opexp_totalincome_pct) is concerned, it really does not have
any effect on NPA levels of banks during the period. But when revenue efficiency is captured in
terms of return on advances the results were as per expectation. A better management quality
reflected in higher return on advance had a negative effect on NPAs. The findings are in line
with the bad management hypothesis (Berger & Deyoung, 1997) rather than skimping
hypothesis or bad luck hypothesis.
When the results are examined for PSBs and Private sector banks separately, we find the
expected positive sign for operating expense variable at 5% level of significance for PSBs but
the NPAs of private sector banks continue to be unaffected by the operating expense variable.
10 Use of ‘staff expenses to total expenses ratio’ does not bring a change in the results
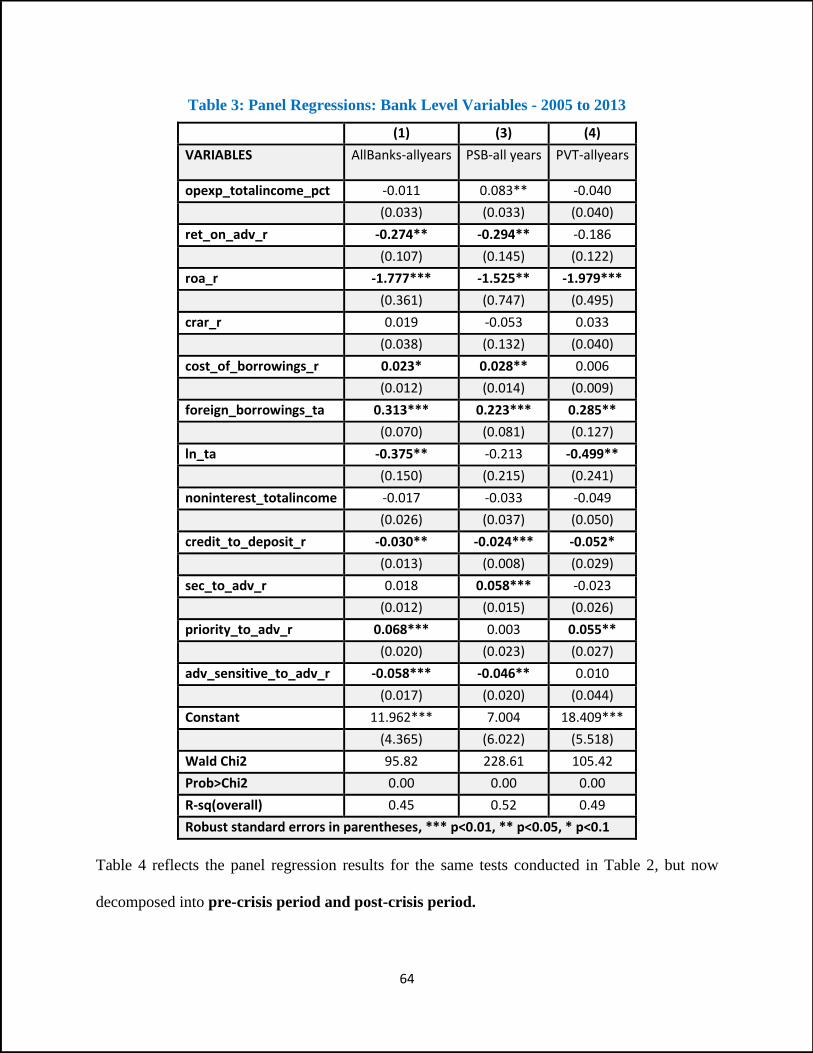
64
Table 3: Panel Regressions: Bank Level Variables - 2005 to 2013
(1) (3) (4)
VARIABLES AllBanks-allyears PSB-all years PVT-allyears
opexp_totalincome_pct -0.011 0.083** -0.040
(0.033) (0.033) (0.040)
ret_on_adv_r -0.274** -0.294** -0.186
(0.107) (0.145) (0.122)
roa_r -1.777*** -1.525** -1.979***
(0.361) (0.747) (0.495)
crar_r 0.019 -0.053 0.033
(0.038) (0.132) (0.040)
cost_of_borrowings_r 0.023* 0.028** 0.006
(0.012) (0.014) (0.009)
foreign_borrowings_ta 0.313*** 0.223*** 0.285**
(0.070) (0.081) (0.127)
ln_ta -0.375** -0.213 -0.499**
(0.150) (0.215) (0.241)
noninterest_totalincome -0.017 -0.033 -0.049
(0.026) (0.037) (0.050)
credit_to_deposit_r -0.030** -0.024*** -0.052*
(0.013) (0.008) (0.029)
sec_to_adv_r 0.018 0.058*** -0.023
(0.012) (0.015) (0.026)
priority_to_adv_r 0.068*** 0.003 0.055**
(0.020) (0.023) (0.027)
adv_sensitive_to_adv_r -0.058*** -0.046** 0.010
(0.017) (0.020) (0.044)
Constant 11.962*** 7.004 18.409***
(4.365) (6.022) (5.518)
Wald Chi2 95.82 228.61 105.42
Prob>Chi2 0.00 0.00 0.00
R-sq(overall) 0.45 0.52 0.49
Robust standard errors in parentheses, *** p<0.01, ** p<0.05, * p<0.1
Table 4 reflects the panel regression results for the same tests conducted in Table 2, but now
decomposed into pre-crisis period and post-crisis period.
65
So, if we compare the coefficient on operating expense variable during pre-crisis period with
post-crisis period, at overall bank level the results are still insignificant. But if look into the set of
results for the bank types separately, the coefficient on the operating expense variable for PSBs
is positive and significant during post-crisis period while the coefficient on the variable was
negative and significant for Private sector banks during Pre-crisis period. The result for PSBs
explains that during post-crisis period, a higher operating expense reflecting bad management
was also responsible for higher NPAs. For private sector banks however, the result indicates that
during the pre-crisis phase probably lesser operating expenses were incurred on loan appraisals
which resulted in higher NPAs. So the result for PSBs support bad management hypothesis
during post-crisis period but result for Private sector banks support ‘skimping hypotheses during
pre-crisis phase. Revenue efficiency variable supports bad management hypothesis during pre-
crisis period at overall bank level as well as for PSBs.
So one can conclude that bad management hypothesis holds for PSBs during both pre-crisis and
post crisis period but only skimping hypothesis holds for private sector banks only during pre-
crisis period.
Return on Assets (ROA) has negative and significant coefficient at 1% level at overall banks’
level as well as when PSBs and private sector banks were considered separately. The ROA
impact was stronger post-crisis for PSBs whereas the same was stronger pre-crisis for private
sector banks. A higher ROA is an indication that the management is doing well on the
profitability front and therefore it does not really have to go for high risk taking loans to boost up
its profits. Therefore, it can keep its NPAs to lower levels. If banks were going for high risk
lending or lower loan loss provisioning in order to achieve higher ROA, it would come back in
the form of higher NPAs in the current or subsequent years. We also used a lag of ROA to check
66
for this possibility in the panel regressions but we did not find any support for the same. So it can
be said that the results are not supportive of earnings management tendency in banks but ROA
variable is probably capturing the quality of management in banks.
According to the ‘Moral hazard hypothesis’ banks with lower levels of capitalization have
motivation to increase the riskiness of their loan portfolio. An insignificant coefficient on ‘capital
adequacy ratio’ in results implies that the same does not hold for Indian banks. This can be
attributed to the support and monitoring from the regulatory authorities in the country. The
insignificant result on CRAR holds true even when PSBs and private banks were examined
separately as well as when they were examined for pre-crisis and post-crisis periods.
As can be seen from Table 1, high foreign borrowings11 for banks could explain high NPAs at
overall banks’ level as well for both the bank types namely PSBs and private sector banks. But
Table 2 on pre-crisis and post-crisis break-up reveals that the variable was not significant except
for pre-crisis period at overall banks’ level. However the sign of the variable remained positive
consistently in all the regressions. Cost of borrowings was also found to be significant in
explaining the higher NPAs at overall banks’ level. This result was probably driven by similar
such result for PSBs. Cost of borrowings for private sector banks did not affect its NPA levels.
Decomposition of the period into pre and post crisis in Table 2 also shows that only PSBs with
high cost of borrowings had high NPAs in both pre and post crisis phases.
11 Interbank loans to borrowings were not found to be significant in any of the regressions using bank level
variables (except for PSBs for pre-crisis period at 10% level). This was probably due to the restriction RBI had
brought on interbank borrowings11 of banks (cap of 200% of net worth wef April1, 2007) in anticipation of the
possibility of these borrowings used by banks to fund their loan growth.
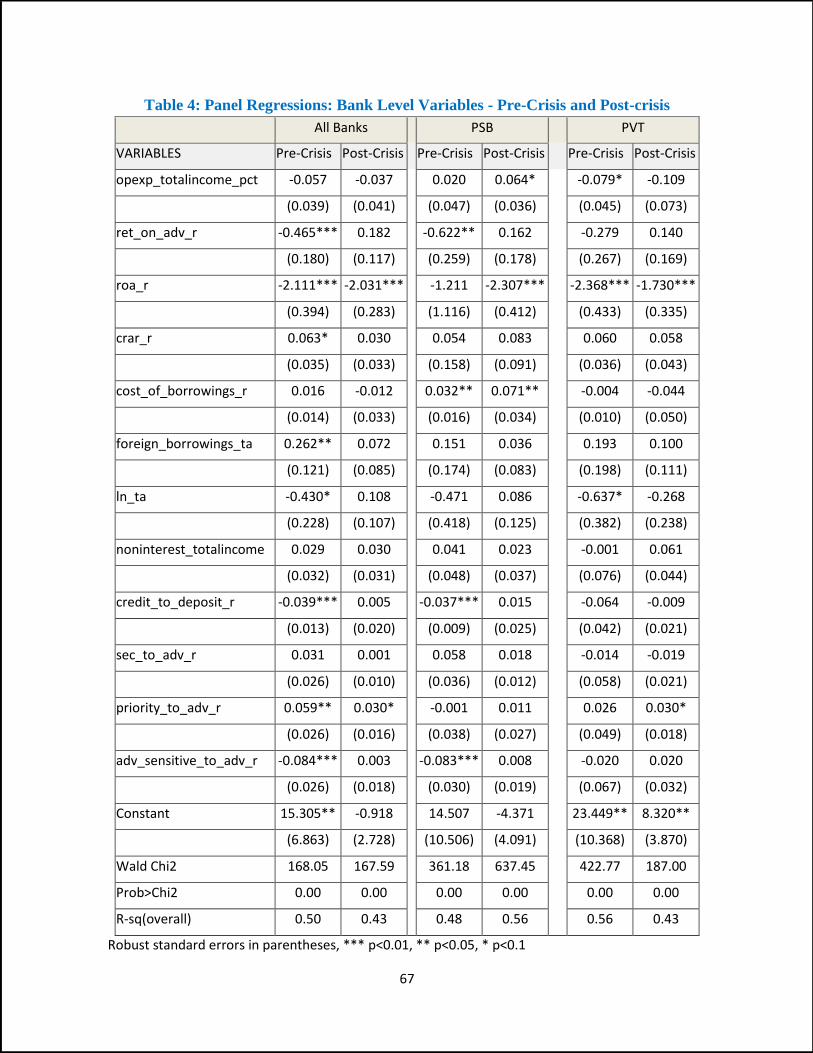
67
Table 4: Panel Regressions: Bank Level Variables - Pre-Crisis and Post-crisis
All Banks
PSB
PVT
VARIABLES Pre-Crisis Post-Crisis
Pre-Crisis Post-Crisis
Pre-Crisis Post-Crisis
opexp_totalincome_pct -0.057 -0.037
0.020 0.064*
-0.079* -0.109
(0.039) (0.041)
(0.047) (0.036)
(0.045) (0.073)
ret_on_adv_r -0.465*** 0.182
-0.622** 0.162
-0.279 0.140
(0.180) (0.117)
(0.259) (0.178)
(0.267) (0.169)
roa_r -2.111*** -2.031***
-1.211 -2.307***
-2.368*** -1.730***
(0.394) (0.283)
(1.116) (0.412)
(0.433) (0.335)
crar_r 0.063* 0.030
0.054 0.083
0.060 0.058
(0.035) (0.033)
(0.158) (0.091)
(0.036) (0.043)
cost_of_borrowings_r 0.016 -0.012
0.032** 0.071**
-0.004 -0.044
(0.014) (0.033)
(0.016) (0.034)
(0.010) (0.050)
foreign_borrowings_ta 0.262** 0.072
0.151 0.036
0.193 0.100
(0.121) (0.085)
(0.174) (0.083)
(0.198) (0.111)
ln_ta -0.430* 0.108
-0.471 0.086
-0.637* -0.268
(0.228) (0.107)
(0.418) (0.125)
(0.382) (0.238)
noninterest_totalincome 0.029 0.030
0.041 0.023
-0.001 0.061
(0.032) (0.031)
(0.048) (0.037)
(0.076) (0.044)
credit_to_deposit_r -0.039*** 0.005
-0.037*** 0.015
-0.064 -0.009
(0.013) (0.020)
(0.009) (0.025)
(0.042) (0.021)
sec_to_adv_r 0.031 0.001
0.058 0.018
-0.014 -0.019
(0.026) (0.010)
(0.036) (0.012)
(0.058) (0.021)
priority_to_adv_r 0.059** 0.030*
-0.001 0.011
0.026 0.030*
(0.026) (0.016)
(0.038) (0.027)
(0.049) (0.018)
adv_sensitive_to_adv_r -0.084*** 0.003
-0.083*** 0.008
-0.020 0.020
(0.026) (0.018)
(0.030) (0.019)
(0.067) (0.032)
Constant 15.305** -0.918
14.507 -4.371
23.449** 8.320**
(6.863) (2.728)
(10.506) (4.091)
(10.368) (3.870)
Wald Chi2 168.05 167.59
361.18 637.45
422.77 187.00
Prob>Chi2 0.00 0.00
0.00 0.00
0.00 0.00
R-sq(overall) 0.50 0.43
0.48 0.56
0.56 0.43
Robust standard errors in parentheses, *** p<0.01, ** p<0.05, * p<0.1

68
Coefficient on size variable namely, natural log of total assets is found to be negative in Table 1
for all banks for the entire period. This indicates that ‘too-big-to-fail’ hypothesis, which argues
for larger banks taking higher credit risks in their loan portfolio and therefore experiencing
higher NPAs, do not hold for Indian banks. A negative and significant influence of size on NPAs
indicates that the bigger banks have more diversified opportunities (Salas and Saurina 2002). So,
one would not expect a larger bank to land up in high NPAs. Breaking up the sample into private
and PSBs reveals that for size variable, it is the private sector banks which are driving the results.
Breaking up the sample period into pre and post crisis phases in Table 2 reflects the result holds
for pre-crisis period only for overall banks driven by private sector banks. Probably the
diversified opportunities reduced post-crisis even for larger private sector banks.
The coefficient on ‘non-interest income to total income ratio’ was not found to be significant for
all banks considered together or for the two types of banks considered separately or even when
the sample was decomposed into pre and post crisis parts. Such non-significant effect of non-
interest income on NPAs weakens the validation of diversification hypothesis for banks in India.
Credit to deposit ratio is found to have a negative and significant coefficient and the same holds
for both PSBs and Private sector banks though with higher levels of significance for PSBs. The
negative influence holds for pre-crisis period for PSBs as well as for overall banks. The result
does not hold for private sector banks either during post-crisis or during pre-crisis phase but the
sign however remains negative. This reflects that a high credit-deposit ratio for PSBs during pre-
crisis phase reflected a credit boom and an optimistic phase and therefore caused a fall in NPAs
during that period. The results do not hold for post-crisis phase because a high credit to deposit
ratio in the post-crisis phase was driven by slower growth of deposits compared to growth in
advances rather than an exceptional growth in loans.

69
Secured Advance as percentage of total advance was not found to have any influence on NPAs
when all banks were examined in the panel during the entire study period. However, it was found
have a strong increasing influence on NPAs for PSBs (at 1% level of significance). No such
effect could be evidenced for NPAs for private sector banks. This suggests that PSBs probably
resorted to higher collaterals to take care of high risks in loan portfolio or to take care of their
inadequate skills in loan appraisal12. It is also possible that PSBs asked for higher collaterals
when the loans were risky keeping in mind that the realization of the collaterals can be
challenging and costly if the borrower defaults, given the legislative environment. A pre and post
crisis breakdown of the period however makes the PSBs also lose its significance in both the
periods.
A higher percentage of loan to priority sector caused higher NPAs for Private sector banks
during post-crisis era but not so for PSBs. The private sector banks drove the results for all banks
put together for all periods as well as for decomposed periods. So the argument of directed
lending worsening loan portfolio of PSBs does not hold true.
Advances to sensitive sectors like capital market and real estate were found to decrease NPAs
rather than increase NPAs during pre-crisis period for PSBs. This holds true for all banks taken
together during the pre-crisis period as well as for the overall study period. This was probably
due to over-cautiousness brought in by RBI through its restrictive norms.
Summary: So overall we can conclude that the number of variables that explained the NPA
behavior of banks reduced when the study period from 2005 to 2010 was broken down into pre-
crisis period spanning 2005 to 2008 and post-crisis period covering 2010 to 2013. The factors
12 This is in line with Berger and Udell 1990, Leitner 2006
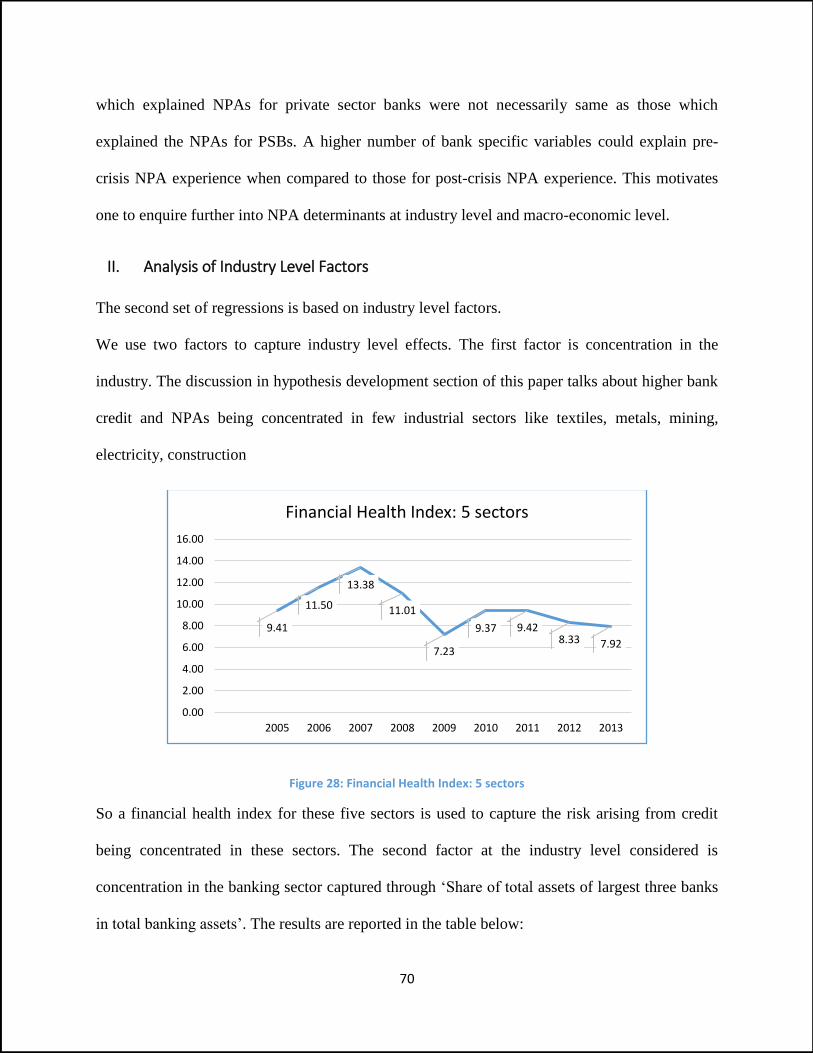
70
which explained NPAs for private sector banks were not necessarily same as those which
explained the NPAs for PSBs. A higher number of bank specific variables could explain pre-
crisis NPA experience when compared to those for post-crisis NPA experience. This motivates
one to enquire further into NPA determinants at industry level and macro-economic level.
II. Analysis of Industry Level Factors
The second set of regressions is based on industry level factors.
We use two factors to capture industry level effects. The first factor is concentration in the
industry. The discussion in hypothesis development section of this paper talks about higher bank
credit and NPAs being concentrated in few industrial sectors like textiles, metals, mining,
electricity, construction
Figure 28: Financial Health Index: 5 sectors
So a financial health index for these five sectors is used to capture the risk arising from credit
being concentrated in these sectors. The second factor at the industry level considered is
concentration in the banking sector captured through ‘Share of total assets of largest three banks
in total banking assets’. The results are reported in the table below:
9.41
11.50
13.38
11.01
7.23
9.37 9.428.33 7.92
0.00
2.00
4.00
6.00
8.00
10.00
12.00
14.00
16.00
2005 2006 2007 2008 2009 2010 2011 2012 2013
Financial Health Index: 5 sectors

71
Table 5: Panel Regressions - Industry level variables
(1) (2) (3)
VARIABLES All Banks-All years PSB-All years PVT-All years
concentration_largest3 0.404*** 0.226*** 0.612***
(0.077) (0.057) (0.148)
industry_health -0.254*** -0.224*** -0.290
(0.090) (0.041) (0.199)
Constant -8.590*** -3.903** -14.339***
(2.279) (1.760) (4.372)
Wald Chi2 27.83 43.13 18.26
Prob>Chi2 0.00 0.00 0.00
R-sq(overall) 0.08 0.06 0.13
Robust standard errors in parentheses
*** p<0.01, ** p<0.05, * p<0.1
The results show a negative and significant coefficient on industry health index. A lower
financial health index would mean the debt repaying ability of the companies in these industries
would be adversely affected, thereby leading to higher NPAs for banks. Thus the result confirms
the expectations that NPAs can be expected to go up with deterioration in industry health (of the
sectors where banks have high exposures).
A positive and significant coefficient on industry concentration variable explains that a higher
degree of concentration associated with lower competition would have reduced the vigilance of
banks about their asset quality and thereby letting scope for increase in risky loans and thus
higher NPAs. If these two industry variables are included with bank specific variables for the
panel regressions, the results remain the same with expected results found for these two
variables.
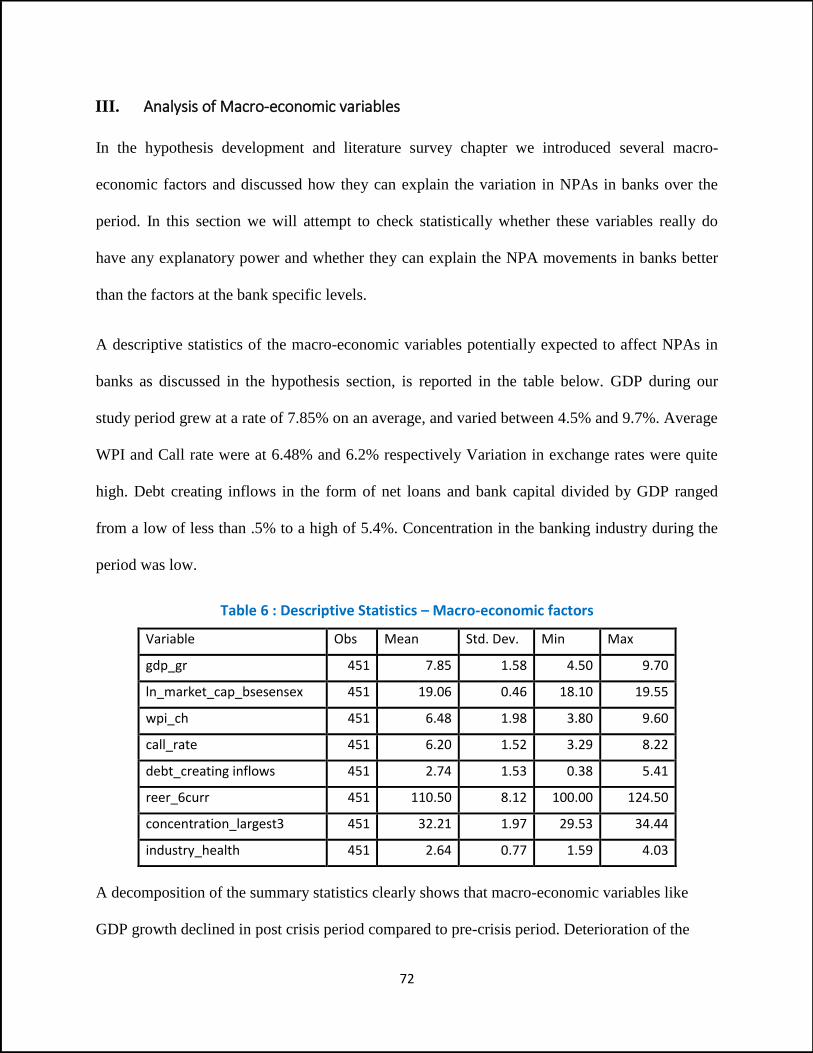
72
III. Analysis of Macro-economic variables
In the hypothesis development and literature survey chapter we introduced several macro-
economic factors and discussed how they can explain the variation in NPAs in banks over the
period. In this section we will attempt to check statistically whether these variables really do
have any explanatory power and whether they can explain the NPA movements in banks better
than the factors at the bank specific levels.
A descriptive statistics of the macro-economic variables potentially expected to affect NPAs in
banks as discussed in the hypothesis section, is reported in the table below. GDP during our
study period grew at a rate of 7.85% on an average, and varied between 4.5% and 9.7%. Average
WPI and Call rate were at 6.48% and 6.2% respectively Variation in exchange rates were quite
high. Debt creating inflows in the form of net loans and bank capital divided by GDP ranged
from a low of less than .5% to a high of 5.4%. Concentration in the banking industry during the
period was low.
Table 6 : Descriptive Statistics – Macro-economic factors
Variable Obs Mean Std. Dev. Min Max
gdp_gr 451 7.85 1.58 4.50 9.70
ln_market_cap_bsesensex 451 19.06 0.46 18.10 19.55
wpi_ch 451 6.48 1.98 3.80 9.60
call_rate 451 6.20 1.52 3.29 8.22
debt_creating inflows 451 2.74 1.53 0.38 5.41
reer_6curr 451 110.50 8.12 100.00 124.50
concentration_largest3 451 32.21 1.97 29.53 34.44
industry_health 451 2.64 0.77 1.59 4.03
A decomposition of the summary statistics clearly shows that macro-economic variables like
GDP growth declined in post crisis period compared to pre-crisis period. Deterioration of the
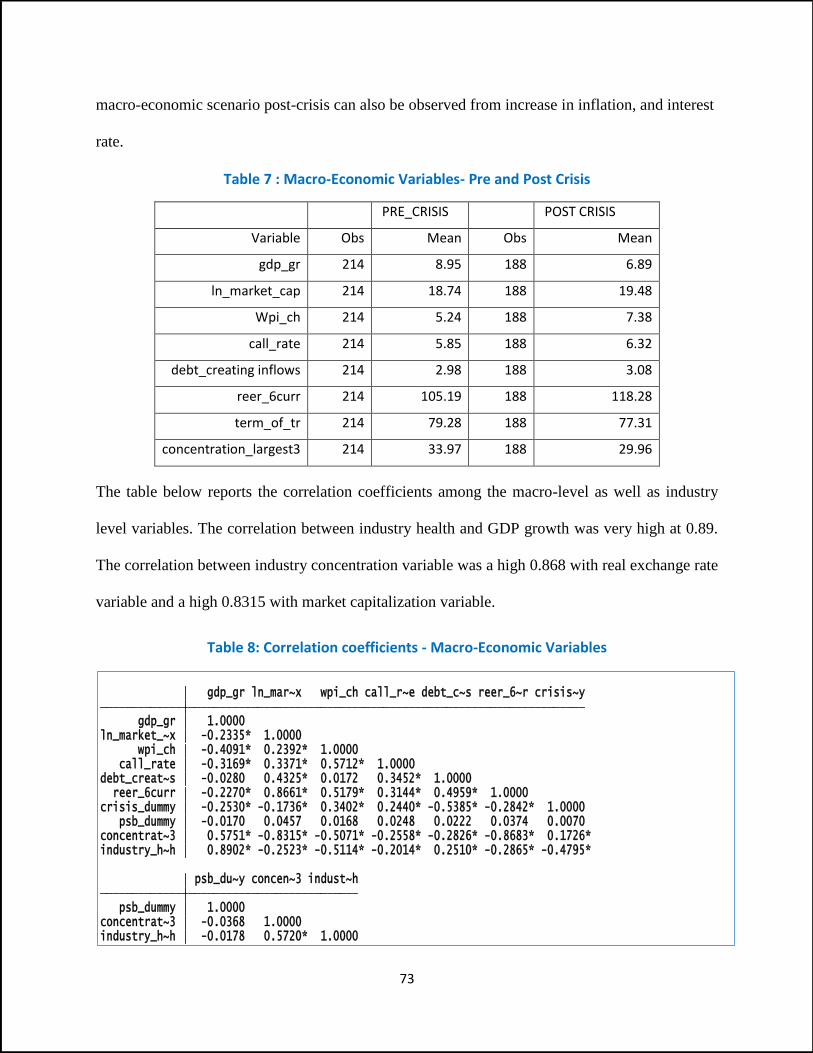
73
macro-economic scenario post-crisis can also be observed from increase in inflation, and interest
rate.
Table 7 : Macro-Economic Variables- Pre and Post Crisis
PRE_CRISIS
POST CRISIS
Variable Obs Mean Obs Mean
gdp_gr 214 8.95 188 6.89
ln_market_cap 214 18.74 188 19.48
Wpi_ch 214 5.24 188 7.38
call_rate 214 5.85 188 6.32
debt_creating inflows 214 2.98 188 3.08
reer_6curr 214 105.19 188 118.28
term_of_tr 214 79.28 188 77.31
concentration_largest3 214 33.97 188 29.96
The table below reports the correlation coefficients among the macro-level as well as industry
level variables. The correlation between industry health and GDP growth was very high at 0.89.
The correlation between industry concentration variable was a high 0.868 with real exchange rate
variable and a high 0.8315 with market capitalization variable.
Table 8: Correlation coefficients - Macro-Economic Variables
industry_h~h -0.0178 0.5720* 1.0000 concentrat~3 -0.0368 1.0000 psb_dummy 1.0000 psb_du~y concen~3 indust~h
industry_h~h 0.8902* -0.2523* -0.5114* -0.2014* 0.2510* -0.2865* -0.4795*concentrat~3 0.5751* -0.8315* -0.5071* -0.2558* -0.2826* -0.8683* 0.1726* psb_dummy -0.0170 0.0457 0.0168 0.0248 0.0222 0.0374 0.0070 crisis_dummy -0.2530* -0.1736* 0.3402* 0.2440* -0.5385* -0.2842* 1.0000 reer_6curr -0.2270* 0.8661* 0.5179* 0.3144* 0.4959* 1.0000 debt_creat~s -0.0280 0.4325* 0.0172 0.3452* 1.0000 call_rate -0.3169* 0.3371* 0.5712* 1.0000 wpi_ch -0.4091* 0.2392* 1.0000 ln_market_~x -0.2335* 1.0000 gdp_gr 1.0000 gdp_gr ln_mar~x wpi_ch call_r~e debt_c~s reer_6~r crisis~y
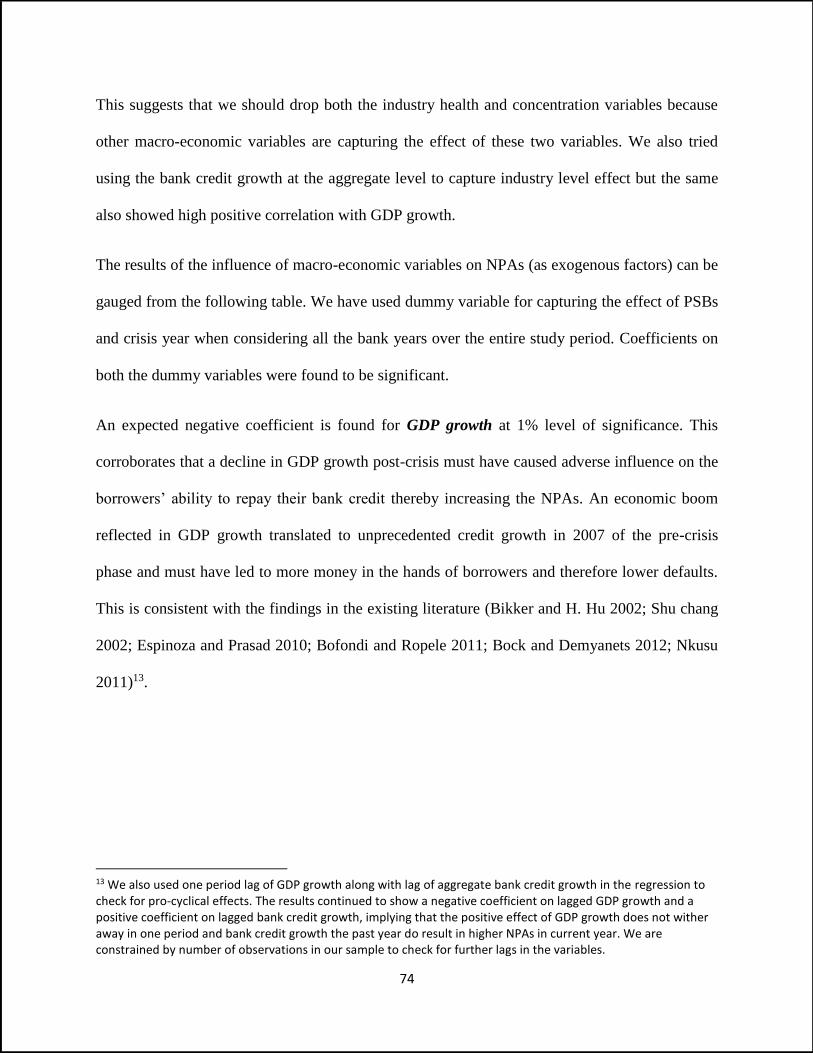
74
This suggests that we should drop both the industry health and concentration variables because
other macro-economic variables are capturing the effect of these two variables. We also tried
using the bank credit growth at the aggregate level to capture industry level effect but the same
also showed high positive correlation with GDP growth.
The results of the influence of macro-economic variables on NPAs (as exogenous factors) can be
gauged from the following table. We have used dummy variable for capturing the effect of PSBs
and crisis year when considering all the bank years over the entire study period. Coefficients on
both the dummy variables were found to be significant.
An expected negative coefficient is found for GDP growth at 1% level of significance. This
corroborates that a decline in GDP growth post-crisis must have caused adverse influence on the
borrowers’ ability to repay their bank credit thereby increasing the NPAs. An economic boom
reflected in GDP growth translated to unprecedented credit growth in 2007 of the pre-crisis
phase and must have led to more money in the hands of borrowers and therefore lower defaults.
This is consistent with the findings in the existing literature (Bikker and H. Hu 2002; Shu chang
2002; Espinoza and Prasad 2010; Bofondi and Ropele 2011; Bock and Demyanets 2012; Nkusu
2011)13.
13 We also used one period lag of GDP growth along with lag of aggregate bank credit growth in the regression to check for pro-cyclical effects. The results continued to show a negative coefficient on lagged GDP growth and a positive coefficient on lagged bank credit growth, implying that the positive effect of GDP growth does not wither away in one period and bank credit growth the past year do result in higher NPAs in current year. We are constrained by number of observations in our sample to check for further lags in the variables.
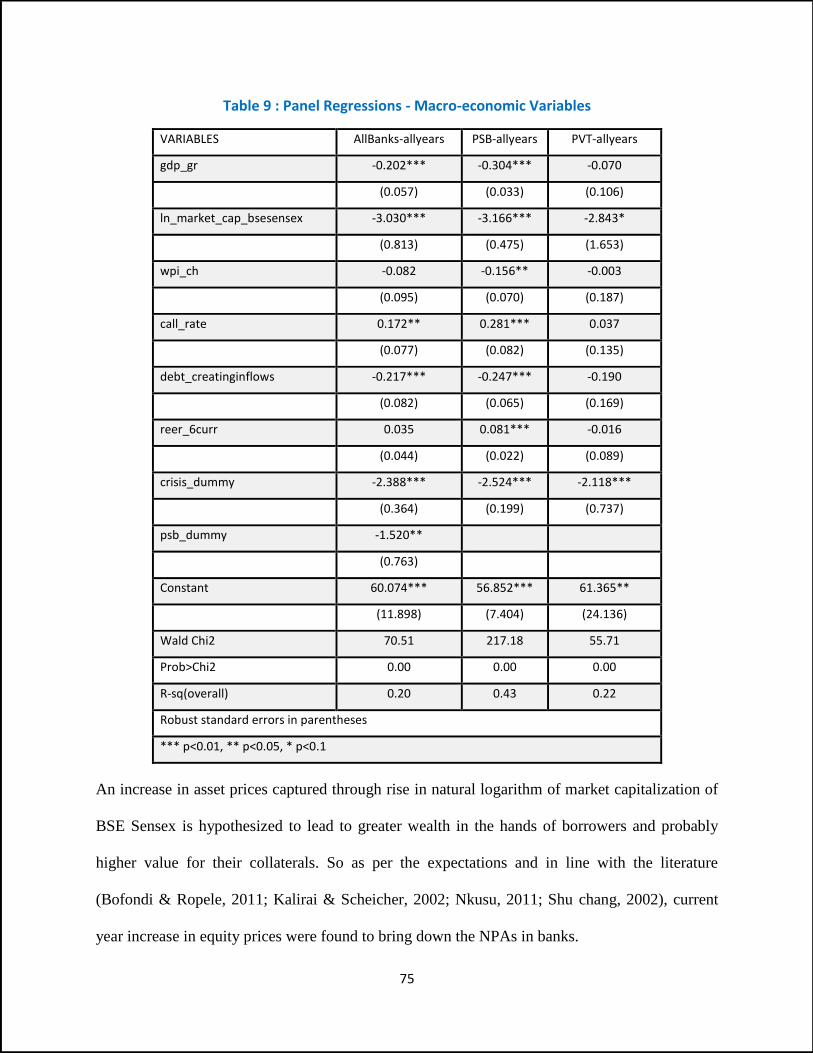
75
Table 9 : Panel Regressions - Macro-economic Variables
VARIABLES AllBanks-allyears PSB-allyears PVT-allyears
gdp_gr -0.202*** -0.304*** -0.070
(0.057) (0.033) (0.106)
ln_market_cap_bsesensex -3.030*** -3.166*** -2.843*
(0.813) (0.475) (1.653)
wpi_ch -0.082 -0.156** -0.003
(0.095) (0.070) (0.187)
call_rate 0.172** 0.281*** 0.037
(0.077) (0.082) (0.135)
debt_creatinginflows -0.217*** -0.247*** -0.190
(0.082) (0.065) (0.169)
reer_6curr 0.035 0.081*** -0.016
(0.044) (0.022) (0.089)
crisis_dummy -2.388*** -2.524*** -2.118***
(0.364) (0.199) (0.737)
psb_dummy -1.520**
(0.763)
Constant 60.074*** 56.852*** 61.365**
(11.898) (7.404) (24.136)
Wald Chi2 70.51 217.18 55.71
Prob>Chi2 0.00 0.00 0.00
R-sq(overall) 0.20 0.43 0.22
Robust standard errors in parentheses
*** p<0.01, ** p<0.05, * p<0.1
An increase in asset prices captured through rise in natural logarithm of market capitalization of
BSE Sensex is hypothesized to lead to greater wealth in the hands of borrowers and probably
higher value for their collaterals. So as per the expectations and in line with the literature
(Bofondi & Ropele, 2011; Kalirai & Scheicher, 2002; Nkusu, 2011; Shu chang, 2002), current
year increase in equity prices were found to bring down the NPAs in banks.
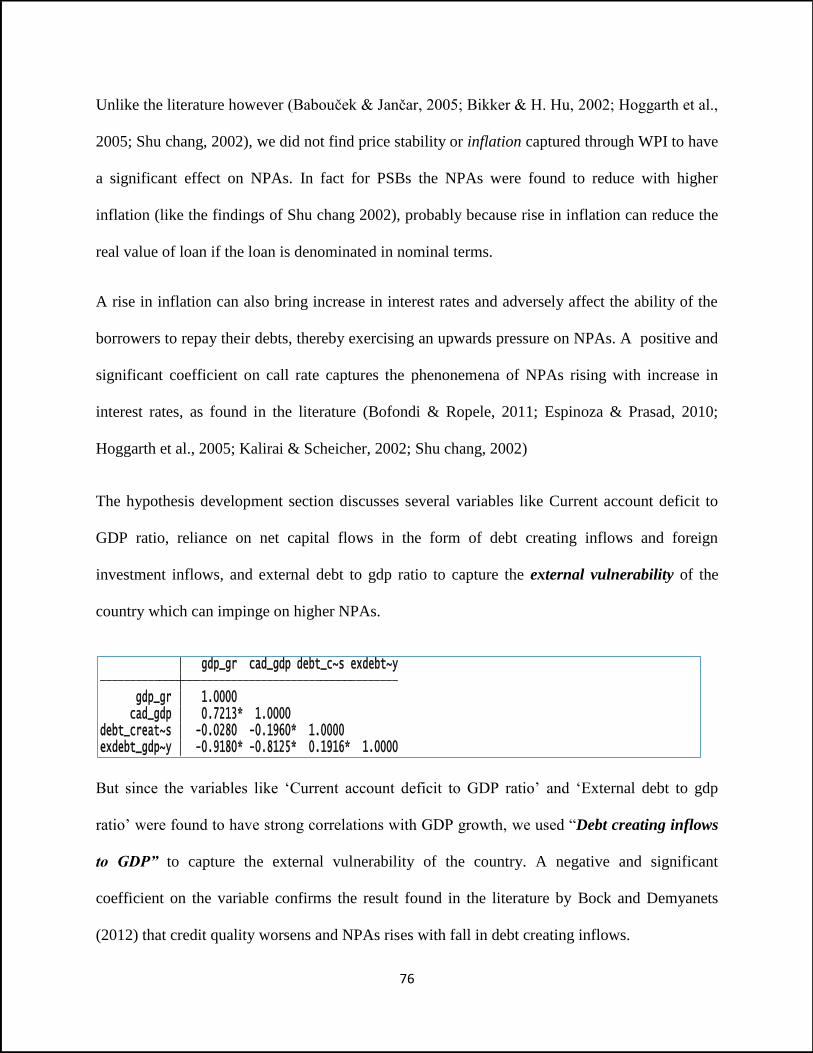
76
Unlike the literature however (Babouček & Jančar, 2005; Bikker & H. Hu, 2002; Hoggarth et al.,
2005; Shu chang, 2002), we did not find price stability or inflation captured through WPI to have
a significant effect on NPAs. In fact for PSBs the NPAs were found to reduce with higher
inflation (like the findings of Shu chang 2002), probably because rise in inflation can reduce the
real value of loan if the loan is denominated in nominal terms.
A rise in inflation can also bring increase in interest rates and adversely affect the ability of the
borrowers to repay their debts, thereby exercising an upwards pressure on NPAs. A positive and
significant coefficient on call rate captures the phenonemena of NPAs rising with increase in
interest rates, as found in the literature (Bofondi & Ropele, 2011; Espinoza & Prasad, 2010;
Hoggarth et al., 2005; Kalirai & Scheicher, 2002; Shu chang, 2002)
The hypothesis development section discusses several variables like Current account deficit to
GDP ratio, reliance on net capital flows in the form of debt creating inflows and foreign
investment inflows, and external debt to gdp ratio to capture the external vulnerability of the
country which can impinge on higher NPAs.
But since the variables like ‘Current account deficit to GDP ratio’ and ‘External debt to gdp
ratio’ were found to have strong correlations with GDP growth, we used “Debt creating inflows
to GDP” to capture the external vulnerability of the country. A negative and significant
coefficient on the variable confirms the result found in the literature by Bock and Demyanets
(2012) that credit quality worsens and NPAs rises with fall in debt creating inflows.
exdebt_gdp~y -0.9180* -0.8125* 0.1916* 1.0000 debt_creat~s -0.0280 -0.1960* 1.0000 cad_gdp 0.7213* 1.0000 gdp_gr 1.0000 gdp_gr cad_gdp debt_c~s exdebt~y
77
Depreciation of Exchange rate are expected to increase the debt servicing burden of foreign
borrowings and hence lead to higher NPAs. Real effective exchange rate (reer) based on 6
currencies14 index used to capture the exchange rate movements15 in this study was not found to
be significant for all banks taken together. For PSBs examined separately, a positive coefficient
found of reer was inconsistent with the findings in the literature. It might be due to the linkages
external vulnerability can have with the movements in exchange rates.
IV. Listed Versus Unlisted Banks
The number of unlisted banks is limited to two for PSBs and 4 for private sector banks in 2013,
the last year of our study. Panel regressions as well as Pooled regressions were run for all banks -
for all years, for pre-crisis years as well as for post-crisis years with all bank-specific variables,
one important macro-ecoomic variable namely GDP growth and one corporate govenrnace
variable namely FII, along with listed dummy. Listed dummy was not found significant in any of
the regresssions while results for all other variables were in line with the findings in earlier
regressions. This estabishes that listed banks did not show a different NPA behaviour when
compared to unlisted ones. So, RBI should probably reconsider its prescription of introducing
another layer of accountability in banks by encouraging the private sector banks to list early
(within 3 years of commencing business).
V. Conclusions
Bad management hypothesis holds for PSBs during both pre-crisis and post crisis period.
Skimping hypothesis however holds for private sector banks but only during pre-crisis period. At
overall bank level for the entire period of study, there is support for the argument that better the
14 6 currencies relates to China, Hong Kong, Euro, Japan, UK and US 15 Terms of trade was found to have strong correlations with call rate and hence was not used to capture the exchange rate effect.
78
quality of management, lesser would be the NPAs. So one can say that lax credit appraisals and
monitoring in PSBs due to poor management quality has led to their higher NPAs. The
favourable impact of ROA on loan quality was stronger post-crisis for PSBs whereas the same
was stronger pre-crisis for private sector banks. Capital adequacy ratio does not influence the
NPA levels of banks in India suggesting that the moral hazard hypothesis of going for higher
loans when capital is small is not validated in Indian context. A high cost of borrowings was
found to be able to explain higher NPAs in PSBs both during the post-crisis and pre-crisis phases
but not so for private sector banks in any of the phases. Larger size can be the reason for lower
NPAs for private sector banks in pre-crisis period but not so in post-crisis period or for PSBs in
any of the periods. A high Credit Deposit ratio can account for lower NPAs for PSBs during pre-
crisis period but not so for higher private sector banks. Secured advances leads to higher NPAs
only for PSBs examined for the entire study period. The argument of directed lending worsening
loan portfolio of PSBs does not hold true though it has worsened the loans of private sector
banks. Advances to sensitive sector have actually helped bring down the NPAs for PSBs during
pre-crisis period probably due to over-cautiousness brought in by RBI through its restrictions.
Industry level factors like industry health of the five key sectors where bank credit growth is
concentrated and factors like concentration in banking industry were found to explain the
variation in NPA. But these factors were found be highly correlated with macro-economic
variables and hence were eventually not considered in developing the combined model. Macro-
economic factors like GDP slowdown, fall in stock prices, increase in interest rates and fall in
debt creating inflows have played a very important role towards generating higher NPAs for
banks during the study period. Banks need to not only pay heed to the RBI advices of early
detection and care of stressed assets but also need to follow the advices given for recovery.
79
Chapter IV: Corporate governance of banks in India
I. Introduction
Corporate governance of banks in India came to limelight recently around August 2014 after a
series of accusations, CBI investigations and forensic audits (initiated by Ministry of Finance)
with respect to irregularities in loan sanctions in PSBs. Appointment of the top level officials at
some of the PSBs was also brought to question by Central Vigilance Commission (CVC) 16 in its
letter to the finance ministry (Business Standard, PTI Sep 2014).
Former deputy governor of RBI, Dr. KC Chakrabarty came up with a report in 2013 suggesting
that the asset quality deterioration was more pronounced in PSBs compared to private sector
banks. He also argued that the structural deficiencies in PSBs related to management and
governance might be responsible for the PSBs not being able to handle the asset quality impact
of economic slowdown in the post-crisis years.
Government ownership was perceived to be one of the factors which helped the banks in India to
be resilient to global financial crisis (GFC) in 2008-09. But abnormally high levels NPAs in
PSBs post-crisis combined with the need to meet Basel-III higher capital adequacy targets
created the need for capitalization from the government. But the Budget of 2013-14 clarified that
no such capitalization was feasible in the face of the high fiscal deficit that the country had to
already handle. This triggered a rage of debate as to whether dilution of government’s stake from
PSBs would motivate the banks compete better on one hand and on the other hand save the tax-
payers money being frittered away in bailing out the PSBs. The governor of RBI, Raghuram
Rajan responded to the situation by inviting strengthening of the governance standard for PSBs
16CVC is an autonomous body created to investigate into corruptions in public sector entities. http://www.business-standard.com/article/pti-stories/cvc-red-flags-board-level-appointments-in-psbs-114090200348_1.html
80
rather than diluting the stake of government in them. He constituted a committee to review
governance of the boards of banks in India which submitted its report in May 2014.
The analysis of NPAs in previous sections has revealed that PSBs bore a significantly higher
burden of NPAs in post-crisis period. One of the important determinants of NPAs in PSBs turned
out to be operational efficiencies. The result is in line with Dr. KC Chakrabarty’s intuition.
Taking forward from there, it becomes important to further investigate whether higher NPAs in
PSBs were emanating due to their weak governance in banks and whether corporate governance
played any role in constraining the NPAs in private sector banks. It is also important to have a
qualitative discussion of the difference in governance factors in both private sector banks and
PSBs so that a way forward can be chartered, which among other benefits can also help better
handling of NPAs.
II. A brief overview on Corporate Governance
Failure in corporate governance of banks has been one the factors debated to be responsible for
the global financial crisis of 2007-08. The questions were raised whether the boards of directors
in the banks were not competent enough to oversee the managers and understand the business, or
were they complicit, or too busy, or non-diligent. Banks with stronger corporate governance
experience were found to moderate the impact of crisis on their profitability and stock market
returns compared to the weaker ones (Kirkpatrick, 2009).
Definition: Corporate Governance has been defined as "the system by which companies are
directed and controlled" (Cadbury Committee, 1992, UK). It deals with the rights and
responsibilities of a company’s management, its board, shareholders and various stakeholders
81
(OECD). It seeks to minimize agency costs arising out of conflicts of interest among the
stakeholders.
The agency costs17 primarily arise out of separation of ownership and control in a company
giving rise to conflict of interest between the shareholders and managers (Jensen and Meckling
1976, Berle and Means 1932). Managers have more information about the financial performance
and position of the firm than shareholders. So there is a potential that the managers would act in
their own person interest, thereby expropriating shareholder wealth.
Corporate Governance mechanisms: There can be external or internal mechanisms to
minimize the agency costs. Internal governance mechanisms can include monitoring and
disciplining managerial actions by the board of directors, internal controls & internal auditors,
monitoring by large shareholders or institutional investors, and incentive contracts designed to
align the interests of the managers with that of the shareholders (like compensation linked to
profits or in the form of company shares, ESOPs etc). External governance mechanisms can
include the controls arising from product market and labour market18 competition, market for
corporate control19, debt covenants, regulations like investor protection laws (La Porta 1999) or
pressure from media.
Growing Interest in corporate governance: Corporate governance had come to limelight
during the East Asian crisis of 1997, again in the context of high profile accounting scandals like
Enrons and Worlcoms of 2000-2002 and very recently in 2009 in the context of Satyam scandal
in India.
17 Agency cost is the reduction in the firm value caused by delegation of decision making authority by the Principal (the shareholders or owners) to its agents (the managers). 18 Value of the managers in the labour market goes up if their firms perform well 19 Poor performing firms being taken over and the managers being fired post takeover - Mork et al 1988
82
At company level, strong corporate governance is believed to reduce information asymmetry
among the managers and the market and hence reduce the cost of capital of the company and
improve its performance.
At the country level, strong corporate governance of its companies build confidence in the
markets and attracts investments from abroad. Growing integration of financial and product
markets as well as investors’ growing concern for transparency and governance in companies
have made it imperative for the countries to adopt best practices in corporate governance.
Empirical Evidence from the literature has found superior corporate governance captured
through the governance indices to be positively associated with higher stock market returns
(Bebchuk, Cohen, and Ferrell 2009). Gompers, Ishii, and Metrick 2003 showed governance
index based trading strategy could be used to generate abnormal returns during 1990-99.
However recent studies (Bebchuk 2011) have found the valuation effect of corporate governance
to have disappeared over time during 2000-2008.
Evolving CG Regulations:
Cadbury committee report (1992)20 initiated by Financial Reporting Council of London Stock
Exchange to examine British corporate governance system, was one of the pioneering and
popular recommendations on corporate governance. A number of regulatory reforms were
brought in like Sarbanes-Oxley Act, 2002 after the high profile scandals in US. OECD Principles
of Corporate Governance (1999, 2004) and King Report (1994, 2002, and 2009) in South Africa
were some of the other influential and popular corporate governance guidelines. The recent
financial crisis of 2007-08 showed the need for another set of reforms. Dodd Frank Act was
enacted in US (to bring greater transparency to board, top management positions and
20 The Committee on the Financial Aspects of Corporate Governance
83
compensation). The steering group of OECD found weaknesses in some areas of corporate
governance to have played an important role in the development of the global financial crisis of
2008. This urged OECD Corporate Governance Committee to review and come up with a
revised text for OECD Principles of Corporate Governance (November 2014).
Variation across Countries: The corporate governance mechanisms and challenges vary across
the countries due to differences in their history and legal framework.
In countries Anglo-American like US or UK, the governance problem lies in the conflict of
interests between the managers and owners. This is called “outsider model”. The aim of
governance mechanism in this model would be to minimize the agency costs associated with the
managers acting opportunistically against the interest of the shareholders.
Corporate Governance in India is however different from that model and is characterized by
concentration of ownership and control by promoter family. This is called “insider model” where
the promoters play a significant role in governance. The governance problem lies primarily in the
expropriation of minority shareholders’ interest by controlling shareholders. This becomes even
more important in the context of pyramidal structures of crossholdings which provides scope for
tunneling.
Corporate governance guidelines in India evolved through the following milestones: Voluntary
Adoption of CII Code (1997), KMB Recommendations (1999), Naresh Chandra Committee
recommendations (2002), Narayan Murthy committee recommendations (2003), Clause 49 of the
listing agreement of SEBI with several revisions, and Companies Act 2013. In India investor
protection is perceived to be weak on implementation.
Balasubramanian et al 2010 examined the publicly listed firms in India based on a 2006 survey
and found a positive relationship between governance index and firm market value. Corporate
84
Governance India has found a new momentum after it saw an unprecedented exodus of more
than 500 independent directors from corporate boards in 2009 following Satyam scandal
(Khanna and Mathew 2010). This has raised questions and concerns about the independence of
directors in corporate boards of India.
III. Corporate Governance in banks
Banks are systemically important for stability and growth of any economy. Banks are also source
of external governance mechanism for firms. So, corporate governance in banks assumes special
importance and requires special attention.
Why is corporate governance in banks different? Governance of banks is more challenging
and critical than that of non-financial firms due to some factors which exacerbate the governance
dilemmas and hinder the corporate governance mechanisms.
1. Multitude of stakeholders: Governance in banks involves taking care of the interests of
other important categories of stakeholder groups namely the Deposit holders and the
Regulators. Deposit holders are the predominant fund providers to banks. The regulator’s
stake lies in bailing out the bank in case of its failure since the regulator provides deposit
insurance to banks.
2. More Regulations (Levine 2004): Banking industry is subject to more regulations than any
other industry due to its importance for the economy, the systemic risks inherent in it and
associated concerns for its safety and soundness. Regulators can prevent market failure, can
exercise their judgment to fill in the gaps in laws and contracts and can also take action to
prevent bad behavior of the regulated. Banks have to abide by prudential regulations
particularly related to capital adequacy and asset quality. But regulations also relate to
restricting outsiders from acquiring significant ownership in banks without regulatory
85
approval. This can have an unintended consequence of protecting family controlled banks
from takeover. Thus, the regulation can have the unintended consequence of limiting the
disciplinary power of market forces.
3. High Leverage: Banks are inherently highly leveraged due to their deposit-accepting and
credit-creation nature of business. Equity holders would rarely provide funds for more than
10% of total assets. The deposit-holders are the predominant fund providers to bank and
they have an inherent tendency to free-ride on monitoring the banks owing to their small,
dispersed and unsophisticated nature. This makes banks enjoy weak monitoring by their
fund providers.
4. Greater Opaqueness and Complexity (Levine 2004): The information asymmetry problem
is more severe in banks than in other non-financial firms due to complexity of banking
operations. In non-financial firms the information asymmetry and the agency costs revolve
primarily around the manager and the owner. But in case of banks, there are two additional
levels of information asymmetry. One between the bank and the depositor holders since the
depositor holders are less informed than the bank about how their funds are used by their
bank, the extent of risks assumed by the bank in the loans it has extended, its capital
strength or the probability of its bankruptcy. Another additional level of information
asymmetry in banks is between the bank and its borrowers since borrowers have more
information than the bank about their own ability or willingness to repay loans (Huang,
Chang et al. (2006)).
The presence of higher levels of information asymmetry in banks is affirmed by the
evidence of high abnormal volatility of bank stocks compared to other stocks (Crouzille,
Lepetit et al. 2004). Moreover, the amount of disagreement on the credit rating of banks is
86
higher when compared to that of non-banking entities. So, the agency problem in banks is
more complex.
Opacity allows banks to change the risk composition of their assets more quickly than non-
financial firms and hide problems in their asset portfolio. This makes it very difficult for the
external mechanisms like product and/or labour market or market for corporate control to
exercise control on managers.
5. Sensitivity to public confidence and systemic risks: Banks are custodians of public
deposits. This makes public confidence play a crucial role in the stability of the banking
system. Any adverse news related to the financial performance or position of banks might
lead to sudden loss of public confidence. There exist maturity-mismatches between their
assets and liabilities. The very nature of their intermediary business makes them hold short
term liabilities in the form of deposits and long term assets in the form of illiquid loans.
Therefore, any sudden loss of public confidence might expose them to liquidity crunch if all
depositors start claiming their deposits simultaneously. The liquidity crunch in turn might
lead to bank failures due to the interconnectedness of banks, thereby causing systemic risks,
destabilizing the entire financial system and the economy, and spreading the contagion
worldwide. The speed and the severity of the phenomenon are incomparable with any other
industry.
6. Deposit Insurance and excessive risk taking: Banks are covered by deposit insurance and
government’s implicit safety nets to maintain public confidence in the banking system. The
deposit insurance premium most of the time is flat, risk insensitive and subsidized. This
further weakens the depositors’ monitoring and oversight over the bank management. Lower
oversight encourages excessive risk taking tendency by banks more so because high returns
87
related to high risks can be bagged in by the shareholders while high losses if any can be
passed on to the government and hence the taxpayers (put option). Irrational exuberance of
credit or use of risky derivatives can be some of the examples of excessive risk taking.
Summary: So we can say that corporate governance assumes special importance for banks due
to the prudential regulations they have to abide by, the deposit insurance coverage they enjoy,
and the multitude of stakeholders involved with them. Further, corporate governance of banks
becomes very critical due to their high levels of leverage, higher levels of information asymmetry
in their books, their sensitivity to public confidence and the potential of contagion in the event of
a bank failure due to their interconnectedness.
Corporate Governance norms for banks: Basel Committee on Banking Supervision came up
with “Enhancing corporate governance for banking organizations” in 1999, 2006 and 2010. It
provides guidance to supervisors and banks to promote and adopt sound corporate governance. It
reflects concerns of financial stability related to governance issues in banks and believes that a
sound corporate governance is essential for a sound financial system and a nation’s economic
development.
Corporate Governance Guidelines for banks in India: Advisory group on Corporate
Governance for RBI Standing committee on International Financial Standards and Codes
(headed by Dr. Patil) came up with several recommendations in 2001. This was followed by
further suggestions in 2001 to improve the supervisory role of Boards from the consultative
committee formed under Mr Ganguly. Later in 2003, ‘Advisory group on banking supervision’
(under Mr. Verma) also came up with important recommendations. A comprehensive guideline
was issued in 2005 for ownership and governance in private sector banks. GOI was advised to
adopt the same for PSBs after taking into consideration specific regulations that apply for PSBs.
88
Latest is the set of important and dynamic recommendations of Nayak Committee in “Report of
the committee to review governance of boards of banks in India” submitted in May 2014. These
recommendations guide RBI to bring in corporate governance norms for banks in India.
IV. Corporate Governance in banks in India
D. Subbarao, Governor of RBI, started addressing the FICCI–IBA conference post-crisis in 2011
by saying, “I believe more effective and enlightened corporate governance of Indian banks can be
a vital avenue for improving banking productivity.” He said that in emerging economies there is
an additional dimension to corporate governance of banks because tension can arise out of the
factors like banks carrying additional responsibility of driving the government’s social agenda
and are not yet fully clear about the boundaries between the regulators and the regulated.
Corporate governance of banks in India thus appears even more special due to dominance of
public sector banks in the banking industry, the use of banks in carrying out government’s social
agenda and potential complexities in governance associated with the government ownership.
Dominance of PSBs: In India, Public Sector Banks (PSBs) dominate the banking industry
comprising 72.7% of total assets of the banking sector as at 31st March 2013 whereas private
sector banks and foreign banks constitute only 20.8% and 6.5% respectively. The share of PSBs
total assets of the banking sector has however come down from 74.4% and the share of Private
sector banks has gone up from 18.8% in 2005. The banks in India operate through the network of
several branches spread across the country. PSBs also dominate in terms constituting 83% of the
81,249 bank branches of SCBs operating in India (Subbarao 2013).
As at the end of financial year 2013, out of 21 PSBs (excluding the SBI associates), government
stake was more than 81% for 3 banks and more than 71% (and up to 81%) for 4 banks and more
than 61% (and up to 71%) for 5 banks (T&P, RBI 2013). So effectively more than half of the
89
PSBs had more than 61% government stake in it. The central bank of the country, Reserve Bank
of India (RBI) which is fully owned by the government of India held a significant equity stake in
State Bank of India (62.31% as on 31st March 2013). SBI in turn has its 5 associates.
Government ownership: From economic viewpoint, government ownership in the banking
sector prevents market failure and provides additional safety net assuring financial stability to the
banking system of the country. From national viewpoint, government owned banks can be used to
fund projects which are necessary for economic or social development of the country in which
private banks might not be interested due to lower profitability.
However there is a general perception about inefficiencies in PSBs caused by government
ownership. A number of empirical studies have been undertaken to judge the same. Private
sector banks were found to respond more positively to economic liberalization and deregulations
than PSBs during the early stages of reforms (Bhattacharyya et al. 1997). During 1995- 96,
private sector and foreign banks were found to perform better than PSBs but the performance
converged thereafter (Bhaumik and Dimova, 2004). During 2000 to 2006 however PSBs were
found to be more efficient than private sector banks (Tabak and Tecles 2010). According to Das
and Kumbhakar 2012, the efficiency of banks were found to have improved significantly from
1996 to 2005 and that PSBs gained more in efficiency than private sector banks. According to
Subbarao 2011, there is no significant relationship between efficiency and ownership. RBI’s
Report on Currency and Finance (RCF) 2006-08 found PSBs to be better than private sector
banks on some counts while worse on others.
One should keep in mind that government ownership brings with it external constraints which
put them at competitive dis-advantage vis-à-vis private sector banks (Nayak Committee 2014).
PSBs are under dual control from RBI and Ministry of finance (which can be even through
90
undocumented suasion). All of their directors other than shareholders directors are government
nominated. PSBs cannot attract managerial talent & skill due to significant compensation
constraints21. The managers do not have the compensation incentives but they face a huge threat
of external vigilance from Central Vigilance Committee22 and CBI as well as Right to
Information Act. Moreover, the chairman and executive directors have very short tenure. The
structure is ideal for short-term motivations.
The associated debate is on the question whether government equity in public sector banks
should be diluted and brought down below 51% (PTI 1998 ). Narasimhan Committee as well as
Tarapore Committee advised the government stake in PSBs to be diluted down to 33% so as to
lend functional autonomy and operational flexibility to PSBs. Nayak committee 2014 has also
advised to bring the same down to below 50%.
In India, the government ownership of banks is considered to have played an important role in
maintaining the financial stability of the country during the heights of global financial crisis in
2009. The reason might be confidence of the investors and depositors bestow on PSBs due to the
government safety net, in spite of their deteriorating financials (Mohan 2006).
However, in post-crisis years of 2012 and 2013 the PSBs have been experiencing a very heavy
burden of NPAs compared to private sector banks, bringing back the question of inefficiency in
PSBs. Moreover, RBI has come up with an estimate that the banks in India would need an
additional capital of Rs 4.95 trillion for full implementation Basel-III capital adequacy norms by
the end of March 2018. The estimate further suggests that if the government wants to maintain
its existing stake in PSBs, it would need to infuse Rs 900 billion (FSR, RBI June 2014).
Government has already infused capital of Rs477 billion during 2008 to 2012 and Rs1.25 billion
21 As per the Nayak Committee report, the average CEO monetary compensation for new private sector banks was Rs3.21 cr compared to Rs18.66 lakhs for PSBs in 2012-13 22 Nayak committee reports a significant drop in bank credit of PSBs before and after CVC action
91
in 2013. But the government is also facing fiscal challenges in terms of gross fiscal deficit
(above Rs 2000 bn in 2013) and a high current account deficit (of 4.8% of GDP in 2013). So,
government has a difficult choice to make between further recapitalization of PSBs versus
dilution of its stake in PSBs. The concern was echoed in one of the recommendations of Nayak
Committee 2014 as follows:
“…If the governance of these banks23 continues as at present, this will impede fiscal consolidation,
affect fiscal stability and eventually impinge on the Government's solvency. Consequently, the
Government has two options: either to privatize these banks and allow their future solvency to be
subject to market competition, including through mergers; or to design a radically new governance
structure for these banks which would better ensure their ability to compete successfully, in order
that repeated claims for capital support from the Government, unconnected with market returns,
are avoided.”
Banks could raise funds from capital markets after the financial sector reforms. This led to
dilution of government ownership to a considerable extent. This can be gauged from the fact that
in 1996-97, 15 out of 19 PSBs were fully government but the number reduced to 3 at the end of
2005-06 and 2 at the end of 2012-13. But in spite of the dilution of ownership stake of
government in the PSBs, government’s role still remains dominant particularly with Banking
Regulations Act 1949 restricting the voting rights of an individual shareholder in a bank to 10%
irrespective of the size of his holding.
In addition to ownership control, the management oversight of PSBs also effectively vests in
government through its nominee directors and RBI directors in the boards of the banks.
Moreover, the regulation and supervision of the banks in India is also in the hands of
23 PSBs were referred
92
government owned RBI. Government’s role as sovereign, as owner, as manager and as
regulator complicates the conflicts of interests between the three roles – owner’s profitability
motive tempered by sovereign’s accountability to public through political institutions towards
economic development, regulator’s concern for stability and soundness of the banks, and
manager’s susceptibility to political influence.
Sovereign backing adds to the free riding tendencies of the depositors and lenders to monitor bank
performance. So, government ownership can aggravate the moral hazard tendencies of banks to
go for high risk taking arising from availability of deposit insurance at risk-insensitive premium
and high leverage in banks. Government backing and expectation of government bailouts at
difficult times, might create perverse incentives for borrowers as well as bank managers. The
borrowers might use the loans obtained from banks recklessly. Managers might make use of the
bank funds to serve their own interest at the cost of the interests of the deposit-holders and/or
owners.
In PSBs, though the government as an owner might have an incentive to go for excessive risks,
but as a regulator and a sovereign it needs to shoulder the monitoring responsibility on behalf of
the oblivious and unsophisticated depositors. The role of government as regulator has been
criticized on the ground that the public regulators may not have the necessary incentives due to
absence of personal stakes, might lack skills necessary to step up with market innovations and on
the other hand may be influenced by political interference. (La Porta et al. 2002) found
government ownership to be responsible for lower economic development in emerging
economies. Government can also misuse its ownership in banks to meet political goals like
increasing lending during election years (Dinc 2005), funding projects & creating branch
93
network which are politically desirable. It has often been considered as deterrent to
professionalism and entrepreneurial behavior in banks.
On one hand, as a regulator the government needs to implement prudential norms at par with
international standards and on the other hand, as manager of PSBs the government needs to see
that the banks are able to meet these norms. All these have complicated the role of government in
banks in India. Undoubtedly, it provides an interesting context for the study.
V. Corporate governance factors for banks in India
Having discussed the peculiar features of the banking industry in India, we are not in a position
to discuss the corporate governance factors which can play a role in explaining the NPAs in
banks in India. We would consider two broad factors namely, Ownership Variables and Board
Variables. Let us discuss them one by one:
A) Ownership Variables: The prior discussion shows that the ownership of bank can play an
important role in its performance. We would use two types of ownership variables:
Ownership by Foreign institutional investors (FII) and Ownership concentration.
i. Foreign institutional investors: Institutional investors have better access to information and
have better monitoring capabilities due to the huge amount of resources they control. The
trading by these investors therefore leads to more informative prices. They are considered to be
sophisticated investors with expertise as well as interest to provide effective monitoring. They
are expected to perform a special role particularly in Indian context where promoter-holding is
a norm, in making sure that the board of directors can perform their monitoring role
independently without being affected by promoters’ influence. Foreign ownership particularly
FIIs has been found in the literature to have a positive impact on performance (Khanna and
94
Palepu 1999, Sarkar and Sarkar 2002, Douma et al 2006). So, we would expect a higher stake
held by FIIs to be associated with lower levels of NPAs
ii. Ownership Concentration:
Ownership is said to be concentrated when a few shareholders hold a significant percentage of
the shares of a firm. These owners are also called controlling shareholders or block holders.
When shareholders are small and dispersed, there is tendency to free-ride on monitoring. But
block-holders, by virtue of their high stakes in the firm have strong incentives to monitor and
control the managerial behavior. So, when the ownership concentration in a bank is high, one
can expect tighter monitoring and control of the management by the concentrated owners,
which in turn can lead to a superior firm performance (Berle and Means 1933, Shleifer and
Vishny 1986). Therefore, when it comes to loan appraisals and monitoring or even recovery of
bad loans, the management can be expected to exercise more prudence. Therefore a high
ownership concentration can be expected be associated with lower NPAs.
It is however also argued that in case of regulated industries like banks, the benefits of
ownership control are reduced because regulations already play a role in disciplining the
managerial behavior (Demsetz and Lehen 1985, Elyasiani and Jia 2008).
Moreover there is another stream of literature which argues that concentrated ownership can
lead to expropriation of the interest of the minority shareholders (Burkart et al. 1997, Gomes
and Novaes 2005).
Empirical evidence is also mixed. While Iannotta et al 2007 find support for ownership
concentration leading to lower NPAs, Laeven and Levine 2009 find support for higher risk
taking to be associated with large owners in banks. Shehzad et al 2010 examined the
relationship using different levels of concentration in ownership and found that when
95
ownership level was as high as 50%, it had a negative effect on NPL ratio and that the impact
was actually positive for 10% level.
Going by the literature, we define block holders as large shareholders who hold at least 5%
stake in the capital of the company24. We use ‘Average Block holding’ calculated as
(Ownership percentage of owners with ownership > 5%) / (Number of owners with ownership
more than 5%) to capture ownership concentration. One can expect a negative coefficient on
the same.
B) Effectiveness of the Board of Directors: Board of directors are representatives of the
shareholders and are considered to be gatekeepers of good corporate governance. So they have
the ultimate authority for directing and controlling the management of a company. The Board of
directors in banks has higher responsibilities compared to the boards of non-financial firms
because of the opaque nature of the balance sheet of banks and difficulty of outsiders in valuing
it, and because the external governance mechanisms are not likely to be effective for banks.
There are various board variables used in the literature to capture quality of governance. We
would use the following Board variables:
i. Size: There are both positive and negative arguments for influence of board size (i.e. the
number of directors on board) on firm performance. Those in favor of bigger size, argue that
larger board can bring in broader perspectives while those in favor of smaller size, argue that
larger boards can lead to free-riders problem. Empirical evidence is mixed with recent studies
like (Andres & Vallelado, 2008) showing that bank performance improves up to an optimal
board size of 19, beyond which the positive effect diminishes. Therefore we would like to check
whether higher board size expressed as number of directors on board, brings reduction in NPA
levels for the banks in India.
24 This is as per the definition provided in Securities Exchange Act, 1934 of US
96
ii. Attendance: Higher percentage of board members attending the board meetings can be
considered to be a sign of effective governance. We measure attendance as the number of
meetings attended by the directors out of the total number of meetings held during the year. A
higher attendance can be expected to have a decreasing effect on NPAs.
iii. Independence: In India, the Board structure is unitary. So, it is important that a significant
percentage of the board of directors are independent so that they are not under pressure from
the promoters of the company in monitoring and disciplining the managerial actions. Corporate
governance norms also emphasize on majority (at least 50%) of the directors on the being
independent. This suggests that greater the proportion of independent directors on board, better
would be the governance of the bank and hence better would be the bank performance. So we
expect percentage of independent directors on the board of the banks to have a negative relation
with NPAs. The literature has however not found independence of the board of directors to
have any influence on bank performance.
iv. Chairman and CEO duality: Good governance expects that the roles of Chairman and CEO
should be separated to avoid any conflict of interests. We use a dummy variable which takes
the value 1 if chairman of the board is also its managing director (or CEO) to capture the
duality and expect the same to cause an increase in NPAs.
v. Analysis of Corporate governance factors
The table below reports the descriptive statistics for the corporate governance variables at the
overall banks’ level and a succeeding table shows the mean of the variables disaggregated at
bank group levels. The number of directors on the boards of PSBs and Private sector banks put
together is 13.5 on an average. The number is higher around 14.65 in PSBs compared to 12.12
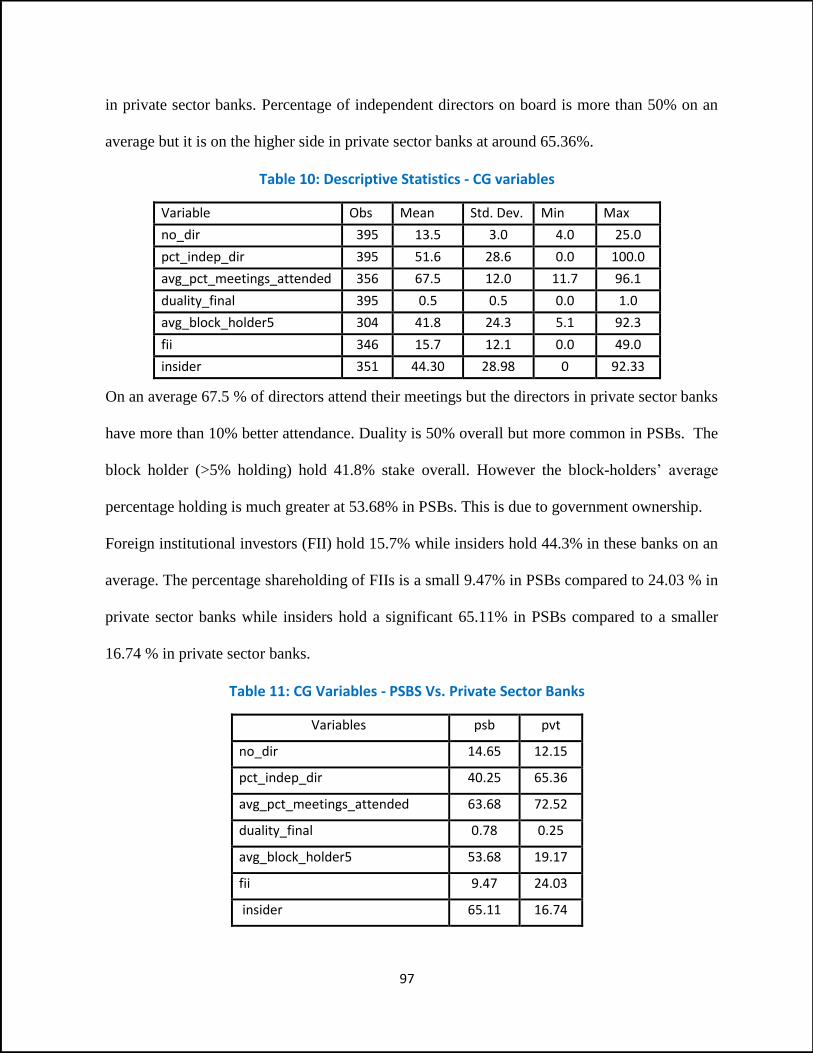
97
in private sector banks. Percentage of independent directors on board is more than 50% on an
average but it is on the higher side in private sector banks at around 65.36%.
Table 10: Descriptive Statistics - CG variables
Variable Obs Mean Std. Dev. Min Max
no_dir 395 13.5 3.0 4.0 25.0
pct_indep_dir 395 51.6 28.6 0.0 100.0
avg_pct_meetings_attended 356 67.5 12.0 11.7 96.1
duality_final 395 0.5 0.5 0.0 1.0
avg_block_holder5 304 41.8 24.3 5.1 92.3
fii 346 15.7 12.1 0.0 49.0
insider 351 44.30 28.98 0 92.33
On an average 67.5 % of directors attend their meetings but the directors in private sector banks
have more than 10% better attendance. Duality is 50% overall but more common in PSBs. The
block holder (>5% holding) hold 41.8% stake overall. However the block-holders’ average
percentage holding is much greater at 53.68% in PSBs. This is due to government ownership.
Foreign institutional investors (FII) hold 15.7% while insiders hold 44.3% in these banks on an
average. The percentage shareholding of FIIs is a small 9.47% in PSBs compared to 24.03 % in
private sector banks while insiders hold a significant 65.11% in PSBs compared to a smaller
16.74 % in private sector banks.
Table 11: CG Variables - PSBS Vs. Private Sector Banks
Variables psb pvt
no_dir 14.65 12.15
pct_indep_dir 40.25 65.36
avg_pct_meetings_attended 63.68 72.52
duality_final 0.78 0.25
avg_block_holder5 53.68 19.17
fii 9.47 24.03
insider 65.11 16.74
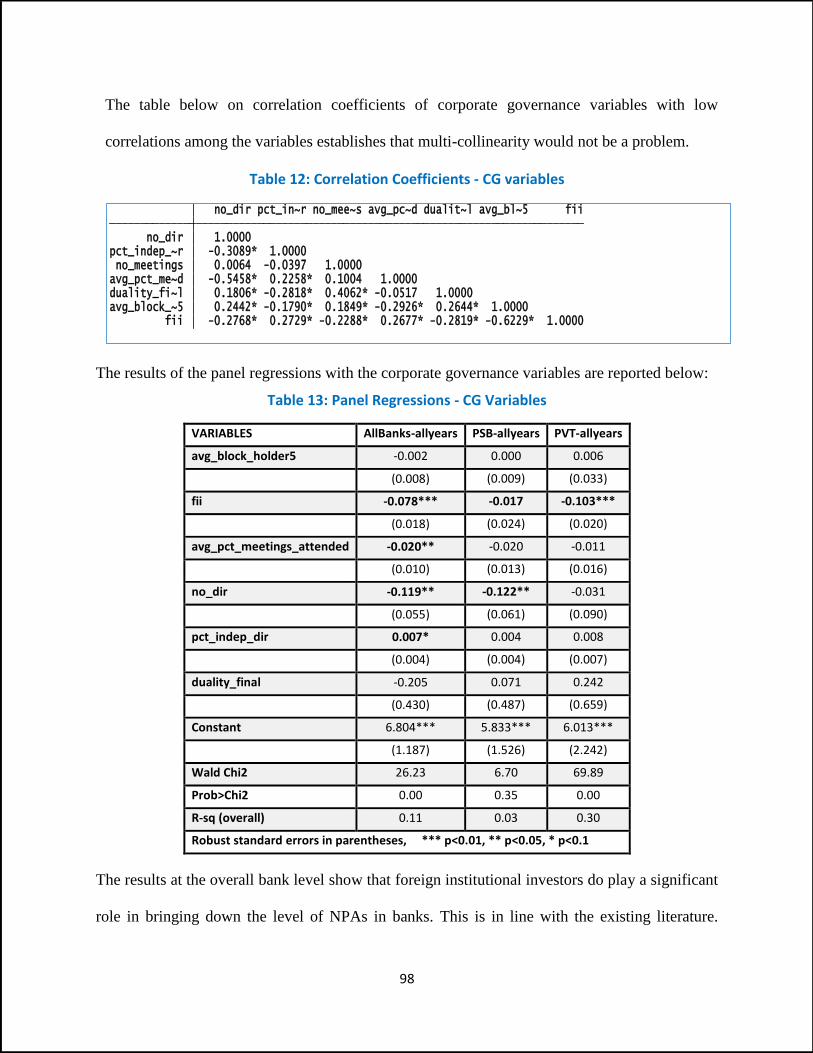
98
The table below on correlation coefficients of corporate governance variables with low
correlations among the variables establishes that multi-collinearity would not be a problem.
Table 12: Correlation Coefficients - CG variables
The results of the panel regressions with the corporate governance variables are reported below:
Table 13: Panel Regressions - CG Variables
VARIABLES AllBanks-allyears PSB-allyears PVT-allyears
avg_block_holder5 -0.002 0.000 0.006
(0.008) (0.009) (0.033)
fii -0.078*** -0.017 -0.103***
(0.018) (0.024) (0.020)
avg_pct_meetings_attended -0.020** -0.020 -0.011
(0.010) (0.013) (0.016)
no_dir -0.119** -0.122** -0.031
(0.055) (0.061) (0.090)
pct_indep_dir 0.007* 0.004 0.008
(0.004) (0.004) (0.007)
duality_final -0.205 0.071 0.242
(0.430) (0.487) (0.659)
Constant 6.804*** 5.833*** 6.013***
(1.187) (1.526) (2.242)
Wald Chi2 26.23 6.70 69.89
Prob>Chi2 0.00 0.35 0.00
R-sq (overall) 0.11 0.03 0.30
Robust standard errors in parentheses, *** p<0.01, ** p<0.05, * p<0.1
The results at the overall bank level show that foreign institutional investors do play a significant
role in bringing down the level of NPAs in banks. This is in line with the existing literature.
fii -0.2768* 0.2729* -0.2288* 0.2677* -0.2819* -0.6229* 1.0000 avg_block_~5 0.2442* -0.1790* 0.1849* -0.2926* 0.2644* 1.0000 duality_fi~l 0.1806* -0.2818* 0.4062* -0.0517 1.0000 avg_pct_me~d -0.5458* 0.2258* 0.1004 1.0000 no_meetings 0.0064 -0.0397 1.0000 pct_indep_~r -0.3089* 1.0000 no_dir 1.0000 no_dir pct_in~r no_mee~s avg_pc~d dualit~l avg_bl~5 fii
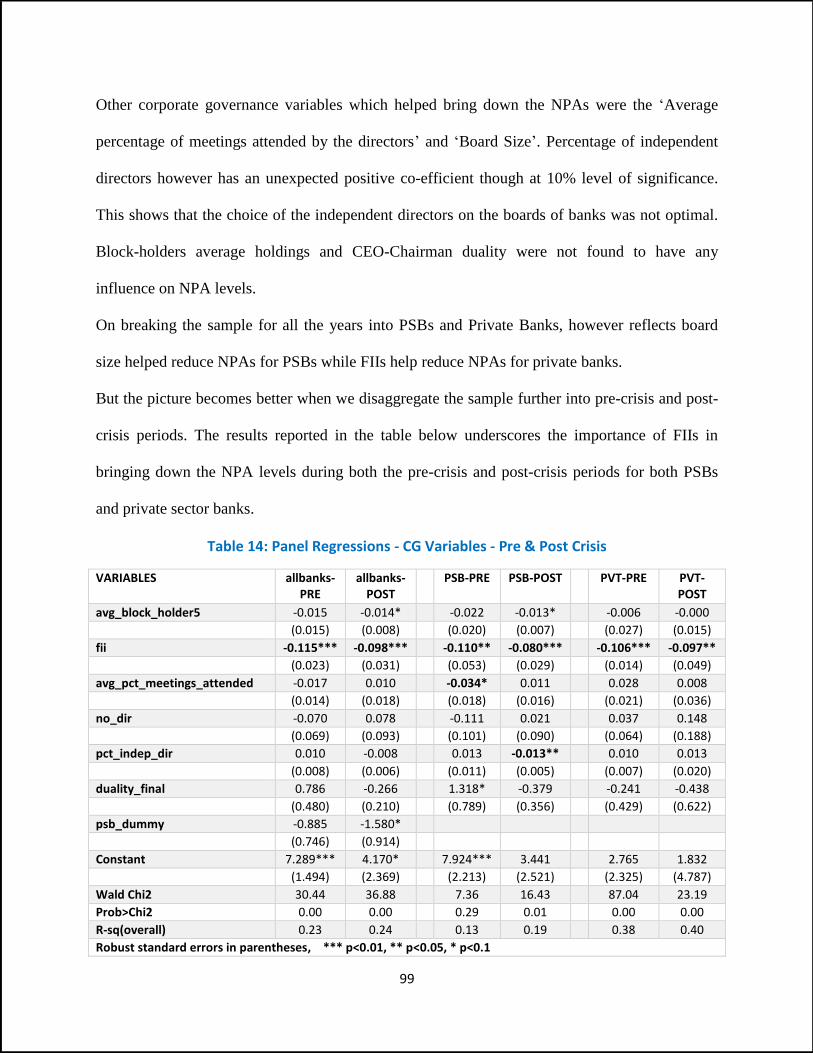
99
Other corporate governance variables which helped bring down the NPAs were the ‘Average
percentage of meetings attended by the directors’ and ‘Board Size’. Percentage of independent
directors however has an unexpected positive co-efficient though at 10% level of significance.
This shows that the choice of the independent directors on the boards of banks was not optimal.
Block-holders average holdings and CEO-Chairman duality were not found to have any
influence on NPA levels.
On breaking the sample for all the years into PSBs and Private Banks, however reflects board
size helped reduce NPAs for PSBs while FIIs help reduce NPAs for private banks.
But the picture becomes better when we disaggregate the sample further into pre-crisis and post-
crisis periods. The results reported in the table below underscores the importance of FIIs in
bringing down the NPA levels during both the pre-crisis and post-crisis periods for both PSBs
and private sector banks.
Table 14: Panel Regressions - CG Variables - Pre & Post Crisis
VARIABLES allbanks-PRE
allbanks-POST
PSB-PRE PSB-POST PVT-PRE PVT-POST
avg_block_holder5 -0.015 -0.014* -0.022 -0.013* -0.006 -0.000
(0.015) (0.008) (0.020) (0.007) (0.027) (0.015)
fii -0.115*** -0.098*** -0.110** -0.080*** -0.106*** -0.097**
(0.023) (0.031) (0.053) (0.029) (0.014) (0.049)
avg_pct_meetings_attended -0.017 0.010 -0.034* 0.011 0.028 0.008
(0.014) (0.018) (0.018) (0.016) (0.021) (0.036)
no_dir -0.070 0.078 -0.111 0.021 0.037 0.148
(0.069) (0.093) (0.101) (0.090) (0.064) (0.188)
pct_indep_dir 0.010 -0.008 0.013 -0.013** 0.010 0.013
(0.008) (0.006) (0.011) (0.005) (0.007) (0.020)
duality_final 0.786 -0.266 1.318* -0.379 -0.241 -0.438
(0.480) (0.210) (0.789) (0.356) (0.429) (0.622)
psb_dummy -0.885 -1.580*
(0.746) (0.914)
Constant 7.289*** 4.170* 7.924*** 3.441 2.765 1.832
(1.494) (2.369) (2.213) (2.521) (2.325) (4.787)
Wald Chi2 30.44 36.88 7.36 16.43 87.04 23.19
Prob>Chi2 0.00 0.00 0.29 0.01 0.00 0.00
R-sq(overall) 0.23 0.24 0.13 0.19 0.38 0.40
Robust standard errors in parentheses, *** p<0.01, ** p<0.05, * p<0.1
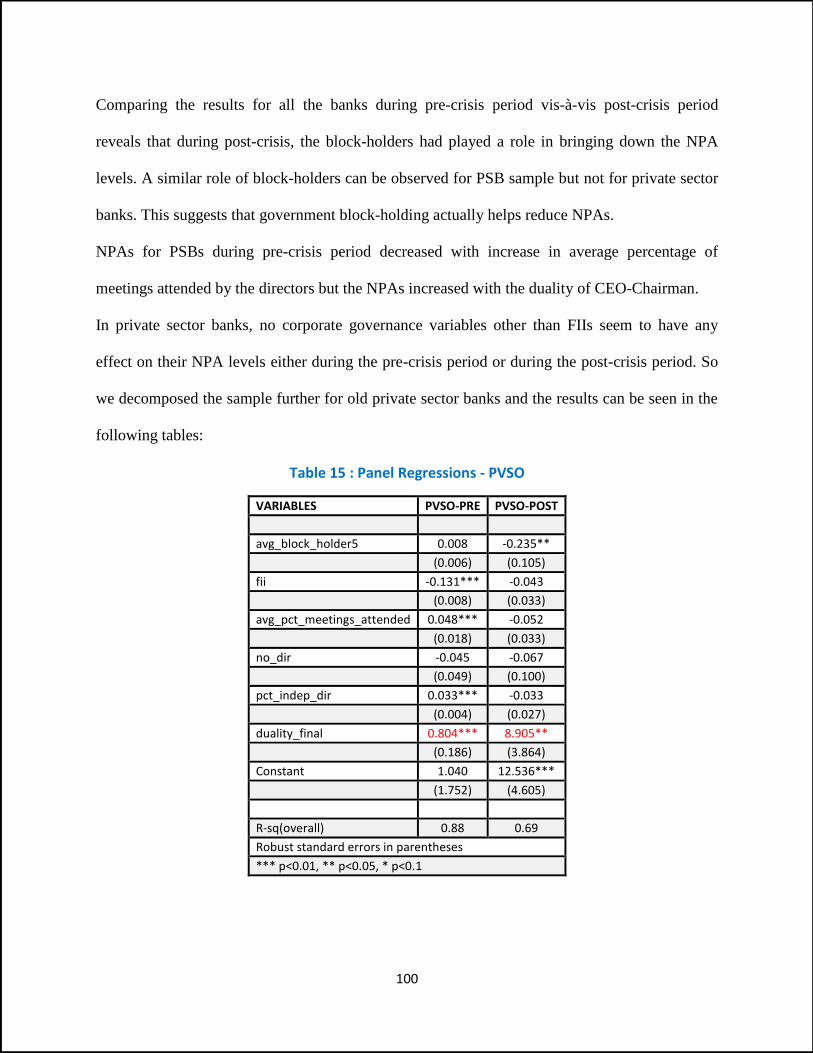
100
Comparing the results for all the banks during pre-crisis period vis-à-vis post-crisis period
reveals that during post-crisis, the block-holders had played a role in bringing down the NPA
levels. A similar role of block-holders can be observed for PSB sample but not for private sector
banks. This suggests that government block-holding actually helps reduce NPAs.
NPAs for PSBs during pre-crisis period decreased with increase in average percentage of
meetings attended by the directors but the NPAs increased with the duality of CEO-Chairman.
In private sector banks, no corporate governance variables other than FIIs seem to have any
effect on their NPA levels either during the pre-crisis period or during the post-crisis period. So
we decomposed the sample further for old private sector banks and the results can be seen in the
following tables:
Table 15 : Panel Regressions - PVSO
VARIABLES PVSO-PRE PVSO-POST
avg_block_holder5 0.008 -0.235**
(0.006) (0.105)
fii -0.131*** -0.043
(0.008) (0.033)
avg_pct_meetings_attended 0.048*** -0.052
(0.018) (0.033)
no_dir -0.045 -0.067
(0.049) (0.100)
pct_indep_dir 0.033*** -0.033
(0.004) (0.027)
duality_final 0.804*** 8.905**
(0.186) (3.864)
Constant 1.040 12.536***
(1.752) (4.605)
R-sq(overall) 0.88 0.69
Robust standard errors in parentheses
*** p<0.01, ** p<0.05, * p<0.1
101
In old private sector banks, promoter-director controls the shareholder meetings, the board as
well as the management. So the CEO and the board have little say in the way the bank operates.
Therefore the so-called independent directors on these boards or their attendance in board
meetings rather than reducing NPAs actually contributed to the same for old private sector banks
in the pre-crisis era. It reinforces that the directors on these boards did not really operate with
independence.
Duality played a significantly damaging role for NPAs in these banks in both the phases but
more strongly in the post-crisis phase. The block-holders became cautious about the NPAs in
post-crisis phase and brought a check on the NPAs.
VI. Conclusion
Foreign institutional investors play a very significant governance role in bringing the NPA levels
down for all bank groups in both the pre-crisis or post-crisis periods.
Block-holders, effectively the government ownership had a favorable role in PSBs in keeping the
NPAs low during the post-crisis phase. NPAs in private sector banks however did not go up due
to ownership concentration in either of the periods. But block holders on the other hand help
keep NPAs under check for old private banks. In this light, RBI’s norm25 restricting the
ownership of a single investor in a private sector bank to 5% (extendable up to 10% on RBI
approval) can be called an over cautious measure.
Diligence of directors expressed in their attendance had some role in reducing NPAs in PSBs
during pre-crisis but during post-crisis a similar role was assumed by independence of directors
25 A comprehensive policy framework for ownership and governance in private sector banks
102
instead. Board of directors of old private sector banks do not seem to be independent of
promoters.
CEO-Chairman duality led to increase in NPA level for PSBs during pre-crisis phase and
increase in NPAs for old private sector banks in both the phases. So banks should avoid such
duality in order to bring better governance. These conclusions are supportive of the
recommendations of Nayak Committee on bringing better board independence as well as
separation of chairman and CEO in banks.
On an overall basis, FIIs, bigger board size and greater percentage of board meetings attendance
had a favorable impact on the asset quality of banks.
PSBs have been suffering a very high NPA compared to private sector banks. One of the reasons
is its inefficiency in loan appraisal, credit monitoring roles and loan recovery. Therefore Nayak
Committee has rightly recommended easing out of the external constraints faced by the PSBs.
But one cannot ignore the possibility that lower levels of NPAs achieved by private sector banks
were due to some sort of ever-greening of NPAs they might have resorted to. Such behavior can
only be detected by RBIs inspections and possibly by examination of the Special Mentions
Assets by the auditors/ audit committee of the board.
Future research can look into the busyness, tenure, age, skills and gender of bank directors to see
if these traits have any influence on NPA levels of banks.
103
Chapter V: Handling NPAs
I. Introduction and Initiatives by Government, RBI and Banks
After having understood the determinants of NPAs over years and across banks, next step is
to understand the NPA containment measures. Complete elimination of NPAs from the
books of banks is not possible given the fact that extending loans is part of the core
operations of a bank. Containment of NPAs has assumed special significance after the
recommendations of Narasimham Committees on financial system and on banking sector
reforms since 1990s. It has become more important in the face of the recent burgeoning of
NPAs in PSBs.
The following approach can be taken in general to contain NPAs in banks:
1. Initiatives should be taken by the banks to identify the NPAs at the earliest and take
initiatives to contain them at a minimum level.
2. Once an asset becomes an NPA, the bank should monitor and evaluate it on a continuous
basis to check for the possibility of recovery.
a. If the recovery looks possible, the banks should take actions for prompt recovery
through persuasion, through legal action or through enforcement of securities.
(DRT, Lok Adalat, SARAESI)
b. If NPAs are such that the repayment difficulty relates to temporary problem,
banks can help out such accounts through restructuring
c. If an NPA is assessed to be non-recoverable, the bank should not delay the
recognition of the problem just because it will hurt its bottom-line. The banks
should take timely exit decisions and write it off. The information about the
104
borrowers default should be shared with other banks so that they can minimize the
possibility of meeting a similar consequence with the borrower.
3. Going forward, the banks should improve their credit appraisal and credit granting
mechanism by making use of the information about the borrowers shared by other banks
so that fresh accretion of NPAs can be minimized.
Past Initiatives by Government, RBI and Banks: Several initiatives have been taken at the
bank level as well as at the policy level by the Central Government and RBI to contain
NPAs.
1. Macro-level initiatives: Let us first discuss the institutional measures put in by Central
Government and RBI towards recovery of NPAs:
i. Lok Adalat (People’s Court): RBI issued guidelines to make use of Lok Adalats26 to
resolve disputes on the spot for both suit-filed or non-suit filed accounts in ‘doubtful’
or ‘loss’ category with dues up to Rs 5 Lakhs (the ceiling was increased to 20 lakhs in
Aug 2004).The resolution could be through conciliation, mediation, compromise, or
settlement. The objective was to reduce the burden on courts. The award by Lok
Adalat is deemed to be a decree from a civil court.
ii. Debt Recovery Tribunals (DRTs): Government of India (GOI) constituted DRTs
under Recovery of Debts Due to Banks and Financial Institutions (RDBF) Act, 1993
to help banks recover their dues quickly and efficiently. There are around 33 DRTs
and 5 Debt recovery appellate tribunals (DRATs)27 across the country. Each DRT is
headed by a presiding officer and has two recovery officers. These can handle loan
26 Constituted under Legal Services Authority Act, 1987 27 Appeals can be made in DRATs against an order passed by DRTs, provided the appellant deposits a percentage of the amounts due from him
105
disputes of Rs10 lakhs and above. They are expected to resolve cases within six
months.
iii. One Time Settlement Scheme was introduced in 2000 as a simplified, non-
discretionary, and non-discriminatory way to recover NPAs which became
doubtful/loss assets, for amounts below Rs5 crores. This provides borrowers with an
opportunity to present themselves with applications for compromise settlement of
their outstanding dues within a prescribed date. The RBI guidelines for the same were
revised in 2003 and 2005. The revised ceiling stands at Rs 10 crores from 2003.
iv. Securitisation and Reconstruction of Financial Assets and Enforcement of
Security Interest Act (SARFAESI), 2002 was enacted after the initial ideas of Asset
Reconstruction funds (ARFs) generated in Narasimham Committee-I and II. The Act
allows taking possession of the secured assets of the borrower. It enables a bank to
sell their impaired financial assets to Securitisation Company /Reconstruction
Company so that the security interests can be enforced outside courts. The ARCs with
special recovery skills and powers act as debt aggregators, who focus on expediting
recovery or other means of resolving the NPAs. The NPAs or the bad assets are thus
separated from the banks to help them concentrate on their core business.
v. Restructuring of debt: Corporate debt restructuring is a voluntary and non-statutory
mechanism introduced by RBI in 2001 (revised in August 2008) with an objective of
introducing a timely and transparent means to handle viable corporate debts outside
the purview of BIFR (Board for Industrial and Financial Reconstruction), DRT or
legal proceedings, through an orderly and coordinated plan. The objective is to
minimise losses for all stakeholders.
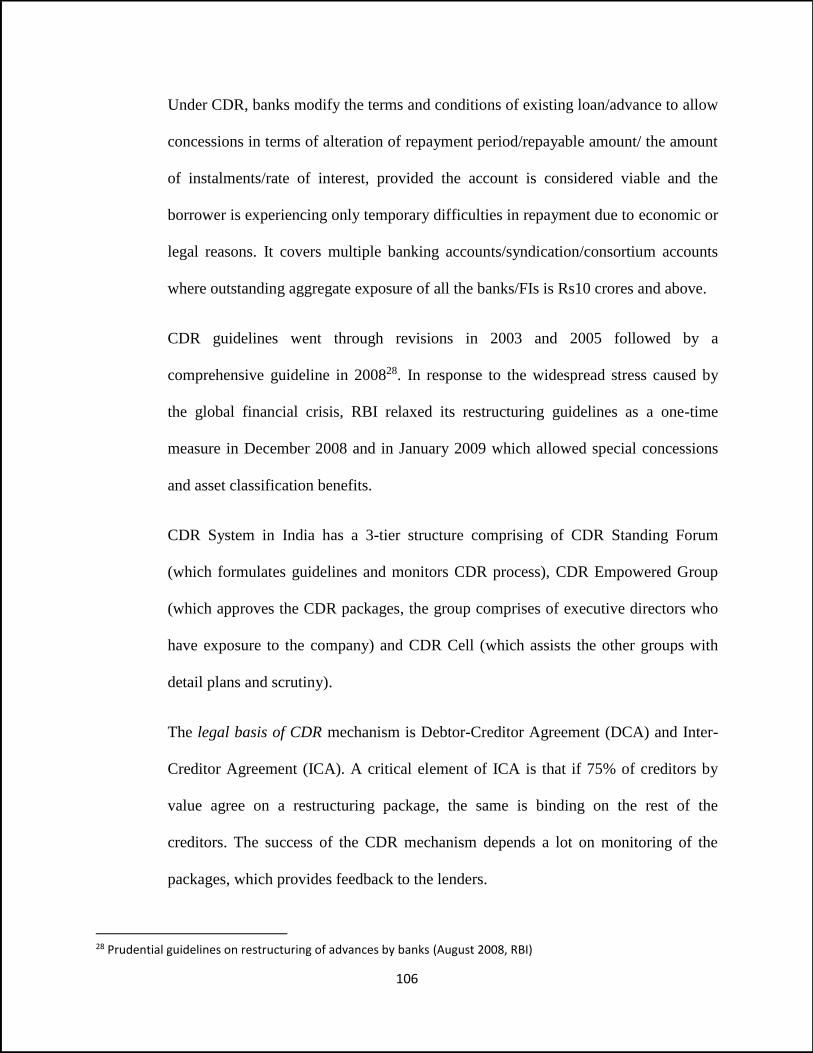
106
Under CDR, banks modify the terms and conditions of existing loan/advance to allow
concessions in terms of alteration of repayment period/repayable amount/ the amount
of instalments/rate of interest, provided the account is considered viable and the
borrower is experiencing only temporary difficulties in repayment due to economic or
legal reasons. It covers multiple banking accounts/syndication/consortium accounts
where outstanding aggregate exposure of all the banks/FIs is Rs10 crores and above.
CDR guidelines went through revisions in 2003 and 2005 followed by a
comprehensive guideline in 200828. In response to the widespread stress caused by
the global financial crisis, RBI relaxed its restructuring guidelines as a one-time
measure in December 2008 and in January 2009 which allowed special concessions
and asset classification benefits.
CDR System in India has a 3-tier structure comprising of CDR Standing Forum
(which formulates guidelines and monitors CDR process), CDR Empowered Group
(which approves the CDR packages, the group comprises of executive directors who
have exposure to the company) and CDR Cell (which assists the other groups with
detail plans and scrutiny).
The legal basis of CDR mechanism is Debtor-Creditor Agreement (DCA) and Inter-
Creditor Agreement (ICA). A critical element of ICA is that if 75% of creditors by
value agree on a restructuring package, the same is binding on the rest of the
creditors. The success of the CDR mechanism depends a lot on monitoring of the
packages, which provides feedback to the lenders.
28 Prudential guidelines on restructuring of advances by banks (August 2008, RBI)

107
b. Micro-level initiatives undertaken by banks: Banks have also been taking steps towards
1) Improving their credit appraisal and post-sanction monitoring processes through
adoption of technology and improved Management Information Systems (MIS)
mechanisms as well as through strengthening their risk management & board oversight.
2) Banks like SBI have established Stressed Assets Management Group (SAMG) and
Stressed Assets Resolution Centres (SARC) to provide specialized attention to resolution
of NPAs. Banks have also been resorting to handling viable NPAs through restructurings.
I. Reduction in NPAs: Composition – Write- offs, Recoveries and Upgradations
NPAs can be minimized through preventions at the stage of granting credit. But once
NPA is generated it needs to be brought down through recoveries, write-offs or
restructurings/ upgradations. This section will look at the trend in reduction of NPAs in
banks. The graph below emphasizes that for PSBs in pre-crisis period, the reductions in
GNPA (Rs 805.5 crores) was more than the additions to GNPA (Rs700.4 crores) but in
post-crisis period the additions to GNPA (Rs3031.4 crores) was significantly higher than
the reductions (Rs1782.7 crores). However for private sector banks, the reductions were
consistently lower than additions in all the three phases.
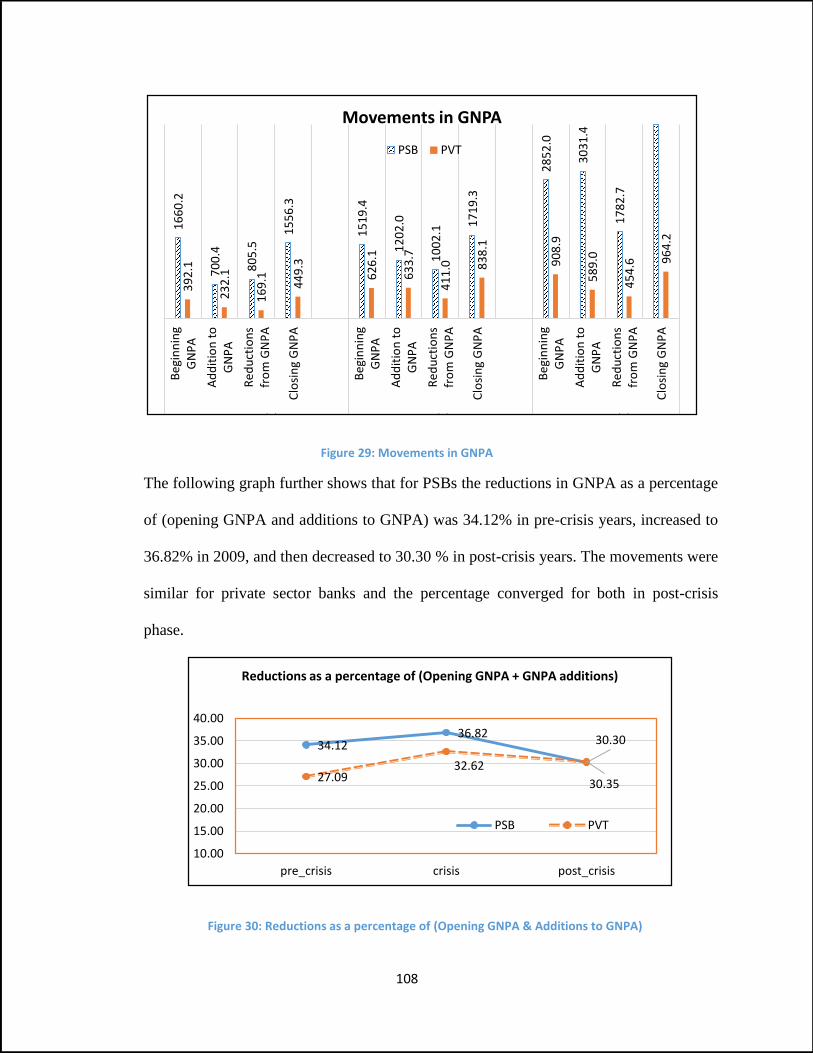
108
34.1236.82
30.30
27.0932.62
30.35
10.00
15.00
20.00
25.00
30.00
35.00
40.00
pre_crisis crisis post_crisis
Reductions as a percentage of (Opening GNPA + GNPA additions)
PSB PVT
Figure 29: Movements in GNPA
The following graph further shows that for PSBs the reductions in GNPA as a percentage
of (opening GNPA and additions to GNPA) was 34.12% in pre-crisis years, increased to
36.82% in 2009, and then decreased to 30.30 % in post-crisis years. The movements were
similar for private sector banks and the percentage converged for both in post-crisis
phase.
Figure 30: Reductions as a percentage of (Opening GNPA & Additions to GNPA)
16
60
.2
70
0.4
80
5.5
15
56
.3
15
19
.4
12
02
.0
10
02
.1
17
19
.3
28
52
.0
30
31
.4
17
82
.7
39
2.1
23
2.1
16
9.1 44
9.3
62
6.1
63
3.7
41
1.0 8
38
.1
90
8.9
58
9.0
45
4.6 9
64
.2
Be
gin
nin
gG
NP
A
Ad
dit
ion
to
GN
PA
Re
du
ctio
ns
fro
m G
NP
A
Clo
sin
g G
NP
A
Be
gin
nin
gG
NP
A
Ad
dit
ion
to
GN
PA
Re
du
ctio
ns
fro
m G
NP
A
Clo
sin
g G
NP
A
Be
gin
nin
gG
NP
A
Ad
dit
ion
to
GN
PA
Re
du
ctio
ns
fro
m G
NP
A
Clo
sin
g G
NP
A
pre_crisis crisis post_crisis
Movements in GNPA
PSB PVT
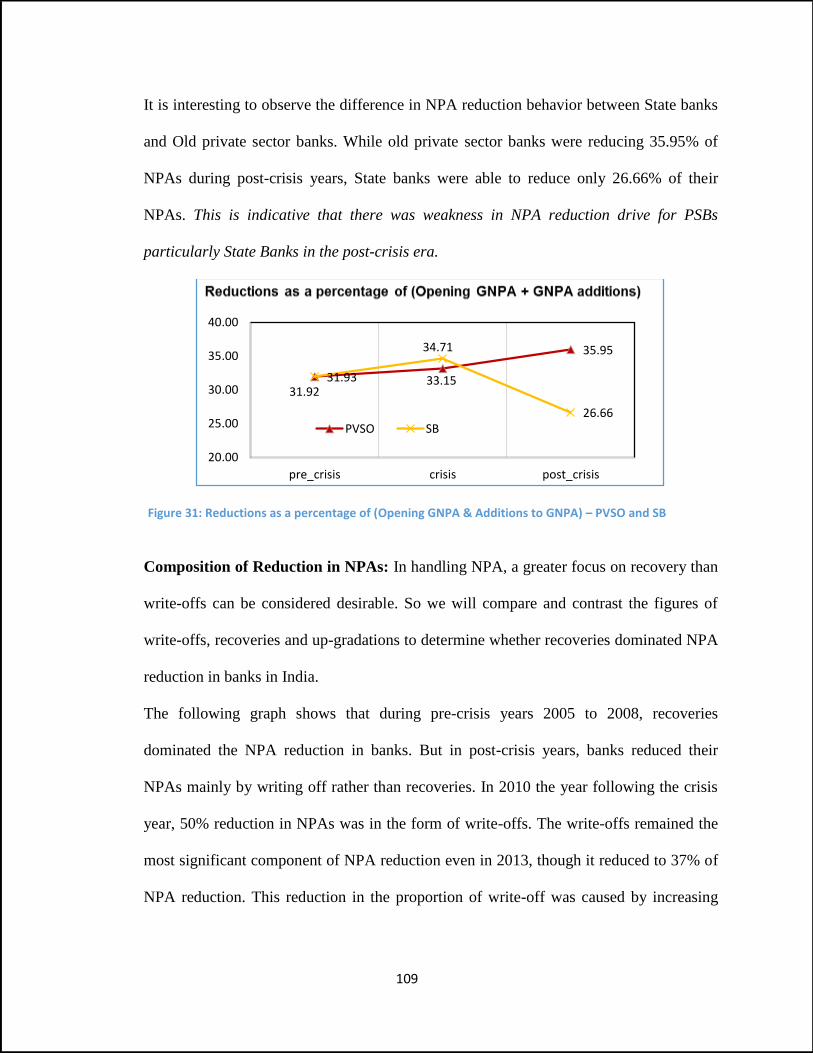
109
It is interesting to observe the difference in NPA reduction behavior between State banks
and Old private sector banks. While old private sector banks were reducing 35.95% of
NPAs during post-crisis years, State banks were able to reduce only 26.66% of their
NPAs. This is indicative that there was weakness in NPA reduction drive for PSBs
particularly State Banks in the post-crisis era.
Figure 31: Reductions as a percentage of (Opening GNPA & Additions to GNPA) – PVSO and SB
Composition of Reduction in NPAs: In handling NPA, a greater focus on recovery than
write-offs can be considered desirable. So we will compare and contrast the figures of
write-offs, recoveries and up-gradations to determine whether recoveries dominated NPA
reduction in banks in India.
The following graph shows that during pre-crisis years 2005 to 2008, recoveries
dominated the NPA reduction in banks. But in post-crisis years, banks reduced their
NPAs mainly by writing off rather than recoveries. In 2010 the year following the crisis
year, 50% reduction in NPAs was in the form of write-offs. The write-offs remained the
most significant component of NPA reduction even in 2013, though it reduced to 37% of
NPA reduction. This reduction in the proportion of write-off was caused by increasing
31.93 33.15
35.95
31.92
34.71
26.66
20.00
25.00
30.00
35.00
40.00
pre_crisis crisis post_crisis
PVSO SB
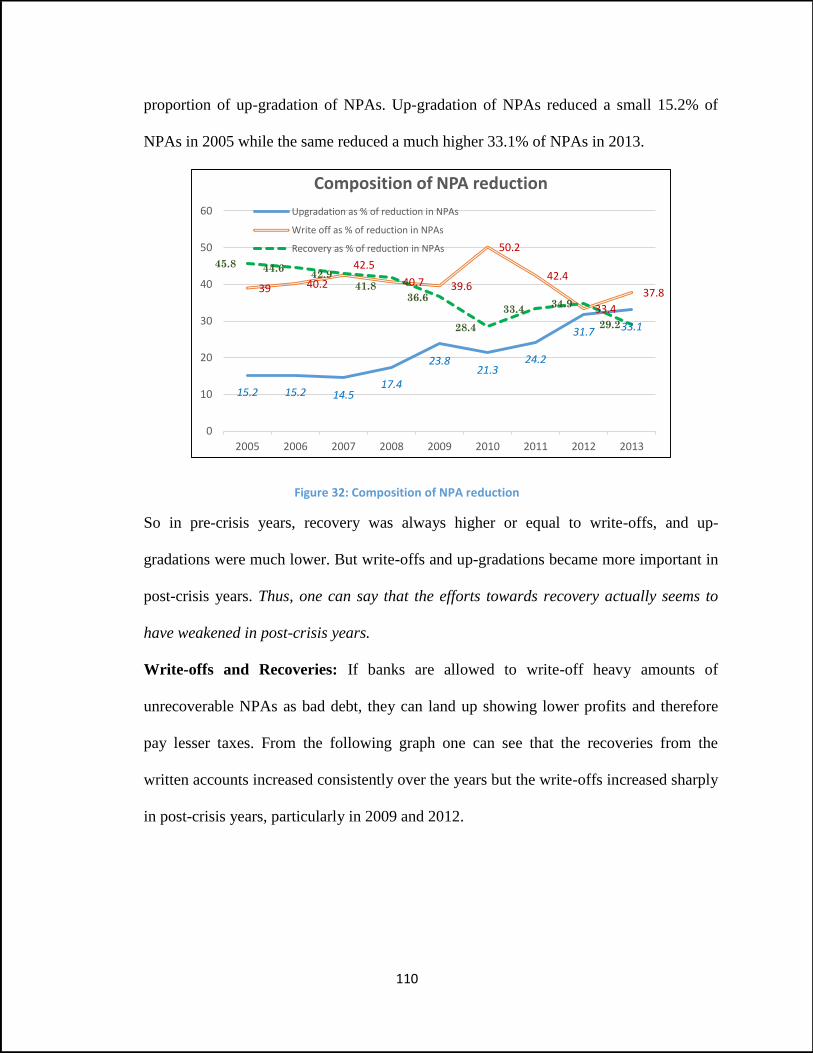
110
15.2 15.2 14.517.4
23.821.3
24.2
31.7 33.1
39 40.2
42.5
40.7 39.6
50.2
42.4
33.4
37.8
45.8 44.642.9
41.836.6
28.4
33.434.9
29.2
0
10
20
30
40
50
60
2005 2006 2007 2008 2009 2010 2011 2012 2013
Composition of NPA reduction
Upgradation as % of reduction in NPAs
Write off as % of reduction in NPAs
Recovery as % of reduction in NPAs
proportion of up-gradation of NPAs. Up-gradation of NPAs reduced a small 15.2% of
NPAs in 2005 while the same reduced a much higher 33.1% of NPAs in 2013.
Figure 32: Composition of NPA reduction
So in pre-crisis years, recovery was always higher or equal to write-offs, and up-
gradations were much lower. But write-offs and up-gradations became more important in
post-crisis years. Thus, one can say that the efforts towards recovery actually seems to
have weakened in post-crisis years.
Write-offs and Recoveries: If banks are allowed to write-off heavy amounts of
unrecoverable NPAs as bad debt, they can land up showing lower profits and therefore
pay lesser taxes. From the following graph one can see that the recoveries from the
written accounts increased consistently over the years but the write-offs increased sharply
in post-crisis years, particularly in 2009 and 2012.
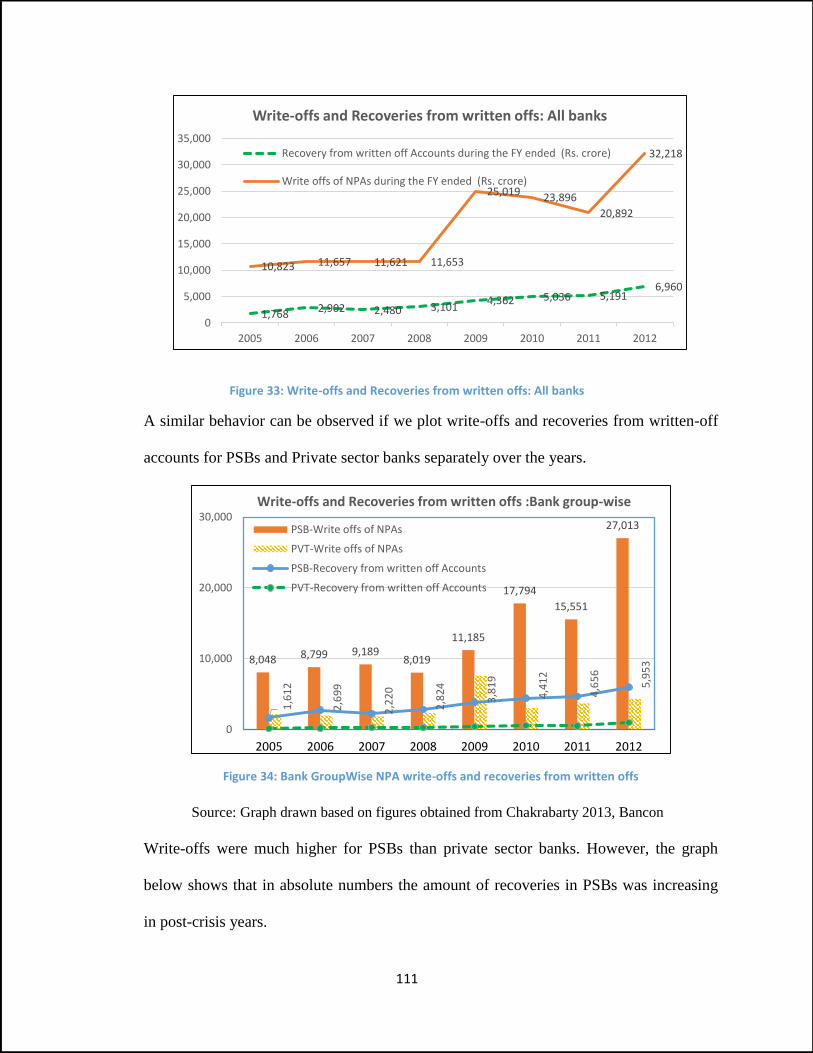
111
Figure 33: Write-offs and Recoveries from written offs: All banks
A similar behavior can be observed if we plot write-offs and recoveries from written-off
accounts for PSBs and Private sector banks separately over the years.
Source: Graph drawn based on figures obtained from Chakrabarty 2013, Bancon
Write-offs were much higher for PSBs than private sector banks. However, the graph
below shows that in absolute numbers the amount of recoveries in PSBs was increasing
in post-crisis years.
1,768 2,902 2,480 3,1014,362 5,036 5,191
6,960
10,823 11,657 11,621 11,653
25,019 23,896
20,892
32,218
0
5,000
10,000
15,000
20,000
25,000
30,000
35,000
2005 2006 2007 2008 2009 2010 2011 2012
Write-offs and Recoveries from written offs: All banks
Recovery from written off Accounts during the FY ended (Rs. crore)
Write offs of NPAs during the FY ended (Rs. crore)
8,048 8,799 9,1898,019
11,185
17,794
15,551
27,013
1,6
12
2,6
99
2,2
20
2,8
24
3,8
19
4,4
12
4,6
56
5,9
53
0
10,000
20,000
30,000
2005 2006 2007 2008 2009 2010 2011 2012
Write-offs and Recoveries from written offs :Bank group-wise
PSB-Write offs of NPAs
PVT-Write offs of NPAs
PSB-Recovery from written off Accounts
PVT-Recovery from written off Accounts
Figure 34: Bank GroupWise NPA write-offs and recoveries from written offs
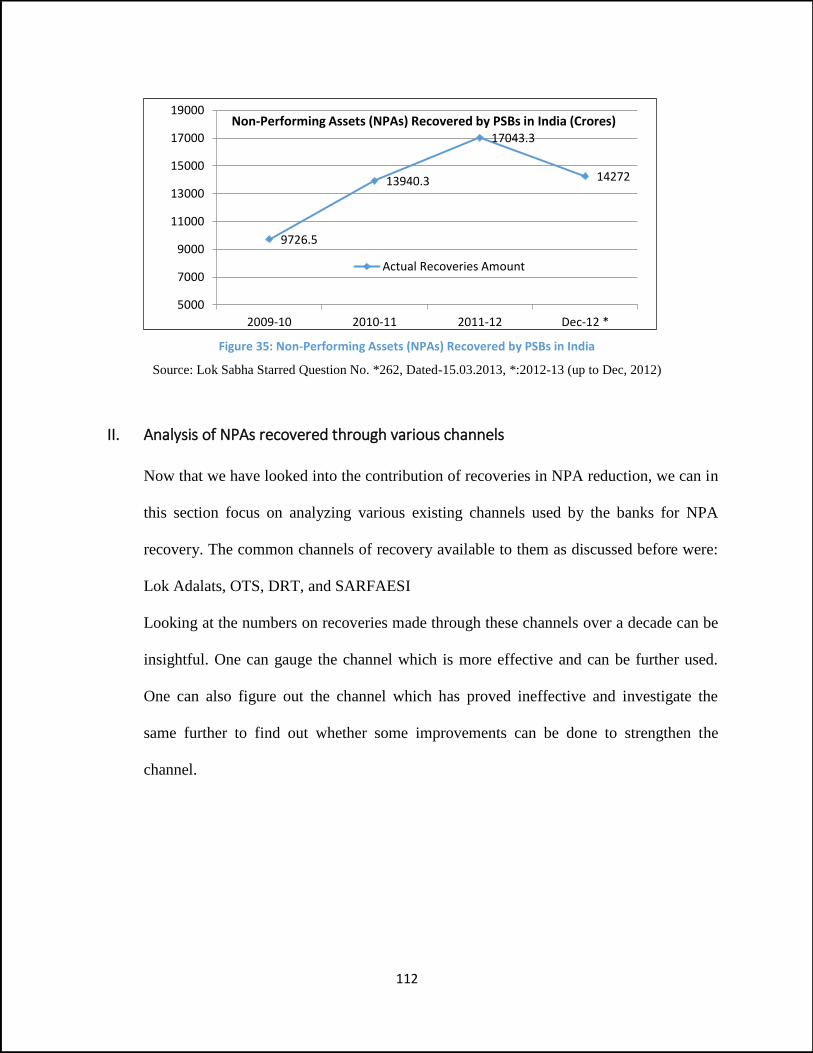
112
9726.5
13940.3
17043.3
14272
5000
7000
9000
11000
13000
15000
17000
19000
2009-10 2010-11 2011-12 Dec-12 *
Non-Performing Assets (NPAs) Recovered by PSBs in India (Crores)
Actual Recoveries Amount
Figure 35: Non-Performing Assets (NPAs) Recovered by PSBs in India
Source: Lok Sabha Starred Question No. *262, Dated-15.03.2013, *:2012-13 (up to Dec, 2012)
II. Analysis of NPAs recovered through various channels
Now that we have looked into the contribution of recoveries in NPA reduction, we can in
this section focus on analyzing various existing channels used by the banks for NPA
recovery. The common channels of recovery available to them as discussed before were:
Lok Adalats, OTS, DRT, and SARFAESI
Looking at the numbers on recoveries made through these channels over a decade can be
insightful. One can gauge the channel which is more effective and can be further used.
One can also figure out the channel which has proved ineffective and investigate the
same further to find out whether some improvements can be done to strengthen the
channel.
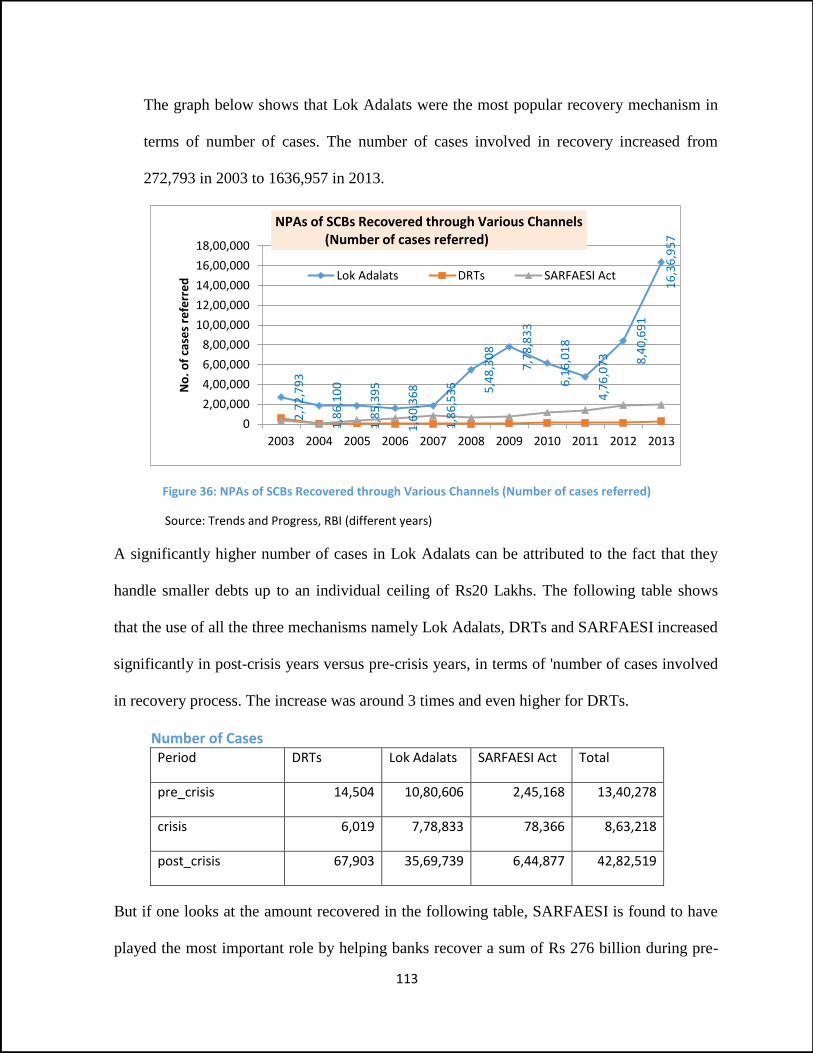
113
The graph below shows that Lok Adalats were the most popular recovery mechanism in
terms of number of cases. The number of cases involved in recovery increased from
272,793 in 2003 to 1636,957 in 2013.
Figure 36: NPAs of SCBs Recovered through Various Channels (Number of cases referred)
Source: Trends and Progress, RBI (different years)
A significantly higher number of cases in Lok Adalats can be attributed to the fact that they
handle smaller debts up to an individual ceiling of Rs20 Lakhs. The following table shows
that the use of all the three mechanisms namely Lok Adalats, DRTs and SARFAESI increased
significantly in post-crisis years versus pre-crisis years, in terms of 'number of cases involved
in recovery process. The increase was around 3 times and even higher for DRTs.
Number of Cases Period DRTs Lok Adalats SARFAESI Act Total
pre_crisis 14,504 10,80,606 2,45,168 13,40,278
crisis 6,019 7,78,833 78,366 8,63,218
post_crisis 67,903 35,69,739 6,44,877 42,82,519
But if one looks at the amount recovered in the following table, SARFAESI is found to have
played the most important role by helping banks recover a sum of Rs 276 billion during pre-
2,7
2,7
93
1,8
6,1
00
1,8
5,3
95
1,6
0,3
68
1,8
6,5
35 5,4
8,3
08
7,7
8,8
33
6,1
6,0
18
4,7
6,0
73 8,4
0,6
91
16
,36
,95
7
0
2,00,000
4,00,000
6,00,000
8,00,000
10,00,000
12,00,000
14,00,000
16,00,000
18,00,000
2003 2004 2005 2006 2007 2008 2009 2010 2011 2012 2013
No
. of
case
s re
ferr
ed
NPAs of SCBs Recovered through Various Channels(Number of cases referred)
Lok Adalats DRTs SARFAESI Act
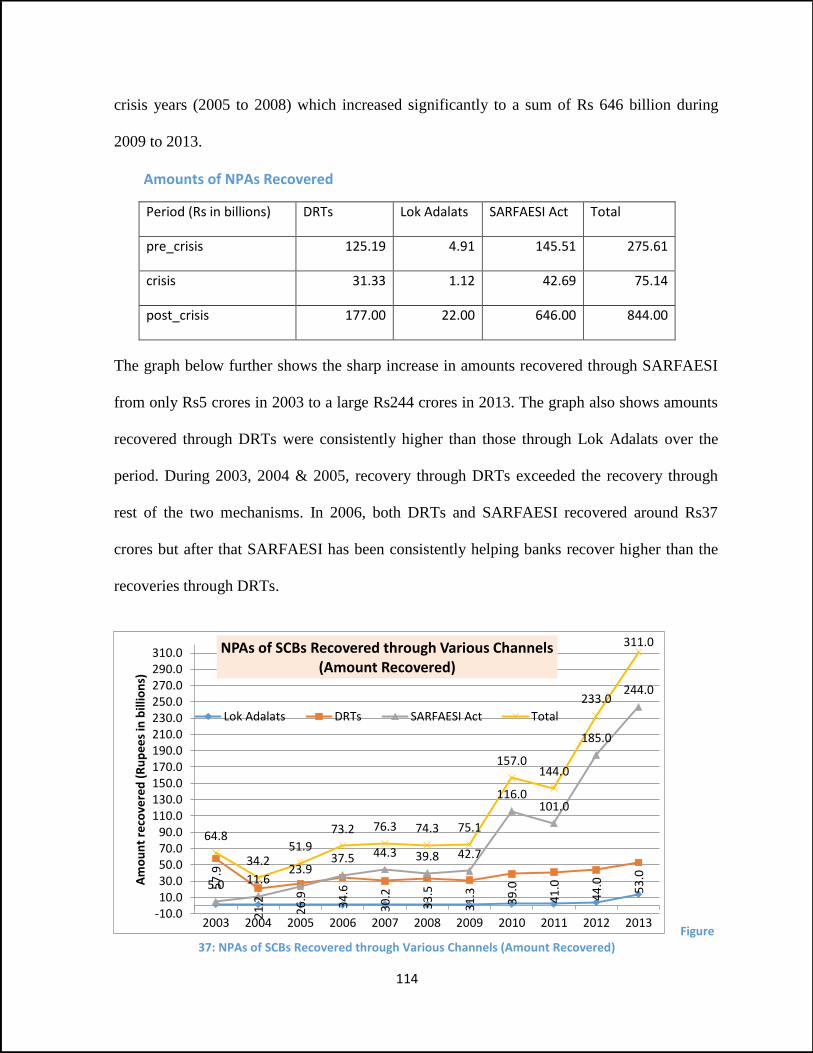
114
57
.9
21
.2
26
.9
34
.6
30
.2
33
.5
31
.3
39
.0
41
.0
44
.0 53
.0
5.0 11.623.9
37.5 44.3 39.8 42.7
116.0101.0
185.0
244.0
64.8
34.251.9
73.2 76.3 74.3 75.1
157.0144.0
233.0
311.0
-10.010.030.050.070.090.0
110.0130.0150.0170.0190.0210.0230.0250.0270.0290.0310.0
2003 2004 2005 2006 2007 2008 2009 2010 2011 2012 2013
Am
ou
nt
reco
vere
d (
Ru
pe
es
in b
illio
ns)
NPAs of SCBs Recovered through Various Channels(Amount Recovered)
Lok Adalats DRTs SARFAESI Act Total
crisis years (2005 to 2008) which increased significantly to a sum of Rs 646 billion during
2009 to 2013.
Amounts of NPAs Recovered
Period (Rs in billions) DRTs Lok Adalats SARFAESI Act Total
pre_crisis 125.19 4.91 145.51 275.61
crisis 31.33 1.12 42.69 75.14
post_crisis 177.00 22.00 646.00 844.00
The graph below further shows the sharp increase in amounts recovered through SARFAESI
from only Rs5 crores in 2003 to a large Rs244 crores in 2013. The graph also shows amounts
recovered through DRTs were consistently higher than those through Lok Adalats over the
period. During 2003, 2004 & 2005, recovery through DRTs exceeded the recovery through
rest of the two mechanisms. In 2006, both DRTs and SARFAESI recovered around Rs37
crores but after that SARFAESI has been consistently helping banks recover higher than the
recoveries through DRTs.
Figure 37: NPAs of SCBs Recovered through Various Channels (Amount Recovered)

115
The following table helps one understand the effectiveness of recovery channels through
detailing the percentages of (Amount recovered to Amount involved). One can observe that
regarding the effectiveness of recovery, Lok adalat was most effective in 2003. But during
2004 & 2005 and again in 2008 &2009, DRTs were more effective in NPA recovery than the
rest of the two mechanisms.
Percentage of Amount Recovered to Amount Involved
Year Lok Adalats DRTs SARFAESI Act Total
2003 16.0 7.0 4.1 6.8
2004 14.0 17.2 14.7 16.1
2005 14.1 18.8 18.1 18.3
2006 14.0 37.8 41.4 38.6
2007 8.2 51.9 61.0 50.1
2008 2.4 81.1 33.0 36.7
2009 1.5 32.0 30.0 24.0
2010 3.7 27.6 37.9 31.4
2011 11.8 17.0 28.6 23.6
2012 6.1 14.1 27.1 21.9
2013 6.2 9.5 25.8 18.0
The table below reports that NPAs recovered as a percentage of amount involved was higher
in pre-crisis years than the post-crisis years. The effectiveness of recovery declined
significantly for all the three mechanisms. In the post crisis years, SARFAESI has been most
effective mechanism among all the three alternatives available for recovering NPAs.
Percentage Recovered
Period DRTs Lok Adalats SARFAESI Act Total
pre_crisis 47.40 9.68 38.38 35.93
crisis 32.00 1.50 30.00 24.00
post_crisis 17.05 6.95 29.85 23.73

116
The graph below shows that recovery through DRTs even reached 81.1% of the amounts
involved in recovery in 2008. The effectiveness however declined sharply every year during
the post-crisis phase and the same reached a low of 9.5% of amount involved in 2013.
Figure 38: NPAs of SCBs Recovered through Various Channels- Amount Recovered/Amount involved
The table below indicates that the amount involved for recovery through SARFAESI was a
whopping Rs 2,286 billion during post-crisis years, almost double of the next best alternative
of DRTs.
Amount Involved
Period (Rs in billions) DRTs Lok Adalats SARFAESI Act Total
pre_crisis 334.22 77.24 416.12 827.58
crisis 97.97 72.35 142.49 312.81
post_crisis 1245.00 368.00 2286.00 3900.00
The details of recovery made by PSBs through suit filed cases, as available with RBI,
demonstrated in the table below suggests that while the number of suit-filed cases is
7.0
17.2 18.8
37.8
51.9
81.1
32.027.6
17.014.1
9.5
0.0
10.0
20.0
30.0
40.0
50.0
60.0
70.0
80.0
90.0
2003 2004 2005 2006 2007 2008 2009 2010 2011 2012 2013
Am
t re
cove
rd/
Am
t in
volv
ed
(P
erc
en
tage
)
NPAs of SCBs Recovered through Various ChannelsAmt Recovered/Amt involved
Lok Adalats
DRTs
SARFAESI Act
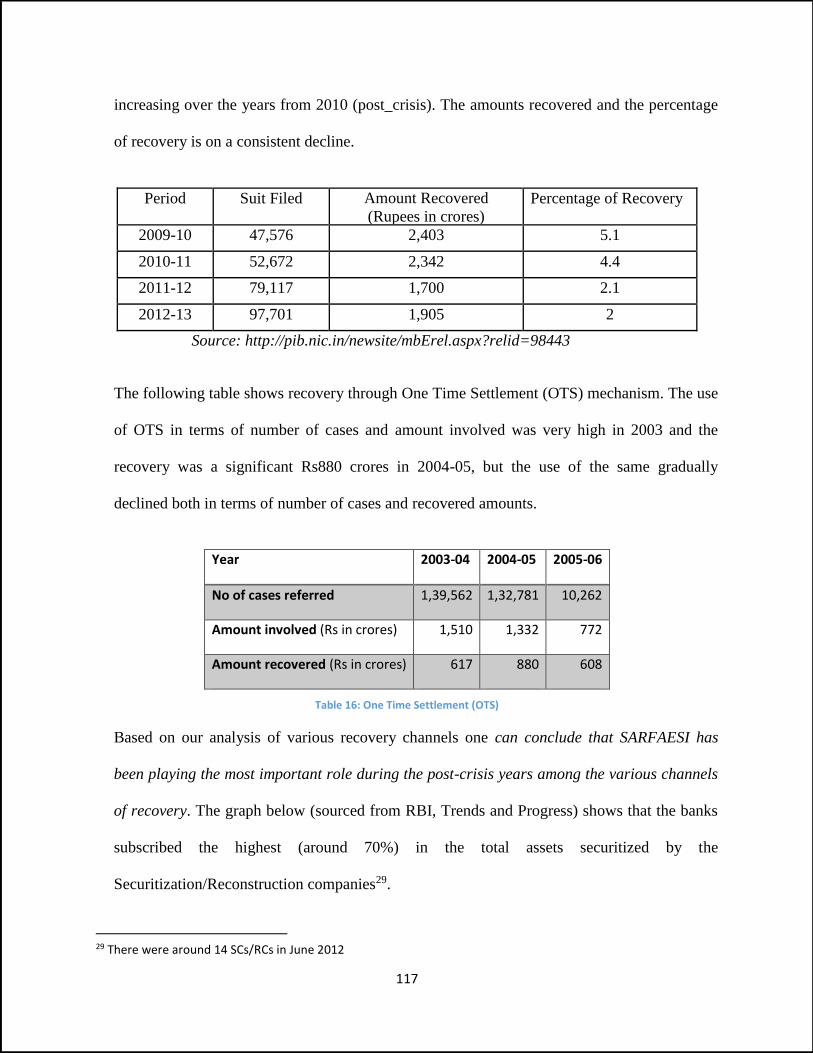
117
increasing over the years from 2010 (post_crisis). The amounts recovered and the percentage
of recovery is on a consistent decline.
Period Suit Filed Amount Recovered
(Rupees in crores)
Percentage of Recovery
2009-10 47,576 2,403 5.1
2010-11 52,672 2,342 4.4
2011-12 79,117 1,700 2.1
2012-13 97,701 1,905 2
Source: http://pib.nic.in/newsite/mbErel.aspx?relid=98443
The following table shows recovery through One Time Settlement (OTS) mechanism. The use
of OTS in terms of number of cases and amount involved was very high in 2003 and the
recovery was a significant Rs880 crores in 2004-05, but the use of the same gradually
declined both in terms of number of cases and recovered amounts.
Year 2003-04 2004-05 2005-06
No of cases referred 1,39,562 1,32,781 10,262
Amount involved (Rs in crores) 1,510 1,332 772
Amount recovered (Rs in crores) 617 880 608
Table 16: One Time Settlement (OTS)
Based on our analysis of various recovery channels one can conclude that SARFAESI has
been playing the most important role during the post-crisis years among the various channels
of recovery. The graph below (sourced from RBI, Trends and Progress) shows that the banks
subscribed the highest (around 70%) in the total assets securitized by the
Securitization/Reconstruction companies29.
29 There were around 14 SCs/RCs in June 2012
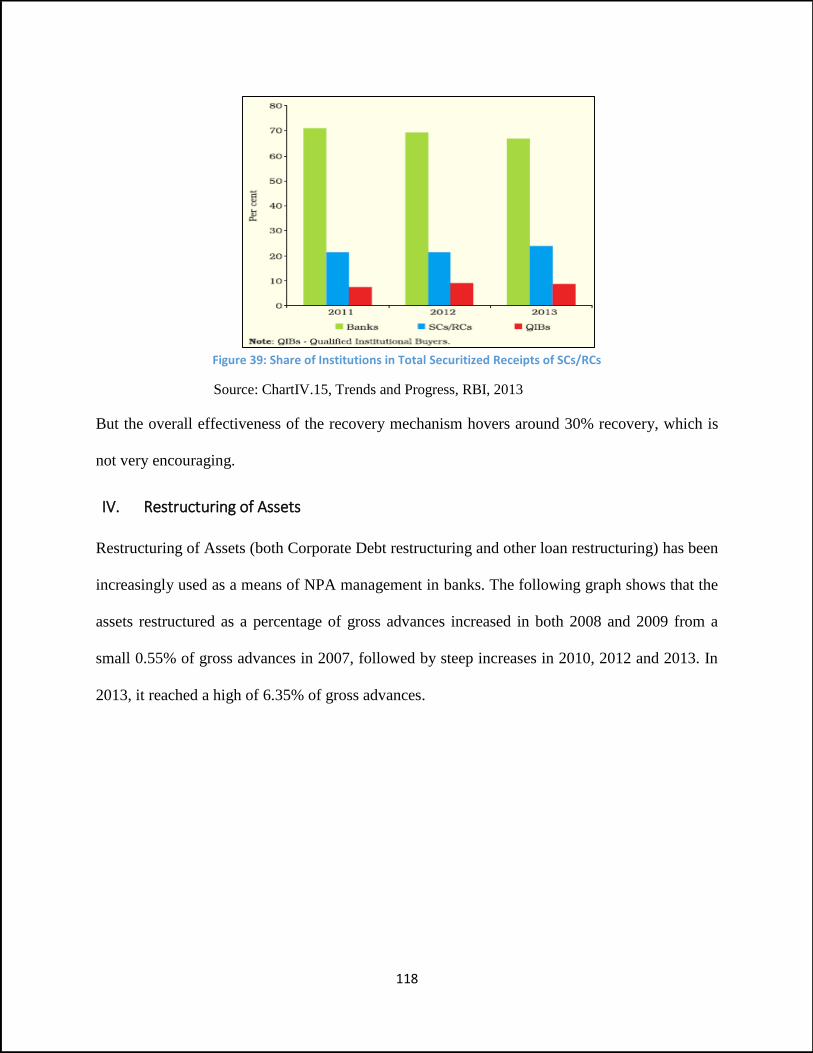
118
Figure 39: Share of Institutions in Total Securitized Receipts of SCs/RCs
Source: ChartIV.15, Trends and Progress, RBI, 2013
But the overall effectiveness of the recovery mechanism hovers around 30% recovery, which is
not very encouraging.
IV. Restructuring of Assets
Restructuring of Assets (both Corporate Debt restructuring and other loan restructuring) has been
increasingly used as a means of NPA management in banks. The following graph shows that the
assets restructured as a percentage of gross advances increased in both 2008 and 2009 from a
small 0.55% of gross advances in 2007, followed by steep increases in 2010, 2012 and 2013. In
2013, it reached a high of 6.35% of gross advances.
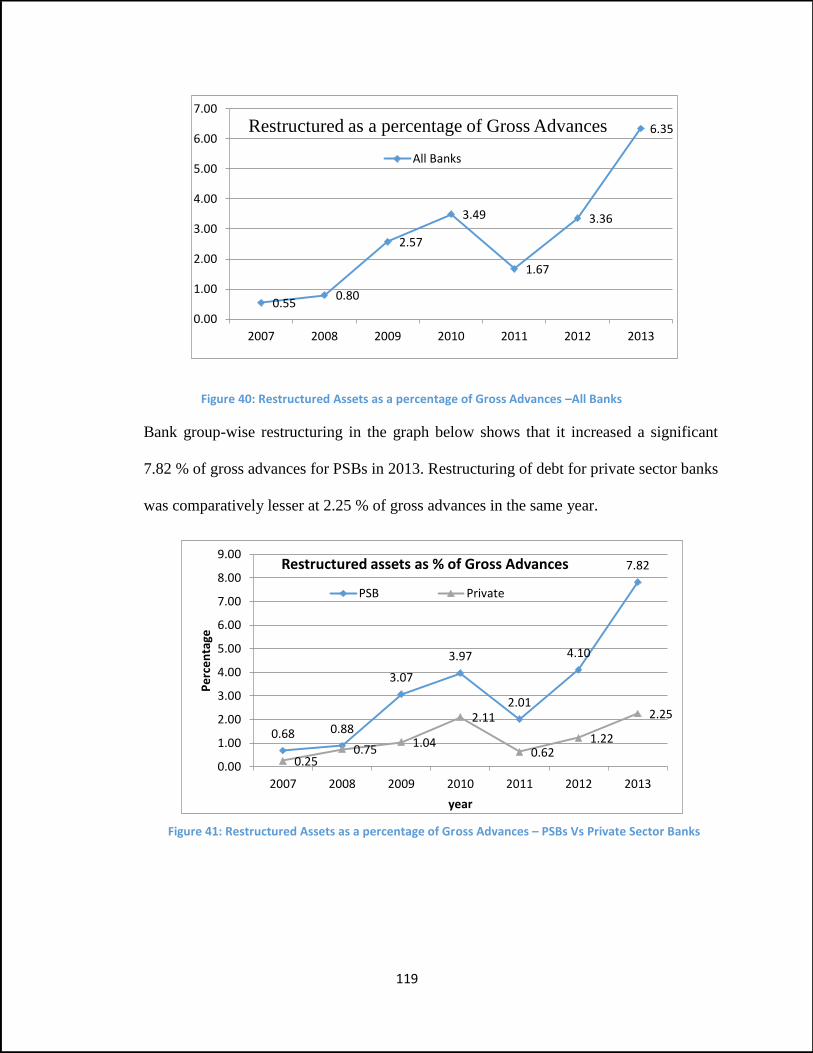
119
0.68 0.88
3.07
3.97
2.01
4.10
7.82
0.250.75
1.04
2.11
0.621.22
2.25
0.00
1.00
2.00
3.00
4.00
5.00
6.00
7.00
8.00
9.00
2007 2008 2009 2010 2011 2012 2013
Pe
rce
nta
ge
year
Restructured assets as % of Gross Advances
PSB Private
Figure 40: Restructured Assets as a percentage of Gross Advances –All Banks
Bank group-wise restructuring in the graph below shows that it increased a significant
7.82 % of gross advances for PSBs in 2013. Restructuring of debt for private sector banks
was comparatively lesser at 2.25 % of gross advances in the same year.
Figure 41: Restructured Assets as a percentage of Gross Advances – PSBs Vs Private Sector Banks
0.550.80
2.57
3.49
1.67
3.36
6.35
0.00
1.00
2.00
3.00
4.00
5.00
6.00
7.00
2007 2008 2009 2010 2011 2012 2013
Restructured as a percentage of Gross Advances
All Banks
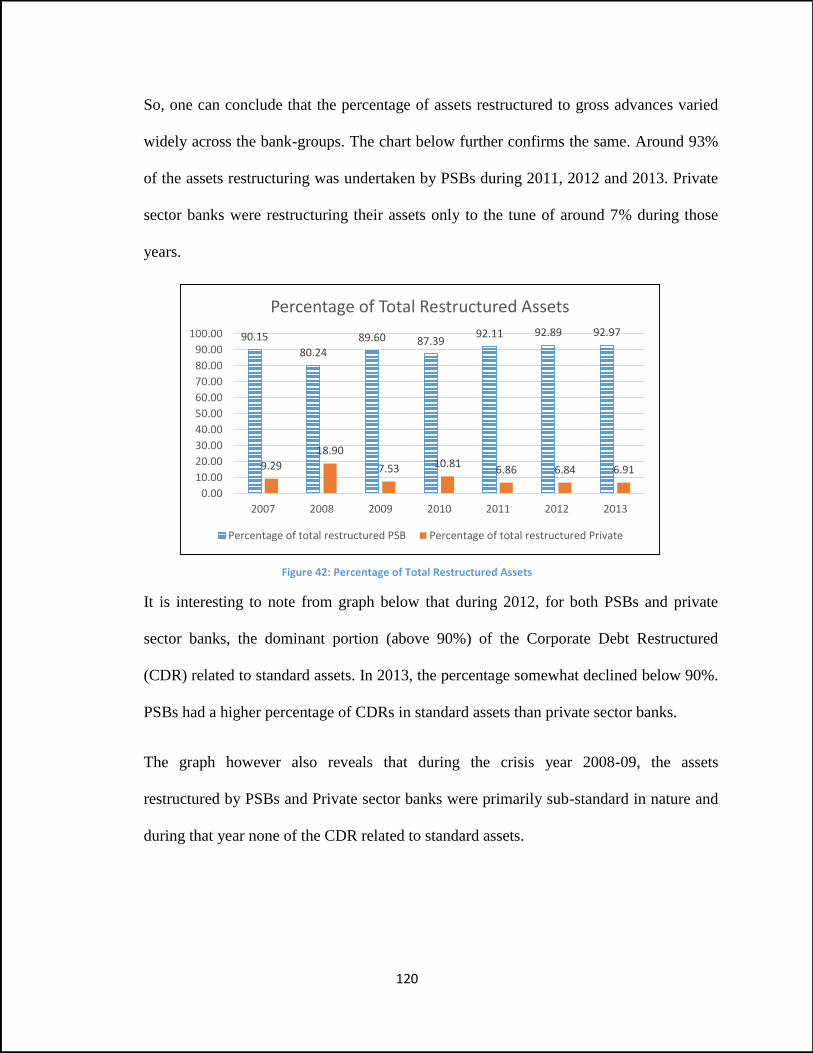
120
90.15
80.2489.60 87.39
92.11 92.89 92.97
9.29
18.90
7.53 10.816.86 6.84 6.91
0.00
10.00
20.00
30.00
40.00
50.00
60.00
70.00
80.00
90.00
100.00
2007 2008 2009 2010 2011 2012 2013
Percentage of Total Restructured Assets
Percentage of total restructured PSB Percentage of total restructured Private
So, one can conclude that the percentage of assets restructured to gross advances varied
widely across the bank-groups. The chart below further confirms the same. Around 93%
of the assets restructuring was undertaken by PSBs during 2011, 2012 and 2013. Private
sector banks were restructuring their assets only to the tune of around 7% during those
years.
Figure 42: Percentage of Total Restructured Assets
It is interesting to note from graph below that during 2012, for both PSBs and private
sector banks, the dominant portion (above 90%) of the Corporate Debt Restructured
(CDR) related to standard assets. In 2013, the percentage somewhat declined below 90%.
PSBs had a higher percentage of CDRs in standard assets than private sector banks.
The graph however also reveals that during the crisis year 2008-09, the assets
restructured by PSBs and Private sector banks were primarily sub-standard in nature and
during that year none of the CDR related to standard assets.

121
Figure 43: Bank group-wise corporate debt restructuring (CDR)
The percentage of CDRs in substandard assets was typically lower than those in doubtful
assets in post-crisis years. One important observation is that the CDRs in doubtful assets
increased to around 12.5% in 2011 and around 10% in 2013 for private sector banks.
While restructuring is important in difficult times like recession to help the borrowers (as
has been supported by RBI also during post-crisis era) but a huge amount of assets
restructured can be suggestive of the possibility of banks misusing the regulatory
forbearance for ever-greening of its loan assets.
54
492
0
2763720
5159 88585
2
410
105
53363
415
84
0
68
52
110
149
1026
0%
20%
40%
60%
80%
100%
2007 2008 2009 2010 2011 2012 2013
Pe
rce
nta
ge
Year
CDR: Private doubt_cdr sub_cdr std_cdr
10882085
0
15930 10504 28922 813373940
23365 268 206 373 995 4695
0%
10%
20%
30%
40%
50%
60%
70%
80%
90%
100%
2007 2008 2009 2010 2011 2012 2013
Pe
rce
nta
ge
Year
CDR: PSB doubt_cdr sub_cdr std_cdr

122
V. New Initiatives and recommendations for handling NPAs
Given the challenge the NPAs in Indian banks are posing, it has become very important for the
regulators to take immediate steps to resolve the problem. RBI has indeed prioritized NPA
resolution. It might be important to clean up the loan portfolios of banks in a way which is least
disruptive for the borrowers, the bank and for the economy as a whole. RBI’s discussion paper30
has proposed a whole lot of new measures to contain NPAs. In this section we would try to look
at these measures in the light of the RBI discussion paper. RBI discussion paper provided
recommendations which will motivate banks to early identify problem/stressed assets, to take
timely action to resolve the distress through restructuring for viable accounts, and to take
prompt steps for fair recovery/sale for unviable accounts.
One can classify NPA management into two broad categories: Preventive and Corrective. Let
us first discuss the preventive measures.
A) Preventive Measures:
1. Special Mention Accounts: RBI in its discussion paper encouraged banks to early detect any
stress emerging in its loan assets by creating three sub-categories under special mention
accounts. The categories would be SMA-1 and SMA-2 if the principal and interest payment
is overdue between 31-60 days and 61-90 days respectively. The classification of an asset
would be into SMA-0 category if there are signs of stress31 even if the principal and interest
payment is overdue for less than 30 days.
30 RBI, Jan 2014 “Early Recognition of Financial Distress, Prompt Steps for Resolution and Fair Recovery for Lenders: Framework for Revitalising Distressed Assets in the Economy” 31 Return of 3 or more cheques issued by borrower on grounds of non-availability of balance can be considered a stress signal. An illustrative list of signs of stress has been provided as annexure to the RBI discussion paper Jan 2014.
123
To help such detection, RBI required banks to maintain a proper Management Information
and Reporting system. Banks are required to have close monitoring of the SMA accounts and
initiate steps to rectify the deficiencies at the earliest.
In managing its credit risks banks should carry out its own independent and objective credit
appraisal and sensitivity tests/scenario analysis. It should ensure that equity capital of the
borrower company is not infused by the parent through its debt or that the names of the
directors/borrowers do not appear in defaulter lists.
2. Information Sharing: Since borrowers have better information about his own risk profile
than the lender and since lender has to operate with imprecise and estimated information, it
leads to moral hazard and adverse selection problems in lending. Such problems arising out
of information asymmetry can be handled by institutional arrangement in the form of Credit
Information Companies (CICs) which facilitates sharing of information about the borrowers
among the lenders. The benefits of such information sharing can be in the form of the having
greater pressure on a borrower to repay (since there would be a threat that if he defaults, he
will not get credit from any other lender), not missing out on safe borrowers, reducing credit
to over-debted borrowers and bringing efficiency in loan processing.
As per the recommendation of working group headed by Mr Siddiqui, Credit information
Bureau Limited (CIBIL), India’s first CIC was formed in 2000. The Credit Information
Companies (Regulation) Act, 2005 was enacted to bring a balance between efficient sharing
of the borrowers’ credit information among lenders and yet maintaining consumer
confidentiality.
RBI in 2014 discussion paper proposed setting up of a Central Repository of Information on
Large Credits (CRILC) to collect, store, and disseminate credit data to banks on credit
124
exposures of Rs. 5 crore and above. Banks are required to provide information about such
credit risks and their SMA status to CRILC.
3. Joint Lenders’ Forum (JLF): RBI mandated quick formation of lenders’ committee namely
JLF, for timely identification and formulation of corrective action plan (CAP) for early
resolution of stress when an asset is reported SMA-2 to CRILC. This would apply to
borrowers with an aggregate exposure (AE) of Rs100 crores or more. CAP by JLF would
include options like
a) Rectification: JLF can get specific commitments from borrower with identifiable cash
flows, it will regularize the account and prevent it from slipping into NPA category. For
others, JLF can attempt to help them come out of SMA status by trying to bring in a turn
around. It might consider finding strategic investor for the borrower/providing need based
finance etc.
b) Restructuring: If the borrower is not a willful defaulter and the account is viable, JLF can
take a timely decision (within 30 days) on restructuring the account through CDR mechanism
or independently, to prevent it from becoming an NPA.
In order to improve the restructuring process, RBI mandated Independent evaluation of
restructuring package for accounts with AE above Rs500 crore (within 30 days) followed by
timely approval by the lenders (in next 15 days).
Lenders and promoters should have fair share of losses. RBI suggested that restructuring
should be based on shareholders bearing the ‘first loss’ and that there would be more ‘skin in
the game’ of promoters. So restructuring can involve options like requiring promoters to
transfer equities to the lenders as compensation for their sacrifices; or requiring the
125
promoters to bring in more equity to help their company; or requiring promoters to transfer
their holdings to a security trustee (or an escrow) till the company turns around.
RBI also provided a temporary asset classification benefit as incentive for adherence to the
prescribed timeframe. It also brought in threat of accelerated provisioning/ supervisory
actions for banks concealing SMAs or ever-greening them.
4. Special waivers for Infrastructure project loans: Infrastructure projects involve long
gestation period and significant investments. So loans extended for infrastructure projects are
provided with special waivers in asset classification and provisioning norms32. But owing to
asset-liability mismatch concerns, banks would restrict their advances to a maximum of 12-
15 years. With initial repayment moratorium considered, this forced the repayments to be
within 10-12 years period. This was one of the important reasons causing stress in servicing
of the project loans for long term infrastructure projects. So in July 2014 RBI came with a
“flexible structuring” guideline to allow banks to structure longer repayment period (say 25
years) based on concession period/economic life of the project (to match with the project’s
cash flow generation), with periodic financing say every 5 years. Such refinancing would not
be considered ‘restructuring’. This required viability of the projects in terms of financial &
non-financial parameters to be assessed for the longer tenure. To take care of the liability
32 Some examples: At the time of loan sanction, banks must fix a date of commencement of the commercial operation (DCCO). Deferment of DCCO and consequent shift in repayment schedule is not considered as restructuring if the revised DCCO falls with two years of the original DCCO and the loan terms are unchanged. In case restructured, ‘Standard asset’ classification would continue if the account continues to be serviced as per restructuring terms, and the extension of DCCO is caused by delays due to court cases (up to 2 more years), due to reasons beyond promoter’s control (up to 1 more year). During the life time of the project after DCCO, banks may fix a ‘fresh amortization schedule’ once without being considered as ‘restructured’ based on reassessment of project cash flows. After the commencement of commercial operations of the project, the banks can refinance their loans by way of take-out finance with another bank/FIs and a longer repayment period can be fixed. This will not be considered as restructuring. Refinancing for an NPA would however be considered as restructuring. As far as provisioning is concerned, the Infrastructure loan accounts classified as ‘Substandard’ attracts lesser provisioning requirement (20 % compared to 25% for other unsecured loans) due to safeguards like escrow accounts available for such loans.
126
side, banks were given exemption from regulatory requirements like CRR, SLR, PSL etc for
raising long term funds (say, in the form of long term infrastructure bonds) to be used for
lending to infrastructure sector. These changes are expected to reduce the stress arising from
infrastructure sector and provide a fillip to the sector at the same time.
B) Corrective Measures:
If the above preventive measures fail and assets become NPA or the SMA accounts look
unviable, JLF is advised to decide upon an optimal recovery process through the channels of
recovery available. To speed up the recovery of bad loans in banks, recovery mechanisms
like DRTs and Sale of NPAs was sought to be strengthened in the following ways:
1. DRTs: RBI proposed the government to bring in special cadre of officers to handle the large
scale vacancies in DRTs with respect to presiding officers and recovery officers. It proposed
additional benches to be created for DRTs where backlog cases are huge and new DRTs to be
created for geographically large states with no DRTs. Accordingly GOI has announced
setting up of 6 new DRTs.
2. Asset Reconstruction Companies: RBI redefined the role of ARCs as a support mechanism
for handling NPAs with emphasis on asset reconstruction rather than asset stripping. So sale
of assets while in SMA-2 stage33 was also encouraged with a view to rehabilitate them. To
encourage early sale of NPAs, it allowed banks to reverse the excess provision on sale of
NPA if sale proceeds was higher than NBV and to spread the shortfall over 2 years if the sale
proceeds was lower than NBV. RBI introduced more liberal regulatory treatment of asset
sales. It also required ARCs to bring 15% minimum investment in Security Receipts (which
33 Currently NPAs has to be in the books of selling bank for at least 2 years to be eligible to be sold to ARCs
127
was earlier 5%)34. This step will increase the cash stake of ARCs in the assets purchased by
them. Though both SARFAESI and RDBF have been performing well in NPA recovery for
banks, another regulation namely ‘Enforcement of Security Interest and Recovery of Debts
Laws (Amendment) Bill, 2011’ was introduced to amend the two laws. This is expected to
strengthen the ability of the banks to recover their debts from the borrowers and hence bring
down the NPA levels in banks.
3. GOI has also advised PSBs to form a Board Level Committee for monitoring NPA recovery
and for taking steps to speed up the pace of recovery like placing early warning system,
appointing nodal officers for recovery, undertaking special drives for recovery of loss assets
etc.
RBI also required Board Oversight to take care that all the proposed solutions in January
2014 discussion paper are implemented by the bank like providing timely information to
CRILC, prompt formation of Joint Lenders’ Forum (JLF) for timely identification and
corrective action plan (CAP) for resolution, monitoring the progress, timely classification of
borrowers as willful/non-cooperative.
4. In order improve accountability of directors, promoters, auditors, advocates and strengthen
corporate governance in companies, RBI brought in certain prudential measures. It
introduced a ‘Non-Cooperative borrower’ classification to include those borrowers which do
not cooperate with their banks either in providing information on their finances or in
negotiating the repayment issues. Any new exposure to such borrower (or any company
where such a borrower is a promoter/director/manager) will necessitate higher provisioning.
A database was proposed be maintained and communicated to banks for ‘Wilful Defaulters’
as well as ‘Non-cooperative borrowers’. Information would also be shared on a) auditors
34 RBI guidelines dated August 5, 2014 on: Regulatory framework for SCs/RCs – Certain amendments
128
against whom there are complaints like falsification of accounts/ wrong certification of stock
statements, b) on advocates who wrongly certify clear title of assets, and c) on valuers who
overstate the security value.
5. Another new measure initiated by RBI is Strategic Debt Restructuring (SDR)35. This was
necessary because in spite of sacrifices made by the lender banks in the restructuring
packages, it was found that the borrowers were failing to meet the conditions stipulated in the
restructuring package and were not able to come out of stress. This would require the
restructuring packages to have a pre-condition that if the borrower company is unable to meet
the ‘viability milestones’ and/or fails to adhere to stipulated ‘critical conditions’, the lender
would have an option to convert the entire loan (including the unpaid interest) or part thereof
into equity shares in the company. The pricing formula for conversion is specified in the RBI
circular and would be exempt from SEBI’s 'Substantial Acquisition of Shares and Takeovers
and Issue of Capital and Disclosure Requirements Regulations, 2009'. The shares so acquired
by banks would be exempted from periodic mark-to-market requirements, investor-associate
disclosures, as well as regulatory ceilings/restrictions on Capital Market Exposures,
investment in Para-Banking activities and intra-group exposure. Post-conversion, all lenders
of JLF should collectively hold 51% or more of the equity shares of the company. They
should divest their holdings to a new promoter (not from the existing promoter group) as
soon as possible. On divestment, the asset would be upgraded to ‘standard’ classification.
The challenge here is to be able to find the new buyer within a period of 18 months because
if banks fail to find one within this period, the equity shares held will be marked to market
and the asset will slip back to NPA category.
35 June 2015, RBI, Strategic Debt Restructuring Scheme (RBI/2014-15/627, DBR.BP.BC.No.101/21.04.132/2014-15)
129
Banks are expected to exhaust all means of resolutions before writing off NPAs from their
books. But we have seen that write-offs played a dominant part in reduction of NPAs in Indian
banks, particularly during post-crisis years. This probably shows lack of efforts on their part
towards recovery or lack of confidence on their own abilities to resolve NPAs or lack of faith on
the regulatory environment of the country. RBI expects banks to disclose full details of the write-
offs.
VI. Challenges and Suggestive measures going forward:
Challenges at macro level: RBI January 2014 discussion paper is a credible job towards
preparing the banks as well as the business and regulatory environment for an effective and
efficient handling of NPA problem in banks. Let us try to put together some of the challenges to
NPA management in India.
a. Information Sharing: Sharing of information about the borrowers among the lenders has
been a big challenge in India. Credit Reports by CIBIL, one of the initial CICs in India,
has often been criticized for errors (Credit Sudhaar36). The challenges CICs face in India
are with respect to banks sharing credit information which are low on accuracy,
timeliness and completeness.
Banks are also not found to make a wholesome use of the data available from CICs in
their loan appraisal and loan granting process. Building a robust information sharing
framework can go a long way in reducing NPAs in the banking sector of the country.
Proposal to establish CRILC and RBI’s carrot and stick approach to make banks share
information can be expected to help the situation.
36 https://en.wikipedia.org/wiki/Credit_Sudhaar
130
b. Borrower friendly regulatory and legal environment: In India there are several legal
impediments to debt recovery. SICA (Sick Industrial Companies Act) and the BIFR
(Board for Industrial and Financial Reconstruction) constitute the bankruptcy code in
India and these have been the biggest legal hurdles in NPA recovery for banks. Corporate
houses and wilful defaulters have been taking refuge under these Acts. It provides the
defaulter with automatic stay from creditor enforcement thereby preventing banks from
legally proceeding against the defaulters. Out of 189 economies ranked by World Bank
on ‘Ease of doing business’ in 2014, India ranks 186 in enforcement of contracts and 135
in resolving insolvencies37. Time to resolve insolvency i.e. the number of years from the
filing for insolvency in court until the resolution of distressed assets in India has been
found to be 4.3 years during 2005-201538. A survey of 17 Indian states showed that after
insolvency, the proceedings a secured creditor on an average could recover was only
13.7% of the debt. The legal proceedings on an average cost the creditor around 8.5% of
estate value. This leaves a creditor with little incentive for engaging in recovery process.
A uniform bankruptcy code to replace BIFR and SICA is long overdue in the country.
India is expecting to get a new bankruptcy code by 2015-1639.
c. Due to weak legal mechanism for enforcement of contracts and non-existence/
malfunctioning of asset markets, disposal of mortgaged asset after the default by the
borrower becomes a time consuming process. According to All India Banks Employees
Association, around 4085 cases involving Rs70, 637 crore were locked up in courts in
legal battles as on Sep 2013. ‘Enforcement of Security Interest and Recovery of Debts
Laws (Amendment) Bill, 2011’ can play a positive role to minimise these difficulties.
37 http://www.doingbusiness.org/data/exploreeconomies/india#resolving-insolvency 38 World Bank, Doing Business project (http://www.doingbusiness.org/). 39 http://www.thehindu.com/business/budget/comprehensive-bankruptcy-code-proposed/article6946327.ece
131
d. Channels of recovery like DRTs are overburdened with backlog cases. They are under-
resourced particularly in terms of manpower. Many DRTs are without presiding officers
or adequate recovery officers. Typically DRTs are manned through people on deputation
from government departments who work with ARCs for very short periods. RBI’s
encouragement to Government for taking measures to bring in special cadre officers can
help in handling the manning problems. 6 new DRTs announced to be formed can be
expected to boost the NPA recovery process.
e. Rather than increasing the number of ARCs it is important to modify their ownership
structure, so as to avoid any misaligned incentives. ARCs in India also face the challenge
of having adequate specialized skills in distressed debt management. Pricing of impaired
assets is another challenge they experience in the face of absence of markets. The
problem stands aggravated with the absence of secondary markets for the physical assets
(offered as collaterals by the borrower). The new act namely ‘Enforcement of Security
Interest and Recovery of Debts Laws (Amendment) Bill, 2011 and RBI guidelines on
amending the regulatory framework for RCs/SCs (Aug 2014)40 requiring ARCs to
increase in their own stake in the entity to a minimum of 15% can be expected to go a
long way in taking care of some of these issues.
Challenges at micro level
a. The banks are often found to be slow on adoption of information technology for building
a robust mechanism and MIS for early detection of stressed assets. Such information can
help the bank take NPA preventive measures. The MIS can also come handy for
providing industry-wise NPA information, for handling NPA restructuring, for handling
NPA recovery through various channels/compromises as well as for NPA write-offs
40 Regulatory framework for SCs/RCs – Certain amendments
132
b. The banks, particularly the PSBs sometimes are found to lack competence and
professionalism needed for effective loan appraisals. The PSBs also have a problematic
incentive structure with threat of CVCs while granting loan or while resolving NPAs, low
compensations and short tenures. A lot of discussion on the same recently in the media
can be expected to bring a change in the structure in future.
c. The securities offered by the borrowers in secured debt have been often found to be
inadequate to cover the debt and sometimes the movable assets like stock are found to be
fake41. So RBI prudential norms require annual verification of stock or stock-audits and
once in three years valuation of collaterals like immovable properties. The condition
requires auditors to be more responsible in providing stock verification certificates and
valuers to be more responsible about valuing the immovable properties. The banks need
to be more careful about relying on the certificates/valuations and should go for
independent valuations if needed.
d. Political interference and manipulations: Credit can be concentrated in few, large
borrowers. Large borrowers with political connections have often been found to account
for a significant amount of NPAs in banks. So strong political will is required to act
against such borrowers. Bringing out defaulter list to name and shame them,
government’s action to investigate large NPA accounts in banks particularly in PSBs can
be said to be a move in positive direction.
VII. Conclusion
If NPAs in banks are not handled effectively and in time, it can lead to loss of confidence on the
performance of the banks. It can also have adverse macro-economic implications. Best way to
41 Asia Intelligence Wire from FT Information Jun 23, 2001
133
handle NPAs in banks is to take preventive measures particularly at the credit appraisal stage.
Once NPAs are generated, banks land up spending a significant amount their financial and
managerial resources to resolve the same. This leads to diversion of resources from more
productive use of resources in core business. This also makes them risk averse and more
inhibited in granting loans, which in turn affects their credit growth and hence their profitability.
It also creates dent into banks capital cushion. A dent in capital cushion of banks with a higher
capital adequacy requirements brought in by Basel-III, raised the debate on the need for
recapitalization of banks versus privatization of the same. The answer to handle the same was
however sought in strengthening the corporate governance in the banks. So, preventing and
handling NPAs in banks efficiently and effectively and maintaining them down to an acceptable
level would help banks improve their operational efficiency through removing the drag these can
bring on the profitability, capital adequacy, liquidity as well as their market perception.
Prevention can also be in the form of early detection, early rectification or prompt restructuring
of the stressed assets. Restructuring is one of the areas where RBI has been providing regulatory
forbearance in terms of allowing special concessions and asset classifications, in the face of
recession following global economic crisis of 2008. But one needs to careful about the potential
misuse of the regulatory forbearance for ever-greening of the assets. When prevention does not
work and NPAs are a reality, one has to look out for recovery the same.
In this section we found that in post-crisis years, the reduction of NPAs experienced weakness
particularly for PSBs. The reductions were dominated by write-offs and restructurings. In terms
of channels of recovery, SARFAESI turned out to be the most effectiveness mechanism in post-
crisis era.
134
A number of measures have been taken by RBI, Government and the banks to handle NPAs in
their own ways but a lot more needs to be done in the face of numerous challenges which still
pose the NPA handling problem in the country. A better institutional and legal environment as
well as micro-level prudence and control can help banks extend loans with lesser worries about
accumulating NPAs. While we can expect that the growth in the economy expected in coming
days will help banks come out of the NPA overhang, nevertheless it is important for the banks to
implement the micro-prudential measures and for the regulatory authorities to implement macro-
prudential measures to keep the NPAs in check.
Future Research: In India, it has been observed that the large borrowers are the biggest
defaulters in the banks. Very often they are willful defaulters. The top 30 NPAs of PSBs were
found to account for 40.2% of their GNPAs42 .The government getting into monitoring of the top
30 NPA accounts of PSBs substantiates the criticality of willful default by large borrowers43.
This is also evident in GOI and RBI requiring banks to come up with the names of willful
defaulters so as to name and shame them in public44. The banks have started disclosing
‘Percentage of Advances to 20 largest borrowers to Total Advances of the Bank’ only from
2009. A future research can therefore involve culling out this data from the annual reports of
banks to check empirically whether the concentration of credit in large borrowers can explain
NPAs in banks.
42 http://pib.nic.in/newsite/PrintRelease.aspx?relid=105066 43 http://www.moneycontrol.com/news/economy/top-30-npa-accountspsu-banks-under-govt-scanner-fm_974274.html 44 http://www.hindustantimes.com/business-news/govt-rbi-ask-banks-to-declare-names-of-wilful-defaulters-quickly/article1-1262665.aspx

135
Summary of all the findings in the study
At the outset of the study, seven specific research questions were sought to be addressed. In this
section all the findings from the study are sought to be summarized and put together.
The first question was: whether PSBs always bear the higher burden of NPAs than their private
sector counterparts. The analysis in Chapter I, Section VII showed that NPAs in PSBs were
statistically and significantly different from those in private sector banks. NPA burden was
actually lighter for PSBs compared to their private sector counterparts both in pre-crisis and
crisis years. It became heavier only in post-crisis years. So, one can say that NPA experience of
banks do vary depending upon their bank-group but PSBs not necessarily always bear a higher
burden.
The second question related to whether factors driving NPAs in PSBs were different from those
driving NPAs in Private sector banks. The effect of some factors were similar while that of
various other factors were different. At overall bank level for the entire period of study, there is
support found for the argument that better the quality of management, lesser would be the NPAs.
Operational efficiency was found to have worsening effect and Revenue efficiency however was
found to have favourable influence NPAs of PSBs. None of these variables were significant for
private sector banks. So one can say that lax credit appraisals and monitoring in PSBs due to
poor management quality has led to their higher NPAs.
Overall, factors which were found to drive NPAs for both PSBs and Private sector banks when
the entire period is covered, included ROA, foreign borrowings, Credit- deposit ratio. Capital
Adequacy ratio was not found to affect NPAs of either. It suggests that the moral hazard
hypothesis of going for higher loans when capital is small is not validated for Indian banks.
136
A high cost of borrowings was found to be able to explain higher NPAs in PSBs both during the
post-crisis and pre-crisis phases as well as for the overall period but the same did not hold true
for private sector banks in any of the phases or overall period. Larger size was found to lower
NPAs for private sector banks particularly in pre-crisis period. Size however did not have any
effect on NPAs in PSBs in any of the periods. A high Credit Deposit ratio can account for lower
NPAs for PSBs during pre-crisis period but not so for private sector banks. Advances to sensitive
sector have actually helped bring down the NPAs for PSBs during pre-crisis period probably due
to over-cautiousness brought in by RBI through its restrictions.
The fourth question was about the possible impact of secured loans and priority sector lending
on NPAs. At overall bank level, priority sector lending did influence NPAs but secured lending
did not. However when the sample was decomposed into PSBs and Private sector banks, secured
lending was found to lead to higher NPAs only for PSBs. The argument of priority sector
directed lending worsening loan portfolio of PSBs did not hold true though it was found to
worsen the loans of private sector banks.
To answer the third question, listed banks did not demonstrate an NPA behavior different from
unlisted banks and the factors driving the NPAs were also similar in line with the previous
findings for all banks.
The fifth question was about the effect of Macro-economic factors on NPAs. Factors like GDP
slowdown, fall in stock prices, increase in interest rates and fall in debt creating inflows were
indeed found to have played a very important role towards generating higher NPAs for banks
during the study period. However bank specific variables put together could explain the variation
137
in NPAs better than macro-economic variables (expressed in higher overall R square in the
model capturing bank level factors).
The sixth question on corporate governance was taken up in a separate chapter (chapter IV). The
results at the overall bank level show that ownership by ‘foreign institutional investors’,
‘Average percentage of meetings attended by the directors’ and ‘Board Size’ did play a
significant role in bringing down the level of NPAs in banks. Percentage of independent
Directors was however found to have an unexpected positive co-efficient though at 10% level of
significance. Block-holders average holdings and CEO-Chairman duality were not found to have
any influence on NPA levels. On breaking the sample into PSBs and Private Banks, however
reflects board size helped reduce NPAs for PSBs while FIIs help reduce NPAs for private banks.
Analysis based on pre-crisis and post crisis phases also brought forward some insightful results.
Foreign institutional investors played a very significant governance role in bringing the NPA
levels down for all bank groups in both the pre-crisis or post-crisis periods.
Block-holders, effectively the government ownership had a favourable role in PSBs in keeping
the NPAs low during the post-crisis phase. NPAs in private sector banks however did not go up
due to ownership concentration in either of the periods. But block holders on the other hand help
keep NPAs under check for old private banks. Diligence of directors expressed in their
attendance had some role in reducing NPAs in PSBs during pre-crisis but during post-crisis a
similar role was assumed by independence of directors instead. CEO-Chairman duality led to
increase in NPA levels for PSBs during pre-crisis phase and increase in NPAs for old private
sector banks in both the phases. So banks should avoid such duality in order to bring better
governance.
138
The seventh question on effectiveness of recovery channels was discussed in Chapter V.
Reduction of NPAs was found to experience weakness in post-crisis years particularly for PSBs.
The reductions were dominated by write-offs and restructurings. NPA recovery through channels
like Lok Adalats, DRTs, & SARFAESI were examined for a decade. Lok Adalats were the most
popular recovery mechanism in terms of number of cases. The use of all the three mechanisms
increased significantly in post-crisis years versus pre-crisis years, in terms of 'number of cases
involved’ in the recovery process. However, if one looks at the amount recovered, SARFAESI is
found to have played the most important role by helping banks recover a sum of Rs 276 billion
during pre-crisis years (2005 to 2008) which increased significantly to a sum of Rs 646 billion
during 2009 to 2013. ‘NPAs recovered as a percentage of amount involved’ was higher in pre-
crisis years than in the post-crisis years. The effectiveness of recovery declined significantly for
all the three mechanisms. In the post crisis years, SARFAESI was found to be most effective
mechanism among all the three alternatives available for recovering NPAs.
Bibliography
1. Andres, P. De, & Vallelado, E. (2008). Corporate governance in banking: The role of the
board of directors. Journal of Banking & Finance, 32(12), 2570–2580.
2. Arpa, M., Giulini, I., Ittner, A., & Pauer, F. (2001). The influence of macroeconomic
developments on Austrian banks: implications for banking supervision. BIS Paper, (1), 91–
116.
3. Babouček, I., & Jančar, M. (2005). Effects of Macroeconomic Shocks to the Quality of the
Aggregate Loan Portfolio. CNB Working Paper Series 1.
4. Barr, R. L. Seiford & T. Siems, 1994. “Forecasting Banking Failure: A Non-Parametric
Frontier Estimation Approach”, Researches Economiques de Lovain 60: 417-429
139
5. Beck, T., Demirgüç-Kunt, A., Levine, R., 2006. Bank concentration, competition, and
crises: first results. Journal of Banking and Finance 30, 1581–1603.
6. Berger, A. N., & Deyoung, R. (1997). Problem Loans and Cost Efficiency in Commercial
Banks. Journal of Banking and Finance, 21.
7. Berger, A. N., and G. F. Udell 1995. Relationship lending and lines of credit in small firm
finance. Journal of Business 68:351–382.
8. Berger, A. N., and G. F. Udell. 1990. Collateral, loan quality, and bank risk. Journal of
Monetary Economics 25:21-24.
9. Berle, A., Means, G., 1933. The Modern Corporation and Private Property. MacMillan, New
York.
10. Bhattacharyya, A., Lovell, C.A.K., Sahay, P., 1997. The impact of liberalization on the
productive efficiency of Indian commercial banks. European Journal of Operational
Research 98, 332–345.
11. Bikker, J. A., & H. Hu. (2002). Cyclical patterns in profits, provisioning and lending of
banks and procyclicality of the new Basel capital requirements. BNL Quarterly Review,
55(86/2002), 143–75.
12. Bock, R. De, & Demyanets, A. (2012). Bank Asset Quality in Emerging Markets :
Determinants and Spillovers. IMF Working Paper, WP/12/71(March).
13. Bofondi, M., & Ropele, T. (2011). Macroeconomic Determinants of Bad Loans: Evidence
from Italian banks (Vol. 89).
14. Boot, A. W. A., and A. V. Thakor. 1994. Moral hazard and secured lending in an infinitely
repeated credit market game. International Economic Review 35:899–920.
15. Borio, C., & Lowe, P. (2002). Asset prices, financial and monetary stability : Exploring the
nexus. BIS Working Papers, Bank for International Settlements, Basel, (No. 114).
16. Breuer J.B. (2006). Problem bank loans, conflicts of interest and institutions. Journal of
Financial Stability, 2, 266–285.
17. Brockman, P., Yan, X., 2009. Block ownership and firm-specific information. Journal of
Banking and Finance 33, 308–316.
18. Burkart, M., Gromb, D., Panunzi, F., 1997. Large shareholders, monitoring, and the value of
the firm. Quarterly Journal of Economics 112, 693–728.
140
19. Caprio, G., Laeven, L., Levine, R., 2007. Governance and bank valuation. Journal of
Financial Intermediation 16, 584–617.
20. Chakrabarty, K. C. (2013a). Infrastructure Financing By Banks in India: Myths and
Realities. Keynote Address Delivered by Dr. K.C. Chakrabarty, Deputy Governor at the
Annual Infrastructure Finance Conclave Organised by SBI Capital Markets Limited at Agra
on August 9, 2013, 1–15.
21. Chakrabarty, K. C. (2013b). Two Decades of Credit Management in Indian Banks: Looking
Back and Moving Ahead. Address Delivered by Dr. K. C. Chakrabarty, Deputy Governor,
Reserve Bank of India at BANCON 2013 on November 16, 2013 in Mumbai. 1–36.
22. Choudhry Tanveer Shehzad, Jakob de Haanc, Bert Scholtens. 2010. The impact of bank
ownership concentration on impaired loans and capital adequacy. Journal of Banking and
Finance.
23. Das, A., Kumbhakar, S.C., 2012. Productivity and efficiency dynamics in Indian banking:
An input distance function approach incorporating quality of inputs and outputs. Journal of
Applied Econometrics 27, 205–234
24. Demirgüç-Kunt A., and Detragiache E. 1998. The Determinants of Banking Crises:
Evidence from Developed and Developing Countries. IMF Staff papers 45 (1).
25. Demirgüç-Kunt, A., Detragiache, E., 2002. Does deposit insurance increase banking system
stability? An empirical investigation. Journal of Monetary Economics 49, 1373–1406.
26. Demsetz, H., Lehen, K., 1985. The structure of corporate ownership: causes and
consequences. Journal of Political Economy 93, 1155–1177.
27. Dinc, I. S. 2005. Politicians and banks: Political influences on government-owned banks in
emerging markets. Journal of Financial Economics 77:453–479.
28. Elyasiani, E., Jia, J.J., 2008. Institutional ownership stability and BHC performance. Journal
of Banking and Finance 32, 1767–1781.
29. Espinoza, R., & Prasad, A. (2010). Nonperforming Loans in the GCC Banking System and
their Macroeconomic Effects. IMf Working Paper, Middle East and Central Asia
Department, October(WP/10/224).
30. ET Bureau. 20 Jun 2014. NPAs render 24 PSBs Ineligible For Rs50,000 Crore EPFO
Investments. Economic Times.
141
31. Festić, M., Kavkler, A., & Repina, S. (2011). The macroeconomic sources of systemic risk
in the banking sectors of five new EU member states. Journal of Banking & Finance, 35(2),
310–322. http://doi.org/10.1016/j.jbankfin.2010.08.007
32. Financial Stability Reports, RBI ( various years)
33. Fofack, H. (2005). Non-performing Loans in Sub-Saharan Africa: Causal Analysis and
Macroeconomic Implications. World Bank Policy Research Working Paper, No. 3769, 1–36.
http://doi.org/10.1596/1813-9450-3769
34. Gambera, M. (2000). Simple Forecasts of Bank Loan Quality in the Business Cycle.
Emerging Issues Series, Supervision and Regulation Federal Reserve Bank of Chicago April
2000 ( S & R-2000-3 ), (April).
35. Gerlach, S., Peng, W., & Shu, C. (2005). Macroeconomic conditions and banking
performance in Hong Kong SAR: A panel data study. BIS Papers, Bank for International
Settlements, Basel, (No. 22).
36. Gomes, A.R., Novaes, W., 1999. Multiple Large Shareholders in Corporate Governance.
Working Paper. The Wharton School, Philadelphia, PA.
37. Gomes, A.R., Novaes, W., 2005. Sharing of Control as a Corporate Governance Mechanism.
PIER Working Paper No. 01-029.
38. Hoggarth, G., Sorensen, S., & Zicchino, L. (2005). Stress tests of UK banks using a VAR
approach. Bank of England Quarterly Bulletin, 45(4), 478.
39. Iannotta, G., Giacomo, N., Sironi, A., 2007. Ownership structure, risk and performance in
the European banking industry. Journal of Banking and Finance 31, 2127–2149.
40. Jia, C., 2009. The effect of ownership on the prudential behavior of banks. The case of
China. Journal of Banking and Finance 33, 77–87.
41. Jimenez, G., & Saurina, J. (2005). Credit cycles, credit risk, and prudential regulation.
Banco de Espana, (January).
42. Jimenez, G., V. Salas, and J. & Saurina. 2006. Determinants of collateral. Journal of
Financial Economics, 81 (2):255-281.
43. Kalirai, H., & Scheicher, M. (2002). Macroeconomic Stress Testing : Preliminary Evidence
for Austria. Austrian National Bank Financial Stability Report, May(3), 58–74.
44. Keeton, W. R., & Morris, C. S. (1987). Why banks’ loan losses differ. Economic Review,
May, 3–21.

142
45. Kirkpatrick, G. (2009). The Corporate Governance Lessons from the Financial Crisis.
Financial Market Trends @ OECD 2009, I(February), 1–30.
46. Klein, N. (2013). Non-Performing Loans in CESEE : Determinants and Impact on
Macroeconomic Performance. IMF Working Paper, European Department, P/13/72(March).
47. La Porta, R., F. Lopez-de-silanes, and A. Shleifer. 2002. Government Ownership of Banks.
The Journal of Finance LVII (1):265-301.
48. Laeven, L. Valencia, F. 2008. Systematic banking crises, a new database. IMF WP/08/224.
49. Laeven, L.A., Levine, R., 2008. Bank Governance, Regulation, and Risk Taking. NBER
Working Paper No. 14113.
50. Leitner Y.2006. Using Collateral to Secure Loans, Business Review Q2
51. Lokare, S. M. (2014). Re-emerging Stress in the Asset Quality of Indian Banks : Macro-
Financial Linkages. RBI WORKING PAPER SERIES, WPS (DEPR)(February).
52. Louzis, D. P., Vouldis, A. T., & Metaxas, V. L. (2012). Macroeconomic and bank-specific
determinants of non-performing loans in Greece: A comparative study of mortgage, business
and consumer loan portfolios. Journal of Banking & Finance, 36(4), 1012–1027.
http://doi.org/10.1016/j.jbankfin.2011.10.012
53. Macey, J.R. & M. O’Hara (2003). The corporate governance of banks. FRBNY Economic
Policy Review, 9, 91–107.
54. Manove, M., and A. J. Padilla. 2001. Collateral versus project screening: a model of lazy
banks. RAND Journal of Economics 32:726–744.
55. Messai, A. S. (2013). Micro and Macro Determinants of Non-performing Loans, 3(4), 852–
860.
56. Mishra, R. N., S. Majumdar, and D. Bhandia. 2013 Jan. Banking Stability - A Precursor to
Financial Stability. In RBI WORKING PAPER SERIES: RBI.
57. Nkusu, M. (2011). Nonperforming Loans and Macrofinancial Vulnerabilities in Advanced
Economies. IMF Working Paper. Strategy, Policy, and Review Department, July.
58. Pain, D. (2003). The provisioning experience of the major UK banks : a small panel
investigation.
59. Park, S., Peristiani, S., 2007. Are bank shareholders enemies of regulators or a potential
source of market discipline? Journal of Banking and Finance 31, 2493–2515.
143
60. Pathan, S., 2009. Strong boards, CEO power and bank risk-taking. Journal of Banking and
Finance 33, 1340–1350.
61. Podpiera, J., & Weill, L. (2008). Bad luck or bad management? Emerging banking market
experience. Journal of Financial Stability, 4(2), 135–148.
http://doi.org/10.1016/j.jfs.2008.01.005
62. PTI. Aug 8, 2014. Syndicate Bank CMD S K Jain, Bhushan Steel Ltd MD Neeraj Singal
sent to police custody. Economic Times.
63. PTI. August 23 Chidambaram for below 51% Govt equity in banks 1998 [cited August 23].
Available
fromhttp://www.indianexpress.com/res/web/pIe/ie/daily/19980823/23550424.html.
64. Qi Liang, Pisun Xu, and P. Jiraporn. 2013. Board characteristics and Chinese bank
performance. Journal of Banking & Finance 37:2953–2968.
65. Quagliariello M. (2006). Bank’s riskiness over the business cycle: A panel analysis on
Italian intermediaries. Temi Di Discussione Series, (599).
66. Rajan, R., Dhal, S., 2003. Non-performing loans and terms of credit of public sector banks
in India: an empirical assessment. Reserve Bank of India Occasional Paper 24, 81–121
67. Rajaraman I. and G. Vasishtha, Non-Performing Loans of PSU Banks: Some Panel Results,
Economic and Political Weekly, Vol. 37, No. 5, Money, Banking and Finance (Feb. 2-8,
2002), pp. 429-431+434-435: examined 27 Indian PSBs from 1999-2000 and found
operating efficiency to be one the determinants of NPA but they also found that operating
efficiency cannot fully explain higher than average NPAs.
68. RBI August 2013, ‘Study on banking structure in India’
69. RBI working paper series, S. M. Lokare, 2014 “Re-emerging Stress in the Asset Quality of
Indian Banks: Macro-Financial Linkages”
70. RBI, 2013, Income Recognition, Asset Classification, Provisioning & Other Related Matters
Contents
71. RBI, August 05, 2014, Regulatory framework for SCs/RCs – Certain amendments,
https://rbidocs.rbi.org.in/rdocs/notification/PDFs/CIR164NTF060814.pdf
72. RBI, Feb 2014, Framework for Revitalising Distressed Assets in the Economy - Refinancing
of Project Loans, Sale of NPA and Other Regulatory Measures
73. RBI, Financial Stability Reports
144
74. RBI, Jan 2014 “Early Recognition of Financial Distress, Prompt Steps for Resolution and
Fair Recovery for Lenders: Framework for Revitalising Distressed Assets in the Economy”
75. RBI, July 2012, Report of the Working Group to Review the existing prudential guidelines
on restructuring of advances by banks/financial institutions
76. RBI, July 2014, Flexible Structuring of Long Term Project Loans to Infrastructure and Core
Industries (RBI/2014-15/126, DBOD.No.BP.BC.24/21.04.132/2014-15)
77. RBI, June 2014, Strategic Debt Restructuring Scheme (RBI/2014-15/627,
DBR.BP.BC.No.101/21.04.132/2014-15)
78. RBI, May 2014, Report of the committee to Review Governance of Boards of Banks in
India , Reserve Bank of India: Various Statistical tables related to banks in India
79. RBI, September 2002, Guidelines on preventing slippage of NPA accounts
80. RBI, Trends and Progress, Various years
81. RBI, Working Group (Chairman: Shri B. Mahapatra) for Review the Existing Prudential
Guidelines on Restructuring of Advances by Banks/Financial Institutions
82. RBI. 2014. Master-Circular: Prudential norms on Income Recognition, Asset Classification
and provisioning pertaining to Advances, edited by RBI. India.
83. RBI-Discussion Paper. 2013. Banking Structure in India - The Way Forward
84. Reinhart, C., Rogoff, K., 2010. From Financial Crash to Debt Crisis. NBER Working Paper
15795.
85. Reserve Bank of India: Reports on Trends and Progress of Banking in India – Various years
86. Rossi, S. P. S., Schwaiger, M., & Winkler, G. (2005). Managerial behavior and cost / profit
efficiency in the banking sectors of Central and Eastern European countries, (March).
87. Salas, V., & Saurina, J. (2002). Credit risk in two institutional regimes : Spanish commercial
and savings banks. Journal of Financial Services Research, 22(3), 203–224.
88. Sarkar and Bhaumik (1998), Sarkar et al. (1998) and Bhaumik and Dimova (2004)
89. Shleifer, A., Vishny, R.W., 1986. Large shareholders and corporate control. Journal of
Political Economy 94, 461–488.
90. Shleifer, A., Vishny, R.W., 1997. A survey of corporate governance. Journal of Finance 52,
737–783.
145
91. Shu Chang. (2002). The Impact of Macroeconomic Environment on the Asset Quality of
Hong Kong’s Banking Sector. Hong Kong Monetary Authority Research Memorandums,
(December).
92. Subbarao D. Dr., Governor, Reserve Bank of India, Speaking notes at the FICCI-IBA
Annual Banking Conference in Mumbai on August 13, 2013
93. Subbarao, D (2011): Financial Regulation for Growth, Equity and Stability in the Post-Crisis
World, Reserve Bank of India Monthly Bulletin; December
94. Subbarao, D. Banking Structure in India Looking Ahead by Looking Back 1. In speaking
notes of Dr. Duvvuri Subbarao, Governor, Reserve Bank of India (pp. 1–31). Mumbai:
FICCI-IBA Annual Banking Conference.
95. Tabak, B.M., Tecles, P.L., 2010. Estimating a Bayesian stochastic frontier for the Indian
banking system. International Journal of Production Economics 125, 96– 110.
96. Valencia, F., & Laeven, L. (2008). Systemic Banking Crises: A New Database. IMF
Working Papers, 08(224), 1. http://doi.org/10.5089/9781451870824.001
97. Williams, J. (2004). Determining management behaviour in European banking. Journal of
Banking & Finance, 28(10), 2427–2460. http://doi.org/10.1016/j.jbankfin.2003.09.010