australia’s identified mineral resources 2016d28rz98at9flks.cloudfront.net/100121/100121_aimr...
TRANSCRIPT
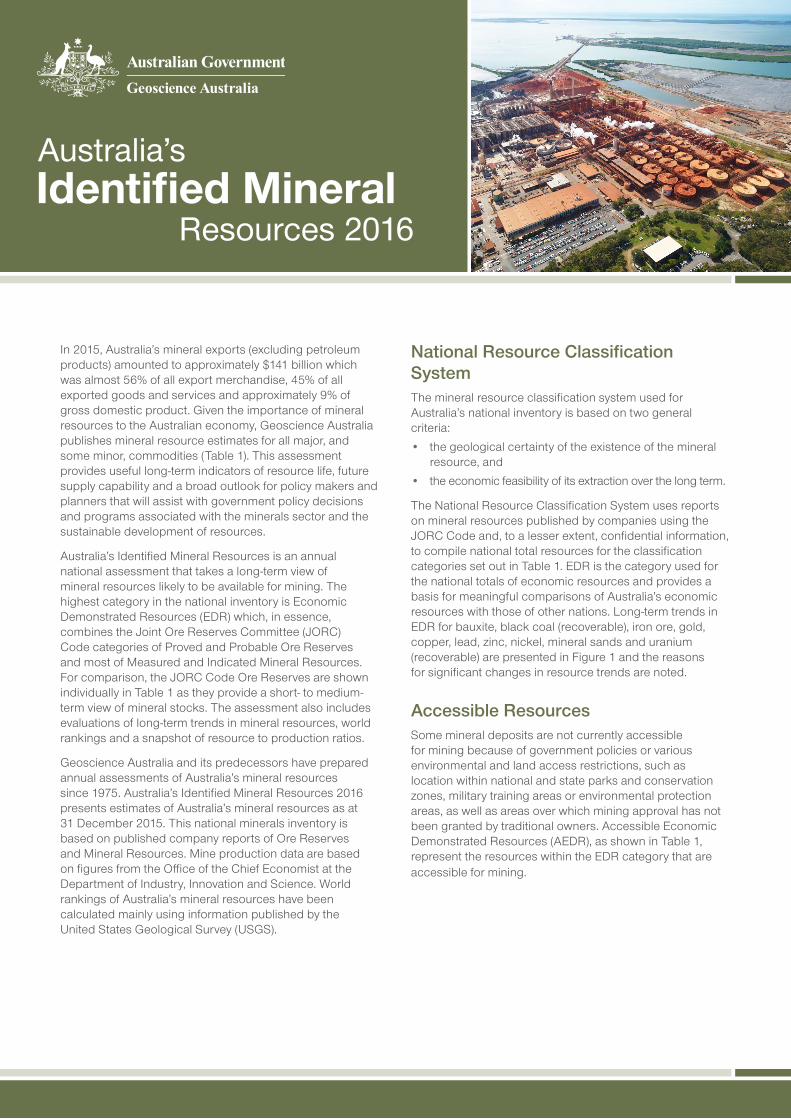
Australia’sIdentified Mineral
Resources 2016
In 2015, Australia’s mineral exports (excluding petroleum products) amounted to approximately $141 billion which was almost 56% of all export merchandise, 45% of all exported goods and services and approximately 9% of gross domestic product. Given the importance of mineral resources to the Australian economy, Geoscience Australia publishes mineral resource estimates for all major, and some minor, commodities (Table 1). This assessment provides useful long-term indicators of resource life, future supply capability and a broad outlook for policy makers and planners that will assist with government policy decisions and programs associated with the minerals sector and the sustainable development of resources.
Australia’s Identified Mineral Resources is an annual national assessment that takes a long-term view of mineral resources likely to be available for mining. The highest category in the national inventory is Economic Demonstrated Resources (EDR) which, in essence, combines the Joint Ore Reserves Committee (JORC) Code categories of Proved and Probable Ore Reserves and most of Measured and Indicated Mineral Resources. For comparison, the JORC Code Ore Reserves are shown individually in Table 1 as they provide a short- to medium-term view of mineral stocks. The assessment also includes evaluations of long-term trends in mineral resources, world rankings and a snapshot of resource to production ratios.
Geoscience Australia and its predecessors have prepared annual assessments of Australia’s mineral resources since 1975. Australia’s Identified Mineral Resources 2016 presents estimates of Australia’s mineral resources as at 31 December 2015. This national minerals inventory is based on published company reports of Ore Reserves and Mineral Resources. Mine production data are based on figures from the Office of the Chief Economist at the Department of Industry, Innovation and Science. World rankings of Australia’s mineral resources have been calculated mainly using information published by the United States Geological Survey (USGS).
National Resource Classification SystemThe mineral resource classification system used for Australia’s national inventory is based on two general criteria:
• the geological certainty of the existence of the mineral resource, and
• the economic feasibility of its extraction over the long term.
The National Resource Classification System uses reports on mineral resources published by companies using the JORC Code and, to a lesser extent, confidential information, to compile national total resources for the classification categories set out in Table 1. EDR is the category used for the national totals of economic resources and provides a basis for meaningful comparisons of Australia’s economic resources with those of other nations. Long-term trends in EDR for bauxite, black coal (recoverable), iron ore, gold, copper, lead, zinc, nickel, mineral sands and uranium (recoverable) are presented in Figure 1 and the reasons for significant changes in resource trends are noted.
Accessible ResourcesSome mineral deposits are not currently accessible for mining because of government policies or various environmental and land access restrictions, such as location within national and state parks and conservation zones, military training areas or environmental protection areas, as well as areas over which mining approval has not been granted by traditional owners. Accessible Economic Demonstrated Resources (AEDR), as shown in Table 1, represent the resources within the EDR category that are accessible for mining.

Australia’s Identified Mineral Resources 20162
Table 1 Australia’s resources of major minerals and world figures as at December 2015.
Commodity Unit
Australia World
JORC Reserves (a) (% of Accessible
EDR)
Demonstrated ResourcesInferred
Resources (c)
Accessible EDR (d)
Mine Production
2015 (e)
Economic Resources
2015 (f)
Mine Production
2015 (g)Economic (EDR) (b)
Subeconomic
Para-marginal
Sub-marginal
Antimony kt Sb 66.3 (42%) 159.3 8.8 0 191.7 159.3 3.7* 2000 150
Bauxite Mt 2300 (38%) 6021 144 1429 1954 6021 80.91 27 500 274
Black Coal
In situ Mt 83 324 1407 4277 101 145
Recoverable Mt 20 731 (34%) 68 310 1058 3818 78 715 61 428 539* 699 000* 6901.3*
Brown Coal
In situ Mt 92 887 44 069 234 987 124 326
Recoverable Mt n.a. 76 508 41 112 215 449 103 579 66 439 65.4* 286 000* 807.4*
Chromium kt Cr 0 0 302 0 6786 0 * >480 000 30 000
Cobalt kt Co 482 (47%) 1033 320 25 1238 1033 * 7100 124
Copper Mt Cu 23.67 (27%) 88.75 1.27 0.55 51.82 88.75 0.971 720 18.7
Diamond Mc 84.61 (40%) 209.44 0 0 42.53 209.44 13.561 700 128.7
Fluorine kt F 0 343 505 6 2301 343 0 122 000* >3000*
Gold t Au 3552 (37%) 9546 227 75 4632 9516 278 57 000 3186
Iron
Iron ore Mt 21 903 (42%) 51 545 7967 1510 86 429 51 545 811 183 000 3300
Contained iron Mt Fe 10 244 (43%) 23 985 2796 515 38 562 23 985 502 85 000
Lead Mt Pb 11.30 (32%) 35.29 3.00 0.14 21.04 35.29 0.65 89 4.7
Lithium kt Li 851 (53%) 1610 0 0 426 1610 * 14 500 32.5*
Magnesite Mt MgCO3 37.5 (12%) 321.66 21.90 35.00 849.74 321.66 * 8300 >28*
Manganese Ore Mt 120.4 (52%) 232.9 23.1 167.0 379.7 232.9 7.5 1667 52
Mineral Sands
Ilmenite Mt 49.2 (33%) 267.8 26.2 0.03 258.6 150.2 0.906 1472.8 10.69
Rutile Mt 10.8 (40%) 36.9 0.3 0.06 43.1 27.2 0.320 68.5 0.66
Zircon Mt 20.3 (42%) 81.4 1.1 0.07 74.9 48.2 0.601 121.12 2.43
Molybdenum kt Mo 3.6 (2%) 190 1220 0.5 609 190 0 11 000 267
Nickel Mt Ni 6.4 (34%) 18.8 3.6 0.1 19.4 18.8 0.235 79 2.54
Niobium kt Nb 116 (40%) 287 15 0 418 287 * >45 000 56
Oil Shale GL 0 0 213 2074 1472 0 0 760 934* n.a.
PGE (Pt, Pd, Os, Ir, Ru, Rh)
t metal 0 5.3 140.4 1.4 168.6 2.6 * 66 000 386
Phosphate
Phosphate rock*
Mt 289 (27%) 1072 312 0 2461 1072 * 69 000 223
Contained P2O5 Mt P2O5 51 (27%) 188 53 0 399 188
Potash Mt K2O 0 32.4 0 0 196.4 32.4 0 3700 38.8
Rare Earths (REO & Y2O3)
Mt 2.12 (62%) 3.44 0.35 29.22 26.19 3.44 * 130 0.12
Silver kt Ag 26.07 (29%) 88.68 1.79 0.49 41.14 88.68 1.373 575 27.0
Tantalum kt Ta 29.1 (42%) 69.2 6.7 0.2 31.4 69.2 * >100 1.2
Thorium kt Th 0 0 129.6 0 514.3 0 0 n.a n.a
Tin kt Sn 269 (62%) 434 65 31 316 434 7.2* 4900 270
Tungsten kt W 225 (56%) 403 0.8 5 236 403 0.35* 3610 87.3
Uranium kt U 324 (27%) 1287 13 19 920 1217 5.637 3815 60.5*
Vanadium kt V 1341 (74%) 1802 14 677 1688 16 633 1802 0 15 000 79.4
Zinc Mt Zn 23.68 (38%) 62.58 0.62 0.75 25.66 62.58 1.611 205 13.4
www.ga.gov.au 3
Abbreviationst = tonne; kt = kilotonne (1000 t); Mt = million tonne (1 000 000 t); Mc = million carat (1 000 000 c); GL = gigalitre (1 000 000 000 L); n.a. = not available.
Notesa. Joint Ore Reserves Committee (JORC) Proved and Probable Ore
Reserves as stated in company annual reports and reports to the Australian Securities Exchange.
b. Economic Demonstrated Resources (EDR) includes JORC Reserves, Measured and Indicated Resources.
c. Total Inferred Resources in economic, subeconomic and undifferentiated categories.
d. Accessible Economic Demonstrated Resources (AEDR) is the portion of total EDR that is accessible for mining. AEDR does not include resources that are inaccessible for mining because of environmental restrictions, government policies or military lands.
e. Source: Office of the Chief Economist, Department of Industry, Innovation and Science (Resources and Energy Quarterly March 2016), unless otherwise stated.
f. Source: Geoscience Australia and the USGS (Mineral Commodity Summaries 2016), unless otherwise stated.
g. Source: USGS (Mineral Commodity Summaries 2016), unless otherwise stated.
Antimony: Mine production sourced from Mandalay Resources Corp for the Costerfield operation.
Black Coal: Australian mine production refers to raw coal. World economic resources dated 2014, sourced from the Federal Institute for Geosciences and Natural Resources, Germany (Energy Study 2015). World mine production sourced from International Energy Agency (Coal Information 2016).
Brown Coal: Australian mine production 2015 and world mine production sourced from International Energy Agency (Coal Information 2016). World economic resources dated 2014, sourced from the Federal Institute for Geosciences and Natural Resources, Germany (Energy Study 2015).
Chromium: The Western Australia Department of Mines and Petroleum reported 0 t of production during 2014–15.
Cobalt: The Western Australia Department of Mines and Petroleum reported 6.03 kt of production in 2014–15.
Diamond: World resource figures are for industrial diamonds only; no data provided for resources of gem diamonds.
Fluorine: World mine production 2015 excludes the USA.
Gold: World mine production 2015 sourced from the World Gold Council.
Lithium: Australian mine production is not publically reported by mining companies. However, the Western Australia Department of Mines and Petroleum reported combined tin, tantalum and lithium production of $192 167 483 in 2015. World mine production excludes the USA.
Magnesite: The South Australia Department of State Development reported magnesite production of 4650 t in 2015. The Queensland Department of Natural Resources and Mines reported magnesite production of 658 562 t in 2014–15. World mine production 2015 excludes the USA.
Niobium: Australian mine production not publically reported by mining companies.
Oil Shale: World resources and world production estimates from World Energy Council (Survey of Energy Resources 2013).
PGE: The Western Australia Department of Mines and Petroleum reported 464 kg platinum and palladium for 2014–15.
Phosphate: Phosphate rock is reported as being economic at grades ranging from 8.7% to 30.2% P2O5. Christmas Island mined 674 757 t in 2015. The Queensland Department of Natural Resources and Mines reported phosphate production of 1 025 860 t in 2014–15. Minor production (1861 t) was recorded in South Australia.
Rare Earths: Mount Weld in Western Australia supplies rare earth concentrates to the Lynas Advanced Materials Plant (LAMP) in Malaysia. In 2015, LAMP produced 10 900 t of ready-for-sale rare earth oxides.
Tantalum: Australian mine production is not publically reported by mining companies. However, the Western Australia Department of Mines and Petroleum reported combined tin, tantalum and lithium production of $192 167 483 in 2015.
Tin: Mine production 2015 estimated at approximately 7210 t, based on 2015 figures released for the Renison operation (Tasmania) and 2014–2015 tin concentrate figures for Queensland operations from the Department of Natural Resources and Mines, Queensland. Tin production from Western Australia is not included as figures are not available.
Tungsten: Mine production 2015 estimated at approximately 348 t, based on figures released for the Kara operation (Tasmania) and by the Department of Natural Resources and Mines, Queensland, for 2014–15.
Uranium: World economic resources sourced from the International Atomic Energy Agency estimate for Reasonably Assured Resources recoverable at costs of less than US$130/kg U and Geoscience Australia. World production for 2015 sourced from the World Nuclear Association (World Uranium Mining Production, July 2016 update).
The JORC Code is specified in The Australasian Code for Reporting of Exploration Results, Mineral Resources and Ore Reserves (www.jorc.org).
The full publication of the National Resource Classification System can be found here http://www.ga.gov.au/corporate_data/78988/78988_AIMR_2013.pdf
Australia’s Identified Mineral Resources 20164
Commodity OverviewAustralia’s EDR of the following 20 mineral commodities increased during 2015: antimony, black coal, brown coal, gold, iron ore, ilmenite, lead, lithium, magnesite, manganese ore, niobium, potash, rare earths, rutile, silver, tantalum, tin, tungsten, uranium and zircon. EDR for chromium, copper, nickel, molybdenum, oil shale, phosphate and zinc remained at levels similar to those previously reported. The EDR of four commodities decreased in 2015: bauxite, cobalt, diamond and vanadium.
Australia’s EDR of diamond, gold, iron ore, lead, nickel, rutile, tantalum, uranium, zinc and zircon are the world’s largest, while antimony, bauxite, black coal, brown coal, cobalt, copper, ilmenite, lithium, magnesite, manganese ore, niobium, rare earths, silver, thorium, tin, tungsten and vanadium all rank in the top five worldwide (Table 2).
Bauxite: Australia’s EDR of bauxite were estimated to be 6021 Mt in 2015, down from a peak of 6464 Mt in 2013. Australia ranks second in the world behind the Republic of Guinea and ahead of Brazil, Vietnam, Jamaica and Indonesia. Australia was the world’s leading producer of bauxite in 2015, the second largest producer of alumina and the sixth largest producer of aluminium. Australia’s aluminium industry is underpinned by vast resources of bauxite at Cape York in Queensland (3250 Mt, 54% of national EDR), Gove in the Northern Territory (187 Mt, 3%) and a large number of deposits in the Darling Range southeast of Perth in Western Australia (2606 Mt, 43%).
Australia’s aluminium industry continues to be a highly integrated sector of mining, refining, smelting and semi-fabrication and is of major economic importance nationally and globally. In recent years, however, processing costs have made some operations unviable, leading to the closure of the Kurri Kurri aluminium smelter (New South Wales) in 2012 and the Point Henry aluminium smelter (Victoria) in 2014, as well as the Gove alumina refinery (Northern Territory), also in 2014. Conversely, there has been a move by industry to Direct Shipping Ore and new bauxite mines aiming to supply Chinese alumina refineries have recently started in Tasmania and Cape York.
Black Coal: In 2015, the estimate of Australia’s recoverable EDR of black coal was revised upwards to 68 310 Mt, an increase of 9% from the previous year. In 2015, Australia was globally ranked fifth, behind the United States, China, India and Russia for recoverable economic coal resources and fourth as a producer, behind China, the United States and India.
Most of Australia’s black coal EDR is located in Queensland (60%) and New South Wales (37%): 34% and 30% of recoverable EDR is located in the Bowen (Queensland) and Sydney (New South Wales) basins, respectively. These basins also dominate black coal production. Significant black coal resources are also found in the Surat, Clarence-Moreton and Galilee basins in Queensland and in the Gunnedah Basin in New South Wales. At 2015 rates of production, Australia’s black coal Accessible EDR will support more than 110 years of production.
In 2015, EDR for black coal increased at 34 deposits and decreased at 48 deposits, with most decreases owing to small quantities of mine depletion. There were 13 increases and 3 decreases greater than 100 Mt, with significant resource upgrades resulting in a substantial net increase in EDR of 5687 Mt of black coal (or 9%). Large additions to EDR came from South Burnett (Moreton Resources Ltd), Hunter Valley Operations and Hail Creek (both Rio Tinto Ltd), and Red Hill (BHP Billiton Mitsubishi Alliance).
In 2015, Inferred Resources increased at 28 deposits and decreased at 18 deposits, with 8 increases and 2 decreases greater than 100 Mt. Large contributions to Inferred Resources included Bloodwood Creek (Carbon Energy Ltd), Clifford (Stanmore Coal Ltd), Hunter Valley Operations and Kazput (Northern Star Resources Ltd). Significant retrospective additions to the database include Hyde Park (Resolve Coal Pty Ltd) and China Stone (Macmines AustAsia Pty Ltd), both situated in the Galilee Basin, Queensland.
In 2015, Kazput, Clifford, Mackenzie (Moreton Resources Ltd), Mimosa (Square Resources Pty Ltd) and Mount Robert (Rio Tinto Ltd) announced maiden resources and South Burnett reported a maiden reserve.
Across 2015, the coal industry experienced hardship as coal prices continued to decline. Many coal companies, including large businesses, reported financial losses and considered or announced close-downs, cut-backs and property sales. Despite recent difficulties and the growing popularity of alternative energy technologies, coal continues to be important for global power generation: The percentage share of global power supplied by coal is decreasing but the World Coal Association projects that, in absolute terms, the amount of coal-fired power generation will grow as the total amount of power generation increases worldwide, particularly in developing regions. The Office of the Chief Economist has reported resurgence in both coal demand and coal prices in 2016, particularly for metallurgical coal, and has forecast increased export revenues from coal in 2017.
Brown Coal: In 2015, Geoscience Australia’s brown coal data underwent a major review in collaboration with the Geological Survey of Victoria. This resulted in a substantial upwards revision of recoverable brown coal EDR to 76 508 Mt, an increase of 73% from 2014. Nearly all of Australia’s recoverable brown coal EDR is located in Victoria with more than 93% in the Latrobe Valley. Australia is ranked second in the world in terms of recoverable brown coal, accounting for 24% of the world’s lignite reserves, behind Russia (29%) and followed by Germany (11%) and the United States (10%).
During 2015, brown coal production in Australia was estimated at 65.4 Mt, ranking Australia third in the world behind Germany and Russia. Brown coal mined in Australia is used almost exclusively for domestic electricity generation in Victoria, where it is burnt in adjacent power plants; although a small mine at Maddingley, 50 km northwest of Melbourne, produces agricultural products. At 2015 rates of extraction, the accessible resource base will support over 1000 years of production. In 2015, the Anglesea brown coal-fired power station on Victoria’s south coast closed, leaving the Loy Yang, Yallourn and Hazelwood power stations operating in the Latrobe Valley, with Hazelwood also scheduled to close in March 2017.
Copper: Australia’s EDR of copper in 2015 was 88.75 Mt, slightly up from 2014 (88.48 Mt). Australia has the second largest economic resources of copper at 12% after Chile’s 29%. South Australia has 68% of the national total of EDR, mainly in the Olympic Dam deposit (which contains 56% of Australia’s EDR), followed by New South Wales and Queensland, both with 13%. In 2015, Australian mines produced 971 kt of copper, slightly up from 2014 (966 kt). Copper ore and concentrates (1916 kt) and refined copper (448 kt) had an export value of $8156 million, down from $9048 million in 2014. Spending in copper exploration in 2015 fell by 26% to $121 million. The bulk of copper exploration took place in Queensland ($40.5 million; 33.5%) and Western Australia ($27.7 million; 22.9%).
Diamond: In 2015, Australia’s total EDR of diamond resources was 209.4 Mc, down from 219.5 Mc in 2014. Total production increased over the same period from 9.3 Mc to 13.6 Mc. In 2015, Australia was the fifth largest producer of rough diamonds after Russia, Botswana, Democratic Republic of Congo and Canada. Of Australia’s two producing diamond mines in 2015, the Argyle AK1 lamproite pipe in the East Kimberley region of Western Australia was responsible for the bulk of production. The Ellendale E9 lamproite pipe in the West Kimberley was a small producer primarily producing rare yellow rough diamonds. The Ellendale mine closed in June 2015.
Gold: The national EDR of gold went up 434 t, or 5%, in 2015 to 9546 t. With the exception of Tasmania, which recorded a small decline (-1 t), all other jurisdictions recorded a rise in gold EDR with the greatest increase occurring in Western Australia (+339 t). Total JORC Reserves in Australia amount to 3552 t, which is 39% of gold EDR and unchanged from 2014.
www.ga.gov.au 5
Inferred Resources of gold in Australia saw a minor rise of about 70 t, or 2%, to total 4632 t in 2015. The largest rise in this resource category was seen in New South Wales (+24 t) and the largest fall was recorded in the Northern Territory (-23 t). Most years, the nation’s gold inventory, based on total JORC Resources (EDR + Inferred), has generally grown from 5% to 20% since 1979. In 2015, total JORC Resources increased by 504 t or 4% to 14 178 t.
Australian mine production of gold rose by 4 t, or about 6%, in 2015 to 278 t. Increases in gold production in 2015 were seen in the Northern Territory (+3 t), New South Wales (+2 t) and Queensland (+2 t). Western Australia and South Australia had minor falls in gold production (-1 t each) whereas Victoria and Tasmania remained unchanged in 2015.
Figures from the USGS for world gold resources have not changed substantially in recent years and Australia currently leads the world with almost 17% of the global total, ahead of Russia (8000 t) and South Africa (6000 t). World production, according to Thompson Reuters/World Gold Council, went up 45 t or 1.5% to 3186 t for the year. By these figures, Australia accounts for about 9% of world production. Using USGS estimates of production by country, Australia’s gold production continued to rank second in the world behind China (490 t). Imports of primary and secondary gold into Australia in 2015 totalled about 83 t or about 6 t more than in 2014. Total refined gold amounted to 302 t, down 2 t from 2014. Gold exports decreased about 5 t to 282 t, with a value of $13.93 billion.
The price of gold in US dollars declined over 2015 with the monthly average gold price commencing the year at a high of US$1251/oz in January and concluding it at a low of US$1067/oz in December. The average price over the year was about US$96/oz less than in 2014. Changes in the exchange rate between the US dollar and the Australian dollar saw the price of gold in Australian dollars fluctuate from a high of $1633/oz in January to finish the year at a low of $1462/oz in December. Overall, the average price of gold in Australian dollars for 2015 was about $128/oz higher than in 2014.
Although equity markets remained difficult in 2015, resulting in reduced exploration expenditures across most commodities, exploration expenditure on gold actually increased to $476 million, partly reversing the decline of the previous year. In 2014, expenditure on gold exploration declined by $176 million, or 32%, but in 2015 gold exploration expenditure increased by $99 million.
Industry activity in 2015 was focused in Western Australia and included: maiden resource announcements for Bonnie Vale (Focus Minerals Ltd) and Gunga West (Kidman Resources Ltd); significant resource increases at the Dalgaranga Project to 1.02 Moz gold (Gascoyne Resources Ltd), Andy Well to 0.5 Moz (Doray Minerals Ltd) and Gruyere to 5.6 Moz of gold (Gold Road Resources Ltd); gold production at Tropicana reached 1 Moz after two years of operation (AngloGold Ashanti Ltd); and mining began at Burbanks (Kidman Resources Ltd).
Iron Ore: Because of major changes in Australia’s iron ore mining industry and the development of large magnetite deposits in Australia, Geoscience Australia estimates national resources of iron in two categories: (1) iron ore and (2) contained iron.
Australia’s EDR of iron ore decreased by 5% to 51 545 Mt during 2015 with the EDR of contained iron estimated to be 23 985 Mt. Magnetite resources decreased by 12% to 21 160 Mt in 2015, accounting for approximately 41% of iron ore EDR. Western Australia has the largest share of iron ore with 89% of Australia’s EDR, the majority of which is in the Pilbara region. Australia has the world’s largest EDR with 28% of the world’s iron ore followed by Russia with 14%. Western Australia produced 799 Mt, or 99% of Australia’s total production of iron ore in 2015. Iron ore-exploration expenditure in Australia during 2015 totalled $316.4 million, a 47% decrease on the $592.2 million spent in 2014. Exploration for iron ore in 2015 accounted for 22% of Australia’s total mineral exploration expenditure.
Lithium: Australia’s EDR of lithium was 1610 kt in 2015, up from 1533 kt in 2014. Australia ranks fourth globally, behind Chile, China and Argentina, with just over 11% of the world’s economic resources. All of Australia’s EDR of lithium occur within hard-rock pegmatite deposits in Western Australia. The Greenbushes deposit, which is the world’s largest and highest grade spodumene deposit, contains 82% of Australia’s lithium EDR with other resources occurring at Mount Cattlin, Mount Marion and Pilgangoora. Industry activity in 2015 has seen the Pilgangoora and Mount Marion projects advancing with Pilgangoora regarded as the world’s second largest spodumene-tantalite deposit. In September 2016, Talison Lithium Pty Ltd announced that it would double production at Greenbushes to supply a $400 million lithium processing plant to be built at Kwinana, south of Perth.
Magnesite: Australia’s EDR of magnesite rose from an estimated 318 Mt in 2013 to 322 Mt in 2015, about 4% of the world total of 8300 Mt reported by the USGS. Production totalled 658 kt in Queensland for the 2015–16 financial year and 4650 t in South Australia for the 2015 calendar year.
Manganese Ore: Australia’s EDR of manganese increased by 6 Mt in 2015 to 232.9 Mt, ranking Australia’s resources as the world’s third largest behind South Africa and the Ukraine. All EDR occur in the Northern Territory and Western Australia. Australia’s mine production of manganese ore was 7.5 Mt in 2015, ranked third behind China and South Africa. Owing to a drop in the manganese price, two of Australia’s operating mines went into care-and-maintenance mode: Bootu Creek suspended operations in December 2015 and Woodie Woodie followed in January 2016.
Mineral Sands: The Perth Basin (Western Australia), Murray Basin (New South Wales, Victoria and South Australia) and Eucla Basin (Western Australia and South Australia) host the major share of Australia’s mineral sands resources (ilmenite, rutile and zircon). Major economic resources have more recently also been identified in the Canning Basin, Western Australia. Notwithstanding this discovery, heavy mineral sands exploration expenditure has decreased by 28% in real terms since 2012. In 2015, an estimated 1135 kt of ilmenite concentrate and 246 kt of rutile concentrate were exported from Australia, valued at $125 million and $184 million, respectively. Australia has the world’s largest EDR of rutile, followed by Kenya and South Africa, and zircon, followed by South Africa and India, and the second largest EDR of ilmenite after China.
Molybdenum: Australia’s EDR of molybdenum in 2015 was 190 kt, unchanged from 2014. Australia ranks seventh globally but has less than 2% of the world’s economic resources. The bulk of Australia’s EDR of molybdenum occurs in Queensland (69%), followed by Victoria (26%) and the Northern Territory (3%). New South Wales and Western Australia also have molybdenum deposits but less than 1% of Australia’s EDR.
Niobium: Australia’s EDR of niobium increased 40% in 2015 to 287 kt owing to new resource estimates at the Hastings deposit in Western Australia. The bulk (71%) of Australia’s EDR of niobium occurs in the Toongi deposit, 20 km south of Dubbo in New South Wales. World data are scarce but Australia’s resources of niobium could be the second largest in the world behind Brazil.
Nickel: Australia’s EDR of nickel in 2015 were 18.8 Mt, almost unchanged from the 19.0 Mt estimated in 2014, and still down from the peak of 26.4 Mt recorded in 2008. Australia holds 24% of the world’s nickel resources, ranking number one, with Western Australia containing 96% of Australia’s EDR, made up of both sulphide and lateritic deposits. Nickel mine production in the 2015 calendar year was 235 kt, a decrease of 4% on the previous year. This coincides with the forecast from the Office of the Chief Economist which predicted a 12% decrease in mine output in 2015–16 as companies cut production and suspended operations impacted by low nickel prices. However, the Office of the Chief Economist’s medium term projection is for an increase in mine production to 279 kt in 2020–21, supported by the resumption of some operations, including Lake Johnston, Black Swan and Mount Windarra.

Australia’s Identified Mineral Resources 20166
Oil Shale: Resources of oil shale predominantly occur in a series of sedimentary basins around Gladstone, Mackay and Proserpine in central Queensland with paramarginal and submarginal (contingent) resources estimated at 2287 GL (14 385 million barrels) and Inferred (prospective) resources estimated at 1472 GL (9261 million barrels). Australia currently has no EDR of oil shale, with all resources being assessed as subeconomic.
Phosphate: Geoscience Australia assesses both phosphate rock (phosphorite and guano) and contained P2O5 which, as well as being a component of phosphate rock, can be found in other rock types in which alternative minerals are the primary target. Australia’s EDR of phosphate rock was 1072 Mt in 2015, unchanged from 2014. Contained P2O5 EDR increased, however, by almost 3% to 188 Mt, owing to resource increases at the Dandaragan Potash Project (by-product phosphate) in Western Australia and Nolans Bore in the Northern Territory. The phosphorites of the Georgina Basin (Queensland and the Northern Territory) account for almost all of Australia’s EDR of phosphate rock and 90% of Australia’s EDR of contained P2O5. The remaining phosphate rock occurs at Christmas Island. The rare earth deposit at Mount Weld (Western Australia) also has an EDR of contained P2O5. Australia has less than 2% of the world’s economic resources of phosphate rock with Christmas Island and Phosphate Hill (Queensland) the only significant producers.
Platinum Group Elements: Australia’s EDR of platinum group elements were estimated to be 5.3 t, up from 3.5 t in 2013. This represents less than 0.01% of the world total of 66 000 t. The increase in Australia’s EDR is attributed to a resource upgrade at Rosie (Duketon Mining Ltd), Western Australia. The Western Australia Department of Mines and Petroleum reported 464 kg of platinum and palladium production for 2014–15.
Potash: Potash is a generic term covering a variety of potassium-bearing ores, minerals and refined products. Prior to 2014, Australia did not have an EDR of potash but positive results from the Karinga Lakes deposit in the Northern Territory and the Dandaragan project in Western Australia resulted in an EDR of 7.1 Mt in 2014. Potash EDR has again increased in 2015 to 32.4 Mt K2O with the addition of resources at Lake Disappointment and Lake Wells, both in Western Australia, and at Lake Mackay on the Western Australia-Northern Territory border. Other potash deposits, not yet economically demonstrated, occur in Western Australia at Lake Chandler, Lake Hopkins and Oxley, the last being a new type of potash deposit hosted in ultrapotassic microsyenite lava flows. Australia’s potash resources remain minor by world standards with Canada, Russia and Belarus leading supply. Potash was not mined in Australia in 2015.
Rare Earths (REO & Y2O3): Australia’s EDR of rare earth oxides were estimated to be 3.44 Mt, up from 3.19 Mt in 2013. This accounts for approximately 2.6% of the world total of 130 Mt, of which China retains the greatest proportion of any country (>43%). The increase in Australia’s EDR can be attributed to resource upgrades at Yangibana (Hastings Technology Metals Ltd) and Browns Range (Northern Minerals Ltd) in Western Australia and at Nolans Bore (Arafura Resources Ltd) in the Northern Territory. Lynas Corporation Ltd continues to operate Australia’s only rare earths mine at Mount Weld, Western Australia, which supplies rare earth concentrates to the Lynas Advanced Materials Plant (LAMP) in Malaysia. Mount Weld produces on a campaign basis governed by LAMP demand and, in 2015, LAMP produced 10 900 t of ready-for-sale rare earth oxides. This places Australia second only to China which generates 85% of global production.
Tantalum: Australia’s EDR of tantalum was 69.2 kt in 2015, slightly up from 67 kt in 2014. Australia ranks first in the world ahead of Brazil and Canada for identified tantalum resources. The bulk of tantalum EDR in 2015 was located in Western Australia, mainly at the Greenbushes (43%) and Wodgina (27%) deposits with smaller deposits at Pilgangoora, Tabba Tabba, Mount Deans, Mount Cattlin and Dalgaranga. Outside of Western Australia, the Toongi deposit in New South Wales contains
23% of Australia’s tantalum EDR. In 2015, industry activity in the Pilbara region resulted in an EDR of tantalum at the Pilgangoora lithium-tantalum deposit which has been subsequently upgraded in 2016.
Tin: Australia’s EDR of tin increased by 5% to 434 kt in 2015, up from 413 kt in 2014. Australia’s resources are the world’s fourth largest behind China, Indonesia and Brazil. The majority of Australia’s EDR of tin is contained in the Renison Bell (55%) and Cleveland (11%) deposits in Tasmania and the Taronga (11%) deposit in New South Wales. All of Australia’s EDR of tin occur in Tasmania (77%), New South Wales (11%) and Queensland (11%), although some tin is produced as a by-product from Western Australian tantalum deposits. In August 2016, production of tin concentrate began at Granville in Tasmania.
Tungsten: Australia’s EDR of tungsten was 403 kt in 2015, up from 392 kt in 2014. Australia has 12% of the world’s economic resources, ranking second behind China and ahead of Canada and Russia. Nearly half of Australia’s EDR is contained within the O’Callaghans multi- commodity deposit in Western Australia. Australia’s EDR of tungsten occur in Western Australia (55%), Tasmania (25%), Queensland (18%), the Northern Territory (2%) and New South Wales (<1%).
Uranium: Australia’s Reasonably Assured Resources of uranium that can be produced at costs of less than US$130/kg were estimated to be 1287 kt at December 2015, representing a modest increase on the previous year’s estimate. The uranium market is predicated on long lead times and significant infrastructure development costs for plant construction; as a result uranium buyers and sellers generally negotiate private contracts. The uranium spot market provides only a short-term indicator, with prices published by independent consultants generally decreasing since February 2011. A number of companies in Australia are working through regulatory development and approvals processes and are upgrading their mineral resource assessments in anticipation of improving market conditions. Australia’s mine production of uranium in 2015 was 5637 t (6647 t U3O8), a 13% increase on that reported in 2014, largely due to production commencing at Four Mile in South Australia. Australia’s Reasonably Assured Resources of uranium is the world’s largest, accounting for approximately 30% of global resources.
Vanadium: Australia’s vanadium EDR decreased by 6% in 2015 to 1802 kt. This represents approximately 12% of estimated global vanadium resources, ranking Australia fourth in the world. The economic impact of volatile prices and the nature of the vanadium market, which is supplied largely from secondary sources, have had a significant impact on Australia’s vanadium EDR and the development of Australian vanadium projects. Australia’s vanadium resources are mostly located in Western Australia at deposits such as Windimurra, Balla Balla, Barrambie and Gabanintha, with Mount Peak occurring in the Northern Territory. Windimurra was Australia’s sole producer but production ceased following damage to the plant during a fire in February 2014.
Zinc, Lead and Silver: Australia’s EDR of zinc in 2015 was unchanged from the previous year at 62.6 Mt, lead EDR increased in 2015 to 35.3 Mt up from 34.7 Mt in 2015 and silver EDR increased in 2015 to 88.7 kt up from 85.2 kt in 2014. Australia’s economic resources for both zinc and lead are the world’s largest holdings at 31% for zinc and 40% for lead while Australia has the second largest holdings of silver (15%) behind Peru. Queensland has 56% of the national total of EDR for zinc, 59% for lead and 55% for silver, mainly in the Mount Isa region. The Northern Territory has 30% of the national total of EDR for zinc, 25% for lead and 10% for silver, almost all of which are at the McArthur River mine. Significant EDR of silver are also found in New South Wales (15%) and South Australia (13%). Exploration expenditure on zinc, lead and silver in 2015 was $50.6 million, slightly up from $50.4 million in 2014.

www.ga.gov.au 7
Table 2 World ranking of major mineral resources and production as at December 2015.
Commodity World Ranking for Resources
% of World Resources
World Ranking for Production
% of World Production
Antimony 4 8 6 2
Bauxite 2 22 1 29
Black Coal 5 10 4 8
Brown Coal 2 24 3 8
Chromium n.a. 0 n.a. 0
Cobalt 2 15 5 5
Copper 2 12 6 5
Diamond (Industrial) 1 30 2 24
Fluorine minor minor n.a. 0
Gold 1 17 2 9
Ilmenite 2 19 2 9
Iron Ore 1 28 2 25
Lead 1 40 2 14
Lithium 4 11 unknown unknown
Magnesite 5 4 minor minor
Manganese Ore 2 17 3 16
Molybdenum 7 2 n.a. 0
Nickel 1 24 4 9
Niobium 2 6 unknown unknown
Oil Shale n.a. 0 n.a. 0
Platinum Group Elements minor minor minor minor
Phosphate 10 2 minor minor
Potash minor 1 n.a. 0
Rare Earths 3 3 2 9
Rutile 1 52 1 47
Silver 2 15 6 5
Tantalum 1 unknown unknown unknown
Thorium 2 unknown n.a. 0
Tin 4 9 7 3
Tungsten 2 12 minor minor
Uranium 1 29 3 9
Vanadium 4 12 n.a. 0
Zinc 1 31 2 12
Zircon 1 67 1 31
Sources: USGS (Mineral Commodity Summaries 2016), International Energy Agency (Coal Information 2016), OECD Nuclear Energy Agency/International Atomic Energy Agency (The Red Book 2014), World Nuclear Association (World Uranium Mining Production, July 2016 update), Federal Institute for Geosciences and Natural Resources, Germany (Energy Study 2015) and Geoscience Australia. n.a. = not applicable
Australia’s Identified Mineral Resources 20168
Trends in Australia’s Economic Demonstrated Resources of Major Mineral CommoditiesThe trends in EDR for Australia’s major mineral commodities have undergone significant and sometimes dramatic changes over the period 1975–2015 (Figure 1a–c). The changes for each commodity can be attributed to one, or a combination, of the following factors:
• increases in resources resulting from discoveries of new deposits and delineation of extensions of known deposits;
• depletion of resources as a result of mine production;
• advances in mining and metallurgical technologies, e.g. carbon-based processing technologies for gold have enabled economic extraction from low-grade deposits that were previously uneconomic;
• adoption of the JORC Code1 for resource classification and reporting by the Australian minerals industry and the subsequent impacts on re-estimation of ore reserves and mineral resources to comply with the requirements of the JORC Code. Many companies re-estimated their mineral resources to comply with the JORC Code. The impacts of the JORC Code on EDR occurred at differing times for each of the major commodities; and
• significant changes in the prices of mineral commodities driven largely by both escalating and cooling demand from China over the past decade.
Past trends and changes in EDR for a number of Australia’s major mineral commodities are discussed below.
BauxiteEDR of bauxite increased in 1989 as a result of the delineation of additional resources in deposits on Cape York Peninsula in northern Queensland (‘a’ in Figure 1a). Decreases in bauxite EDR in 1992 resulted from reclassification of some resources within deposits on Cape York Peninsula to comply with requirements for the JORC Code (‘b’).
Black CoalA major reassessment of New South Wales coal resources during 1986 by the NSW Department of Mineral Resources and the Joint Coal Board resulted in a large increase in black coal EDR as reported in 1987 (‘c’).
Between 1998 and 2007, EDR for black coal declined due to the impact of increased rates of mine production and mining companies re-estimating ore reserves and mineral resources more conservatively to comply with requirements of the JORC Code. From 2008 onwards, black coal EDR increased significantly because of the discovery and delineation of additional resources as a result of high levels of exploration and through reclassification of resources.
Iron OreAustralia’s EDR of iron ore declined from 1994 through to 2003 due to the combined impacts of increased rates of mine production and mining companies re-estimating reserves and resources to comply with the requirements of the JORC Code. Post 2003, EDR increased rapidly due to large increases in magnetite resources (including reclassification of some magnetite deposits to economic categories), and increases in hematite resources, mainly at known deposits. In 2015, the EDR of iron ore fell due to a combination of increased production and low iron-ore prices forcing some companies to reassess the economic viability of their deposits. Mine production increased rapidly from 168 Mt in 2000 to 811 Mt in 2015.
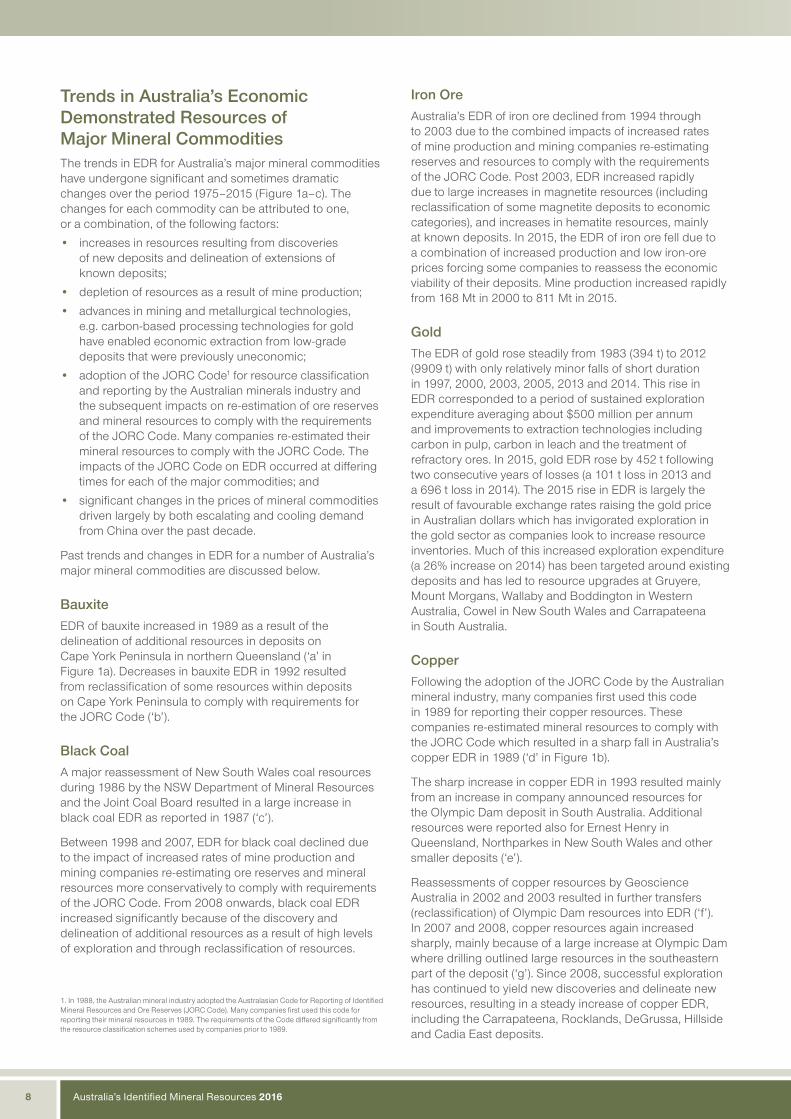
GoldThe EDR of gold rose steadily from 1983 (394 t) to 2012 (9909 t) with only relatively minor falls of short duration in 1997, 2000, 2003, 2005, 2013 and 2014. This rise in EDR corresponded to a period of sustained exploration expenditure averaging about $500 million per annum and improvements to extraction technologies including carbon in pulp, carbon in leach and the treatment of refractory ores. In 2015, gold EDR rose by 452 t following two consecutive years of losses (a 101 t loss in 2013 and a 696 t loss in 2014). The 2015 rise in EDR is largely the result of favourable exchange rates raising the gold price in Australian dollars which has invigorated exploration in the gold sector as companies look to increase resource inventories. Much of this increased exploration expenditure (a 26% increase on 2014) has been targeted around existing deposits and has led to resource upgrades at Gruyere, Mount Morgans, Wallaby and Boddington in Western Australia, Cowel in New South Wales and Carrapateena in South Australia.
CopperFollowing the adoption of the JORC Code by the Australian mineral industry, many companies first used this code in 1989 for reporting their copper resources. These companies re-estimated mineral resources to comply with the JORC Code which resulted in a sharp fall in Australia’s copper EDR in 1989 (‘d’ in Figure 1b).
The sharp increase in copper EDR in 1993 resulted mainly from an increase in company announced resources for the Olympic Dam deposit in South Australia. Additional resources were reported also for Ernest Henry in Queensland, Northparkes in New South Wales and other smaller deposits (‘e’).
Reassessments of copper resources by Geoscience Australia in 2002 and 2003 resulted in further transfers (reclassification) of Olympic Dam resources into EDR (‘f’). In 2007 and 2008, copper resources again increased sharply, mainly because of a large increase at Olympic Dam where drilling outlined large resources in the southeastern part of the deposit (‘g’). Since 2008, successful exploration has continued to yield new discoveries and delineate new resources, resulting in a steady increase of copper EDR, including the Carrapateena, Rocklands, DeGrussa, Hillside and Cadia East deposits.
1. In 1988, the Australian mineral industry adopted the Australasian Code for Reporting of Identified Mineral Resources and Ore Reserves (JORC Code). Many companies first used this code for reporting their mineral resources in 1989. The requirements of the Code differed significantly from the resource classification schemes used by companies prior to 1989.

www.ga.gov.au 9
Lead, ZincThe adoption of the JORC Code in 1988 by the Australian mineral industry led to a re-estimation of mineral resources by many companies to align with the code and some reassessments of resource data for other deposits by Geoscience Australia’s predecessor, the Bureau of Mineral Resources. This resulted in a fall in Australia’s lead and zinc EDR in 1989 (‘h’).
Increases in EDR for lead and zinc in 1993 resulted from the reclassification of paramarginal demonstrated resources into EDR for the McArthur River deposit in the Northern Territory and the George Fisher deposit in Queensland. Additional resources were also reported for the Century and Cannington deposits in Queensland (‘i’).
Increases in 2008 and 2009 were associated with reassessment of resources at the McArthur River mine, where an expansion from underground to open-cut mining was approved, reassessment of the Dugald River deposit in Queensland for which a new and increased resource estimate was released and reporting of additional resources for George Fisher (‘j’).
NickelThe EDR for nickel increased during the period 1995 to 2001 by 18.2 Mt. This resulted mainly from progressive increases in resources of lateritic deposits at Bulong, Cawse, Murrin Murrin, Mount Margaret, Ravensthorpe, all in Western Australia, Marlborough in Queensland, and Syerston and Young in New South Wales. Australia’s EDR of nickel doubled in 2000 compared to the level at the end of 1999. This dramatic rise was due to further large increases in resources at the Mount Margaret and Ravensthorpe deposits, and other lateritic deposits in the Kalgoorlie region of Western Australia. In addition, during the period 1995 to 2001, there were increases in Western Australian sulphide resources at Yakabindie and the discoveries of the Silver Swan and Cosmos high-grade sulphide deposits.
From 2001 onwards, the sharp rises in market prices for nickel led to increased expenditure on exploration and on evaluation drilling at many known deposits. This contributed to further increases in total EDR for sulphide deposits at Perseverance, Savannah, Maggie Hays, Anomaly 1, Honeymoon Well, deposits in the Forrestania area, as well as new deposits at Prospero and Tapinos in Western Australia, Avebury in Tasmania and remnant resources at several sulphide deposits in the Kambalda region including Otter-Juan and Lanfranchi groups of deposits.
From 2001 onwards, EDR increased at a slower rate because of the absence of further discoveries of lateritic nickel deposits and as a result of increases in resources for some deposits being offset by companies reclassifying their lateritic nickel resources to lower resource categories pending more detailed drilling and resource assessments. Decreases in nickel EDR from 2009 onwards reflect reclassification of nickel resources in response to the very sharp falls in nickel prices following the 2008–09 global financial crisis followed by only a partial recovery in nickel prices from 2009 onwards. Continued weakness in the price of nickel has resulted in low exploration activity, thus nickel EDR are not expected to increase in the near future.
Mineral SandsIncreases in EDR of ilmenite from 1996 to 2003 resulted from discovery and subsequent evaluation drilling of heavy mineral sands deposits in the Murray Basin which include the Ginkgo and Snapper deposits in New South Wales, Douglas-Bondi and Woornack deposits in Victoria, and the Mindarie project in South Australia. In addition, from 1998 onwards, there were progressive increases in resources at mineral sands deposits at Jacinth-Ambrosia and Cyclone in the Eucla Basin embracing parts of South Australia and Western Australia, in the North Swan Coastal Plain area north of Perth and the Blackwood Plateau region in Western Australia. The EDR of ilmenite declined from 2007 to 2012 owing to reclassification of some resources to lower resource categories but has since increased owing to new resource delineation, particularly in Western Australia.
UraniumThe majority of Australia’s uranium deposits were discovered between 1969 and 1975 when approximately 50 deposits, including 15 with significant resource estimates, were discovered. Since 1975, only another five deposits have been discovered and, of these, only three deposits (Kintyre in the Paterson Province of Western Australia, Junnagunna in Queensland and Four Mile in South Australia) have Reasonably Assured Resources recoverable at less than US$130/kg U (equates with EDR). As a result, the progressive increases in Australia’s EDR for uranium from 1975 to the present were largely because of the ongoing delineation of resources at known deposits.
From 1983 onwards, the Olympic Dam deposit has been the major contributor to increases in Australia’s EDR. The large increases shown on Figure 1 occurred:
• in 1983, when initial resource estimates for Olympic Dam and Ranger No. 3 Orebody (Northern Territory) were made by the former Australian Atomic Energy Commission (‘k’);
• in 1993, when further increases in EDR for Olympic Dam and the first assessment of resources for the Kintyre deposit were made by Geoscience Australia’s predecessor, the Bureau of Mineral Resources (‘l’);
• in 2000, when increases were due to continuing additions to the Olympic Dam resources; and
• from 2007 to 2009 when a major increase in EDR for Olympic Dam was made after drilling outlined major extensions to the southeast part of the deposit.
Economic resources generally decreased from 2010 to 2014 because of higher costs of mining and milling uranium ores. Resources in some deposits were reassigned to higher cost categories than in previous years. In previous years, resources in the cost category of less than US$80/kg U were considered to be economic. As a result of changes in uranium market prices and increases in costs, economic resources since 2009 were adjusted to include resources within the cost category of less than US$130/kg U.

Australia’s Identified Mineral Resources 201610
Figure 1a Trends in Economic Demonstrated Resources of major commodities since 1975.
www.ga.gov.au 11
Figure 1b Trends in Economic Demonstrated Resources of major commodities since 1975.

Australia’s Identified Mineral Resources 201612
Figure 1c Trends in Economic Demonstrated Resources of major commodities since 1975.

www.ga.gov.au 13
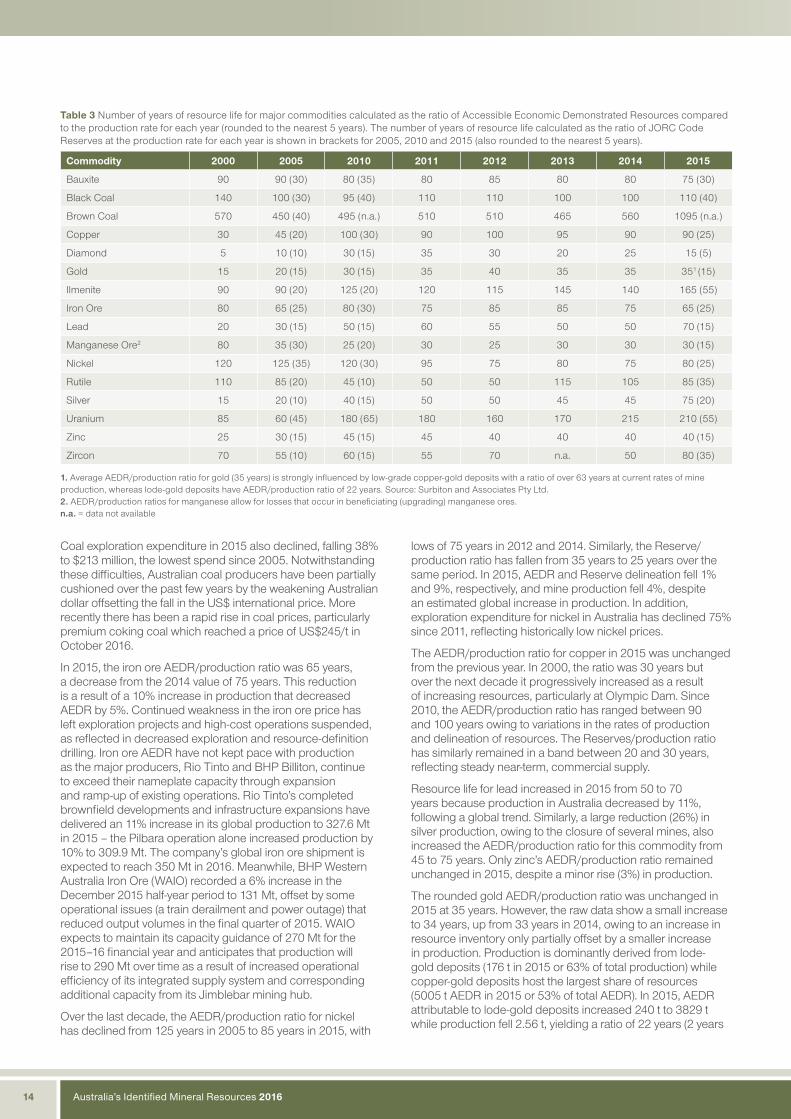
Resources to Production RatiosGeoscience Australia uses the ratio of a mineral commodity’s AEDR compared to its current mine production as an indicative estimate of long-term resource life to assist with the assessment of future supply capacity (Table 3). For the years 2005, 2010 and 2015, Table 3 also shows another ratio that is derived from Ore Reserves compliant with the JORC Code compared to current mine production. This lower estimate reflects a shorter term, commercial outlook.
Geoscience Australia rounds these ratios to the nearest 5 years to provide a snapshot in time. Thus, the individual values in Table 3 are not necessarily representative of the long-term trend as variations in the rates of production in response to demand can profoundly change the resource/production ratio. A case in point is silver: In Table 3, silver has an AEDR/production ratio of 45 years in 2014 which has increased to 75 years in 2015. This apparent radical increase in the resource life of silver can be explained by both a 3 kt increase in AEDR concurrent with a 26% fall in production owing to the closure of several silver mines in Queensland. In addition, while Ore Reserve estimates, by definition, have recoverability factored in, the AEDR/production ratio does not account for mining losses; but on the other hand, they also do not account for Australia’s often vast estimates of Inferred Resources.
Despite the caution needed when assessing resource/production ratios, the values in Table 3, taken together, provide a broad outlook for policy makers and planners. Given the importance of mineral resources to the Australian economy, strategic long-term decision-making about the nation’s mineral deposits, as well as the discovery and development of new, quality mineral deposits, is essential.
The long-term AEDR/production ratios from 2000 to 2015 (Table 3) show:
• The AEDR of most of Australia’s major commodities can sustain current rates of mine production for many decades.
• In 2015, the AEDR/production ratios ranged between 15 years (diamonds) and 1095 years (brown coal).
• The commodities with the longest resource life based on AEDR/production ratios are brown coal (1095 years at 2015 rates of production), uranium (210 years), ilmenite (165 years), black coal (110 years), copper (90 years) and rutile and nickel (both 85 years).
• Commodities with a resource life of less than 50 years at 2015 rates of production are diamond (15 years), manganese ore (30 years), gold (35 years) and zinc (40 years).
• AEDR/production ratios between 2014 and 2015 increased for black coal, brown coal, ilmenite, lead, nickel, silver and zircon.
• AEDR/production ratios between 2014 and 2015 decreased for bauxite, diamond, iron ore, rutile and uranium.
• AEDR/production ratios between 2014 and 2015 remained unchanged for copper, gold, manganese ore and zinc.
• The AEDR/production ratio for brown coal almost doubled based on a new assessment of resources by Geoscience Australia and the Victorian Government.
• The large decrease in the diamond AEDR/production ratio in 2015 results from the closure of the Ellendale mine concurrent with a 47% increase in production at Argyle.
Changes in the ratios of Ore Reserves to production predominantly reflect the ongoing practice of companies replenishing Reserves depleted by mining by upgrading Measured and Indicated Resources to maintain a steady supply of mineable ore for mine production.
The short-term Reserve/production ratios from 2005 to 2015 show:
• In 2015, Reserve/production ratios ranged between 5 years for diamonds to 55 years for both ilmenite and uranium.
• All commodities except for diamond have a Reserve life of 15 years or greater.
• Reserves/production ratios show significant changes between 2010 and 2015 for diamond (down from 15 to 5 years), ilmenite (up from 20 to 55 years), rutile (up from 10 to 35 years) and zircon (up from 15 to 35 years).
• Reserve/production ratios have not changed significantly between 2005 and 2015 for many commodities.
It is important to note that a long resource life for a particular commodity is not a guarantee that the resource will continue to be extracted in Australia. In an increasingly globalised and competitive commodity market, multinational mining companies search for mineral deposits that offer the most attractive returns on investment. These returns are influenced by the quality of the resources (grade and tonnage), development and extraction costs, and by environmental, social and political factors as well as land access, infrastructure and the location and scale of the mining operations proposed by the company.
After the global financial crisis in 2008, many companies reassessed their options for both existing and planned operations in Australia. Despite the appearance of recovery by mid-2009, volatile and weak commodity prices, particularly for iron ore and coal, reversed the positive trend and many operations have been forced to extract greater efficiencies, place mines on care and maintenance, defer or cancel developments or even close.
In early 2011, the international spot price for thermal and coking coal peaked at more than US$140/t and US$330/t, respectively. Since then, an oversupply of both thermal and coking coal on the international markets has led to a steady decline in prices. In 2015, coal prices declined further to average US$58/t for thermal coal and US$88/t for premium coking coal. Despite depressed prices, production and export volumes of both thermal and coking coal reached record levels in 2014 as many producers honoured take-or-pay contracts negotiated as part of export terminal expansions. By 2015, however, coal production declined as mine closures began to take effect.
Australia’s Identified Mineral Resources 201614
Table 3 Number of years of resource life for major commodities calculated as the ratio of Accessible Economic Demonstrated Resources compared to the production rate for each year (rounded to the nearest 5 years). The number of years of resource life calculated as the ratio of JORC Code Reserves at the production rate for each year is shown in brackets for 2005, 2010 and 2015 (also rounded to the nearest 5 years).
Commodity 2000 2005 2010 2011 2012 2013 2014 2015
Bauxite 90 90 (30) 80 (35) 80 85 80 80 75 (30)
Black Coal 140 100 (30) 95 (40) 110 110 100 100 110 (40)
Brown Coal 570 450 (40) 495 (n.a.) 510 510 465 560 1095 (n.a.)
Copper 30 45 (20) 100 (30) 90 100 95 90 90 (25)
Diamond 5 10 (10) 30 (15) 35 30 20 25 15 (5)
Gold 15 20 (15) 30 (15) 35 40 35 35 351 (15)
Ilmenite 90 90 (20) 125 (20) 120 115 145 140 165 (55)
Iron Ore 80 65 (25) 80 (30) 75 85 85 75 65 (25)
Lead 20 30 (15) 50 (15) 60 55 50 50 70 (15)
Manganese Ore2 80 35 (30) 25 (20) 30 25 30 30 30 (15)
Nickel 120 125 (35) 120 (30) 95 75 80 75 80 (25)
Rutile 110 85 (20) 45 (10) 50 50 115 105 85 (35)
Silver 15 20 (10) 40 (15) 50 50 45 45 75 (20)
Uranium 85 60 (45) 180 (65) 180 160 170 215 210 (55)
Zinc 25 30 (15) 45 (15) 45 40 40 40 40 (15)
Zircon 70 55 (10) 60 (15) 55 70 n.a. 50 80 (35)
1. Average AEDR/production ratio for gold (35 years) is strongly influenced by low-grade copper-gold deposits with a ratio of over 63 years at current rates of mine production, whereas lode-gold deposits have AEDR/production ratio of 22 years. Source: Surbiton and Associates Pty Ltd.2. AEDR/production ratios for manganese allow for losses that occur in beneficiating (upgrading) manganese ores.n.a. = data not available
Coal exploration expenditure in 2015 also declined, falling 38% to $213 million, the lowest spend since 2005. Notwithstanding these difficulties, Australian coal producers have been partially cushioned over the past few years by the weakening Australian dollar offsetting the fall in the US$ international price. More recently there has been a rapid rise in coal prices, particularly premium coking coal which reached a price of US$245/t in October 2016.
In 2015, the iron ore AEDR/production ratio was 65 years, a decrease from the 2014 value of 75 years. This reduction is a result of a 10% increase in production that decreased AEDR by 5%. Continued weakness in the iron ore price has left exploration projects and high-cost operations suspended, as reflected in decreased exploration and resource-definition drilling. Iron ore AEDR have not kept pace with production as the major producers, Rio Tinto and BHP Billiton, continue to exceed their nameplate capacity through expansion and ramp- up of existing operations. Rio Tinto’s completed brownfield developments and infrastructure expansions have delivered an 11% increase in its global production to 327.6 Mt in 2015 – the Pilbara operation alone increased production by 10% to 309.9 Mt. The company’s global iron ore shipment is expected to reach 350 Mt in 2016. Meanwhile, BHP Western Australia Iron Ore (WAIO) recorded a 6% increase in the December 2015 half-year period to 131 Mt, offset by some operational issues (a train derailment and power outage) that reduced output volumes in the final quarter of 2015. WAIO expects to maintain its capacity guidance of 270 Mt for the 2015–16 financial year and anticipates that production will rise to 290 Mt over time as a result of increased operational efficiency of its integrated supply system and corresponding additional capacity from its Jimblebar mining hub.
Over the last decade, the AEDR/production ratio for nickel has declined from 125 years in 2005 to 85 years in 2015, with
lows of 75 years in 2012 and 2014. Similarly, the Reserve/production ratio has fallen from 35 years to 25 years over the same period. In 2015, AEDR and Reserve delineation fell 1% and 9%, respectively, and mine production fell 4%, despite an estimated global increase in production. In addition, exploration expenditure for nickel in Australia has declined 75% since 2011, reflecting historically low nickel prices.
The AEDR/production ratio for copper in 2015 was unchanged from the previous year. In 2000, the ratio was 30 years but over the next decade it progressively increased as a result of increasing resources, particularly at Olympic Dam. Since 2010, the AEDR/production ratio has ranged between 90 and 100 years owing to variations in the rates of production and delineation of resources. The Reserves/production ratio has similarly remained in a band between 20 and 30 years, reflecting steady near-term, commercial supply.
Resource life for lead increased in 2015 from 50 to 70 years because production in Australia decreased by 11%, following a global trend. Similarly, a large reduction (26%) in silver production, owing to the closure of several mines, also increased the AEDR/production ratio for this commodity from 45 to 75 years. Only zinc’s AEDR/production ratio remained unchanged in 2015, despite a minor rise (3%) in production.
The rounded gold AEDR/production ratio was unchanged in 2015 at 35 years. However, the raw data show a small increase to 34 years, up from 33 years in 2014, owing to an increase in resource inventory only partially offset by a smaller increase in production. Production is dominantly derived from lode-gold deposits (176 t in 2015 or 63% of total production) while copper-gold deposits host the largest share of resources (5005 t AEDR in 2015 or 53% of total AEDR). In 2015, AEDR attributable to lode-gold deposits increased 240 t to 3829 t while production fell 2.56 t, yielding a ratio of 22 years (2 years
www.ga.gov.au 15
more than in 2014). For copper-gold deposits, falls in both AEDR (-356 t) and production (-1.54 t) yielded a ratio of 63 years (2 years less than in 2014). Despite both major deposit types producing less gold in 2015 compared to the previous year, increased production from other deposit types resulted in a small (4t) increase in 2015. While gold resources in copper-gold deposits are substantial, current and likely mining rates of these large, generally low-grade, deposits are unlikely to lead to substantial increases in output. The state of gold production in Australia, therefore, continues to be dominated by lode-gold deposits and exploration success for these deposit types will need to continue to assure future production rates.
For heavy mineral sands operations, some producers closed down low-grade ilmenite deposits in 2008 to concentrate on deposits that have higher zircon content or are more readily amenable to beneficiation. However, sharply lower levels of production of ilmenite, rutile and zircon in 2009, resulting from the flow-on effects of the global financial crisis in late 2008 and early 2009, led to increases in resource life in 2010. In 2012, an increase in ilmenite production decreased the ilmenite AEDR/production ratio but, in 2013, the mineral sands industry was again affected by low prices leading to a drop in production and a consequent large increase in the AEDR/production ratio for rutile and ilmenite. In 2014, ilmenite and rutile production remained low and AEDR for all three mineral sands commodities fell owing to recategorisation of accessibility. In 2015, zircon production fell 25% in Australia despite an increase in global production. Ilmenite production also fell (9%) but rutile production increased by a third. In 2015, AEDR for ilmenite, rutile and zircon all increased.
For uranium, AEDR/production ratios increased from 2005 to 2010, the result of significant increases in Australia’s uranium resources. A large proportion of this increase was a consequence of ongoing mineral resource evaluation at the Olympic Dam deposit. From 2011 onwards, uranium resources have remained fairly static but operational problems affected production rates at three uranium mines (damage to a haulage shaft at Olympic Dam, flooding at the Ranger 3 pit and operating problems at Beverley), which is reflected in the AEDR/production ratios. Rectification of operational problems from 2012 onwards led to increased production, resulting in a slightly lower AEDR/production ratio. In 2015, both AEDR and production increased for uranium resulting in a slightly reduced resource life of 210 years.
Increases in mining and processing costs since 2011 have limited the growth of Australia’s AEDR for many commodities, though a significant one-off increase in AEDR of uranium resulted from the Queensland State Government lifting its 32-year ban on uranium mining in 2014. However, in 2015,
the incoming Queensland Government indicated that this policy is under review. Recognising improvements in nationally endorsed safety and environmental regulation, the New South Wales State Government has also lifted its prohibition on uranium exploration.
Market prices for uranium progressively decreased from 2011 to 2014 but a changing supply to demand balance led to a slight uptick in late 2014. Prices have remained soft in 2015 but have stabilised above the lows of 2014. From 2011 to 2015, spot prices remained below the level required to stimulate exploration with exploration expenditure for uranium down 80% from the highs of 2008. Mining and exploration companies in Australia have delayed uranium projects that have become uneconomic in the current market, focusing investment on advancing only those projects that should result in the highest return on capital investments. In addition, Energy Resources of Australia has announced the impending closure of the Ranger mine. Attendant changes in leasing arrangements are anticipated to affect future AEDR.
Value of Australian Mineral ExportsIn 2015, Australian mineral exports (excluding petroleum products) amounted to approximately $141 billion, almost 56% of all export merchandise and 45% of all exported goods and services (Table 4) Gross domestic product (GDP) in 2015 was approximately $1643 billion, with mineral exports contributing almost 9%. As a percentage of GDP, mineral exports have trended down from the 2011 level of 11%. The value of total mineral exports is at its lowest point in the last five years reflecting generally weak commodity prices but is particularly affected by the steep fall in the iron ore price, which has only partially been offset by increased iron ore production.
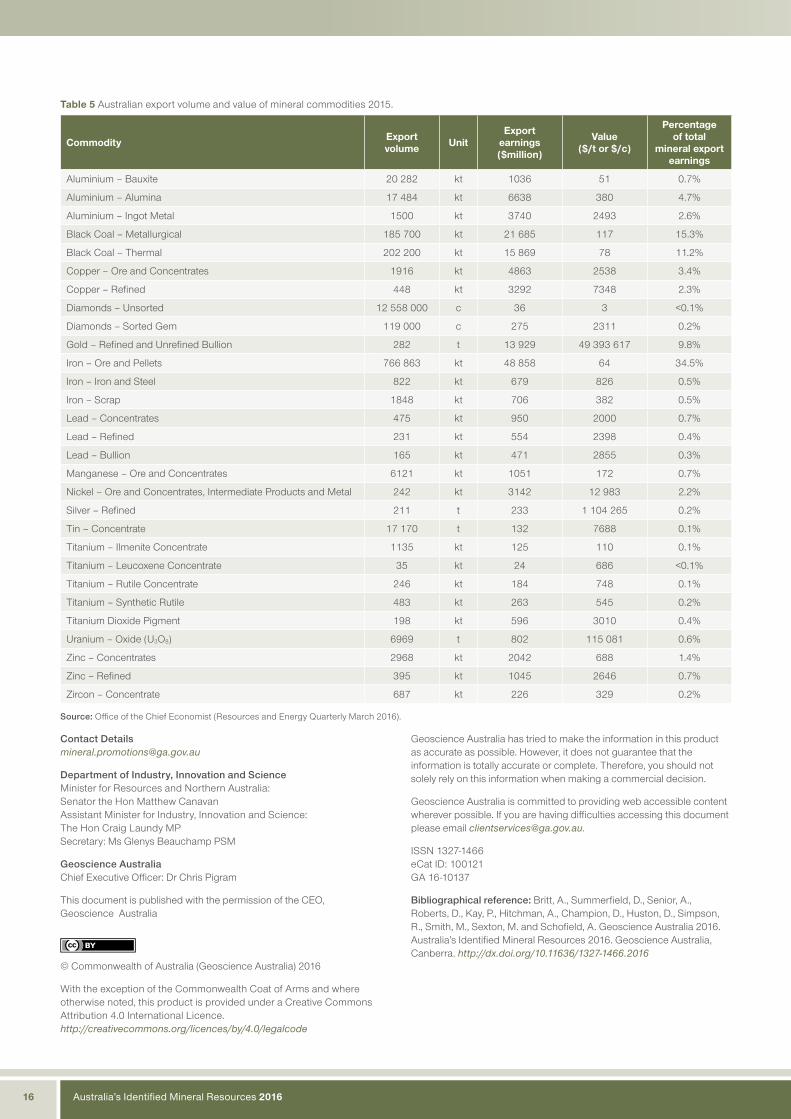
Quarterly reports published by the Office of the Chief Economist show that the main mineral export earners in 2015 were iron ore, black coal, gold, copper, alumina, aluminium, nickel and zinc (Table 5), unchanged from 2014. Comparing export earnings to export volume, it is clear that processed mineral commodities are worth more per unit than raw minerals or concentrates, often significantly so. Bauxite in 2014, for example, was worth $51/t whereas alumina was worth $380/t and aluminium metal was worth $2493/t, a seven-fold increase on the price of alumina and a massive 49-fold increase on the price of bauxite. Similar value-adding is seen in the copper, iron, titanium and zinc industries and, to a lesser extent, in the lead sector. Thus any appraisal of the strength of Australia’s minerals industry must also include domestic downstream processes, such as refining and smelting, in addition to mineral discovery, mining and raw material exports.
Table 4 Total mineral exports ($million) 2011–2015 and as a percentage of various economic categories.
2011 2012 2013 2014 2015
Total Mineral Exports (TME) $165 405 m $146 301 m $160 127 m $156 600 m $141 450 m
TME as a percentage of Total Resources and Energy Exports 87% 83% 86% 84% 85%
TME as a percentage of Total Merchandise Exports 63% 59% 61% 59% 56%
TME as a percentage of Total Goods and Services Exports 53% 49% 50% 48% 45%
TME as a percentage of Gross Domestic Product 11% 10% 10% 10% 9%
Source: Office of the Chief Economist (Resources and Energy Quarterly, March 2016) and Australian Bureau of Statistics (Australian National Accounts: National Income, Expenditure and Product, June 2016).
Australia’s Identified Mineral Resources 201616
Table 5 Australian export volume and value of mineral commodities 2015.
Commodity Export volume Unit
Export earnings ($million)
Value ($/t or $/c)
Percentage of total
mineral export earnings
Aluminium – Bauxite 20 282 kt 1036 51 0.7%
Aluminium – Alumina 17 484 kt 6638 380 4.7%
Aluminium – Ingot Metal 1500 kt 3740 2493 2.6%
Black Coal – Metallurgical 185 700 kt 21 685 117 15.3%
Black Coal – Thermal 202 200 kt 15 869 78 11.2%
Copper – Ore and Concentrates 1916 kt 4863 2538 3.4%
Copper – Refined 448 kt 3292 7348 2.3%
Diamonds – Unsorted 12 558 000 c 36 3 <0.1%
Diamonds – Sorted Gem 119 000 c 275 2311 0.2%
Gold – Refined and Unrefined Bullion 282 t 13 929 49 393 617 9.8%
Iron – Ore and Pellets 766 863 kt 48 858 64 34.5%
Iron – Iron and Steel 822 kt 679 826 0.5%
Iron – Scrap 1848 kt 706 382 0.5%
Lead – Concentrates 475 kt 950 2000 0.7%
Lead – Refined 231 kt 554 2398 0.4%
Lead – Bullion 165 kt 471 2855 0.3%
Manganese – Ore and Concentrates 6121 kt 1051 172 0.7%
Nickel – Ore and Concentrates, Intermediate Products and Metal 242 kt 3142 12 983 2.2%
Silver – Refined 211 t 233 1 104 265 0.2%
Tin – Concentrate 17 170 t 132 7688 0.1%
Titanium – Ilmenite Concentrate 1135 kt 125 110 0.1%
Titanium – Leucoxene Concentrate 35 kt 24 686 <0.1%
Titanium – Rutile Concentrate 246 kt 184 748 0.1%
Titanium – Synthetic Rutile 483 kt 263 545 0.2%
Titanium Dioxide Pigment 198 kt 596 3010 0.4%
Uranium – Oxide (U3O8) 6969 t 802 115 081 0.6%
Zinc – Concentrates 2968 kt 2042 688 1.4%
Zinc – Refined 395 kt 1045 2646 0.7%
Zircon – Concentrate 687 kt 226 329 0.2%
Source: Office of the Chief Economist (Resources and Energy Quarterly March 2016).
Contact [email protected]
Department of Industry, Innovation and ScienceMinister for Resources and Northern Australia: Senator the Hon Matthew CanavanAssistant Minister for Industry, Innovation and Science: The Hon Craig Laundy MPSecretary: Ms Glenys Beauchamp PSM
Geoscience AustraliaChief Executive Officer: Dr Chris Pigram
This document is published with the permission of the CEO, Geoscience Australia
© Commonwealth of Australia (Geoscience Australia) 2016
With the exception of the Commonwealth Coat of Arms and where otherwise noted, this product is provided under a Creative Commons Attribution 4.0 International Licence.http://creativecommons.org/licences/by/4.0/legalcode
Geoscience Australia has tried to make the information in this product as accurate as possible. However, it does not guarantee that the information is totally accurate or complete. Therefore, you should not solely rely on this information when making a commercial decision.
Geoscience Australia is committed to providing web accessible content wherever possible. If you are having difficulties accessing this document please email [email protected].
ISSN 1327-1466eCat ID: 100121GA 16-10137
Bibliographical reference: Britt, A., Summerfield, D., Senior, A., Roberts, D., Kay, P., Hitchman, A., Champion, D., Huston, D., Simpson, R., Smith, M., Sexton, M. and Schofield, A. Geoscience Australia 2016. Australia’s Identified Mineral Resources 2016. Geoscience Australia, Canberra. http://dx.doi.org/10.11636/1327-1466.2016