australian securitisation seminar london · australian securitisation seminar london 13 ... that...
TRANSCRIPT

Australian Securitisation SeminarLondon
13 June 2016
Agenda
1. Welcome Vanessa Docherty – Partner, K&WM London
2. Outlook for the Australian economy, banking and residential property markets
3. Australian RMBS performance trends and outlook
4. Outlook for ABS sector and other market developments
5. Closing remarks
Outlook for the Australian economy, banking and residential property markets
Speaker Position Organisation
Moderator
Chris Dalton Chief Executive Officer Australian Securitisation Forum
Panellists
Nick Parsons Head of Markets Strategy, Europe National Australia Bank
Gavin Friend Senior Market Strategist National Australia Bank

Housing – prices
Capital city prices are up a cumulative 37% this growth cycle (started May 2012) and are 27% higher than its previous peak (Oct 2010).
Sydney prices are up 50% from its previous peak (Nov 2010), Melbourne 25% (Oct 2010) higher, Brisbane is up 4% from its previous peak (Nov 2009) while Perth is down 7% from its previous peak (December 2014).
0
100
200
300
400
500
600
700
800
900
1,000
May 96
May 97
May 98
May 99
May 00
May 01
May 02
May 03
May 04
May 05
May 06
May 07
May 08
May 09
May 10
May 11
May 12
May 13
May 14
May 15
May 16
Dwelling Value Index
8 Capital City Dwell Syd Melb Bris Perth
Source: NAB, CoreLogic
AUD 000's
What has been driving house prices?1. Record low mortgage rates – still falling2. Foreign demand – slowing3. Supply / demand imbalance – rapid apartment construction (as well as current pipeline)
has reduced undersupply in major capital cities

House prices – over the longer term
Source: CoreLogic, Quarterly Review – The Australian Residential Property Market and Economy – Released May 2016
Sydney Houses UnitsMedian Price $885,000 $680,000Quarterly Value Change 3.8% 4.4%12 month Value Change 8.4% 11.5%5yr Value Change 8.3% 6.9%10yr Value Change 6.2% 2.8%15yr Value Change 6.9% 5.6%Change Prev Peak 46.2% 36.9%Median Rental Rate $619 $546Gross Rental Yield 3.1% 4.0%
Melbourne Houses UnitsMedian Price $642,000 $489,000Quarterly Value Change 1.0% -0.7%12 month Value Change 10.8% 4.7%5yr Value Change 4.7% 1.9%10yr Value Change 7.2% 5.2%15yr Value Change 8.2% 6.0%Change Prev Peak 21.2% 7.5%Median Rental Rate $463 $405Gross Rental Yield 2.9% 4.0%
Brisbane Houses UnitsMedian Price $500,000 $382,500Quarterly Value Change 3.2% -1.5%12 month Value Change 6.7% 1.2%5yr Value Change 2.2% 0.5%10yr Value Change 3.9% 3.1%15yr Value Change 8.0% 5.6%Change Prev Peak 4.7% -3.5%Median Rental Rate $436 $406Gross Rental Yield 4.2% 5.3%
Perth Houses UnitsMedian Price $523,500 $415,000Quarterly Value Change 0.8% -3.1%12 month Value Change -2.2% -0.1%5yr Value Change 1.3% 0.2%10yr Value Change 2.8% 2.8%15yr Value Change 7.9% 6.9%Change Prev Peak -4.2% -6.6%Median Rental Rate $441 $393Gross Rental Yield 3.7% 4.3%
Australian housing – affordability
5.5
6.0
6.5
7.0
7.5
8.0
8.5
9.0
9.5
10.0
10.5
11.0
11.5
May 06
Nov 06
May 07
Nov 07
May 08
Nov 08
May 09
Nov 09
May 10
Nov 10
May 11
Nov 11
May 12
Nov 12
May 13
Nov 13
May 14
Nov 14
May 15
Nov 15
May 16
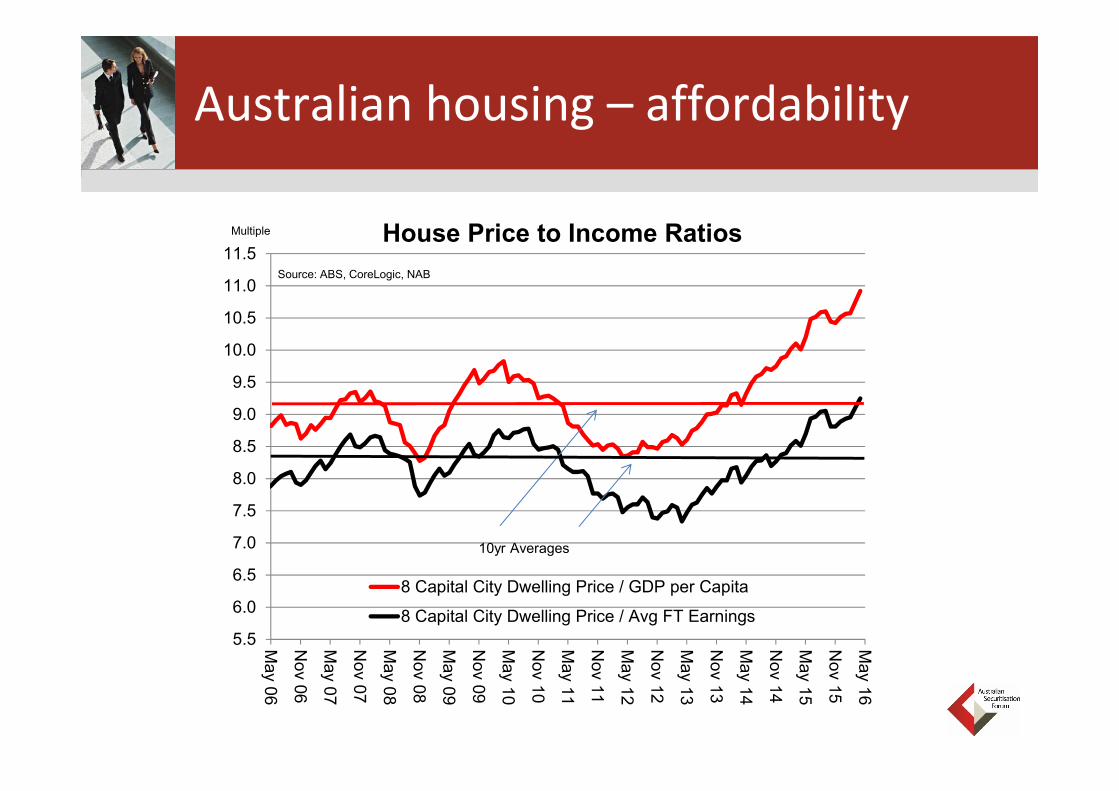
House Price to Income Ratios
8 Capital City Dwelling Price / GDP per Capita
8 Capital City Dwelling Price / Avg FT Earnings
Source: ABS, CoreLogic, NAB
Multiple
10yr Averages

Households –income and balance sheets
Household indebtedness has been steady since 2005‐2006. Household indebtedness rose in 1990’s due to:(1) Australia’s transition from high inflation in 70’s & 80’s to low inflation in 90’s, (2) Interest rates fell, (3) Prices kept rising and (4) Availability of finance improved.
Household indebtedness was tested through the Global Financial Crisis and through two periods of slowing domestic economic growth (Jun‐07 – Sep‐09 and Mar‐12 – Mar‐13).
Recent increases has taken indebtedness to historic highs (again interest rates have fallen), but a breakout does not seem likely, nor does a fall. Owner occupied debt has been steady indicating that recent rises have been due to investors.
Rise in indebtedness has made households more sensitive to interest rates.
0
30
60
90
120
150
180
210
0
30
60
90
120
150
180
210
Dec 95
Dec 96
Dec 97
Dec 98
Dec 99
Dec 00
Dec 01
Dec 02
Dec 03
Dec 04
Dec 05
Dec 06
Dec 07
Dec 08
Dec 09
Dec 10
Dec 11
Dec 12
Dec 13
Dec 14
Dec 15
Household Indebtedness
Total Household Debt to Disposable Income
Housing Debt to Disposable Income
Owner Occupied Debt to Disposable IncomeSource: RBA, NAB
% %

Housing – demand and supply
Population growth, from overseas migration, is forecast to be the major source of increased demand.
People want to live in the cities. At just under 80%, Australia is one of the most urbanised countries in the developed world.
Increase in supply of apartments is part of a long term adjustment to meet demand.
From one of the lowest bases in the developed world, population density (in cities) is rising.
0
25
50
75
100
125
150
175
200
225
250
Dec
-85
Dec
-87
Dec
-89
Dec
-91
Dec
-93
Dec
-95
Dec
-97
Dec
-99
Dec
-01
Dec
-03
Dec
-05
Dec
-07
Dec
-09
Dec
-11
Dec
-13
Dec
-15
Dwelling Approvals
Houses Apartments Total Dwellings
Source: ABS, NAB
12mth Roll
0
5,000
10,000
15,000
20,000
25,000
30,000
0
50
100
150
200
250
300
350
400
450
500
Dec
-85
Dec
-87
Dec
-89
Dec
-91
Dec
-93
Dec
-95
Dec
-97
Dec
-99
Dec
-01
Dec
-03
Dec
-05
Dec
-07
Dec
-09
Dec
-11
Dec
-13
Dec
-15
Dec
-17
Dec
-19
Population Growth Natural IncreaseNatural Increase (f)Overseas MigrationOverseas Migration (f)Total IncreaseTotal Increase (f)Estimated Population
Source: ABS, DIBP, NAB
AnnualChg 000's 000's

Housing – demand from offshore
Foreign Investment Review Board –Applications Decided ($ Value)
Foreign Investment Review Board – Real Estate Applications Decided
Note: the statistics presented by the FIRB should be treated with caution as they merely reflect foreign investor intentions and not their actual purchases of Australian assets.
By value FIRB investment in residential real estate approvals rose 75% from $34.7bn to $60.8bn. $11.5bn (2013‐14: $7.5bn) of these approvals were for developed properties and 49.3bn ($27.2bn) were for development.
Commercial real estate approvals fell slightly from $39.9bn in 2013‐14 to $36.2bn in 2014‐15.
By country, China was the largest source country for approved proposed investment in 2014‐15 with total approvals of $46.6bn and within this amount $24.3bn for real estate approvals. The next highest was the US with $25.1bn for total approvals and $7.1bn for real estate approvals.
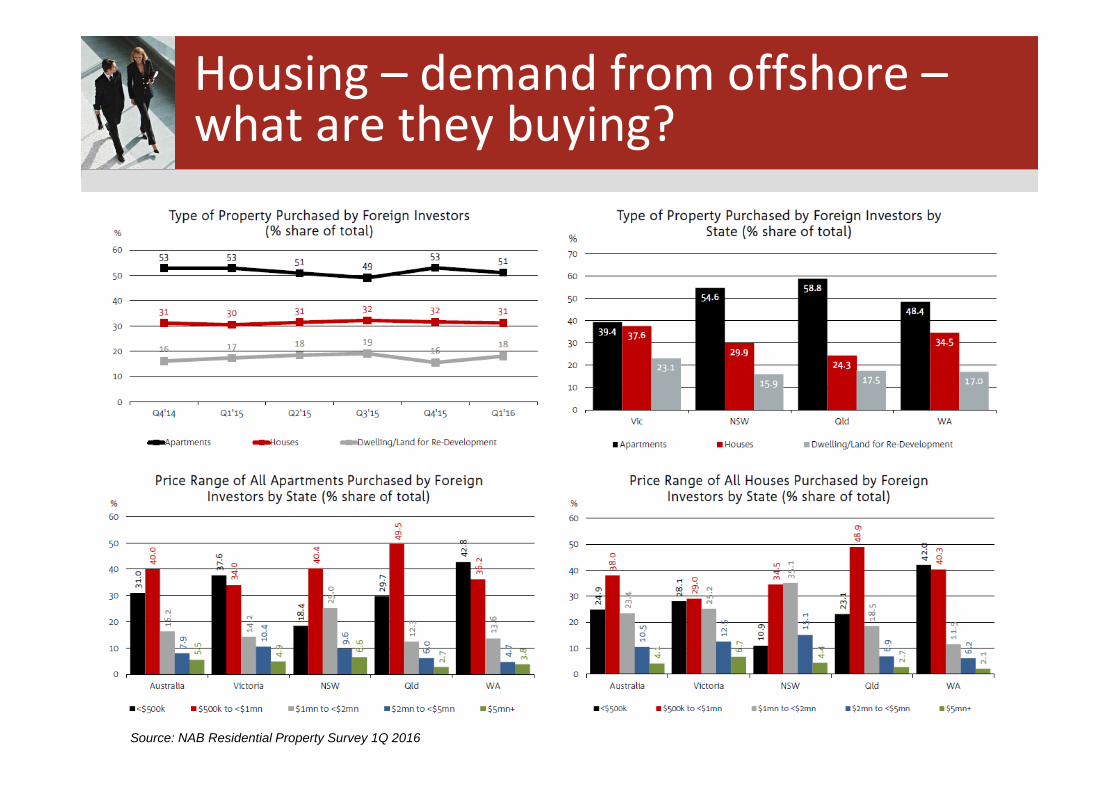
Housing – demand from offshore –what are they buying?
Source: NAB Residential Property Survey 1Q 2016
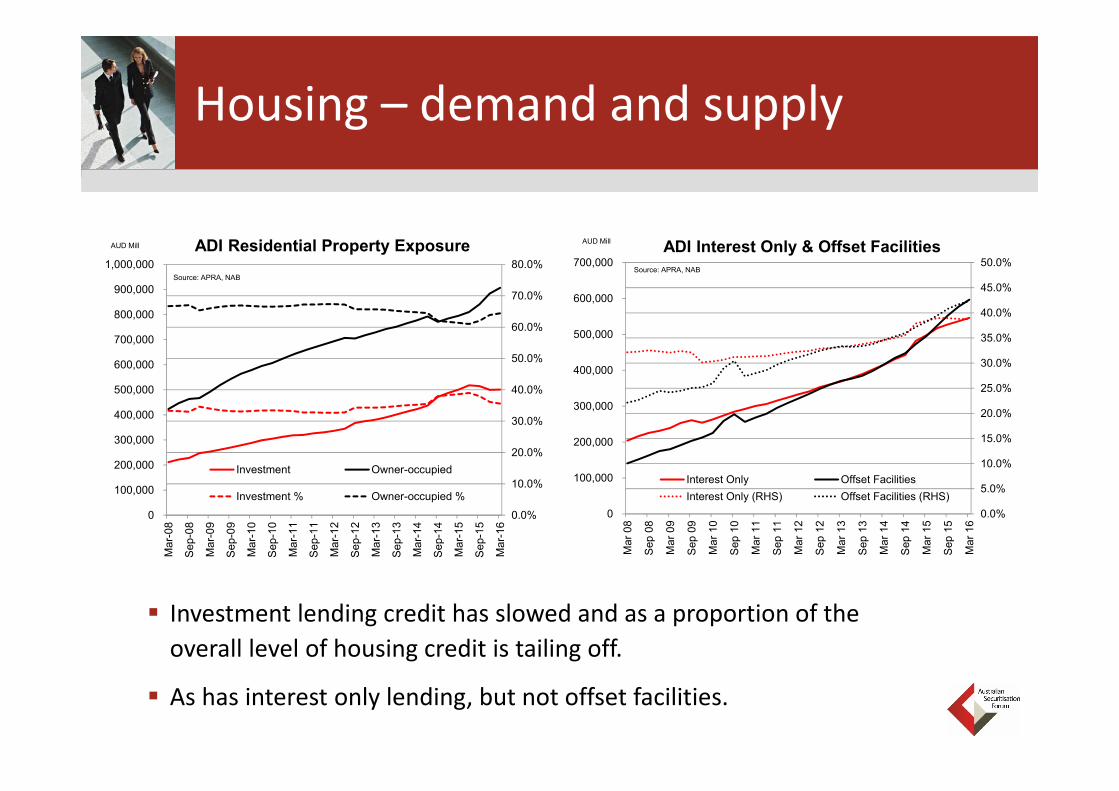
Housing – demand and supply
Investment lending credit has slowed and as a proportion of the overall level of housing credit is tailing off.
As has interest only lending, but not offset facilities.
0.0%
5.0%
10.0%
15.0%
20.0%
25.0%
30.0%
35.0%
40.0%
45.0%
50.0%
0
100,000
200,000
300,000
400,000
500,000
600,000
700,000
Mar
08
Sep
08
Mar
09
Sep
09
Mar
10
Sep
10
Mar
11
Sep
11
Mar
12
Sep
12
Mar
13
Sep
13
Mar
14
Sep
14
Mar
15
Sep
15
Mar
16
ADI Interest Only & Offset Facilities
Interest Only Offset FacilitiesInterest Only (RHS) Offset Facilities (RHS)
Source: APRA, NAB
AUD Mill
0.0%
10.0%
20.0%
30.0%
40.0%
50.0%
60.0%
70.0%
80.0%
0
100,000
200,000
300,000
400,000
500,000
600,000
700,000
800,000
900,000
1,000,000
Mar
-08
Sep-
08
Mar
-09
Sep-
09
Mar
-10
Sep-
10
Mar
-11
Sep-
11
Mar
-12
Sep-
12
Mar
-13
Sep-
13
Mar
-14
Sep-
14
Mar
-15
Sep-
15
Mar
-16
ADI Residential Property Exposure
Investment Owner-occupied
Investment % Owner-occupied %
AUD Mill
Source: APRA, NAB

Housing finance
More owner occupied and less investment lending –but overall steady metrics
0%
10%
20%
30%
40%
50%
60%
70%
80%
90%
Mar
08
Sep
08
Mar
09
Sep
09
Mar
10
Sep
10
Mar
11
Sep
11
Mar
12
Sep
12
Mar
13
Sep
13
Mar
14
Sep
14
Mar
15
Sep
15
Mar
16
ADI New Housing Loans
Owner Occupied Loans Investment LoansInterest Only LVR<80%LVR 80%-90% LVR>90%3rd Party Originated Loans
Source: APRA, NAB
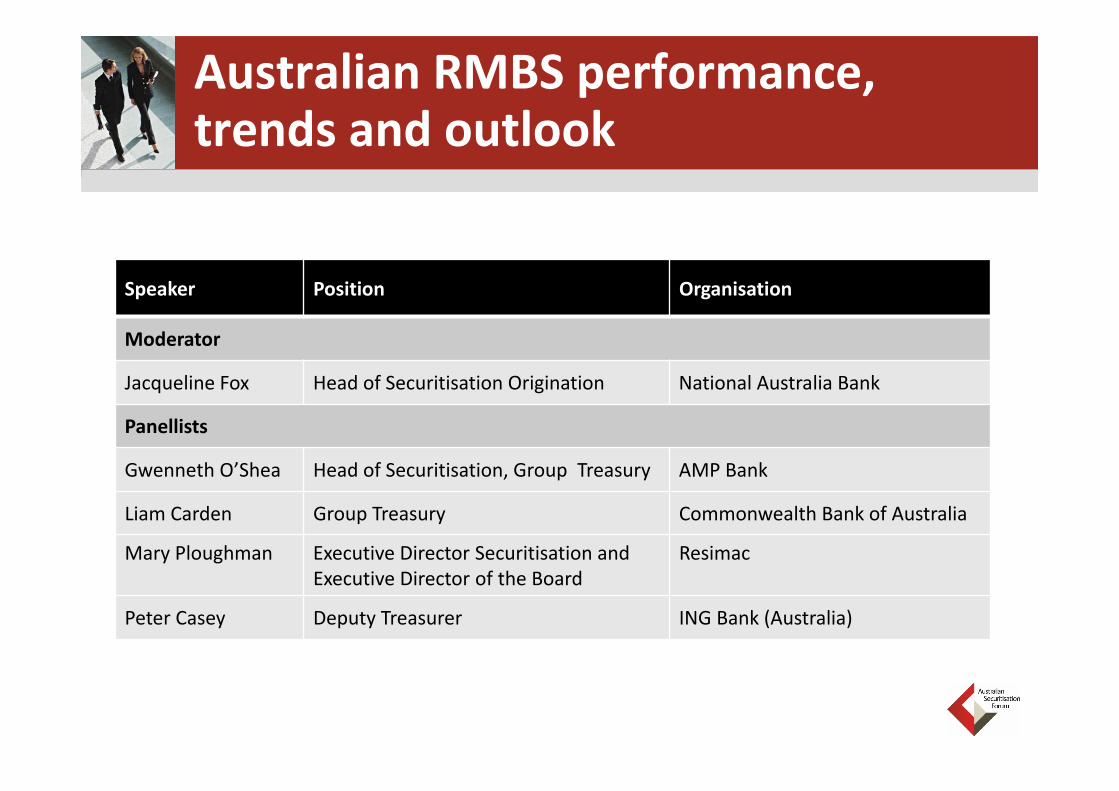
Australian RMBS performance, trends and outlook
Speaker Position Organisation
Moderator
Jacqueline Fox Head of Securitisation Origination National Australia Bank
Panellists
Gwenneth O’Shea Head of Securitisation, Group Treasury AMP Bank
Liam Carden Group Treasury Commonwealth Bank of Australia
Mary Ploughman Executive Director Securitisation and Executive Director of the Board
Resimac
Peter Casey Deputy Treasurer ING Bank (Australia)

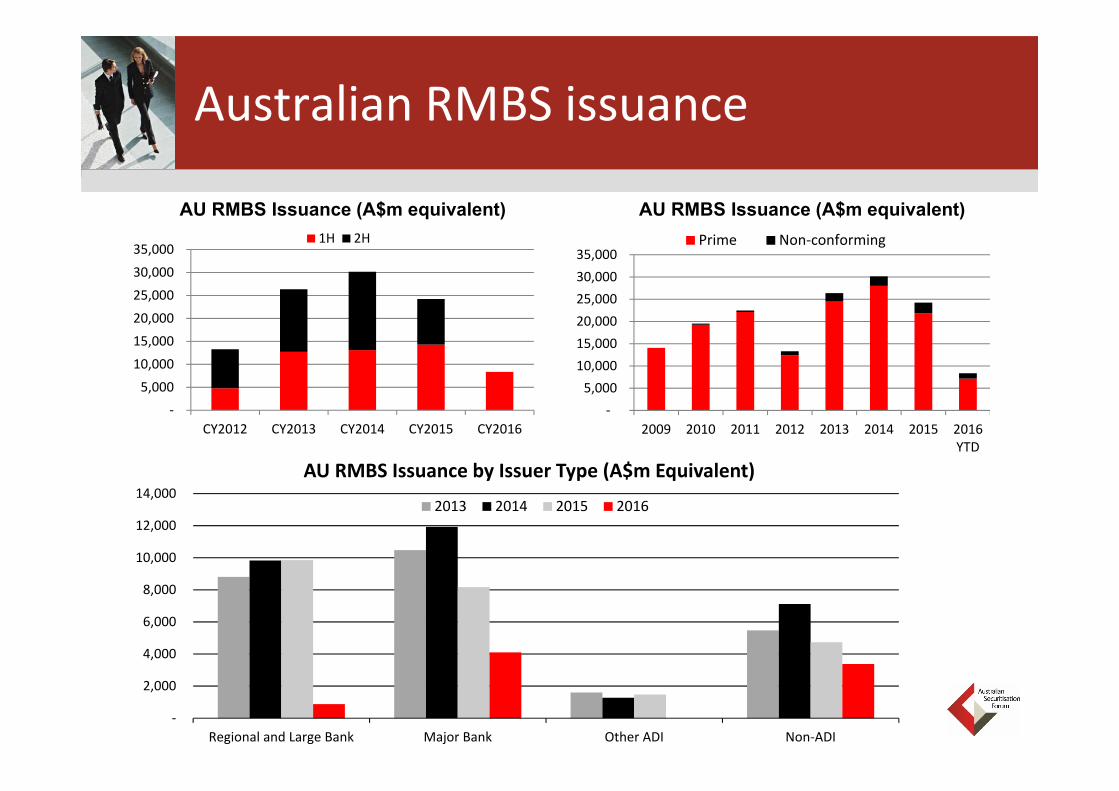
Australian RMBS – a “snapshot”
‐
5,000
10,000
15,000
20,000
25,000
30,000
35,000
CY2012 CY2013 CY2014 CY2015 CY2016
1H 2H
‐ 5,000
10,000 15,000 20,000 25,000 30,000 35,000
2009 2010 2011 2012 2013 2014 2015 2016YTD
Prime Non‐conforming
‐
2,000
4,000
6,000
8,000
10,000
12,000
14,000
Regional and Large Bank Major Bank Other ADI Non‐ADI
AU RMBS Issuance by Issuer Type (A$m Equivalent)
2013 2014 2015 2016
Australian RMBS issuance
AU RMBS Issuance (A$m equivalent) AU RMBS Issuance (A$m equivalent)
Source: NAB PoolMasterBig 4 Banks - excludes NAB’s NRMBS 2016-1 –priced 9-Jun-16
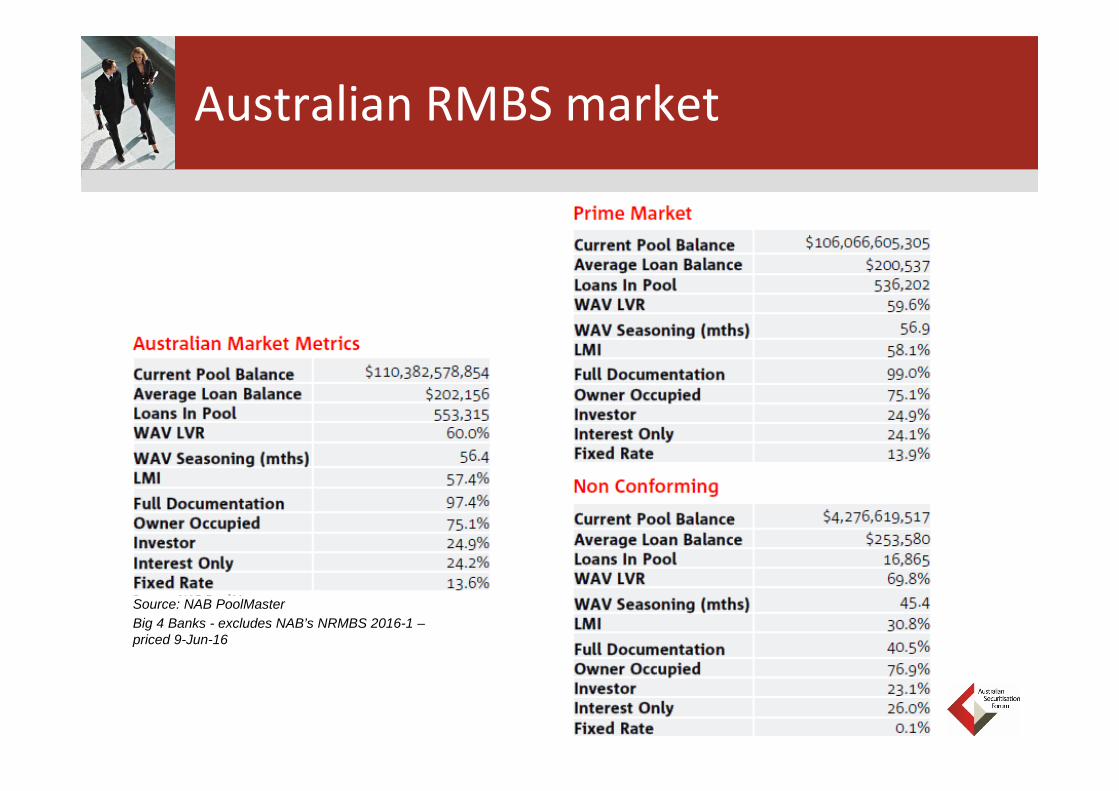
Australian RMBS market
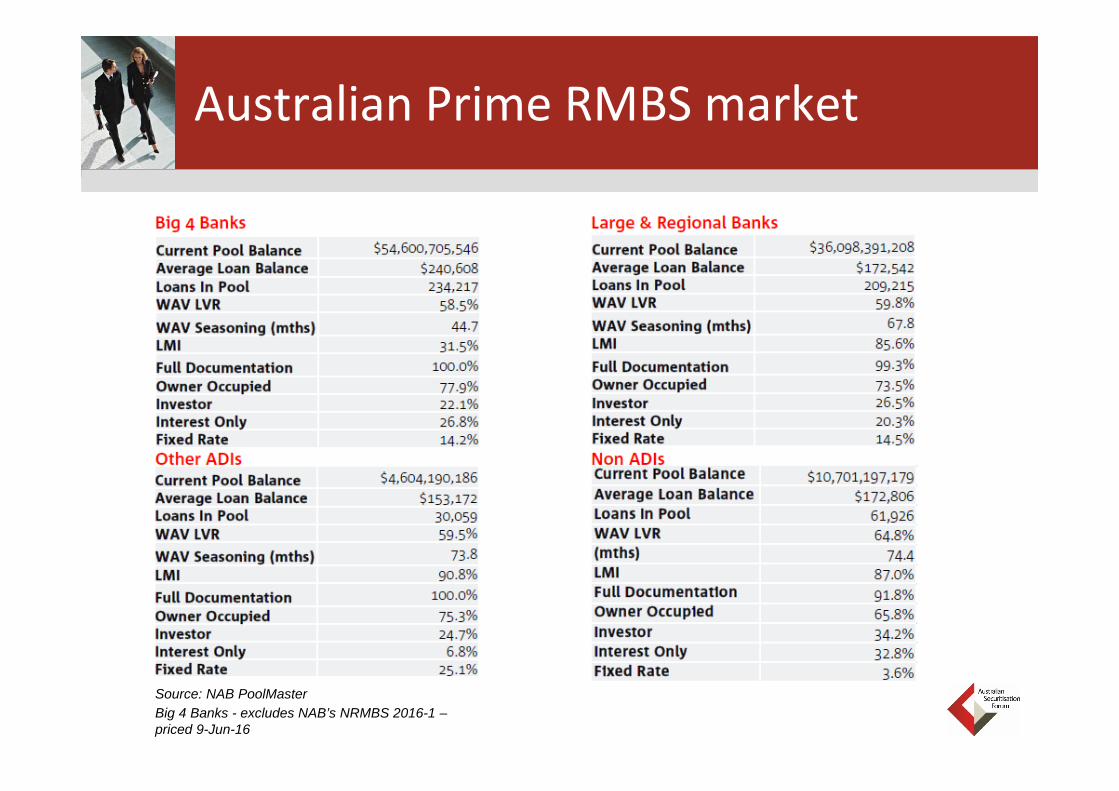
Australian Prime RMBS market
Source: NAB PoolMasterBig 4 Banks - excludes NAB’s NRMBS 2016-1 –priced 9-Jun-16
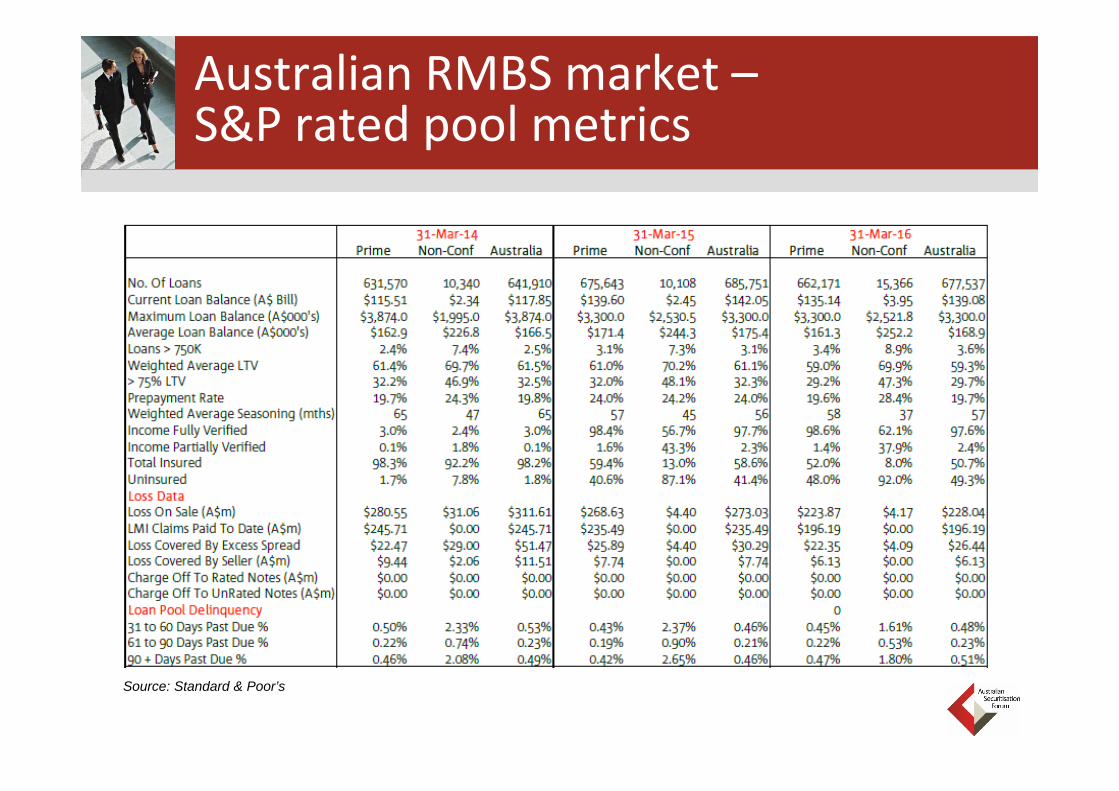
Source: Standard & Poor’s
Australian RMBS market –S&P rated pool metrics
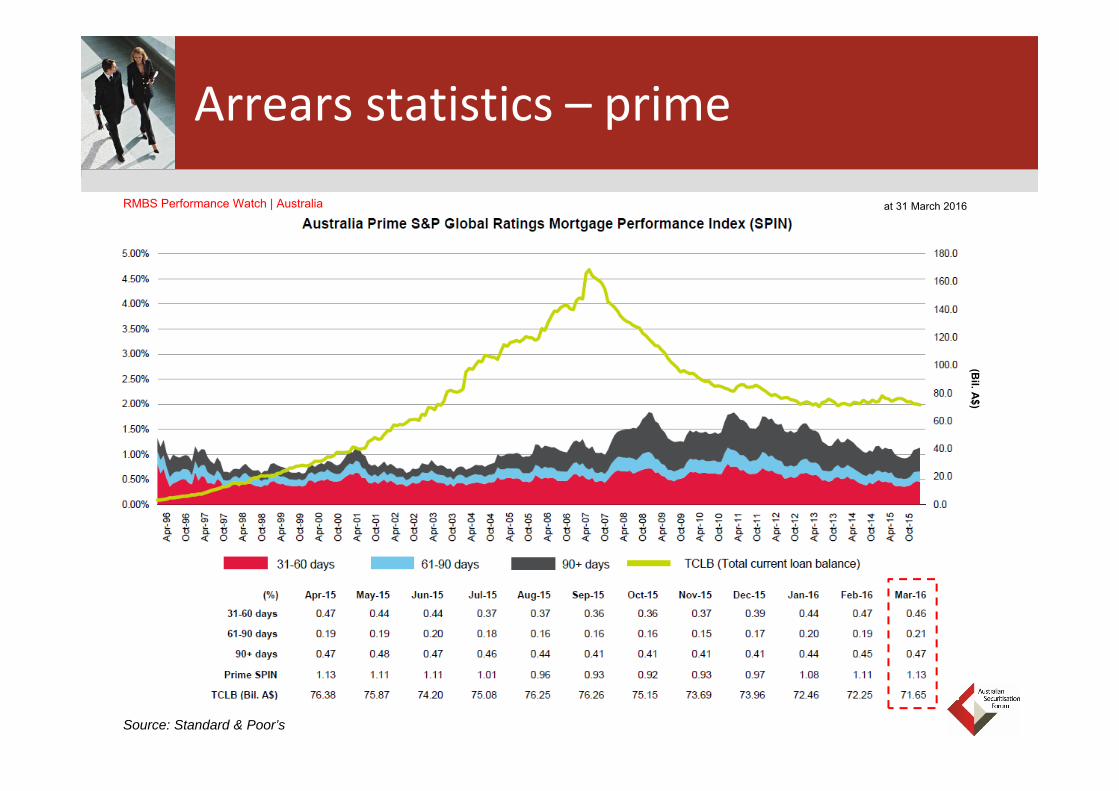
Arrears statistics – prime
Source: Standard & Poor’s
(Bil. A$)
at 31 March 2016RMBS Performance Watch | Australia
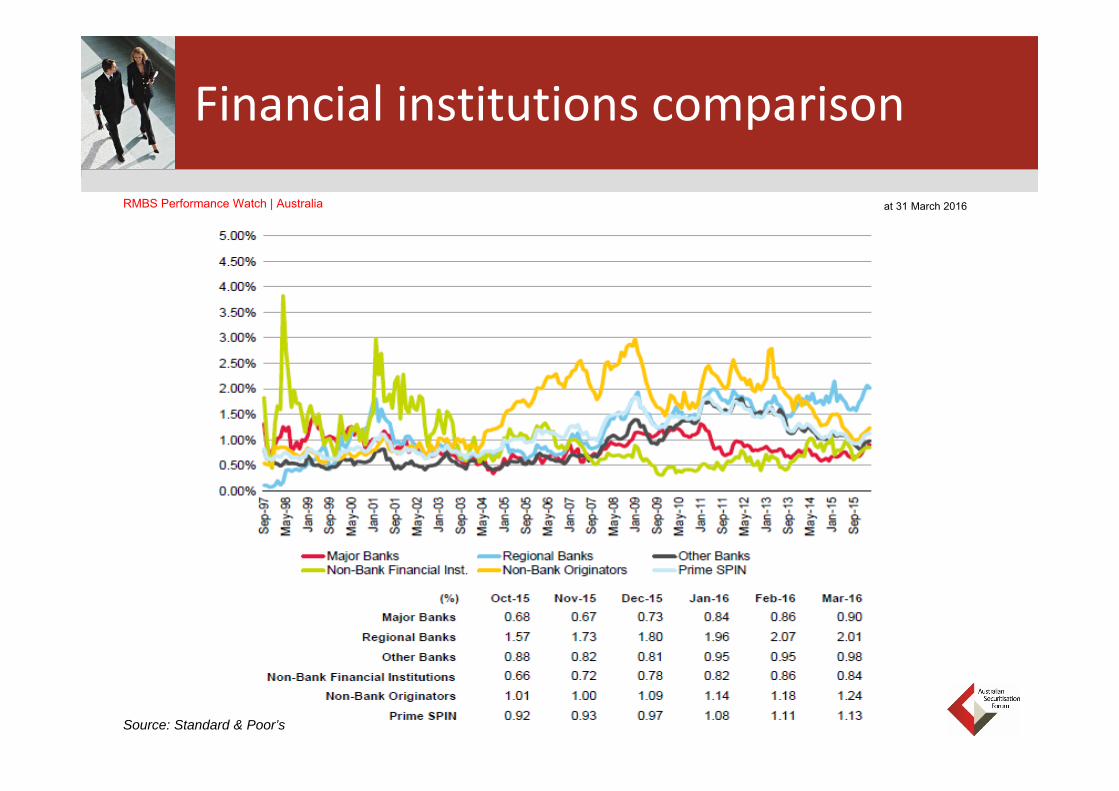
Financial institutions comparison
at 31 March 2016RMBS Performance Watch | Australia
Source: Standard & Poor’s

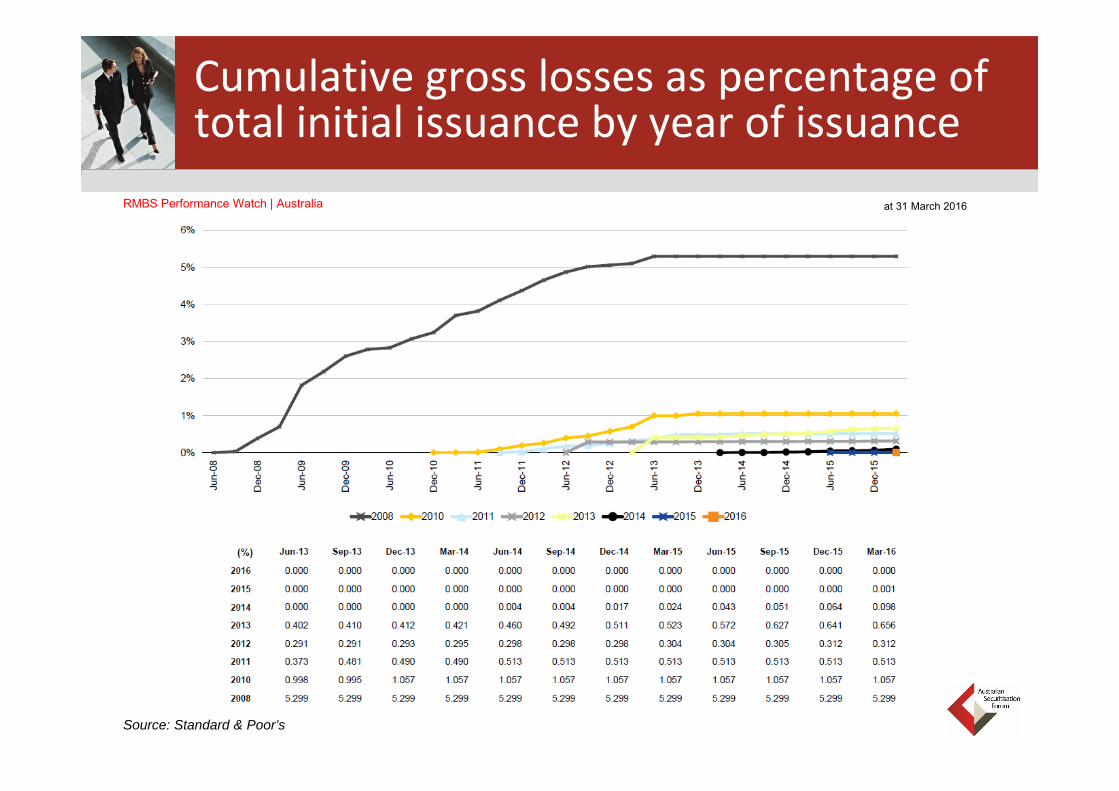
Cumulative gross losses as percentage of total initial issuance by year of issuance
Source: Standard & Poor’s
at 31 March 2016RMBS Performance Watch | Australia

Arrears statistics – non‐conforming
Source: Standard & Poor’s
at 31 March 2016RMBS Performance Watch | Australia
(Bil. A$)
Cumulative gross losses as percentage of total initial issuance by year of issuance
at 31 March 2016RMBS Performance Watch | Australia
Source: Standard & Poor’s
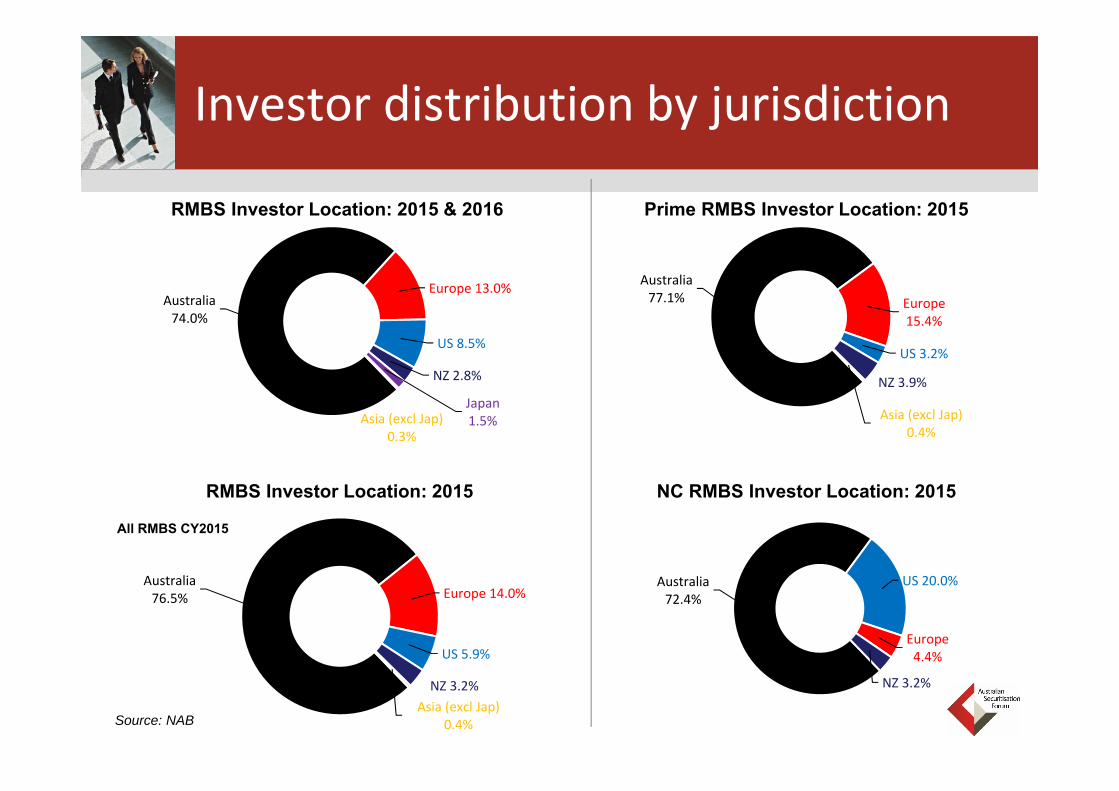
Australia74.0%
Europe 13.0%
US 8.5%
NZ 2.8%
Japan1.5%Asia (excl Jap)
0.3%
Australia 76.5% Europe 14.0%
US 5.9%
NZ 3.2%Asia (excl Jap)
0.4%
All RMBS CY2015
RMBS Investor Location: 2015
Australia 77.1% Europe
15.4%
US 3.2%
NZ 3.9%
Asia (excl Jap)0.4%
Australia72.4%
US 20.0%
Europe 4.4%
NZ 3.2%
NC RMBS Investor Location: 2015
Source: NAB
Investor distribution by jurisdiction
RMBS Investor Location: 2015 & 2016 Prime RMBS Investor Location: 2015
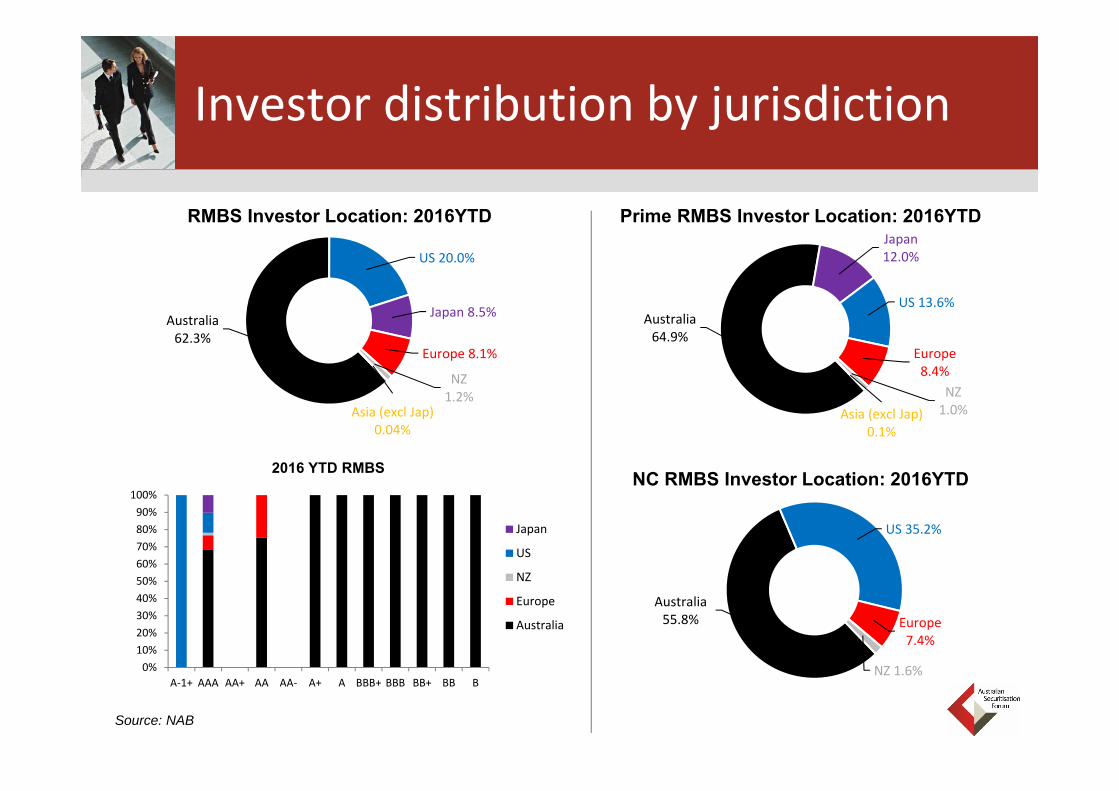
RMBS Investor Location: 2016YTD
0%10%20%30%40%50%60%70%80%90%
100%
A‐1+ AAA AA+ AA AA‐ A+ A BBB+ BBB BB+ BB B
Chart Title
Japan
US
NZ
Europe
Australia
2016 YTD RMBS
Prime RMBS Investor Location: 2016YTD
Australia64.9%
Japan 12.0%
US 13.6%
Europe 8.4%
NZ1.0%Asia (excl Jap)
0.1%
Australia62.3%
US 20.0%
Japan 8.5%
Europe 8.1%
NZ1.2%
Asia (excl Jap)0.04%
Australia 55.8%
US 35.2%
Europe7.4%
NZ 1.6%
NC RMBS Investor Location: 2016YTD
Investor distribution by jurisdiction
Source: NAB

Pricing
Source: NAB

RMBS panel discussion
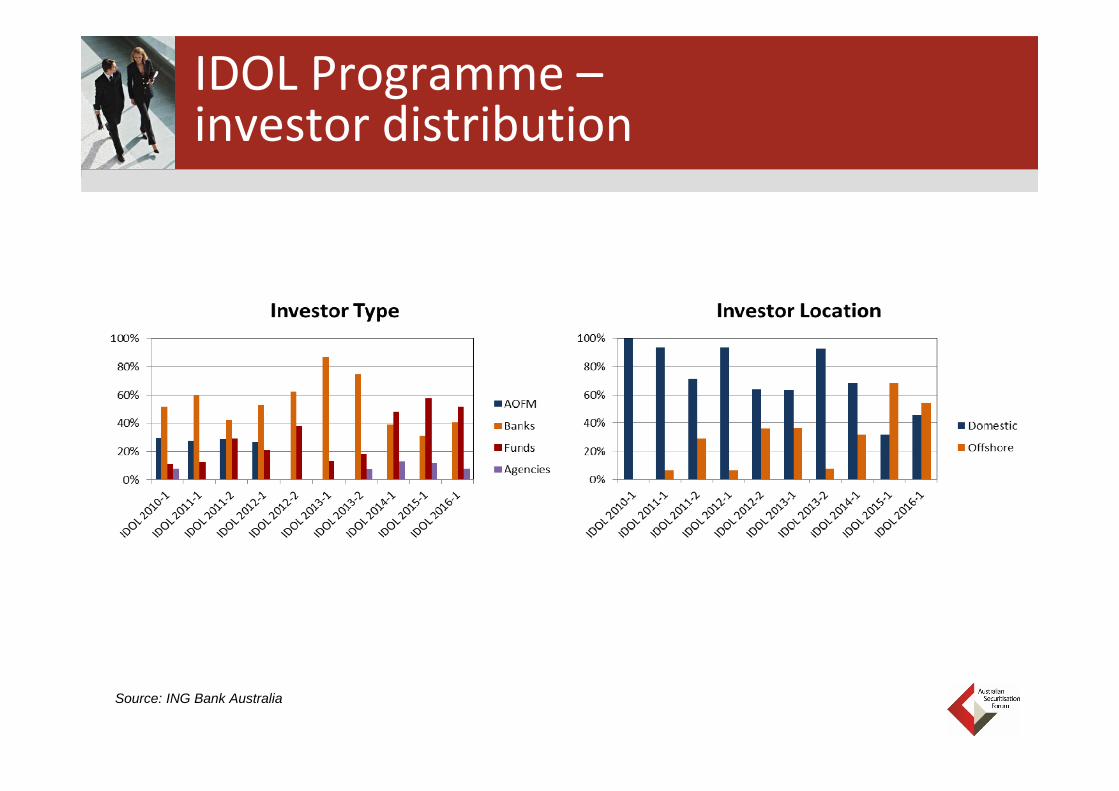
IDOL Programme –investor distribution
Source: ING Bank Australia
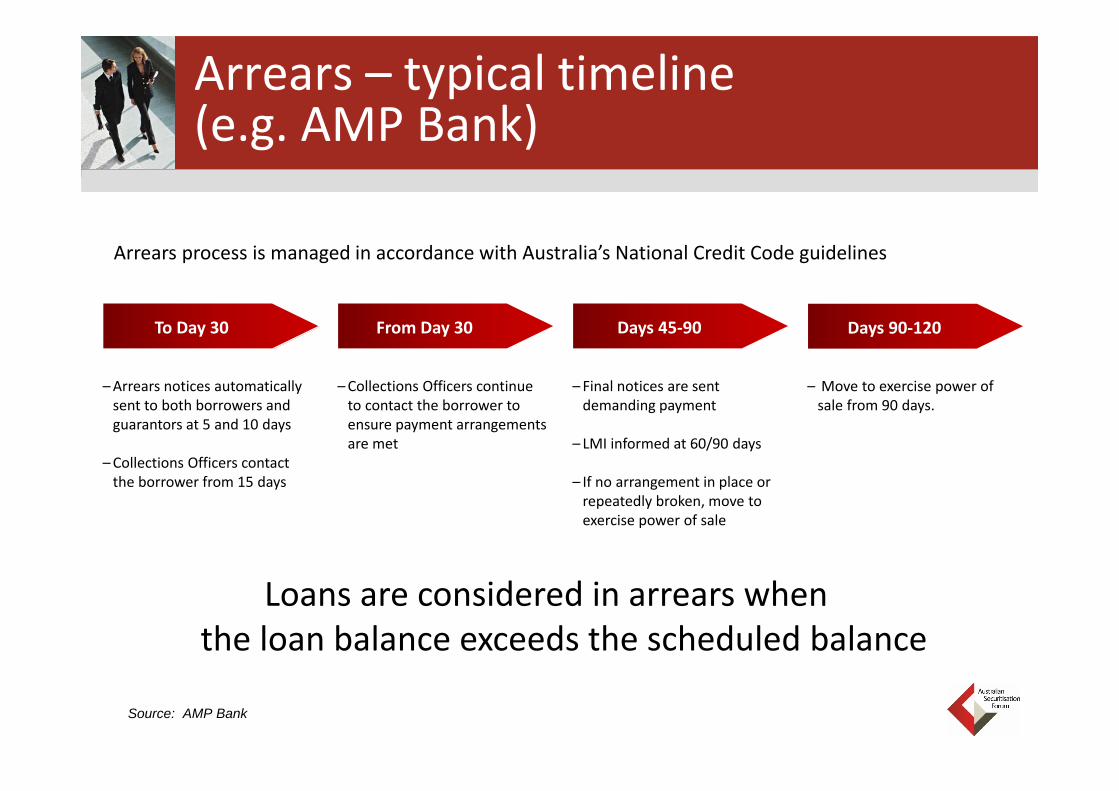
Arrears – typical timeline (e.g. AMP Bank)
From Day 30To Day 30
Arrears process is managed in accordance with Australia’s National Credit Code guidelines
–Arrears notices automatically sent to both borrowers and guarantors at 5 and 10 days
–Collections Officers contact the borrower from 15 days
Days 45‐90 Days 90‐120
–Final notices are sent demanding payment
– LMI informed at 60/90 days
– If no arrangement in place or repeatedly broken, move to exercise power of sale
– Move to exercise power of sale from 90 days.
–Collections Officers continue to contact the borrower to ensure payment arrangements are met
Loans are considered in arrears when the loan balance exceeds the scheduled balance
Source: AMP Bank

Speaker Position Organisation
Moderator
Michael Moloney Director Structured Finance Westpac
Panellists
Kevin Lee Division Director Macquarie Bank
Matthew O’Hare Deputy Group Treasurer Pepper
Richard McCarthy General Manager,Sales, Strategy and Marketing
Perpetual
Stephen Magan Executive Director, Securitized Products Group
J.P. Morgan Australia
Outlook for ABS sector and other market developments

Whilst other markets have contracted post GFC, the number of issuers in the ABS space has increased with new issuance programmes from a broad range of entities and varying asset types ...
... as well as the return of less traditional issuers in this asset class …
2009 2010 2011 2012 2013
… though consolidation continues to occur which could reduce supply.
Westpac acquired Lloyds Banking Group’s Australian asset finance business, Capital Finance Australia Limited (CFAL), and its Australian corporate loan portfolio, BOS International (Australia) Ltd in 2013.
BOQ acquired Investec Bank (Australia) Limited’s Professional Finance and Asset Finance & Leasing businesses in 2014.
2016+
Possible new sources of ABS issuance.
Other ABS – issuer trends

2015 was the strongest year for issuance of ‘Other ABS’ on record with just over AUD6.1bn issued across 10 transactions.
Investors have been attracted to this asset class by the shorter dated tenors, the higher yielding underlying assets, lower extension risks and the more generous levels of subordination.
2016 issuance has been strong with $3.4bn issued to date across five transactions.
Other ABS issuance
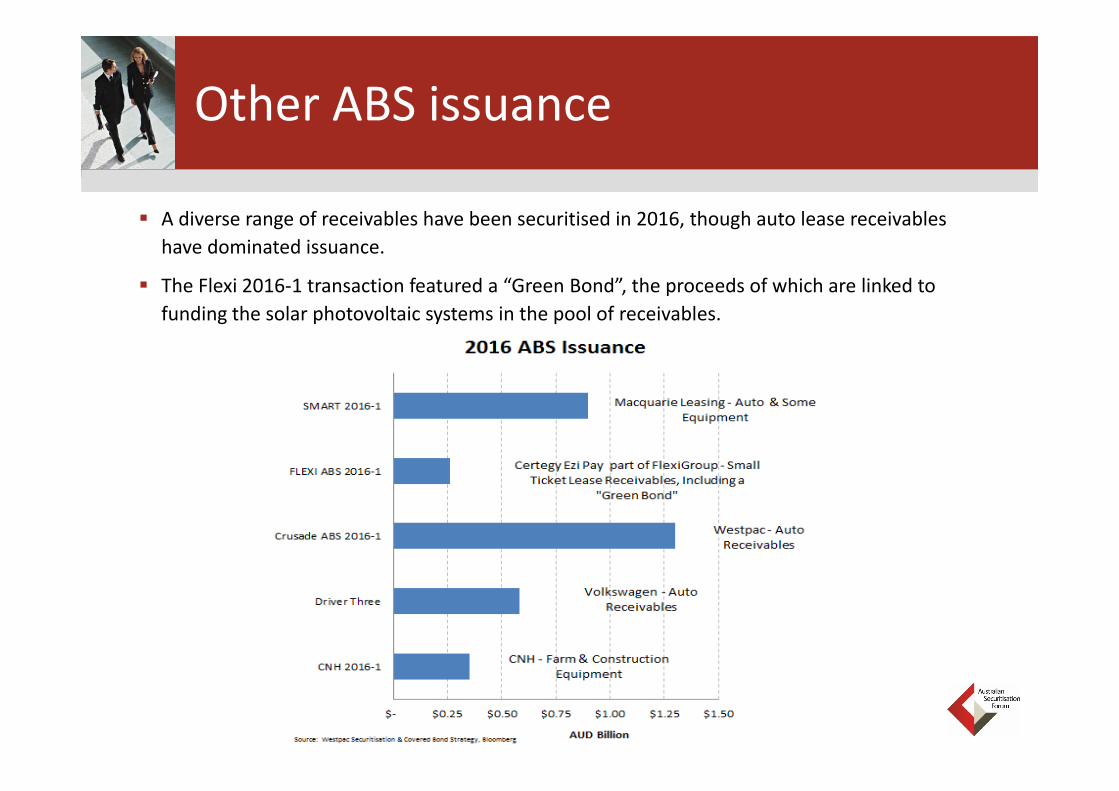
A diverse range of receivables have been securitised in 2016, though auto lease receivables have dominated issuance.
The Flexi 2016‐1 transaction featured a “Green Bond”, the proceeds of which are linked to funding the solar photovoltaic systems in the pool of receivables.
Other ABS issuance

Despite the high volumes of issuance in recent years, only ~AUD11.7bn is currently outstanding. The bulk of this is concentrated amongst a few issuers.
The short term nature of the underlying securities ensures that the stock outstanding diminishes quickly in periods of low issuance.
Other ABS – stock outstanding
Other ABS Balance Outstanding

Pricing relative value
Spreads on domestic RMBS have traditionally been tighter than other ABS asset classes despite the longer tenor of the notes. Crusade 2012‐1 ABS that was placed in Dec‐12 broke this nexus, trading inside RMBS.
Since this time high quality ABS from large issuers have priced at or inside major bank RMBS benchmarks.
Question time
Questions from the audience

Closing remarks
Chris DaltonChief Executive Officer
Australian Securitisation Forum
www.securitisation.com.au
Thank you for attending Australian Securitisation Seminar – London
Australia Macroeconomic Outlook
Economy doing well in the face of challenges
Gavin Friend, Senior Market StrategistJune 2016

2
Australia – No recession in almost a quarter of a century
-1-0.5
00.5
11.5
22.5
33.5
91 93 95 97 99 01 03 05 07 09 11 13 15
Real GDP growth
GDP (quarterly)
Source: ABS
Per c
ent
• Only three negative quarters since 1992 - no technical recession.
• Australia has had the capacity to act during the downturns.

3
Australia continues to have low levels of net debt relative to other advanced economies
-300
-250
-200
-150
-100
-50
0
50
100
150
200
Greece
UK US
AustraliaGermany
Net Government Debt in Advanced EconomiesPer cent of GDP; 2015%
Source: IMF World Economic Outlook Database, April 2016
Norway
New Zealand

4
The Australian economy has continued to perform well versus its peers

5
Non-mining economy has been growing above trend
-20
-10
0
10
20
30
40
50
60
70
80
-14-12-10-8-6-4-202468
10
1990 1995 2000 2005 2010 2015
Real GDP Growth - year-ended %
Mining
Non-mining
Per c
ent
Per cent
Long-run average
• Australia is transitioning through the aftermath of the mining boom.
• RBA estimates the investment downturn peak is now.
• Q1 GDP +1.1% q/q; +3.1% y/y, with no growth from mining sector.
• In its latest Statement the RBA noted; “other areas of domestic demand, as well as exports, have been expanding at a pace at or above-trend.” It’s been a long-time since the RBA has said this.

6
NAB business conditions well above long-term average
• NAB’s monthly Business Survey reveals business conditions well above average.
• Conditions (profitability, employment, orders) performing well in big-picture context .

7
The pick-up in the non-mining economy is reflected in NAB’s business survey
• NAB’s Business Survey shows Household Services, Finance, Property & Business near series highs.
• Manufacturing, Transport now recovering, Construction steady, Mining in doldrums but stabilising.
• By State WA (mining) depressed, Qld (part mining) improving, remainder (non-mining) doing well.
8
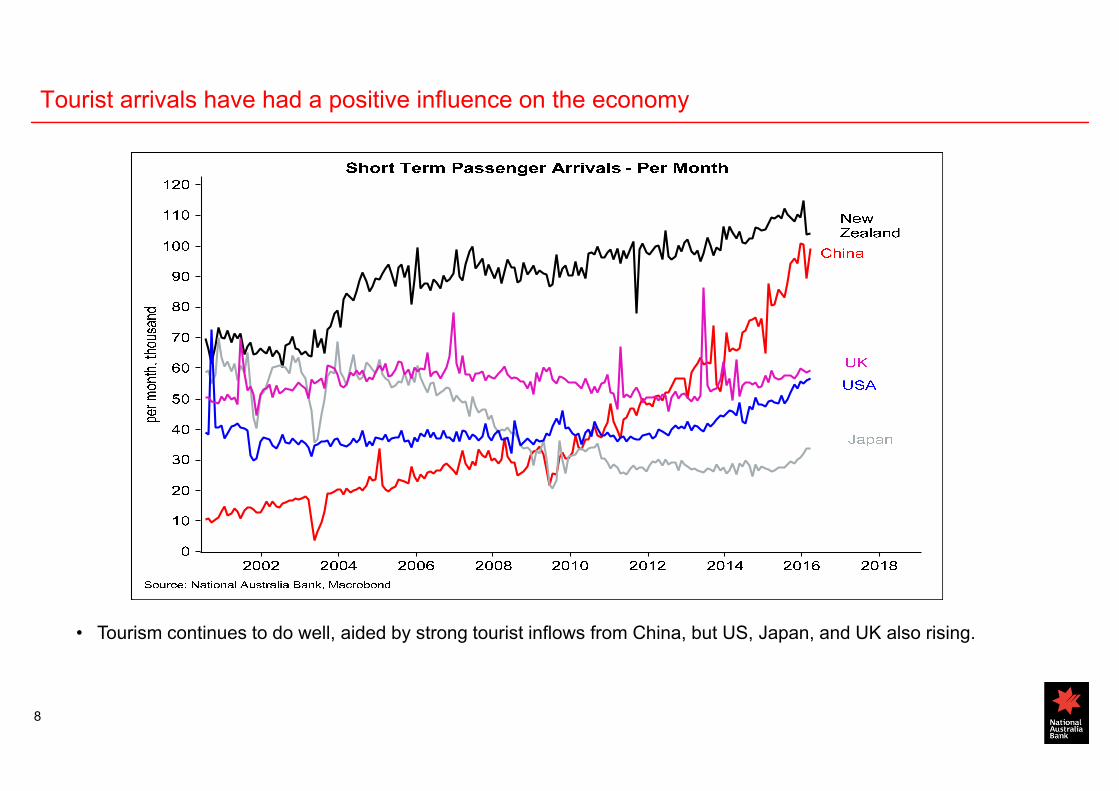
Tourist arrivals have had a positive influence on the economy
• Tourism continues to do well, aided by strong tourist inflows from China, but US, Japan, and UK also rising.
9
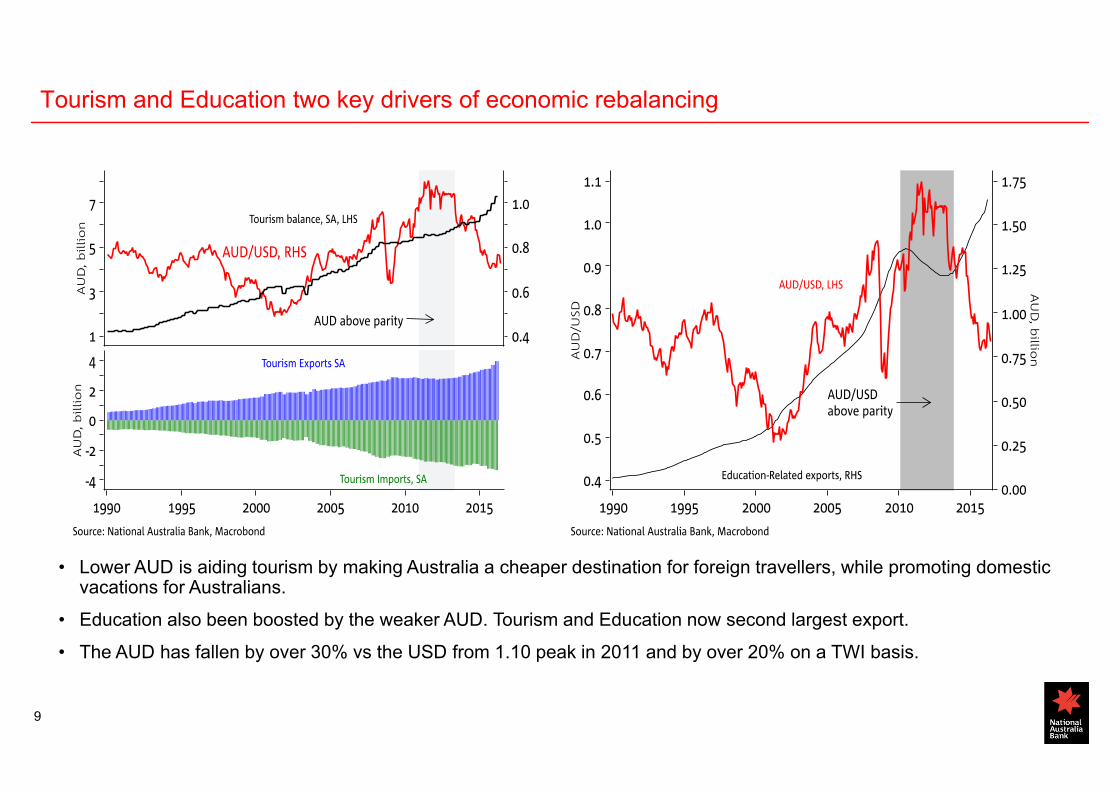
Tourism and Education two key drivers of economic rebalancing
• Lower AUD is aiding tourism by making Australia a cheaper destination for foreign travellers, while promoting domestic vacations for Australians.
• Education also been boosted by the weaker AUD. Tourism and Education now second largest export.
• The AUD has fallen by over 30% vs the USD from 1.10 peak in 2011 and by over 20% on a TWI basis.

10
Good Asia/China influences on Australia - Education 3rd largest export industry
Foreign Student Enrolment Numbers
Rank Year Total 2015 2016Change in Year
1 China 114,180 135,206 21,0262 India 46,020 52,404 6,3843 Vietnam 19,653 20,105 4524 Malaysia 17,594 19,567 1,9735 South Korea 17,129 18,422 1,2936 Thailand 14,350 16,245 1,8957 Nepal 13,249 14,805 1,5568 Brazil 12,472 14,269 1,7979 Indonesia 12,442 13,004 56210 Hong Kong 11,238 12,547 1,30911 Pakistan 10,593 11,513 92012 Taiwan 6,977 8,829 1,85213 Colombia 6,886 8,292 1,40614 Japan 7,054 7,809 75515 Philippines 7,229 7,457 22816 US 6,431 6,956 52517 Singapore 6,960 6,887 ‐7318 Saudi Arabia 7,268 6,137 ‐1,13119 Sri Lanka 4,844 5,692 84820 Italy 4,720 5,569 849
Total 410,596 459,621 49,025
Source: Department of Education and Training
• In 2015 645k full fee-paying students came to Australia, contributing A$ 19bn to the economy
11
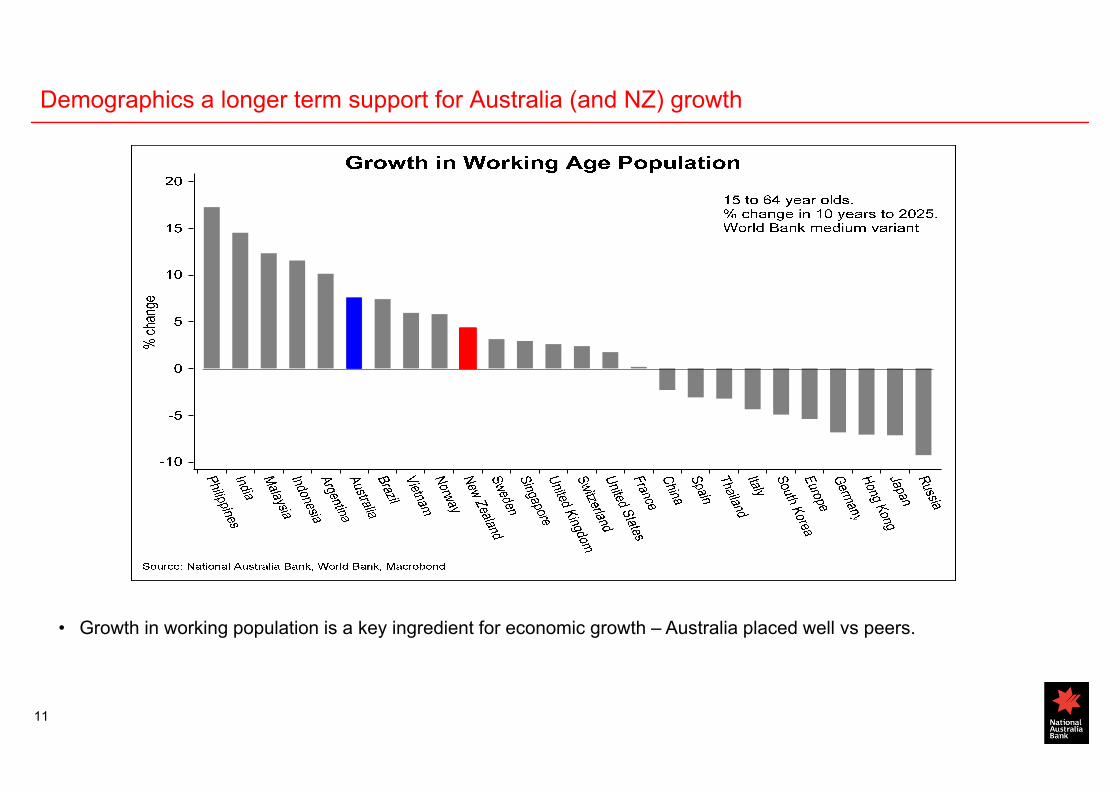
Demographics a longer term support for Australia (and NZ) growth
• Growth in working population is a key ingredient for economic growth – Australia placed well vs peers.

12
The RBA has had to reduce its unemployment rate forecast
• Resilience of non-mining economy is showing up in the labour market.
• To the RBA’s surprise, an upturn in employment has meant new lower unemployment forecasts.
• Australia now creating 18-19k jobs per month – more than the 14-15k needed to keep the unemployment rate steady.
13
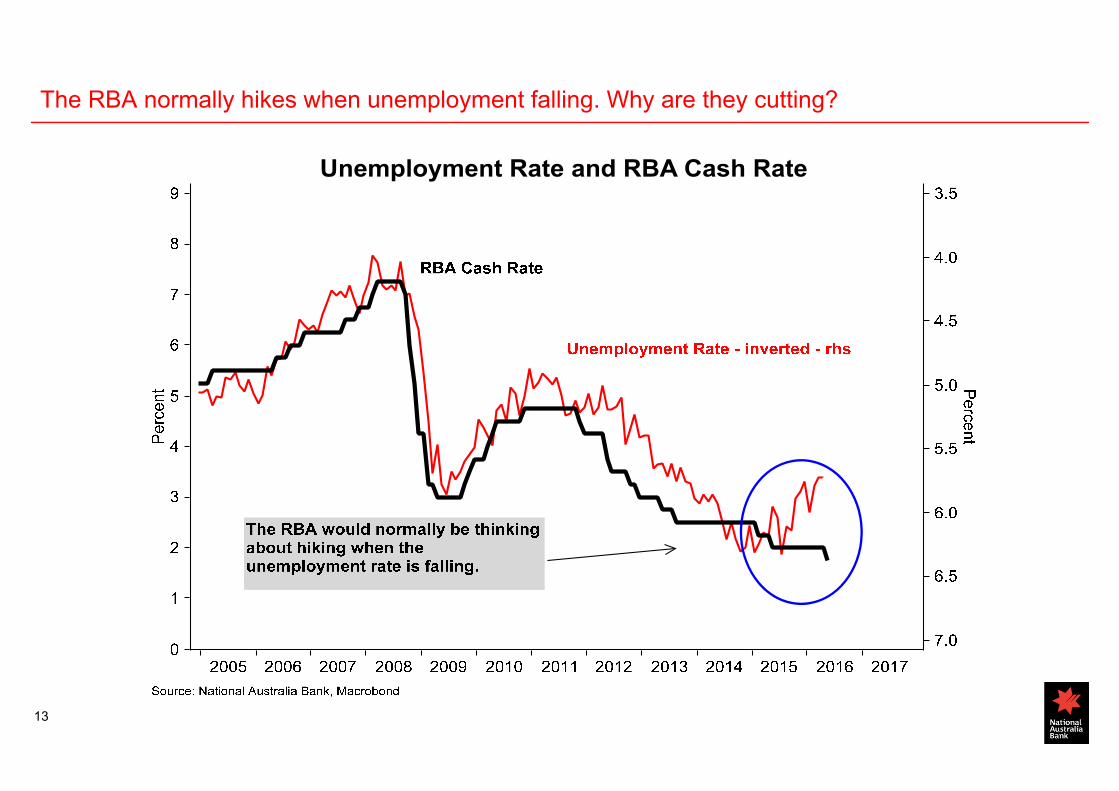
The RBA normally hikes when unemployment falling. Why are they cutting?
14
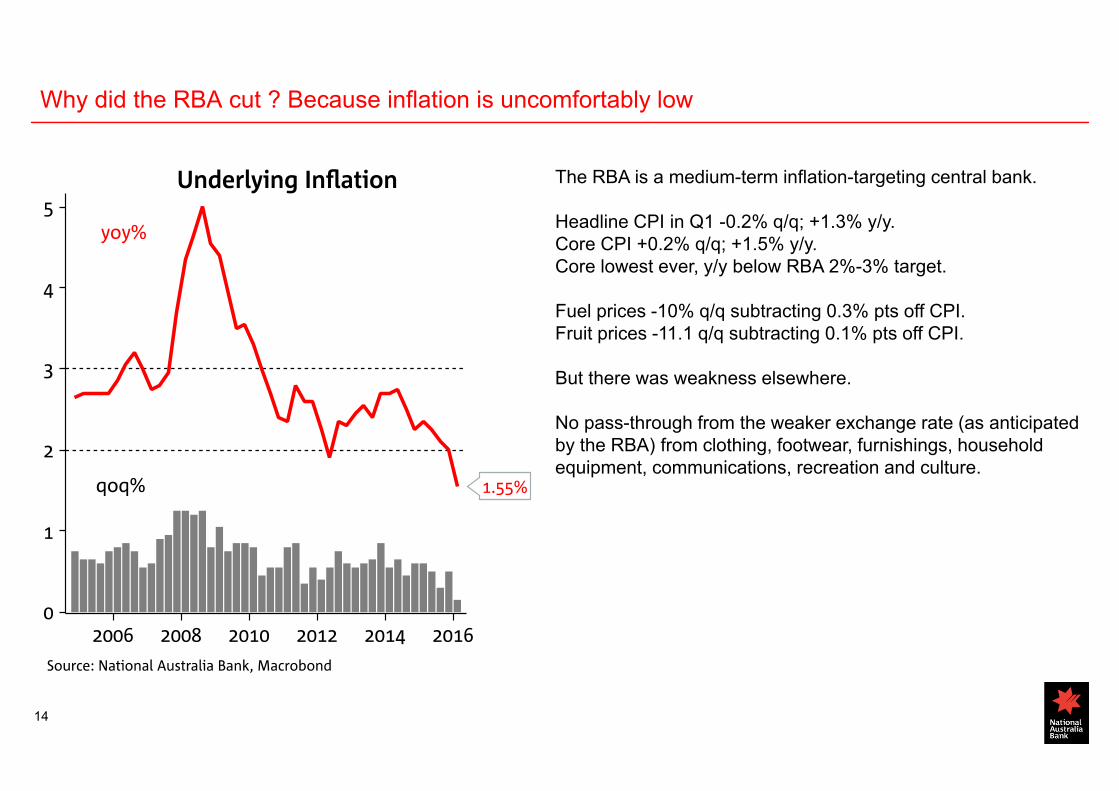
Why did the RBA cut ? Because inflation is uncomfortably low
The RBA is a medium-term inflation-targeting central bank.
Headline CPI in Q1 -0.2% q/q; +1.3% y/y.Core CPI +0.2% q/q; +1.5% y/y.Core lowest ever, y/y below RBA 2%-3% target.
Fuel prices -10% q/q subtracting 0.3% pts off CPI.Fruit prices -11.1 q/q subtracting 0.1% pts off CPI.
But there was weakness elsewhere.
No pass-through from the weaker exchange rate (as anticipated by the RBA) from clothing, footwear, furnishings, household equipment, communications, recreation and culture.

15
Myriad factors pressing down on inflation, prompting big-picture questions
No pass-through from weaker AUD on many tradeable goods.On the non-tradeable side housing inflation was subdued due to:- lower rents- lower new dwelling prices
Housing is 22% of the CPI basket. Extra capacity in housing sector and regulatory measures are impacting.
Downward pressure on inflation from:- Commodity supply increases/higher USD =
commodity price falls (esp. oil)- Substantial increases in housing capacity
restraining rental growth- Little evidence (yet) of pass-through from
lower AUD (likely reflecting global excess capacity/comp from global retail
- Supermarket price wars- Low global inflation – now showing up in
Australia?- Unusually low wages.

16
Weakest wage growth in decades driving low inflation outcomes
• Wage growth continues to decline – necessary to restore competitiveness with rest of world?
• Likely also reflects labour market spare capacity (ie Jobless rate call fall further before inflationary).
• Unit labour costs may be being pushed lower temporarily as exports surge, boosting productivity.
17
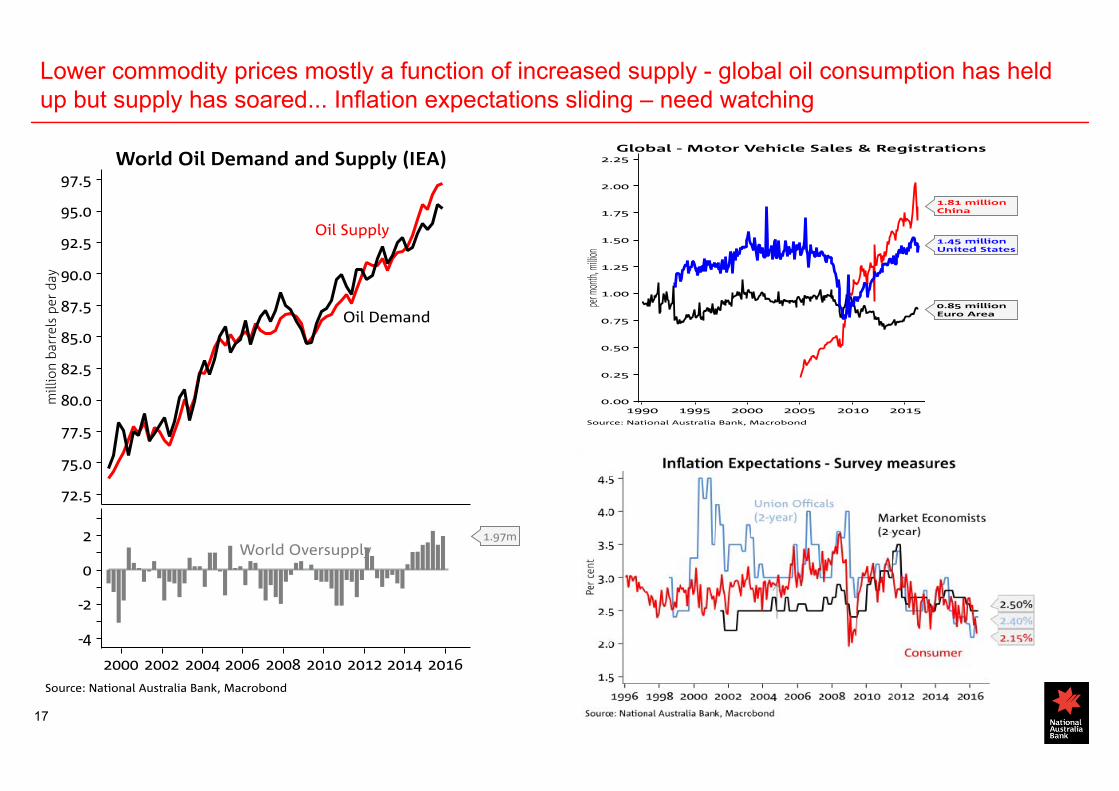
Lower commodity prices mostly a function of increased supply - global oil consumption has held up but supply has soared... Inflation expectations sliding – need watching

18
Having asked itself: ‘are monetary settings appropriate for an inflation return to the 2-3% target in the medium term?’ the May policy outcome suggests the RBA thinks yes.
RBA’s new inflation forecast• The RBA’s Feb 2016 and
May 2016 forecast differ mostly in their starting points. If we extend the trends from their Feb and May forecasts another year, the central tendency looks the same 2½%.
Other considerations:• Factors depressing inflation
are part cyclical or one-off. Others look globally-driven. If not a signal of deficient demand in Australia, is inflation-targeting appropriate?
• RBA revealed no explicit easing bias in June –suggesting current policy mix is consistent with sustainable growth and CPI back to target.

19
GDP Outlook – Good for now but caution on net exports and dwelling investment
• RBA: “Recent data suggest overall growth is continuing, despite a very large decline in business investment….Other areas of domestic demand, as well as exports, have been expanding at a pace at or above trend.”
• Australia LNG capacity rises to 85mta in 2017 (around one third of global output) and set to surpass Qatar as world’s largest LNG exporter by 2020. Four projects come on line in 2016/17. But GDP boost will fade 2018/19.
20
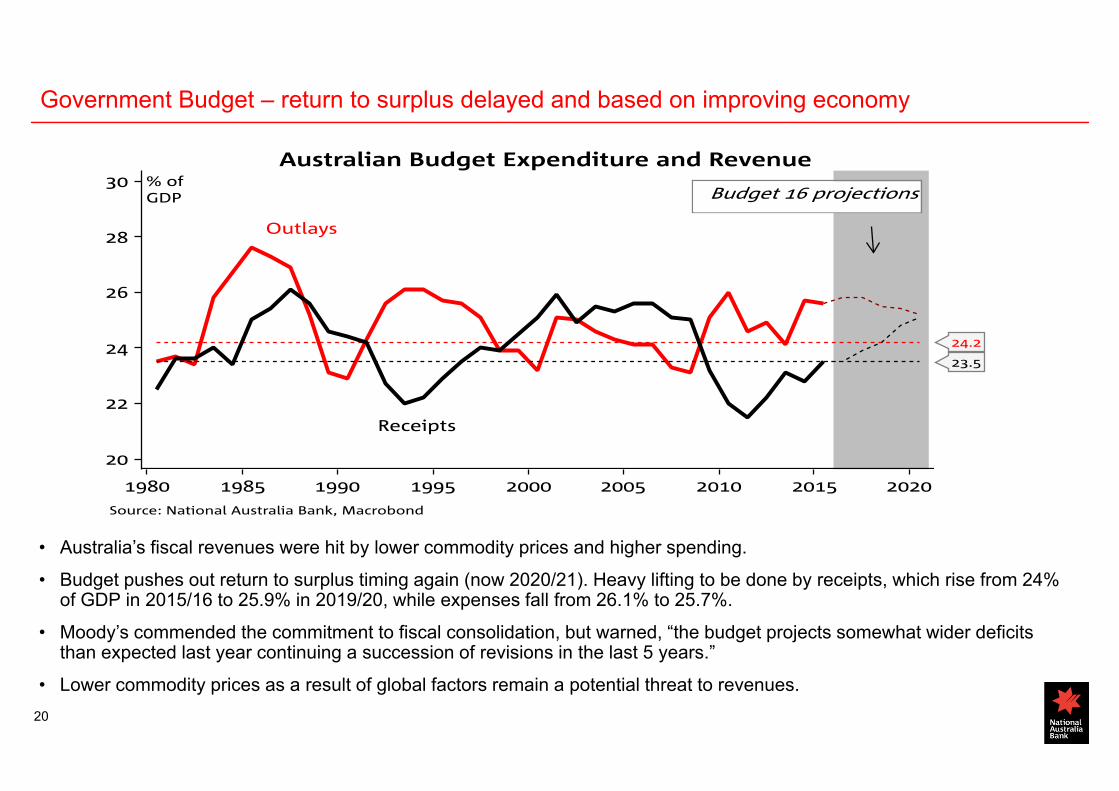
Government Budget – return to surplus delayed and based on improving economy
• Australia’s fiscal revenues were hit by lower commodity prices and higher spending.
• Budget pushes out return to surplus timing again (now 2020/21). Heavy lifting to be done by receipts, which rise from 24% of GDP in 2015/16 to 25.9% in 2019/20, while expenses fall from 26.1% to 25.7%.
• Moody’s commended the commitment to fiscal consolidation, but warned, “the budget projects somewhat wider deficits than expected last year continuing a succession of revisions in the last 5 years.”
• Lower commodity prices as a result of global factors remain a potential threat to revenues.
21
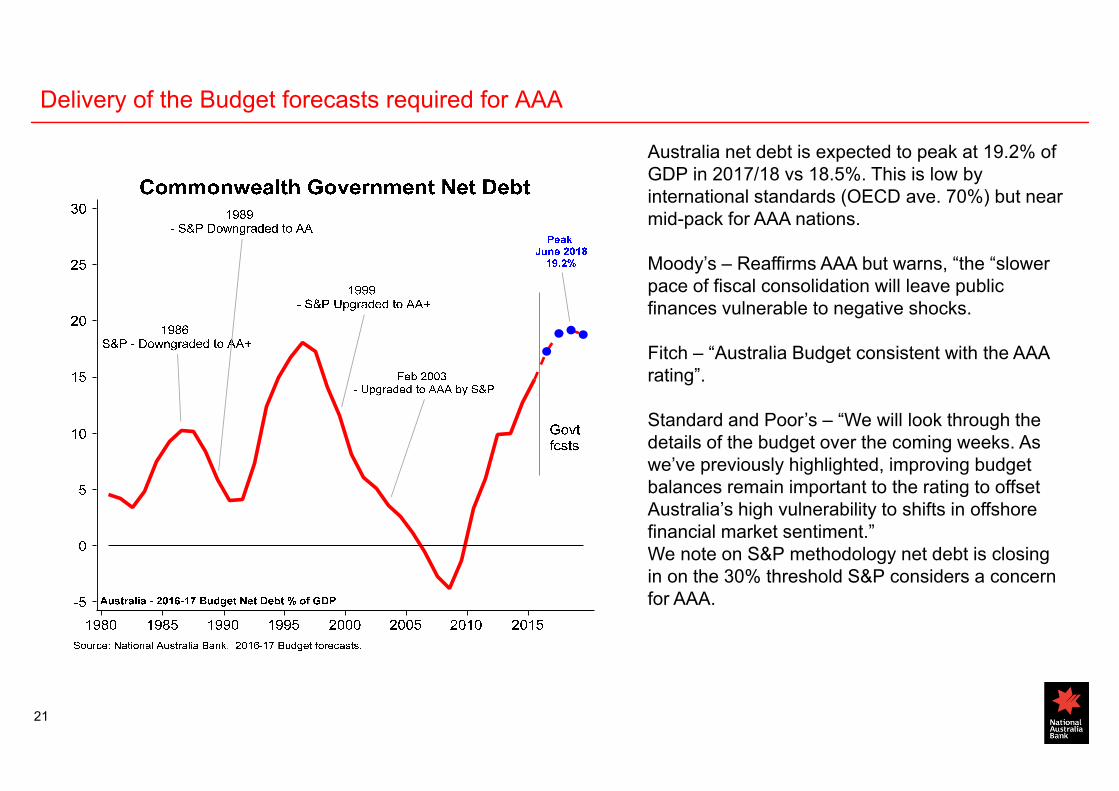
Delivery of the Budget forecasts required for AAA
Australia net debt is expected to peak at 19.2% of GDP in 2017/18 vs 18.5%. This is low by international standards (OECD ave. 70%) but near mid-pack for AAA nations.
Moody’s – Reaffirms AAA but warns, “the “slower pace of fiscal consolidation will leave public finances vulnerable to negative shocks.
Fitch – “Australia Budget consistent with the AAA rating”.
Standard and Poor’s – “We will look through the details of the budget over the coming weeks. As we’ve previously highlighted, improving budget balances remain important to the rating to offset Australia’s high vulnerability to shifts in offshore financial market sentiment.” We note on S&P methodology net debt is closing in on the 30% threshold S&P considers a concern for AAA.

22
Record dwelling approvals have caught up with slowing population growth.House prices rolling over - absent the rate cut blip?
0
200
400
600
800
1000
1200
1995 1997 1999 2001 2003 2005 2007 2009 2011 2013 2015
Index
Core Logic Hedonic Series
Median House Price
Sydney Houses
Melbourne Houses
5 Capital CityAggregate HousesCanberra Houses
Perth Houses
Brisbane Houses
Adelaide Houses
Hobart Houses
• Supply shortage price rise arrested somewhat as population growth slows on mining drop-off and on extra dwelling capacity and pipeline (especially apartments). APRA measures continue to add to moderation.
• May rate cut adds to housing activity, but is that sustainable as RBA signals no explicit easing bias? Employment growth may help, but low wage growth counteracts as does price to earnings ratios.
• RBA signals has faith in foreign buyers’ long-term motivations/less price swing sensitivity.
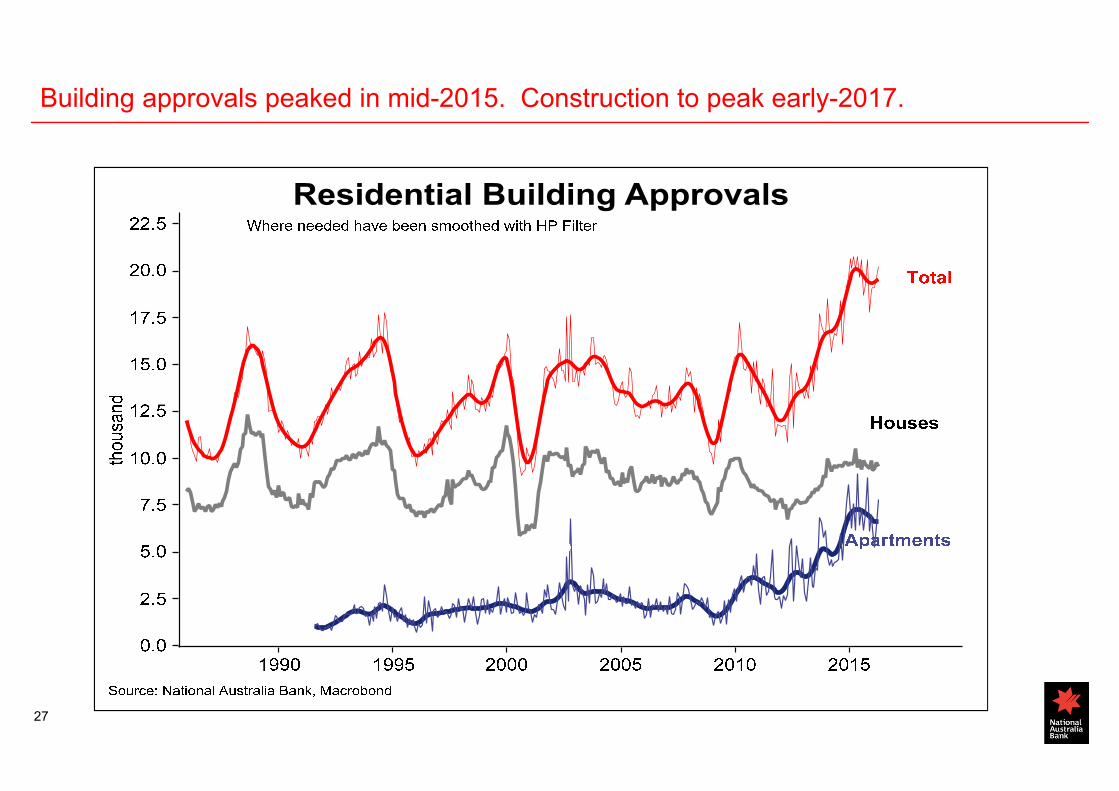
• We note dwelling approvals turning down after rise; less construction down the track?

23
2 July election looms – looking like a close run affair
TWO PARTY PREFERRED POLLING
• Labor needs to wrest 19 seats from the Coalition to win control of lower house.
• Labor requires a 4.1% swing to secure 50.1% of the vote on a two-party preferred basis.
• Current polls running very close to 50:50; PM Turnbull’s popularity has been imploding.
• Haven’t had a one-term (Federal) government since the Depression (though Gillard, Howard and Hawke all came close to not being re-elected).
• Voters (globally) seem much more willing to turn an incumbent government out.
Source: crikey.com.au

24
Economy travelling well amid inflation, housing, ratings risk and election uncertainty
Non-mining economy travelling well and labour market still solid.
NAB surveys shows business conditions above long term average.
RBA policy shift entirely driven by sub-optimal inflation concerns.
Weak wages growth keeps domestic inflation pressures subdued; limited pass-through from AUD drop to tradeable inflation.
Medium term growth question as LNG production and dwelling construction both peak.
Australian housing supply/demand coming into balance.
AAA ratings at low level risk – watching out for S&P.
2 July Australian election outcome highly uncertain.
25
Important NoticesDisclaimer: This document has been prepared by National Australia Bank Limited ABN 12 004 044 937 AFSL 230686 ("NAB"). Any advice contained in this document has been prepared without taking into account your objectives, financial situation or needs. Before acting on any advice in this document, NAB recommends that you consider whether the advice is appropriate for your circumstances. NAB recommends that you obtain and consider the relevant Product Disclosure Statement or other disclosure document, before making any decision about a product including whether to acquire or to continue to hold it. Products are issued by NAB unless otherwise specified.
So far as laws and regulatory requirements permit, NAB, its related companies, associated entities and any officer, employee, agent, adviser or contractor thereof (the "NAB Group") does not warrant or represent that the information, recommendations, opinions or conclusions contained in this document ("Information") is accurate, reliable, complete or current. The Information is indicative and prepared for information purposes only and does not purport to contain all matters relevant to any particular investment or financial instrument. The Information is not intended to be relied upon and in all cases anyone proposing to use the Information should independently verify and check its accuracy, completeness, reliability and suitability obtain appropriate professional advice. The Information is not intended to create any legal or fiduciary relationship and nothing contained in this document will be considered an invitation to engage in business, a recommendation, guidance, invitation, inducement, proposal, advice or solicitation to provide investment, financial or banking services or an invitation to engage in business or invest, buy, sell or deal in any securities or other financial instruments.
The Information is subject to change without notice, but the NAB Group shall not be under any duty to update or correct it. All statements as to future matters are not guaranteed to be accurate and any statements as to past performance do not represent future performance.
The NAB Group takes various positions and/or roles in relation to financial products and services, and (subject to NAB policies) may hold a position or act as a price-maker in the financial instruments of any company or issuer discussed within this document, or act and receive fees as an underwriter, placement agent, adviser, broker or lender to such company or issuer. The NAB Group may transact, for its own account or for the account of any client(s), the securities of or other financial instruments relating to any company or issuer described in the Information, including in a manner that is inconsistent with or contrary to the Information.
Subject to any terms implied by law and which cannot be excluded, the NAB Group shall not be liable for any errors, omissions, defects or misrepresentations in the Information (including by reasons of negligence, negligent misstatement or otherwise) or for any loss or damage (whether direct or indirect) suffered by persons who use or rely on the Information. If any law prohibits the exclusion of such liability, the NAB Group limits its liability to the re-supply of the Information, provided that such limitation is permitted by law and is fair and reasonable.
This document is intended for clients of the NAB Group only and may not be reproduced or distributed without the consent of NAB. The Information is governed by, and is to be construed in accordance with, the laws in force in the State of Victoria, Australia.
Analyst Disclaimer: The Information accurately reflects the personal views of the author(s) about the securities, issuers and other subject matters discussed, and is based upon sources reasonably believed to be reliable and accurate. The views of the author(s) do not necessarily reflect the views of the NAB Group. No part of the compensation of the author(s) was, is, or will be, directly or indirectly, related to any specific recommendations or views expressed. Research analysts responsible for this report receive compensation based upon, among other factors, the overall profitability of the Global Markets Division of NAB.
For distribution by WealthHub Securities: Where you have received this document via the nabtrade service (nabtrade), it is distributed to you by WealthHub Securities Limited ABN 83 089 718 249 AFSL No. 230704 (“WealthHub Securities”). WealthHub Securities is a Participant of the Australia Securities Exchange and a wholly owned subsidiary of National Australia Bank Limited ABN 12 004 044 937 AFSL No. 230686 (“NAB”). NAB doesn’t guarantee the obligations or performance its subsidiaries, or the products or services its subsidiaries offer. Any material provided to you by WealthHub Securities will contain factual information or general advice. This factual information or general advice does not take into account your particular objectives, financial situation and needs, and a statement of advice will not be provided. WealthHub Securities will not give you any legal, tax, financial or accounting advice or any advice or recommendation regarding the suitability or profitability about your transactions. Before you make a decision about whether to acquire a financial product, you should obtain and read the Product Disclosure Statement available at nabtrade.com.au and consider the appropriateness of the information having regard to your particular circumstances. You agree that you will not solely rely on the information provided by WealthHub Securities or elsewhere on nabtrade.com.au when making investment and/or financial decisions. WealthHub Securities does not provide personal advice to online retail clients. WealthHub Securities receives commission from dealing in securities and from its authorised representatives. Introducers of business may directly share in this commission. WealthHub Securities and its associates may hold shares in the companies that it distributes research/information on.
The value of investments and future returns may rise or fall and, at times, returns may be negative. Past performance is not a guarantee of future performance. Please note, this material has not been verified by WealthHub Securities. WealthHub Securities does not make any representation or warranty as to the timeliness, reliability, accuracy or completeness of the material, nor does it accept any responsibility arising in any way for errors in, or omissions from, that material.
26
Important NoticesUnited Kingdom: If this document is distributed in the United Kingdom, such distribution is by National Australia Bank Limited, 88 Wood Street, London EC2V 7QQ. Registered in England BR1924. Head Office: 800 Bourke Street, Docklands, Victoria, 3008. Incorporated with limited liability in the State of Victoria, Australia. Authorised and regulated by the Australian Prudential Regulation Authority. Authorised in the UK by the Prudential Regulation Authority. Subject to regulation by the Financial Conduct Authority and limited regulation by the Prudential Regulation Authority. Details about the extent of our regulation by the Prudential Regulation Authority are available from us on request.
USA: If this document is distributed in the United States, such distribution is by nabSecurities, LLC. This document is not intended as an offer or solicitation for the purchase or sale of any securities, financial instrument or product or to provide financial services. It is not the intention of nabSecurities to create legal relations on the basis of information provided herein.
New Zealand: This publication has been provided for general information only. Although every effort has been made to ensure this publication is accurate the contents should not be relied upon or used as a basis for entering into any products described in this publication. To the extent that any information or recommendations in this publication constitute financial advice, they do not take into account any person’s particular financial situation or goals. Bank of New Zealand strongly recommends readers seek independent legal/financial advice prior to acting in relation to any of the matters discussed in this publication. Neither Bank of New Zealand nor any person involved in this publication accepts any liability for any loss or damage whatsoever may directly or indirectly result from any advice, opinion, information, representation or omission, whether negligent or otherwise, contained in this publication. National Australia Bank Limited is not a registered bank in New Zealand.
Hong Kong: If this document is distributed in Hong Kong, such distribution is by National Australia Bank Limited, Hong Kong Branch, which is licensed by the Hong Kong Monetary Authority and registered (CE Number AAO169) under the Securities and Futures Ordinance (Cap. 571 of the Laws of Hong Kong) for Type 1 (dealing in securities) regulated activities. Its main business address is Level 27, One Pacific Place, 88 Queensway, Hong Kong. The contents of the Materials have not been reviewed by any regulatory authority in Hong Kong. If you are in any doubt about any of the contents of the Materials, you should obtain independent professional advice.
Singapore: If this document is distributed in Singapore, it is made available to you in Singapore by NAB, Singapore branch, through general information circulation only and does not take into account of your specific investment objectives, financial situation or particular needs. If you choose not to seek advice from a financial adviser, you should consider whether the product in question is suitable. Recipients of this material in Singapore should contact NAB, Singapore branch at 12 Marina View, #20-02 Asia Square Tower 2, Singapore 018961, Tel (65) 6419 6875 for any matter arising from, or in connection with, this material. The contents of the Materials have not been reviewed by any regulatory authority in Singapore. If you are in any doubt about any of the contents of the Materials, you should obtain independent advice.
Japan: If this document is distributed in Japan, National Australia Bank Limited has an office in Japan but is not licensed to conduct securities-related business in Japan. Therefore, to the extent that it relates to securities this document is only for information purposes only in Japan. This is not an offer to buy or sell securities, directly or indirectly, in Japan or to, or for the benefit of, any resident of Japan (except pursuant to an exemption from the registration requirements of, and otherwise in compliance with the Financial Instruments and Exchange Act (Japan) and any other applicable laws, regulations and ministerial guidelines of Japan.
China: If this document is distributed in the PRC, such distribution is by National Australia Bank Limited, Shanghai Branch. National Australia Bank Limited, Shanghai Branch is a financial institution registered in the PRC, and mainly regulated by China Banking Regulatory Commission, People’s Bank of China, and State Administration of foreign Exchange.
27
Building approvals peaked in mid-2015. Construction to peak early-2017.

28
Foreign investor demand waning
0
2
4
6
8
10
12
14
16
18
Q2'
10
Q3'
10
Q4'
10
Q1'
11
Q2'
11
Q3'
11
Q4'
11
Q1'
12
Q2'
12
Q3'
12
Q4'
12
Q1'
13
Q2'
13
Q3'
13
Q4'
13
Q1'
14
Q2'
14
Q3'
14
Q4'
14
Q1'
15
Q2'
15
Q3'
15
Q4'
15
Q1'
16
Share of Demand for New & Existing Properties from Overseas Buyers
New Properties Established Properties
%
Source: NAB residential property Survey, Q1 2016

29
There remains considerable uncertainty about how fast the Chinese economy is growing. Like Australia (and the US), there is considerable variability by sector…
29
Tertiary includes: Transport, Wholesale & Retail, Accommodation, Financial, Real Estate, Services (Govt, Health, Education, Other Services)Secondary includes: Mining, Manufacturing, Electricity, Gas & Water, Construction

30
China – consumer-related activities holding up and housing has recovered.
Page 30
Consumer in good shape Housing has recovered
-6
-3
0
3
6
9
12
-40
-20
0
20
40
60
80
100
2006 2008 2010 2012 2014 2016
% yoy (3mma)
Existing home prices (based on former 70 city
series) (RHS)
Residential construction starts (LHS)
Source: CEIC, Datastream, NAB Economics
% yoy
31
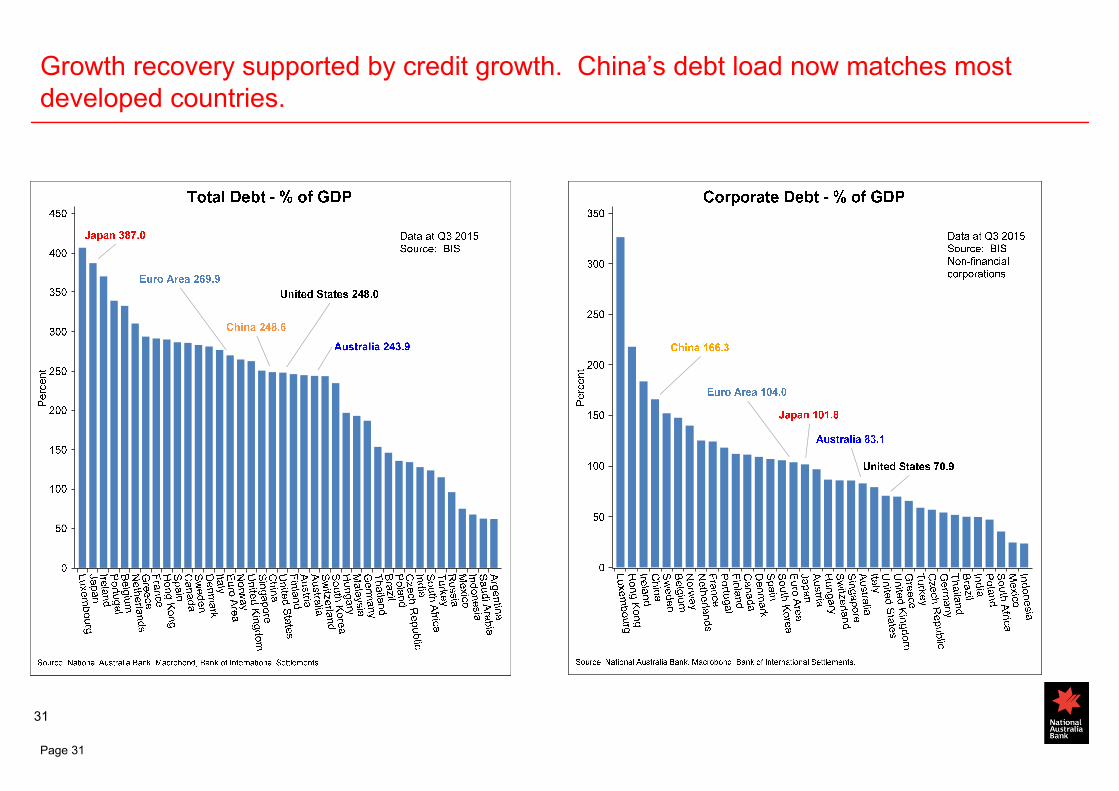
Growth recovery supported by credit growth. China’s debt load now matches most developed countries.
Page 31

32
RBA cash rate and mortgage rates

33
Dwelling and population increase