australian on-premise wine: what influences wine buying decisions? · australian on-premise wine:...
TRANSCRIPT
88 Grapegrower & Winemaker www.winebiz.com.au September 2013 – Issue 596
sales & marketing
Australian on-premise wine: what influences wine buying decisions?This paper is one in a series from research funded by the GWRDC to examine the decision influencers along the wine supply chain. Previous papers have discussed the Chinese and US markets. They are available through the University of Adelaide Wine 2030 Research Network – www.adelaide.edu.au/wine2030. For details contact [email protected].
Dr Steve Goodman and Dr Cullen Habel
ON-PREMISE IS SEEN by so many as the path to building their wine brand (or even just selling some wine).
The lack of retail oligopoly means there are so many more decision makers and so much more chance to sell wine than in a retail market dominated by big retailers, big buying groups and big distributors with access to the lucrative sales volumes.
Understanding the On-premise market then becomes of paramount importance.
Too often, the wine trade market is divided in two – On and Off Premise.
This research has looked at trying to understand both markets more and this paper presents some of the results from the Australian On-Premise data.
The research approach has been covered in detail in previous papers, (Goodman 2012 – Australian Data; Goodman and Altschwager 2012 China Data; Goodman and Habel 2013-US Distributors. Contact author for details) so a brief outline here only.
An experimental design was used to ask those involved in the US On-Premise trade the question, ‘what influences your decision when buying in a new wine’.
The method used is called Best: Worse, where people are asked, across a series of tables, to nominate which ‘1’ of the available choices ‘Most’ influences their decision, and which’1’ least’.
There are a number of strengths to this – notably, the fact it is not a rating, it is a ‘best’ and ‘worst’, as such it is comparable across cultures, ages, genders.
Most is most and least is least, whereas scoring on a 1-7... some people’s 5 is someone else’s 7 (See Goodman 2009 and Cohen 2009 for a full description of the method).
It gives you clear insights into the strength of the influencers, twice as much or three times as much, rather than a difference between 4.2 and 4.7 – something which carries very little practical implication.
It means generating simple bar graphs generates outputs where differences (and possible opportunities) can be quickly identified.
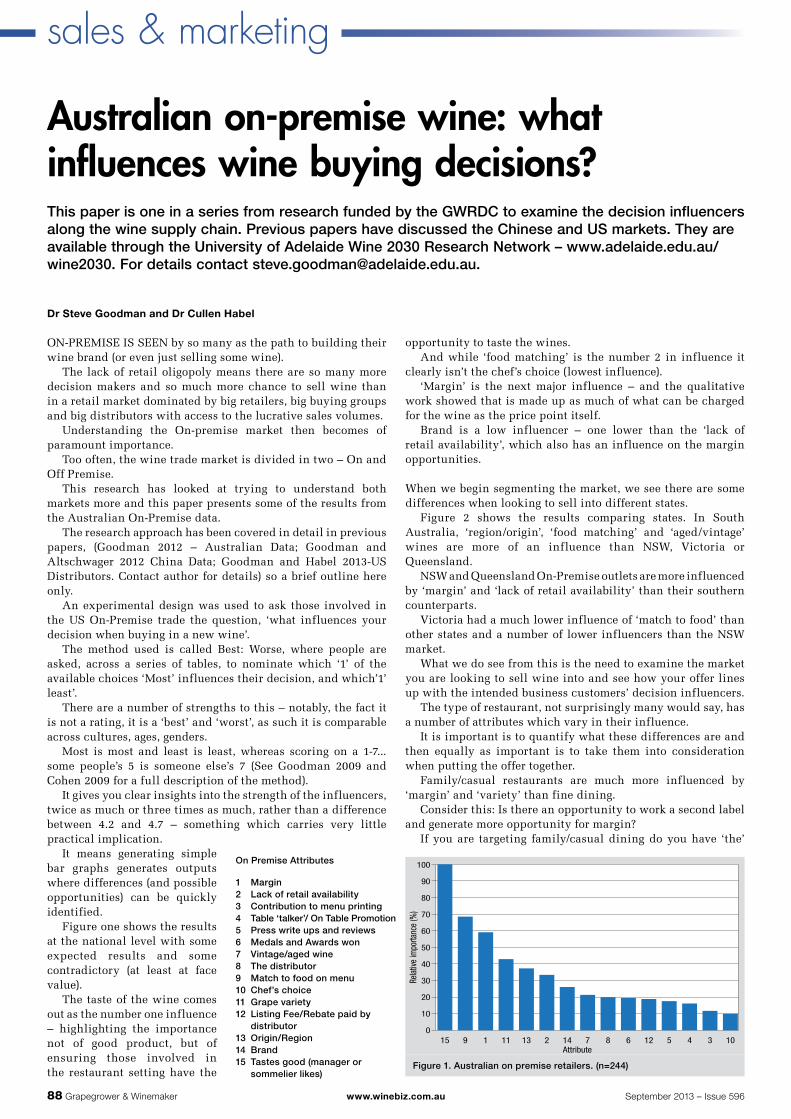
Figure one shows the results at the national level with some expected results and some contradictory (at least at face value).
The taste of the wine comes out as the number one influence – highlighting the importance not of good product, but of ensuring those involved in the restaurant setting have the
opportunity to taste the wines. And while ‘food matching’ is the number 2 in influence it
clearly isn’t the chef’s choice (lowest influence). ‘Margin’ is the next major influence – and the qualitative
work showed that is made up as much of what can be charged for the wine as the price point itself.
Brand is a low influencer – one lower than the ‘lack of retail availability’, which also has an influence on the margin opportunities.
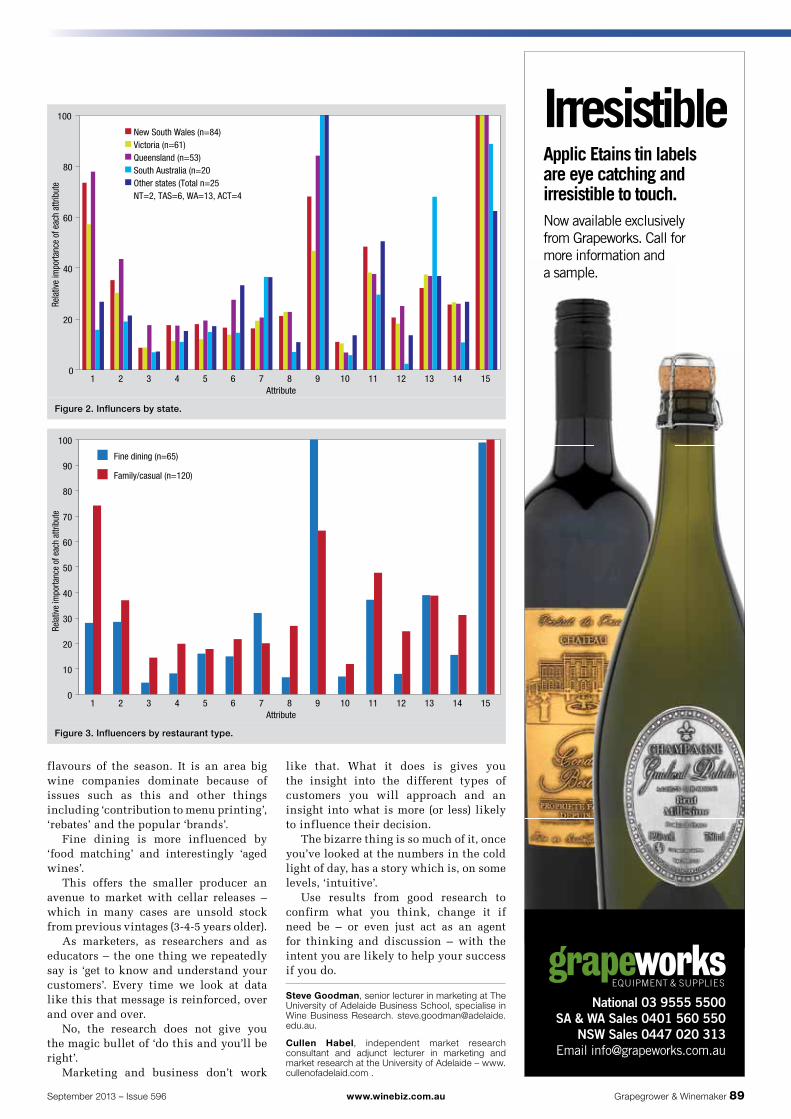
When we begin segmenting the market, we see there are some differences when looking to sell into different states.
Figure 2 shows the results comparing states. In South Australia, ‘region/origin’, ‘food matching’ and ‘aged/vintage’ wines are more of an influence than NSW, Victoria or Queensland.
NSW and Queensland On-Premise outlets are more influenced by ‘margin’ and ‘lack of retail availability’ than their southern counterparts.
Victoria had a much lower influence of ‘match to food’ than other states and a number of lower influencers than the NSW market.
What we do see from this is the need to examine the market you are looking to sell wine into and see how your offer lines up with the intended business customers’ decision influencers.
The type of restaurant, not surprisingly many would say, has a number of attributes which vary in their influence.
It is important is to quantify what these differences are and then equally as important is to take them into consideration when putting the offer together.
Family/casual restaurants are much more influenced by ‘margin’ and ‘variety’ than fine dining.
Consider this: Is there an opportunity to work a second label and generate more opportunity for margin?
If you are targeting family/casual dining do you have ‘the’
15
100
90
80
70
60
50
40
30
20
10
09
Relat
ive im
porta
nce
(%)
Attribute1 11 13 2 14 7 8 6 12 5 4 3 10
On Premise Attributes
1 Margin2 Lack of retail availability3 Contribution to menu printing4 Table ‘talker’/ On Table Promotion5 Press write ups and reviews6 Medals and Awards won7 Vintage/aged wine8 The distributor 9 Match to food on menu10 Chef’s choice11 Grape variety12 Listing Fee/Rebate paid by
distributor13 Origin/Region14 Brand15 Tastes good (manager or
sommelier likes)Figure 1. Australian on premise retailers. (n=244)
September 2013 – Issue 596 www.winebiz.com.au Grapegrower & Winemaker 89
flavours of the season. It is an area big wine companies dominate because of issues such as this and other things including ‘contribution to menu printing’, ‘rebates’ and the popular ‘brands’.
Fine dining is more influenced by ‘food matching’ and interestingly ‘aged wines’.
This offers the smaller producer an avenue to market with cellar releases – which in many cases are unsold stock from previous vintages (3-4-5 years older).
As marketers, as researchers and as educators – the one thing we repeatedly say is ‘get to know and understand your customers’. Every time we look at data like this that message is reinforced, over and over and over.
No, the research does not give you the magic bullet of ‘do this and you’ll be right’.
Marketing and business don’t work
like that. What it does is gives you the insight into the different types of customers you will approach and an insight into what is more (or less) likely to influence their decision.
The bizarre thing is so much of it, once you’ve looked at the numbers in the cold light of day, has a story which is, on some levels, ‘intuitive’.
Use results from good research to confirm what you think, change it if need be – or even just act as an agent for thinking and discussion – with the intent you are likely to help your success if you do.
Steve Goodman, senior lecturer in marketing at The University of Adelaide Business School, specialise in Wine Business Research. [email protected].
Cullen Habel, independent market research consultant and adjunct lecturer in marketing and market research at the University of Adelaide – www.cullenofadelaid.com .
National 03 9555 5500SA & WA Sales 0401 560 550
NSW Sales 0447 020 313Email [email protected]
IrresistibleApplic Etains tin labels are eye catching and irresistible to touch. Now available exclusively from Grapeworks. Call for more information and a sample.
0
20
40
60
80
100
1 2 3 4 5 6 7 8 9 10 11 12 13 14 15
Rela
tive
impo
rtanc
e of
eac
h at
tribu
te
New South Wales (n=84)
Attribute
Victoria (n=61)Queensland (n=53)South Australia (n=20Other states (Total n=25NT=2, TAS=6, WA=13, ACT=4
1 2 3 4 5 6 7 8 9 10 11 12 13 14 15
Rela
tive
impo
rtanc
e of
eac
h at
tribu
te
Attribute
0
10
20
30
40
50
60
70
80
90
100
Fine dining (n=65)
Family/casual (n=120)
Figure 2. Influncers by state.
Figure 3. Influencers by restaurant type.