august 2015 downtown denver economic update
DESCRIPTION
The most recent economic indicators available for Downtown Denver.TRANSCRIPT

DOWNTOWN DENVER ECONOMIC UPDATEAUGUST 2015
This report contains the most recent economic indicators available for Downtown Denver and the Business Improvement District. According to the most recent indicators, Downtown Denver economic conditions continue to improve. Employment growth is strong, consumers are spending at a healthy pace, and the downtown commercial real estate markets reported rising average lease rates and declining vacancy.
Summary
EMPLOYMENT RETAIL SALES RESIDENTIAL REAL ESTATE OFFICE MARKET HOTEL MARKET
DOWNTOWN DENVER BID
Industry Share 4Q13 4Q14 Change 4Q13 4Q14 Change
Professional & Business Services 31% 36,284 38,299 5.6% 32,301 33,442 3.5%
Government 19% 23,367 23,043 -1.4% 21,157 20,816 -1.6%
Leisure & Hospitality 16% 18,006 19,125 6.2% 12,964 13,246 2.2%
Financial Activities 12% 14,596 15,085 3.4% 11,334 11,470 1.2%
Natural Resources & Construction 9% 9,826 11,329 15.3% 9,261 10,543 13.8%
Information 4% 4,260 4,319 1.4% 3,519 3,529 0.3%
Wholesale & Retail Trade 3% 4,046 4,032 -0.3% 3,029 2,995 -1.1%
Education & Health Services 2% 2,681 2,906 8.4% 1,547 1,659 7.2%
Other Services 2% 2,839 2,810 -1.0% 2,328 2,397 3.0%
Transp., Warehousing & Utilities 1% 1,461 1,491 2.1% 1,380 1,392 0.8%
Manufacturing 1% 848 926 9.2% 116 130 12.4%
Total 118,215 123,365 4.4% 98,937 101,619 2.7%
Employment levels continued to rise in both Downtown Denver and the Business Improvement District (BID) between the fourth quarters of 2013 and 2014, with employment levels rising 4.4% and 2.7%, respectively. The natural resources and construction supersector continued to report the strongest growth, generating an additional 1,500 jobs over-the-year in Downtown Denver. Employment in Downtown Denver’s largest supersector, prof. and business services, is up almost 6% over-the-year.
107,000
109,000
111,000
113,000
115,000
117,000
119,000
121,000
4Q142Q144Q132Q134Q122Q124Q112Q114Q10
123,000
EMPLOYMENT
DOWNTOWN DENVER
HISTORICAL EMPLOYMENT
+4.4%
4Q 2014 Employment Trends
+4.0%
+3.7%
Downtown Denver
+2.1%
Metro Denver
Colorado
United States
Sources: Colorado Department of Labor and Employment, Quarterly Census of Employment and Wages; Colorado Department of Labor and Employment, Labor Market Information, Current Employment Statistics; U.S. Bureau of Labor Statistics; Development Research Partners; Downtown Denver Partnership.
.
Residential development in Downtown and its City Center neighbor-hoods continues at a brisk pace with 1,836 residential units created so far in 2015. Recently completed projects include 2785 Speer, Lumina, Platform at Union Station and Studio LoHi. Skyhouse Denver, one of the tallest planned rental towers in Downtown’s history, is under construction and will add 354 new rental units to the Central Business District when the 26-story project is completed in 2016. Another new 34-story rental tower, The Confluence, is also under construction in the Central Platte Valley neighborhood and will add 288 new units when it is completed in 2017. On the for-sale front, there are 132 townhomes currently planned or under construction throughout the Downtown neighborhoods.
For more information about development in Downtown Denver, refer to the Quarterly Development Map Updates at www.downtowndenver.com/resources-downloads.
RESIDENTIAL DEVELOPMENT
City CenterNeighborhood
For-Sale Units
Rental Units
Number of Projects
Auraria - - -
Ballpark 28 169 2
Capitol Hill - 347 3
Central Business District - 729 2
CPV/Denver Union Station - 1,780 6
Curtis Park/Five Points 67 435 5
Golden Triangle - 938 4
Highland 10 572 3
Jefferson Park 27 179 2
La Alma/Lincoln Park - 397 2
Lower Downtown - - -
Uptown - 471 2
Total 132 6,017 31
News & Rankings
• Silicon Valley startup ZenPayroll announced that Downtown Denver will be the location of its second U.S. office. The company plans to hire 100 employees this year and as many as 1,000 employees in the future.
• Forbes determined that the Denver Metro area is Ameriaca’s best place for business and careers in the publication’s annual ranking.
• The Denver Metro area was ranked number one in the country for economic and gob growth by Area Development magazine.
• In June, Hines broke ground on 1144 Fifteenth, a 40-story office tower on 15th and Arapahoe.
• Denver ranked fifth in the nation for startup activity in the 2015 Kauffman Index.
• WeWork, an international coworking company, leased three floors in the Triangle Building at 16th and Wewatta, adding 70,000 square feet of coworking space to Downtown Denver.
• The U.S. Census Bureau released 2014 population estimates in June. The latest population estimate for the City and County of Denver is 663,862, an increase of over 15,000 from the 2013 population estimate.
• Nerdwallet ranked Denver the sixth best U.S. city for foodies in 2015.
• For the third month this year, metro Denver ranked number one in year-over-year home-price gains, accoding to the latest S&P/Case-Shiller Home Prices Index report of major U.S. cities.
• Walkscore ranked Denver as the fourth most bikeable city in the U.S.
About This Report
This report includes the most recent quarterly data available and covers economic conditions in three areas. The
first and smallest area, the Business Improvement District (BID), is the core of Downtown Denver, The second area,
“Downtown,” includes the BID as well as a few surrounding districts such as the Golden Triangle. The third area, City Center
Neighborhoods, includes the BID, Downtown, and surrounding residential neighborhoods such as Uptown and Highland.
Data in this report was provided by Development Research Partners. For questions or comments, please contact the
Downtown Denver Partnership Research Department at 303-534-6161.
Sources: Downtown Denver Partnership, Metro Denver Economic Development Corporation, Denver Business Journal, Denver Post.
DOWNTOWN DENVER ECONOMIC UPDATE AUGUST 2015
RESIDENTIAL DEVELOPMENTS PLANNED OR UNDERWAY AS OF AUGUST 2015
DOWNTOWN DENVER ECONOMIC UPDATE AUGUST 2015
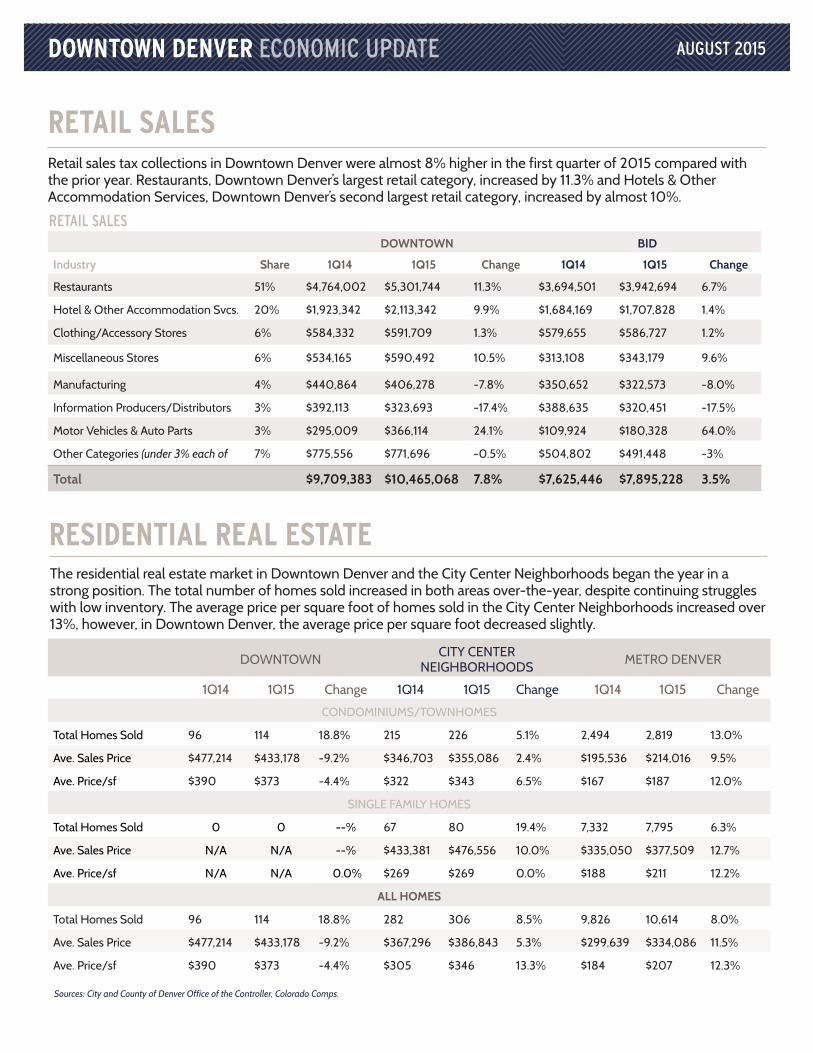
The residential real estate market in Downtown Denver and the City Center Neighborhoods began the year in a strong position. The total number of homes sold increased in both areas over-the-year, despite continuing struggles with low inventory. The average price per square foot of homes sold in the City Center Neighborhoods increased over 13%, however, in Downtown Denver, the average price per square foot decreased slightly.
RESIDENTIAL REAL ESTATE
DOWNTOWN CITY CENTER NEIGHBORHOODS METRO DENVER
1Q14 1Q15 Change 1Q14 1Q15 Change 1Q14 1Q15 Change
CONDOMINIUMS/TOWNHOMES
Total Homes Sold 96 114 18.8% 215 226 5.1% 2,494 2,819 13.0%
Ave. Sales Price $477,214 $433,178 -9.2% $346,703 $355,086 2.4% $195,536 $214,016 9.5%
Ave. Price/sf $390 $373 -4.4% $322 $343 6.5% $167 $187 12.0%
SINGLE FAMILY HOMES
Total Homes Sold 0 0 --% 67 80 19.4% 7,332 7,795 6.3%
Ave. Sales Price N/A N/A --% $433,381 $476,556 10.0% $335,050 $377,509 12.7%
Ave. Price/sf N/A N/A 0.0% $269 $269 0.0% $188 $211 12.2%
ALL HOMES
Total Homes Sold 96 114 18.8% 282 306 8.5% 9,826 10,614 8.0%
Ave. Sales Price $477,214 $433,178 -9.2% $367,296 $386,843 5.3% $299,639 $334,086 11.5%
Ave. Price/sf $390 $373 -4.4% $305 $346 13.3% $184 $207 12.3%
Retail sales tax collections in Downtown Denver were almost 8% higher in the first quarter of 2015 compared with the prior year. Restaurants, Downtown Denver’s largest retail category, increased by 11.3% and Hotels & Other Accommodation Services, Downtown Denver’s second largest retail category, increased by almost 10%.
RETAIL SALES
DOWNTOWN BID
Industry Share 1Q14 1Q15 Change 1Q14 1Q15 Change
Restaurants 51% $4,764,002 $5,301,744 11.3% $3,694,501 $3,942,694 6.7%
Hotel & Other Accommodation Svcs. 20% $1,923,342 $2,113,342 9.9% $1,684,169 $1,707,828 1.4%
Clothing/Accessory Stores 6% $584,332 $591,709 1.3% $579,655 $586,727 1.2%
Miscellaneous Stores 6% $534,165 $590,492 10.5% $313,108 $343,179 9.6%
Manufacturing 4% $440,864 $406,278 -7.8% $350,652 $322,573 -8.0%
Information Producers/Distributors 3% $392,113 $323,693 -17.4% $388,635 $320,451 -17.5%
Motor Vehicles & Auto Parts 3% $295,009 $366,114 24.1% $109,924 $180,328 64.0%
Other Categories (under 3% each of 7% $775,556 $771,696 -0.5% $504,802 $491,448 -3%
Total $9,709,383 $10,465,068 7.8% $7,625,446 $7,895,228 3.5%
RETAIL SALES
HOTEL MARKETIndicators show the hotel market in Downtown Denver remains strong. While occupancy rates were slightly down, Average Daily Room Rates and RevPAR both increased. Also, retail sales tax collections from Hotel and Other Accommodation Services have been posting significant increases in recent quarters.
OCCUPANCY RATE AVERAGE DAILY ROOM RATE
REVENUE PER AVAILABLE ROOM
(REVPAR)
2015 Year-to-Date* 77.1% $175.86 $135.66
2014 Year-to-Date* 78.0% $166.65 $129.92
Change -1.2% 5.5% 4.4%
*Data through end of June
The commercial real estate market improved in the Downtown Denver market area between the second quarter of 2014 and 2015. Downtown Denver reported declining vacancy rates in both the office and retail markets, where rates fell 1.8 percentage points and 0.7 percentage points, respectively. The average lease rate for office space in Downtown Denver rose almost 10 percent, while the average lease rate for retail space rose 19 percent.
OFFICE, RETAIL & INDUSTRIAL MARKETVACANCY RATE* AVG. LEASE RATE*
2Q14 2Q15 Change 2Q14 2Q15 Change
OFFICE
BID 12.1% 10.2% -1.8 $29.99 $32.86 9.6%
Downtown 11.4% 9.6% -1.8 $29.75 $32.62 9.6%
Metro Denver 10.9% 9.8% -1.1 $22.44 $23.56 5.0%
INDUSTRIAL
BID ** 0.0% 0.0% 0.0 - - -
Downtown 0.0% 0.6% 0.6 $10.00 $15.54 55.4%
Metro Denver 3.7% 2.9% -0.8 $5.60 $6.63 18.4%
RETAIL
BID 7.4% 6.3% -1.1 $26.67 $32.36 21.3%
Downtown 5.0% 4.3% -0.7 $24.82 $29.53 19.0%
Metro Denver 5.7% 5.0% -0.7 $15.47 $15.78 2.0%
HISTORICAL OFFICE VACANCY RATE HISTORICAL OFFICE AVE. LEASE RATE
DOWNTOWN DENVER ECONOMIC UPDATE AUGUST 2015
25
$26.00
$27.00
$28.00
$29.00
$30.00
$31.00
$32.00
2Q154Q142Q144Q132Q134Q122Q124Q112Q114Q102Q104Q09
$33.00
9.0%
10.5%
12.0%
13.5%
2Q154Q142Q144Q132Q134Q122Q124Q112Q114Q102Q104Q09
15.0%
Sources: City and County of Denver Office of the Controller, Colorado Comps. Sources: CoStar Realty Information, Downtown Denver Partnership, Rocky Mountain Lodging Report.
* Vacancy and average lease rates are for direct space only. Retail and industrial rates are triple-net.
** The BID contains one industrial property, which is occupied.

DOWNTOWN DENVER ECONOMIC UPDATE AUGUST 2015
The residential real estate market in Downtown Denver and the City Center Neighborhoods began the year in a strong position. The total number of homes sold increased in both areas over-the-year, despite continuing struggles with low inventory. The average price per square foot of homes sold in the City Center Neighborhoods increased over 13%, however, in Downtown Denver, the average price per square foot decreased slightly.
RESIDENTIAL REAL ESTATE
DOWNTOWN CITY CENTER NEIGHBORHOODS METRO DENVER
1Q14 1Q15 Change 1Q14 1Q15 Change 1Q14 1Q15 Change
CONDOMINIUMS/TOWNHOMES
Total Homes Sold 96 114 18.8% 215 226 5.1% 2,494 2,819 13.0%
Ave. Sales Price $477,214 $433,178 -9.2% $346,703 $355,086 2.4% $195,536 $214,016 9.5%
Ave. Price/sf $390 $373 -4.4% $322 $343 6.5% $167 $187 12.0%
SINGLE FAMILY HOMES
Total Homes Sold 0 0 --% 67 80 19.4% 7,332 7,795 6.3%
Ave. Sales Price N/A N/A --% $433,381 $476,556 10.0% $335,050 $377,509 12.7%
Ave. Price/sf N/A N/A 0.0% $269 $269 0.0% $188 $211 12.2%
ALL HOMES
Total Homes Sold 96 114 18.8% 282 306 8.5% 9,826 10,614 8.0%
Ave. Sales Price $477,214 $433,178 -9.2% $367,296 $386,843 5.3% $299,639 $334,086 11.5%
Ave. Price/sf $390 $373 -4.4% $305 $346 13.3% $184 $207 12.3%
Retail sales tax collections in Downtown Denver were almost 8% higher in the first quarter of 2015 compared with the prior year. Restaurants, Downtown Denver’s largest retail category, increased by 11.3% and Hotels & Other Accommodation Services, Downtown Denver’s second largest retail category, increased by almost 10%.
RETAIL SALES
DOWNTOWN BID
Industry Share 1Q14 1Q15 Change 1Q14 1Q15 Change
Restaurants 51% $4,764,002 $5,301,744 11.3% $3,694,501 $3,942,694 6.7%
Hotel & Other Accommodation Svcs. 20% $1,923,342 $2,113,342 9.9% $1,684,169 $1,707,828 1.4%
Clothing/Accessory Stores 6% $584,332 $591,709 1.3% $579,655 $586,727 1.2%
Miscellaneous Stores 6% $534,165 $590,492 10.5% $313,108 $343,179 9.6%
Manufacturing 4% $440,864 $406,278 -7.8% $350,652 $322,573 -8.0%
Information Producers/Distributors 3% $392,113 $323,693 -17.4% $388,635 $320,451 -17.5%
Motor Vehicles & Auto Parts 3% $295,009 $366,114 24.1% $109,924 $180,328 64.0%
Other Categories (under 3% each of 7% $775,556 $771,696 -0.5% $504,802 $491,448 -3%
Total $9,709,383 $10,465,068 7.8% $7,625,446 $7,895,228 3.5%
RETAIL SALES
HOTEL MARKETIndicators show the hotel market in Downtown Denver remains strong. While occupancy rates were slightly down, Average Daily Room Rates and RevPAR both increased. Also, retail sales tax collections from Hotel and Other Accommodation Services have been posting significant increases in recent quarters.
OCCUPANCY RATE AVERAGE DAILY ROOM RATE
REVENUE PER AVAILABLE ROOM
(REVPAR)
2015 Year-to-Date* 77.1% $175.86 $135.66
2014 Year-to-Date* 78.0% $166.65 $129.92
Change -1.2% 5.5% 4.4%
*Data through end of June
The commercial real estate market improved in the Downtown Denver market area between the second quarter of 2014 and 2015. Downtown Denver reported declining vacancy rates in both the office and retail markets, where rates fell 1.8 percentage points and 0.7 percentage points, respectively. The average lease rate for office space in Downtown Denver rose almost 10 percent, while the average lease rate for retail space rose 19 percent.
OFFICE, RETAIL & INDUSTRIAL MARKETVACANCY RATE* AVG. LEASE RATE*
2Q14 2Q15 Change 2Q14 2Q15 Change
OFFICE
BID 12.1% 10.2% -1.8 $29.99 $32.86 9.6%
Downtown 11.4% 9.6% -1.8 $29.75 $32.62 9.6%
Metro Denver 10.9% 9.8% -1.1 $22.44 $23.56 5.0%
INDUSTRIAL
BID ** 0.0% 0.0% 0.0 - - -
Downtown 0.0% 0.6% 0.6 $10.00 $15.54 55.4%
Metro Denver 3.7% 2.9% -0.8 $5.60 $6.63 18.4%
RETAIL
BID 7.4% 6.3% -1.1 $26.67 $32.36 21.3%
Downtown 5.0% 4.3% -0.7 $24.82 $29.53 19.0%
Metro Denver 5.7% 5.0% -0.7 $15.47 $15.78 2.0%
HISTORICAL OFFICE VACANCY RATE HISTORICAL OFFICE AVE. LEASE RATE
DOWNTOWN DENVER ECONOMIC UPDATE AUGUST 2015
25
$26.00
$27.00
$28.00
$29.00
$30.00
$31.00
$32.00
2Q154Q142Q144Q132Q134Q122Q124Q112Q114Q102Q104Q09
$33.00
9.0%
10.5%
12.0%
13.5%
2Q154Q142Q144Q132Q134Q122Q124Q112Q114Q102Q104Q09
15.0%
Sources: City and County of Denver Office of the Controller, Colorado Comps. Sources: CoStar Realty Information, Downtown Denver Partnership, Rocky Mountain Lodging Report.
* Vacancy and average lease rates are for direct space only. Retail and industrial rates are triple-net.
** The BID contains one industrial property, which is occupied.

DOWNTOWN DENVER ECONOMIC UPDATEAUGUST 2015
This report contains the most recent economic indicators available for Downtown Denver and the Business Improvement District. According to the most recent indicators, Downtown Denver economic conditions continue to improve. Employment growth is strong, consumers are spending at a healthy pace, and the downtown commercial real estate markets reported rising average lease rates and declining vacancy.
Summary
EMPLOYMENT RETAIL SALES RESIDENTIAL REAL ESTATE OFFICE MARKET HOTEL MARKET
DOWNTOWN DENVER BID
Industry Share 4Q13 4Q14 Change 4Q13 4Q14 Change
Professional & Business Services 31% 36,284 38,299 5.6% 32,301 33,442 3.5%
Government 19% 23,367 23,043 -1.4% 21,157 20,816 -1.6%
Leisure & Hospitality 16% 18,006 19,125 6.2% 12,964 13,246 2.2%
Financial Activities 12% 14,596 15,085 3.4% 11,334 11,470 1.2%
Natural Resources & Construction 9% 9,826 11,329 15.3% 9,261 10,543 13.8%
Information 4% 4,260 4,319 1.4% 3,519 3,529 0.3%
Wholesale & Retail Trade 3% 4,046 4,032 -0.3% 3,029 2,995 -1.1%
Education & Health Services 2% 2,681 2,906 8.4% 1,547 1,659 7.2%
Other Services 2% 2,839 2,810 -1.0% 2,328 2,397 3.0%
Transp., Warehousing & Utilities 1% 1,461 1,491 2.1% 1,380 1,392 0.8%
Manufacturing 1% 848 926 9.2% 116 130 12.4%
Total 118,215 123,365 4.4% 98,937 101,619 2.7%
Employment levels continued to rise in both Downtown Denver and the Business Improvement District (BID) between the fourth quarters of 2013 and 2014, with employment levels rising 4.4% and 2.7%, respectively. The natural resources and construction supersector continued to report the strongest growth, generating an additional 1,500 jobs over-the-year in Downtown Denver. Employment in Downtown Denver’s largest supersector, prof. and business services, is up almost 6% over-the-year.
107,000
109,000
111,000
113,000
115,000
117,000
119,000
121,000
4Q142Q144Q132Q134Q122Q124Q112Q114Q10
123,000
EMPLOYMENT
DOWNTOWN DENVER
HISTORICAL EMPLOYMENT
+4.4%
4Q 2014 Employment Trends
+4.0%
+3.7%
Downtown Denver
+2.1%
Metro Denver
Colorado
United States
Sources: Colorado Department of Labor and Employment, Quarterly Census of Employment and Wages; Colorado Department of Labor and Employment, Labor Market Information, Current Employment Statistics; U.S. Bureau of Labor Statistics; Development Research Partners; Downtown Denver Partnership.
.
Residential development in Downtown and its City Center neighbor-hoods continues at a brisk pace with 1,836 residential units created so far in 2015. Recently completed projects include 2785 Speer, Lumina, Platform at Union Station and Studio LoHi. Skyhouse Denver, one of the tallest planned rental towers in Downtown’s history, is under construction and will add 354 new rental units to the Central Business District when the 26-story project is completed in 2016. Another new 34-story rental tower, The Confluence, is also under construction in the Central Platte Valley neighborhood and will add 288 new units when it is completed in 2017. On the for-sale front, there are 132 townhomes currently planned or under construction throughout the Downtown neighborhoods.
For more information about development in Downtown Denver, refer to the Quarterly Development Map Updates at www.downtowndenver.com/resources-downloads.
RESIDENTIAL DEVELOPMENT
City CenterNeighborhood
For-Sale Units
Rental Units
Number of Projects
Auraria - - -
Ballpark 28 169 2
Capitol Hill - 347 3
Central Business District - 729 2
CPV/Denver Union Station - 1,780 6
Curtis Park/Five Points 67 435 5
Golden Triangle - 938 4
Highland 10 572 3
Jefferson Park 27 179 2
La Alma/Lincoln Park - 397 2
Lower Downtown - - -
Uptown - 471 2
Total 132 6,017 31
News & Rankings
• Silicon Valley startup ZenPayroll announced that Downtown Denver will be the location of its second U.S. office. The company plans to hire 100 employees this year and as many as 1,000 employees in the future.
• Forbes determined that the Denver Metro area is Ameriaca’s best place for business and careers in the publication’s annual ranking.
• The Denver Metro area was ranked number one in the country for economic and gob growth by Area Development magazine.
• In June, Hines broke ground on 1144 Fifteenth, a 40-story office tower on 15th and Arapahoe.
• Denver ranked fifth in the nation for startup activity in the 2015 Kauffman Index.
• WeWork, an international coworking company, leased three floors in the Triangle Building at 16th and Wewatta, adding 70,000 square feet of coworking space to Downtown Denver.
• The U.S. Census Bureau released 2014 population estimates in June. The latest population estimate for the City and County of Denver is 663,862, an increase of over 15,000 from the 2013 population estimate.
• Nerdwallet ranked Denver the sixth best U.S. city for foodies in 2015.
• For the third month this year, metro Denver ranked number one in year-over-year home-price gains, accoding to the latest S&P/Case-Shiller Home Prices Index report of major U.S. cities.
• Walkscore ranked Denver as the fourth most bikeable city in the U.S.
About This Report
This report includes the most recent quarterly data available and covers economic conditions in three areas. The
first and smallest area, the Business Improvement District (BID), is the core of Downtown Denver, The second area,
“Downtown,” includes the BID as well as a few surrounding districts such as the Golden Triangle. The third area, City Center
Neighborhoods, includes the BID, Downtown, and surrounding residential neighborhoods such as Uptown and Highland.
Data in this report was provided by Development Research Partners. For questions or comments, please contact the
Downtown Denver Partnership Research Department at 303-534-6161.
Sources: Downtown Denver Partnership, Metro Denver Economic Development Corporation, Denver Business Journal, Denver Post.
DOWNTOWN DENVER ECONOMIC UPDATE AUGUST 2015
RESIDENTIAL DEVELOPMENTS PLANNED OR UNDERWAY AS OF AUGUST 2015