attracting private investments into rural electrification ... · attracting private investments...
TRANSCRIPT
Attracting private investments into rural electrification – a case study on renewable
energy based village grids in Indonesia
Tobias S. SCHMIDT*, Nicola U. BLUM, Ratri SRYANTORO WAKELING
Swiss Federal Institute of Technology Zurich (ETH Zurich), Department of Management, Technology, and
Economics, Chair of Sustainability and Technology, Weinbergstrasse 56, Zurich CH-8092, Switzerland
* Corresponding author contact details: [email protected]
Abstract
Renewable energy based village grids (RVGs) are widely considered to be a sustainable solution for rural
electrification in non-OECD countries. However, diffusion rates of RVGs are relatively low. We take the
viewpoint that, as public resources are scarce, investments from the private sector are essential to scale-up the
diffusion. While existing literature mostly focuses on engineering, development and techno-economic aspects, the
private sector’s perspective remains under-researched. As investment decisions by private investors are mainly
based on the risk/return profile of potential projects we – based on literature reviews and field research –
investigate the risk and the return aspects of RVGs in Indonesia, a country with one of the largest potentials for
RVGs. We find that considering the potential of local, national and international revenue streams, the returns of
RVGs can be positive. Regarding the risk aspect, we see that private investors could address many of the existing
barriers through their business model. However, the findings also point to the need for government action in order
to further improve the risk/return profile and thereby attract private investments for RVGs.
Keywords: off-grid; mini-grid; micro-grid; risk/return profile; investment barrier; subsidy
Published in Energy for Sustainable Development. (doi: 10.1016/j.esd.2013.10.001)
Please cite this article as: Schmidt, T. S., Blum, N. U., & Wakeling, R. S. (2013). Attracting private
investments into rural electrification—A case study on renewable energy based village grids in Indonesia.
Energy for Sustainable Development, 17(6), 581-595.
1
1 Introduction
Today, about 19% of the global population remain without access to electricity (OECD/IEA 2011). Access to
electricity heavily correlates with economic development, and those people lacking access primarily live in rural
areas of non-OECD countries (OECD/IEA 2011). Providing these rural poor with electricity is a major challenge.
The amount of additional electricity generation capacity needed is enormous when aiming to stimulate rural
development (Cook 2011; Bardouille et al. 2012; ESMAP 2008). At the same time, climate change (being a major
threat mainly to the poorest countries) needs to be addressed by de-coupling electricity production from CO2
emissions (Gallagher et al. 2006; UN AGECC 2010; Glemarec et al. 2012; Bhattacharyya 2011). Grid extension
– the conventional solution for electrification in most countries – is often not feasible or too expensive, especially
in very remote areas such as islands as is the case in Indonesia (Blum et al. 2013; Deichmann et al. 2011; Rickerson
et al. 2012). In such cases, off-grid renewable energy technologies which produce electricity with a very low
climate impact and that fit the requirements of a decentralized context, can well address the challenge of low-
carbon electrification (Zerriffi 2011; Holland & Derbyshire 2009; Sovacool & Valentine 2011). In 2011, the
Journal Energy for Sustainable Development published a special issue on off-grid electrification in non-OECD
countries, which discussed rural electrification through renewable energy in a series of sixteen articles and was
specifically valuable for our study (for an overview see Bhattacharyya, 2011). Several authors from this special
issue (e.g. Bhattacharyya, 2011; Schäfer et al., 2011) as well as other researchers (e.g. Zerriffi, 2011; Glemarec,
2012) recommend further research with regards to scaling up diffusion through private investments. Even though
research on rural electrification through renewable energy is increasing, most studies address the engineering,
development and techno-economic aspects. The private sector’s investment decisions, remain poorly researched
(Bhattacharyya 2011; Kaundinya et al. 2009; Bhattacharyya 2012).
Renewable energy based rural electrification options are diverse and vary greatly regarding the amount of provided
electricity and consequently the potential for allowing for the productive use of electricity. While solar lanterns
and household-based stand alone systems such as solar home systems offer lighting and limited access to electricity
for household purposes respectively, their contribution to the productive use of electricity is low (Macharia et al.
2010; Ölz & Beerepoot 2010). Village grids1 are widely regarded as more promising in terms of a developmental
impact because they allow for the productive use of the generated electricity (Kanagawa & Nakata 2007; Takada
& Charles 2007; Legros et al. 2009; Cook 2011). If designed well they can, in terms of reliability, outperform the
often unstable national grids in non-OECD countries (Yadoo & Cruickshank 2012; Peskett 2011). If village grids
are powered by renewable energy they not only address the poverty, but also the climate change challenge. While
the global market for off-grid solutions bringing modern energy to the rural poor has a size of about 35 billion
USD p.a., the market potential for RVGs alone is estimated at an annual 4 – 5 billion USD (2012) (or about 28
million households) and growing by 13% p.a. (Bardouille et al. 2012; Dean et al. 2012). However, despite the
advantages of RVGs, the existence of pilot projects (e.g., in Bolivia, Cambodia, India, Indonesia, Nepal, Nigeria,
or the Philippines) and the heavy promotion by development agencies, large-scale diffusion has not yet taken place
1 Village grids, also referred to as micro- or mini-grids, “provide centralized generation at a local level. They operate at a village
or district network level, with loads of up to 500 kW” (OECD/IEA 2011, p.16) and connect a few up to several thousand
households (Bardouille et al. 2012).
2

(Bardouille et al. 2012; Roland & Glania 2011). In this study we focus on RVGs in Indonesia where they are a
very suitable form of rural electrification for three reasons2 (see also Section 2). First, the government of Indonesia
(GoI) aims to increase the electrification rate from the current 65-70% to beyond 90% by the end of the decade
(PT Perusahaan Listrik Negara 2010; Winoto et al. 2012; PWC 2011). Second, Indonesia is an island state, making
grid extension complicated and expensive. Third, the country has more than sufficient renewable energy resources,
e.g., in forms of solar and hydro power. Theoretically, there are four known sources of finance for RVG projects
in Indonesia: First, international grants from nongovernmental organizations (NGOs) and developmental agencies
providing initial capital for RVG projects3, second, grants for electrification provided by the federal GoI (Ministry
of Energy & Mineral Resources of Indonesia 2009) , and fourth, private investors (typically local or regional
businesses) and village communities which arrange joint financing agreements. Despite these potential sources of
finance, little investments have taken place (Bardouille et al. 2012; OECD/IEA 2011; PWC 2011). While the first
two sources of capital are limited by the specific grants, the private capital is abundant. In order to understand
private investment – or the lack thereof - the risk/return profile is essential, as for private financiers/investors,
“the risk-return profile of a project is the ultimate determinant of whether to finance or not” (UNEP, 2012, p.9).
In this paper, we therefore address the question “what do the current risk/return profiles of RVGs in Indonesia
look like and how can they be improved in order to attract private investments?” We proceed in two steps.
First, we investigate the potential returns of different RVG types by comparing costs with revenues. Second, we
turn to risks, by analyzing the barriers that drive investment risks (compare Waissbein et al., 2013) and show how
investors could make these risks manageable. Both, positive returns as well as manageable risks are prerequisites
for attracting private capital (Glemarec 2012; Waissbein et al. 2013; UNEP 2012). The role of the government in
supporting the formation of such a favorable environment for investment is essential (Waissbein et al. 2013; The
World Bank 2013).
The paper is structured as follows. Section 2 introduces Indonesia’s electricity sector with an emphasis on rural
electrification through renewable energy and RVGs. Section 3 provides an overview of the methods applied. In
Section 4 we identify potential returns of RVGs. Section 5 provides the results of a detailed barrier analysis (that
is needed to understand risks) as well as a comprehensive selection of multiple measures to assist investors to
address these aforementioned barriers. We then turn to the role of regulation and discuss our findings in Section
6 with regards to the role of national policy for improving the risk/return profiles of RVGs. Section 7 concludes
with a short summary of our findings.
2 Background on Indonesia’s electricity sector, rural electrification and RVGs
The Indonesian State Constitution from 1945 declares that all vital utilities concerning the greater population must
be controlled by the state. Since 1985, the electricity sector in Indonesia has been controlled by the state-owned
2 Another – non-empirically driven – reason for the choice of Indonesia was the fact that one of the authors is an Indonesian
native, which strongly improved the accessibility of data gained in literature reviews and during field trips (see Section 3). 3 Additionally, international initial capital can potentially be extended by carbon financing (compare Section 4).
3
power utility Perusahaan Listrik Negara (PLN). After its formation, PLN became the sole body responsible for the
provision of electricity across Indonesia. The Ministry of Energy & Mineral Resources serves as the policy making
body and regulator for PLN. However, other ministries within the GoI are also stakeholders providing different
governing and support functions. In a bid to boost the capacity of electricity generation and keep up with an
estimated 9% annual demand growth (Differ Group 2012; Permana et al. 2012), the GoI since 2009 has opened up
the market of power generation for competition. Small scale independent power producers (IPPs) can now produce
electricity, but are required to sell it to PLN for distribution. Only rural cooperatives are allowed to generate and
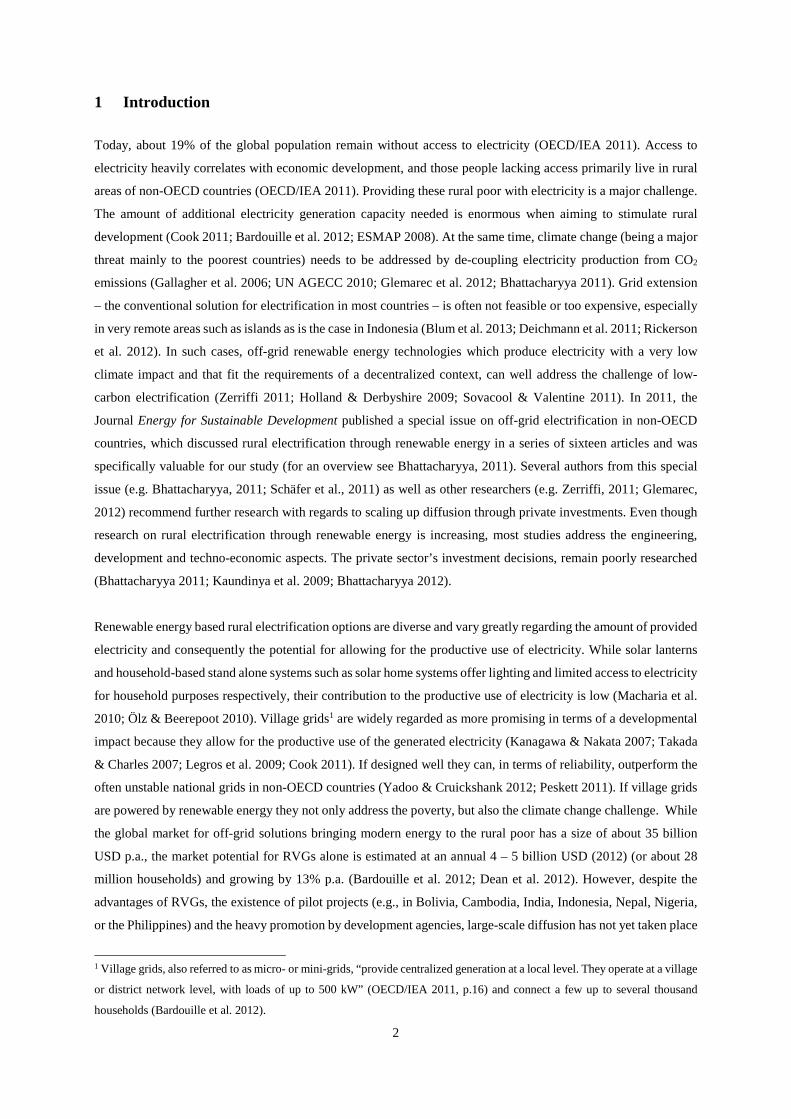
distribute electricity independently of PLN. Figure 1 shows a schematic of key players in the Indonesian electricity
sector and their roles. In order to address climate change and reduce its oil dependency, the GoI has also introduced
The Ministerial Decree on Renewable Energy Resources and Conservation (Ministerial Decree No. 002/2004)
which aims at increasing the share of renewable energy to 18% by 2025 (Energypedia 2013).
Figure 1 Governmental and industrial stakeholders in the Indonesian Electricity Sector (adapted from Anderson et al.,
2011; Purra, 2009)
Despite having significantly developed its generation, transmission and distribution network over the years, the
national electricity grid remains significantly strained. The growth in generation capacity has been unable to keep
up with the growth in electricity demand. Since 2009, the Java-Bali transmission grid is particularly congested,
which has led to “transmission bottlenecks” that often forced PLN to impose rolling blackouts across the two main
islands of Java and Sumatra. However, the more remote islands mainly suffer from partial or even complete lack
Main Industrial Stakeholders in the electricity production value chain
Cons
umpt
ion
Gene
ratio
n
Tran
smiss
ion
&
Syst
em
oper
atio
n
Dist
ribut
ion
IPPs
Cooperatives
PLN
Off-
grid
, on
lyGr
id a
nd o
ff-gr
id
Ministry of Finance
Ministry of Stated Owned
Enterprises
Ministry of Energy & Mineral
Resources
National Development
Board
Regional Governments
Main Governmental Stakeholders in the Electricity Sector and their responsibilities
Minister of Economy
Subsidies, Loans, Government
Equity
Shareholder Policy making, regulatory function
Development planning
Regional planning
Coordination
4
of electricity. With an electrification ratio of about 65% - 70%4, about 72 - 84 million of the 242 million
Indonesians still do not have access to reliable and affordable electricity services (PT Perusahaan Listrik Negara
2010; Winoto et al. 2012; Energypedia 2013; Asia Sustainable and Alternative Energy Program 2005; Purwono
2008). Of these 72 – 84 million people the vast majority, about 60 million, reside in rural areas and almost all live
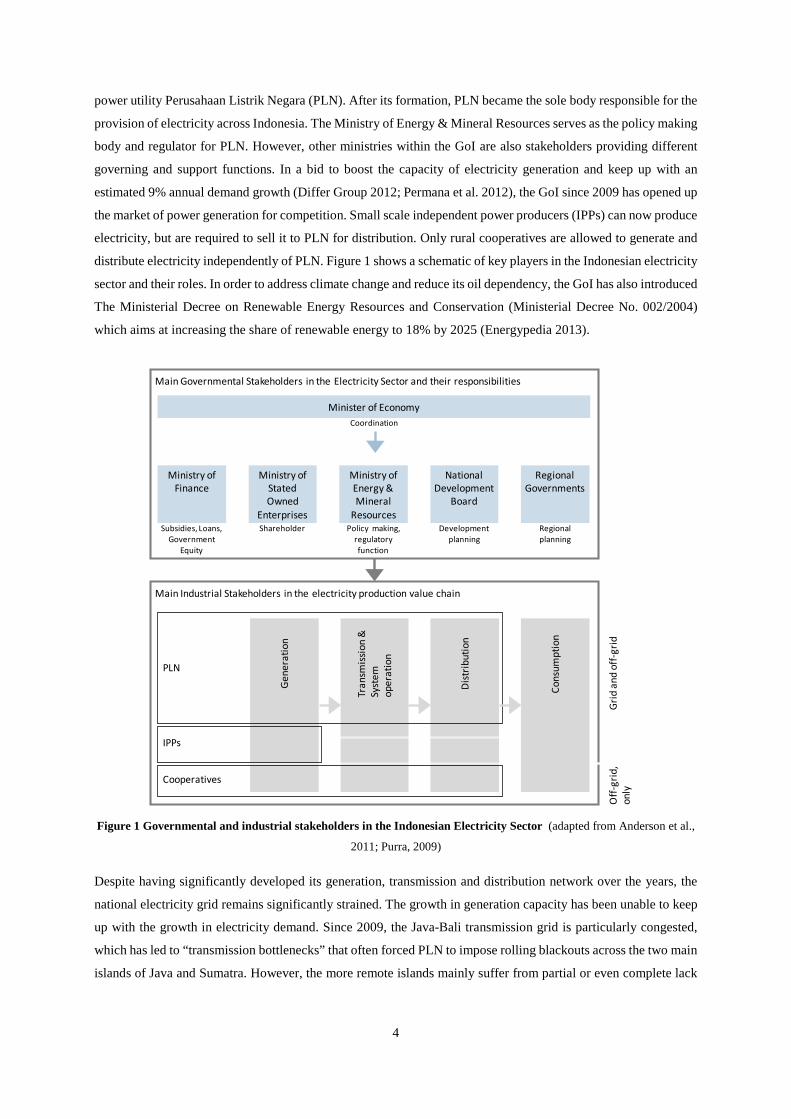
outside of the most densely populated islands5: Figure 2 shows the electrification ratios per province and clearly
indicates that the eastern parts of Indonesia particularly are suffering from a lack of access to electricity. Despite
these official figures, it has been very difficult to quantify the real progress at the rural village level.
Figure 2 Indonesian electrification ratios (number of electrified households) per province. Own graph based on data
from 2011 from the Indonesian Ministry of Energy and Mineral Resources (Kusdiana 2012; Winoto et al. 2012)
Previous studies suggest that due to the challenging geographical nature of the country, a decentralized off-grid
electrification solution is more appropriate than grid extension, in particular for remote and rural villages in
mountainous areas and on smaller islands (Blum et al. 2013; Kaundinya et al. 2009; Boedoyo & Sugiyono 2010;
Sovacool & Valentine 2011). Currently, most village grids are powered by diesel plants: at the end of 2007, 936
decentralized diesel power plants (50kW – 500kW) with a total capacity of 987MW were operating in Indonesia
(Senoaji 2008). Diesel generators are a standard rural electrification solution, due to their long track-record,
reliability, scalability, availability and relatively low upfront cost (ESMAP 2007). However, in line with the GoI’s
aim to increase the share of renewables in electricity generation, RVGs are largely considered to be a suitable
alternative to improve rural electrification while at the same time not increasing greenhouse gas emissions (Beck
& Martinot 2004; ESMAP 2007; Terrado et al. 2008; White et al. 2008).
While PLN aims at erecting solar powered village grids on several hundred islands within the next years (through
the “1,000 island project”), only on few islands have projects been realized thus far. At the same time, only few
4 Electrification figures diverge depending on the source and the interpretation of electrification; often electrification ratios
reflect general access to electricity, but do not reflect the quantity and quality of the accessed electricity (Interviews). In
Indonesia a village counts as ‘electrified’ if at least one location within the villages is connected to PLN’s low voltage grid –
which includes mainly diesel powered village grids. A clearer indication of the true electrification ratio would be the number
of electrified households (see Figure 2). 5 Indonesia consists of about 17’508 islands, out of which around 6’000 are inhabited (The CIA World Factbook 2013).
> 80%
60 – 80%
40 – 60%
< 40%
n.a.
5
private sector activities, such as the social business IBEKA, exist. International initiatives include Energizing
Development (EnDev) and RewiRE, or UNDP’s support, e.g., for Yayasan Bina Kitorang Mandiri (YBKM).
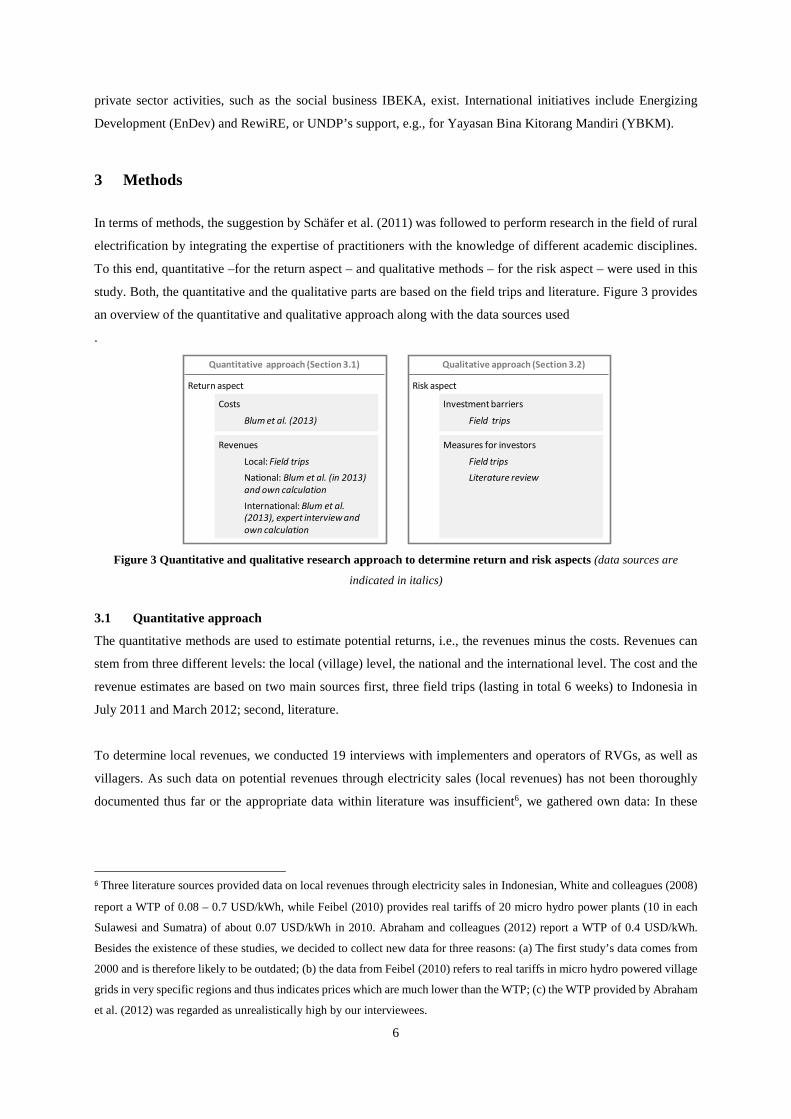
3 Methods
In terms of methods, the suggestion by Schäfer et al. (2011) was followed to perform research in the field of rural
electrification by integrating the expertise of practitioners with the knowledge of different academic disciplines.
To this end, quantitative –for the return aspect – and qualitative methods – for the risk aspect – were used in this
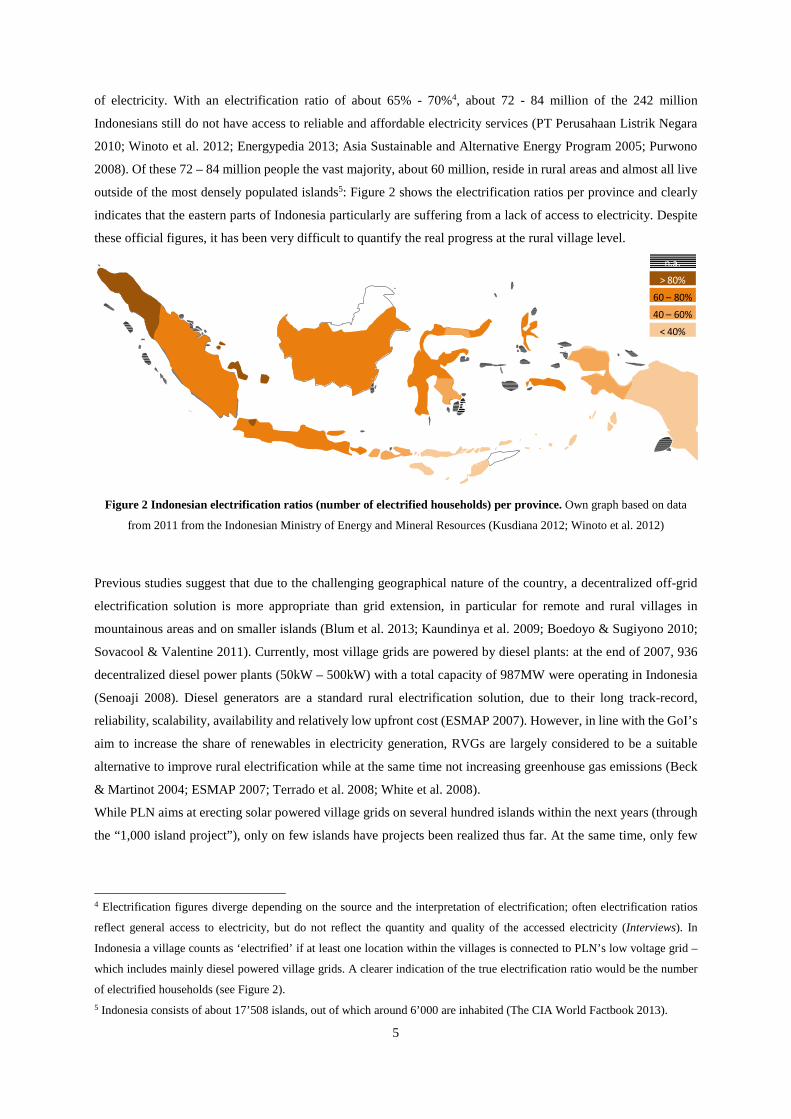
study. Both, the quantitative and the qualitative parts are based on the field trips and literature. Figure 3 provides
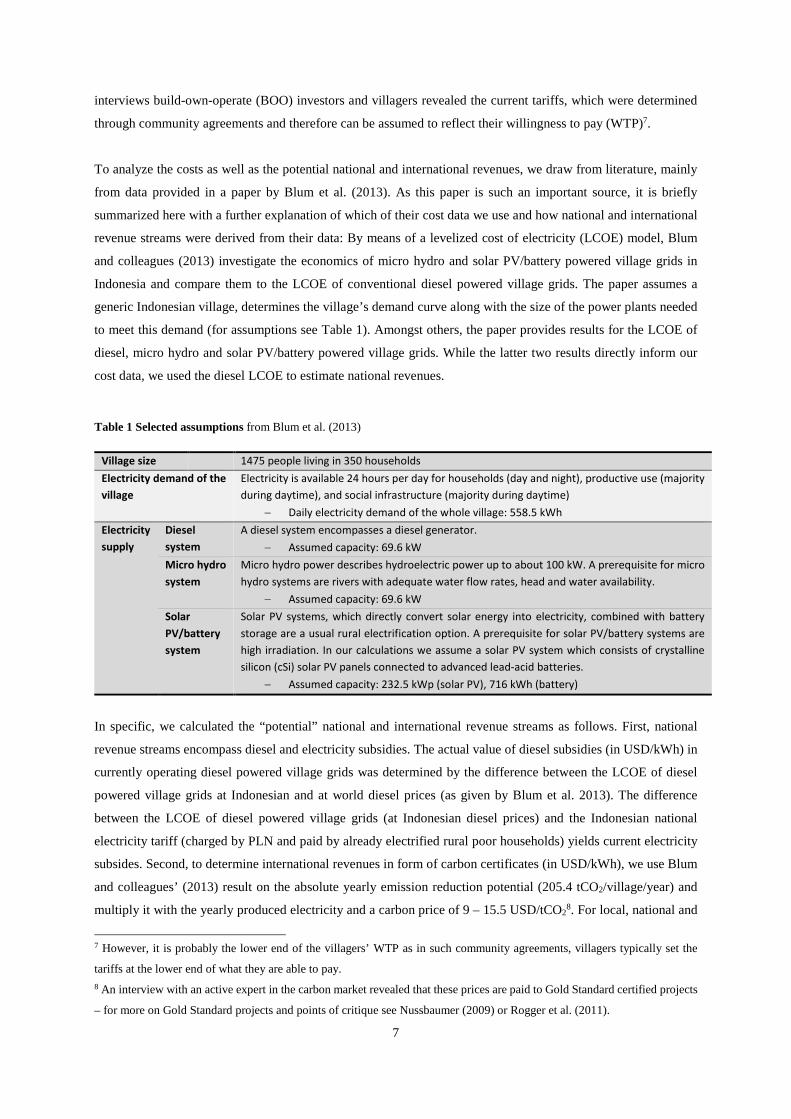
an overview of the quantitative and qualitative approach along with the data sources used
.
Figure 3 Quantitative and qualitative research approach to determine return and risk aspects (data sources are
indicated in italics)
3.1 Quantitative approach
The quantitative methods are used to estimate potential returns, i.e., the revenues minus the costs. Revenues can
stem from three different levels: the local (village) level, the national and the international level. The cost and the
revenue estimates are based on two main sources first, three field trips (lasting in total 6 weeks) to Indonesia in
July 2011 and March 2012; second, literature.
To determine local revenues, we conducted 19 interviews with implementers and operators of RVGs, as well as
villagers. As such data on potential revenues through electricity sales (local revenues) has not been thoroughly
documented thus far or the appropriate data within literature was insufficient6, we gathered own data: In these
6 Three literature sources provided data on local revenues through electricity sales in Indonesian, White and colleagues (2008)
report a WTP of 0.08 – 0.7 USD/kWh, while Feibel (2010) provides real tariffs of 20 micro hydro power plants (10 in each
Sulawesi and Sumatra) of about 0.07 USD/kWh in 2010. Abraham and colleagues (2012) report a WTP of 0.4 USD/kWh.
Besides the existence of these studies, we decided to collect new data for three reasons: (a) The first study’s data comes from
2000 and is therefore likely to be outdated; (b) the data from Feibel (2010) refers to real tariffs in micro hydro powered village
grids in very specific regions and thus indicates prices which are much lower than the WTP; (c) the WTP provided by Abraham
et al. (2012) was regarded as unrealistically high by our interviewees.
Return aspect Risk aspect
Quantitative approach (Section 3.1) Qualitative approach (Section 3.2)
Revenues
Local: Field tripsNational: Blum et al. (in 2013)and own calculationInternational: Blum et al. (2013), expert interview and own calculation
Costs
Blum et al. (2013)
Measures for investors
Field trips Literature review
Investment barriers
Field trips
6
interviews build-own-operate (BOO) investors and villagers revealed the current tariffs, which were determined
through community agreements and therefore can be assumed to reflect their willingness to pay (WTP)7.
To analyze the costs as well as the potential national and international revenues, we draw from literature, mainly
from data provided in a paper by Blum et al. (2013). As this paper is such an important source, it is briefly
summarized here with a further explanation of which of their cost data we use and how national and international
revenue streams were derived from their data: By means of a levelized cost of electricity (LCOE) model, Blum
and colleagues (2013) investigate the economics of micro hydro and solar PV/battery powered village grids in
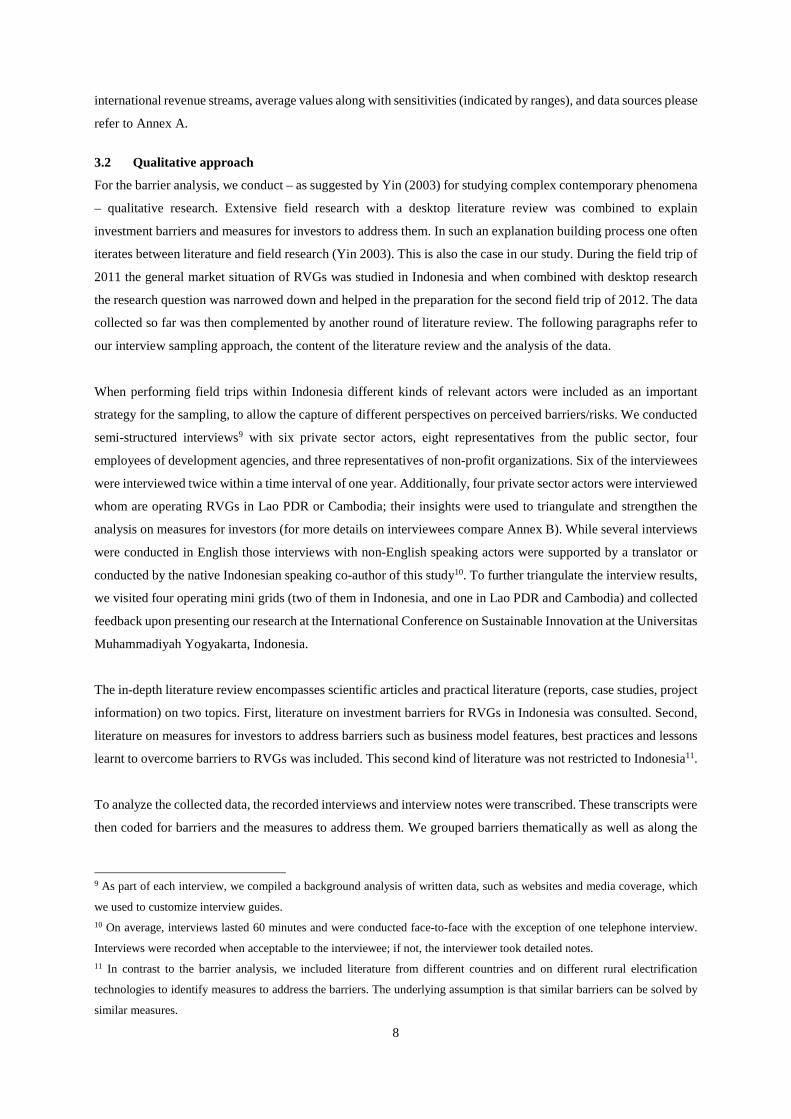
Indonesia and compare them to the LCOE of conventional diesel powered village grids. The paper assumes a
generic Indonesian village, determines the village’s demand curve along with the size of the power plants needed
to meet this demand (for assumptions see Table 1). Amongst others, the paper provides results for the LCOE of
diesel, micro hydro and solar PV/battery powered village grids. While the latter two results directly inform our
cost data, we used the diesel LCOE to estimate national revenues.
Table 1 Selected assumptions from Blum et al. (2013)
In specific, we calculated the “potential” national and international revenue streams as follows. First, national
revenue streams encompass diesel and electricity subsidies. The actual value of diesel subsidies (in USD/kWh) in
currently operating diesel powered village grids was determined by the difference between the LCOE of diesel
powered village grids at Indonesian and at world diesel prices (as given by Blum et al. 2013). The difference
between the LCOE of diesel powered village grids (at Indonesian diesel prices) and the Indonesian national
electricity tariff (charged by PLN and paid by already electrified rural poor households) yields current electricity
subsides. Second, to determine international revenues in form of carbon certificates (in USD/kWh), we use Blum
and colleagues’ (2013) result on the absolute yearly emission reduction potential (205.4 tCO2/village/year) and
multiply it with the yearly produced electricity and a carbon price of 9 – 15.5 USD/tCO28. For local, national and
7 However, it is probably the lower end of the villagers’ WTP as in such community agreements, villagers typically set the
tariffs at the lower end of what they are able to pay. 8 An interview with an active expert in the carbon market revealed that these prices are paid to Gold Standard certified projects
– for more on Gold Standard projects and points of critique see Nussbaumer (2009) or Rogger et al. (2011).
Village size 1475 people living in 350 households Electricity demand of the village
Electricity is available 24 hours per day for households (day and night), productive use (majority during daytime), and social infrastructure (majority during daytime)
− Daily electricity demand of the whole village: 558.5 kWh Electricity supply
Diesel system
A diesel system encompasses a diesel generator. − Assumed capacity: 69.6 kW
Micro hydro system
Micro hydro power describes hydroelectric power up to about 100 kW. A prerequisite for micro hydro systems are rivers with adequate water flow rates, head and water availability.
− Assumed capacity: 69.6 kW Solar PV/battery system
Solar PV systems, which directly convert solar energy into electricity, combined with battery storage are a usual rural electrification option. A prerequisite for solar PV/battery systems are high irradiation. In our calculations we assume a solar PV system which consists of crystalline silicon (cSi) solar PV panels connected to advanced lead-acid batteries.
− Assumed capacity: 232.5 kWp (solar PV), 716 kWh (battery)
7
international revenue streams, average values along with sensitivities (indicated by ranges), and data sources please
refer to Annex A.
3.2 Qualitative approach
For the barrier analysis, we conduct – as suggested by Yin (2003) for studying complex contemporary phenomena
– qualitative research. Extensive field research with a desktop literature review was combined to explain
investment barriers and measures for investors to address them. In such an explanation building process one often
iterates between literature and field research (Yin 2003). This is also the case in our study. During the field trip of
2011 the general market situation of RVGs was studied in Indonesia and when combined with desktop research
the research question was narrowed down and helped in the preparation for the second field trip of 2012. The data
collected so far was then complemented by another round of literature review. The following paragraphs refer to
our interview sampling approach, the content of the literature review and the analysis of the data.
When performing field trips within Indonesia different kinds of relevant actors were included as an important
strategy for the sampling, to allow the capture of different perspectives on perceived barriers/risks. We conducted
semi-structured interviews9 with six private sector actors, eight representatives from the public sector, four
employees of development agencies, and three representatives of non-profit organizations. Six of the interviewees
were interviewed twice within a time interval of one year. Additionally, four private sector actors were interviewed
whom are operating RVGs in Lao PDR or Cambodia; their insights were used to triangulate and strengthen the
analysis on measures for investors (for more details on interviewees compare Annex B). While several interviews
were conducted in English those interviews with non-English speaking actors were supported by a translator or
conducted by the native Indonesian speaking co-author of this study10. To further triangulate the interview results,
we visited four operating mini grids (two of them in Indonesia, and one in Lao PDR and Cambodia) and collected
feedback upon presenting our research at the International Conference on Sustainable Innovation at the Universitas
Muhammadiyah Yogyakarta, Indonesia.
The in-depth literature review encompasses scientific articles and practical literature (reports, case studies, project
information) on two topics. First, literature on investment barriers for RVGs in Indonesia was consulted. Second,
literature on measures for investors to address barriers such as business model features, best practices and lessons
learnt to overcome barriers to RVGs was included. This second kind of literature was not restricted to Indonesia11.
To analyze the collected data, the recorded interviews and interview notes were transcribed. These transcripts were
then coded for barriers and the measures to address them. We grouped barriers thematically as well as along the
9 As part of each interview, we compiled a background analysis of written data, such as websites and media coverage, which
we used to customize interview guides. 10 On average, interviews lasted 60 minutes and were conducted face-to-face with the exception of one telephone interview.
Interviews were recorded when acceptable to the interviewee; if not, the interviewer took detailed notes. 11 In contrast to the barrier analysis, we included literature from different countries and on different rural electrification
technologies to identify measures to address the barriers. The underlying assumption is that similar barriers can be solved by
similar measures.
8
local, national and international level in order to obtain a final list of barriers. In a last step we matched the barriers
with suitable measures stemming from the field research and the reviewed literature.
4 Potential returns of RVGs in Indonesia
As discussed in the introduction, RVGs are assumed to become attractive for investors if there is a cost-revenue
situation which allows for positive returns. Other authors claim that “most of the mini-grid projects suffer from
non viability as cost of electricity generation from such projects is high while the return through tariff is low12”
(Palit & Chaurey 2011, p.274). However, they only refer to the local revenue stream (the tariffs) and omit
additional potential revenue sources from the national and international levels. Contrarily, this study considers
potential revenue streams on all three levels: local, national and international. We structure the description of the
potential revenue streams along these three geographical levels (compare Annex A).
Revenues on the local level refer to electricity sales to the villagers. While some authors independent from
Indonesia argue to use villagers’ income levels (or also sometimes referred to as ability to pay) as proxy for local
revenues others suggest considering the WTP (Zerriffi 2011)13. WTP includes other factors besides income levels,
for example educational levels or kerosene consumption (Komatsu et al. 2011; UN AGECC 2010;
Phuangpornpitak & Kumar 2011) and is therefore understood to be more accurate. We therefore consider WTP in
our analysis. Our obtained data reveals that WTP ranges from 0.12 to 0.25 USD/kWh and turns out to be
considerably higher than PLN’s electricity tariff for poor rural households connected to the grid (0.09 USD/kWh).
At the national level, we look at potential revenue streams from a re-distribution of national subsidies. Previous
studies have shown the detrimental effect of fossil fuel subsidies (especially for renewable energies) (Blum et al.
2013; IISD 2011; Schmidt et al. 2012; Fattouh & El-Katiri 2012). Subsidy phase-out is a difficult endeavor
generally (UNEP 2008) and in Indonesia (Mourougane 2010), we argue that a re-distribution of subsidies towards
renewable energy projects could be less problematic (compare Section 6). The underlying assumption is that RVGs
replace a diesel powered village grid, which would otherwise be built. Diesel is the standard technology for village
grids in Indonesia (Senoaji 2008; Blum et al. 2013). The subsidies that the diesel village grid would receive could
generate an additional revenue stream if passed on to the RVG. There are currently two kinds of subsidies in the
Indonesian electricity tariff system (Braithwaite et al. 2012; Differ Group 2012; Permana et al. 2012; Gunningham
2013). First, a fuel subsidy which protects local diesel prices against world price fluctuations14. And second - as
PLN sells at fixed prices, also in off-grid areas – an electricity subsidy bridges the gap between the government-
regulated retail electricity tariffs (0.08 – 1.04 USD/kWh) and the real cost of electricity supply across the PLN
12 Palit and Chaurey (2011) state that the high cost is associated to capital, operation and management costs and the low returns
are linked to low incomes and therefore low financial ability to pay for electricity. 13 Literature is not consistent regarding the question whether the WTP is lower (Martin 2009; Cook 2011) or higher (Zerriffi
2011) than the villager’s ability to pay, but concludes that a) the WTP and the ability to pay have to be balanced (Roland &
Glania 2011) and b) the WTP varies greatly between countries (White et al. 2008). 14 This fuel subsidy is reaching unsustainable levels and increasingly becoming a major strain on the GoI’s spending
(Braithwaite et al. 2012; Haeni et al. 2008; Differ Group 2012; Permana et al. 2012; IISD 2013).
9
network (electricity production cost is 0.09 – 0.35 USD/kWh)15 (Blum et al. 2013; Mourougane 2010; IISD 2011;
Braithwaite et al. 2012; Haeni et al. 2008; Permana et al. 2012). Re-distributing the fuel subsidies to RVGs could
result on average in 0.30 USD/kWh of revenues, re-distributing the electricity subsidies on average in additional
0.39 USD/kWh.
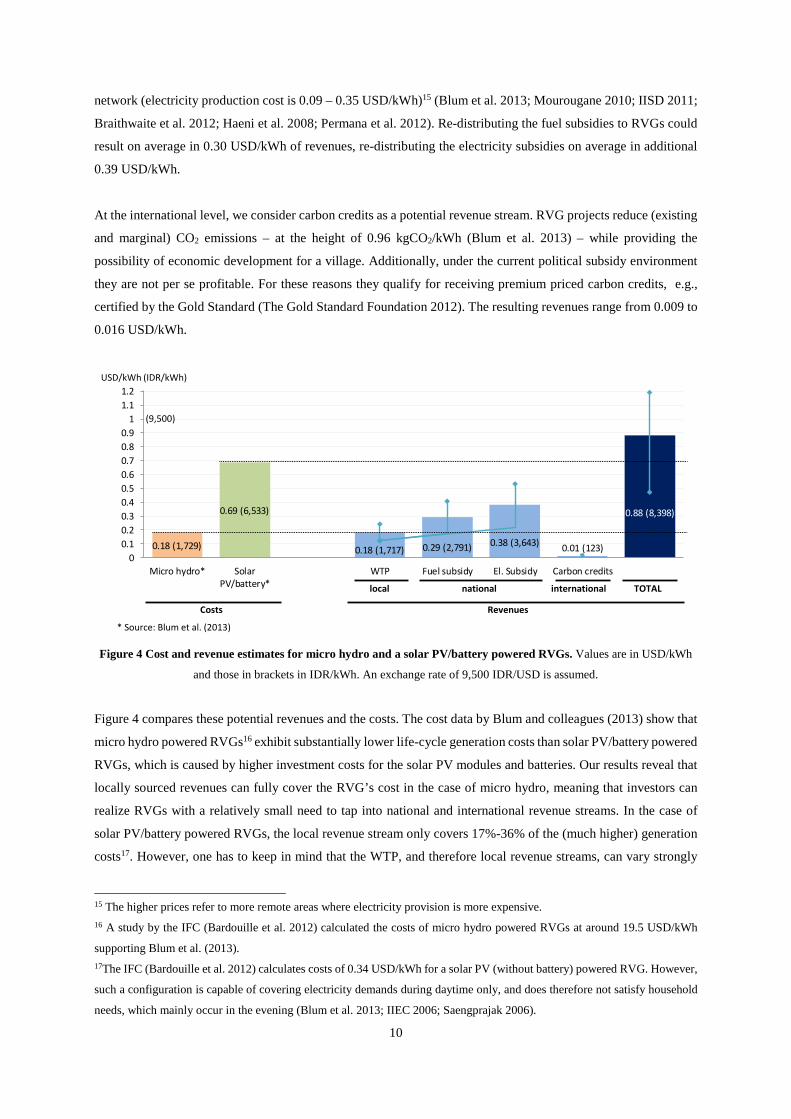
At the international level, we consider carbon credits as a potential revenue stream. RVG projects reduce (existing
and marginal) CO2 emissions – at the height of 0.96 kgCO2/kWh (Blum et al. 2013) – while providing the
possibility of economic development for a village. Additionally, under the current political subsidy environment
they are not per se profitable. For these reasons they qualify for receiving premium priced carbon credits, e.g.,
certified by the Gold Standard (The Gold Standard Foundation 2012). The resulting revenues range from 0.009 to
0.016 USD/kWh.
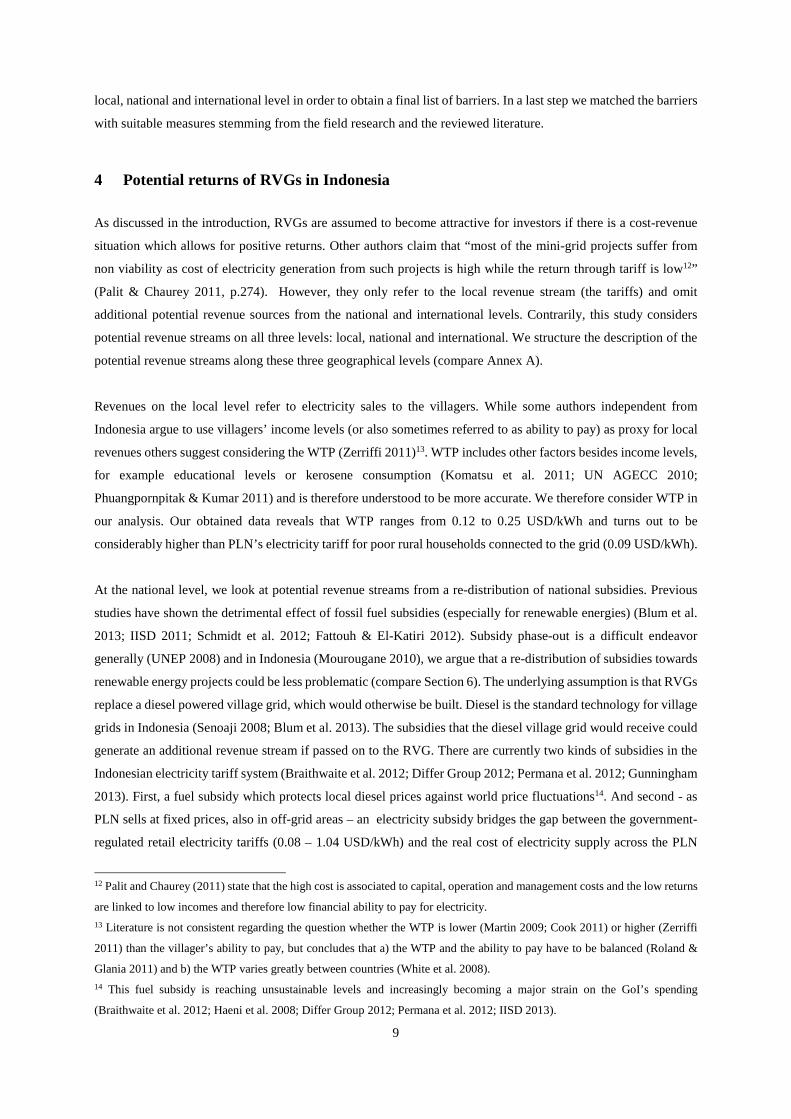
Figure 4 Cost and revenue estimates for micro hydro and a solar PV/battery powered RVGs. Values are in USD/kWh
and those in brackets in IDR/kWh. An exchange rate of 9,500 IDR/USD is assumed.
Figure 4 compares these potential revenues and the costs. The cost data by Blum and colleagues (2013) show that
micro hydro powered RVGs16 exhibit substantially lower life-cycle generation costs than solar PV/battery powered
RVGs, which is caused by higher investment costs for the solar PV modules and batteries. Our results reveal that
locally sourced revenues can fully cover the RVG’s cost in the case of micro hydro, meaning that investors can
realize RVGs with a relatively small need to tap into national and international revenue streams. In the case of
solar PV/battery powered RVGs, the local revenue stream only covers 17%-36% of the (much higher) generation
costs17. However, one has to keep in mind that the WTP, and therefore local revenue streams, can vary strongly
15 The higher prices refer to more remote areas where electricity provision is more expensive. 16 A study by the IFC (Bardouille et al. 2012) calculated the costs of micro hydro powered RVGs at around 19.5 USD/kWh
supporting Blum et al. (2013). 17The IFC (Bardouille et al. 2012) calculates costs of 0.34 USD/kWh for a solar PV (without battery) powered RVG. However,
such a configuration is capable of covering electricity demands during daytime only, and does therefore not satisfy household
needs, which mainly occur in the evening (Blum et al. 2013; IIEC 2006; Saengprajak 2006).
0.18 (1,729)
0.69 (6,533)
0.18 (1,717) 0.29 (2,791) 0.38 (3,643) 0.01 (123)
0.88 (8,398)
00.10.20.30.40.50.60.70.80.9
11.11.2
Micro hydro* SolarPV/battery*
WTP Fuel subsidy El. Subsidy Carbon credits
national international
USD/kWh (IDR/kWh)
Costs Revenues
local TOTAL
* Source: Blum et al. (2013)
(9,500)
10
with income and location (White et al. 2008). It is probable that WTP rises with the increase of productive
activities based on electricity18. When looking at revenue streams on the national level, we find significant effects
of potential subsidies on the return of RVG projects (compare also IISD 2011): Our results suggest that in all cases,
a re-distribution of fuel and electricity subsidies (at the height presently found in the Indonesian fuel market and
for electricity generated by PLN) towards RVGs have the potential to cover the majority of the production cost.
For micro hydro powered RVGs, the contribution from a full re-distribution of either one of the subsidy types
would by far over compensate the costs of a typical project (by 64% and 114% calculated for the average values).
For solar PV/battery powered RVGs, the contribution from shifted fuel subsidies can account for 23% - 58%, and
electricity subsidies for 28% - 77% of production costs. At the international level, we identify that revenues from
carbon credits could yield only between 5% - 9% of the production cost of micro hydro powered RVGs and 1% -
2% of the production cost of solar PV/battery powered RVGs – which originates from low carbon prices (which
might even further decline) (Point Carbon 2013). Our findings support earlier claims stating that it is “extremely
difficult to make carbon financing economically viable for rural electrification projects” (Yadoo 2012).
When summing up all potential revenues, we find that this sum in both RVG types exceeds the respective costs.
This indicates that RVGs can potentially yield profits of 0.07 – 0.57 USD/kWh. While micro hydro powered RVGs
can often be financed with local revenues only, the solar PV/battery powered RVGs heavily depend on further
revenue streams (see Section 6). Theoretically, RVGs get higher potential returns the further away they are from
the national grid due to potentially higher benefits from a subsidy re-distribution. While our results highlight that
a major barrier for the diffusion of solar PV/battery powered RVGs lies in a not yet favorable cost-revenue balance,
it can be assumed that at least in the case of micro hydro powered RVGs the reason for the non-diffusion originates
from additional risks19. Investors typically face many barriers when trying to secure the underlying cash flows
which can translate into investment risks (Waissbein et al. 2013; Glemarec 2012). To understand the low diffusion
rate of RVGs (and especially of micro hydro powered village grids) one therefore needs to analyze these barriers
as done in the next section.
5 Investment barriers and measures for investors to address them
To address the risks specific to RVGs in Indonesia, we first identify the barriers through a barrier analysis. These
barriers can stem from stakeholders on the local, national or international level, i.e. the same levels as the revenue
sources. The barriers can translate into investment risks in the planning, construction and operational phase, which
might discourage investors from investing (or increase financing costs and thereby the generation costs) (Glemarec
et al. 2012; Waissbein et al. 2013). In a second step, we turn to the role of BOO investors20 and discuss how they
could become active in addressing the underlying challenges. By doing so we highlight the important role of
investors in mitigating investment risks, which – as a literature review revealed – is an often neglected aspect in
18 However, as long as PLN tariffs remain at the rate of 0.09 USD/kWh villagers living relatively close to the national grid will
not be willing to pay a tariff which is twice this price. 19 Blum’s et al. (2013) LCOE calculation already assumes an elevated risk level (as typical in the energy sector in Indonesia)
via the discount rate of 12.5% (UNFCCC 2010). 20 We assume BOO investors, as the barriers can affect all phases of the project cycle.
11
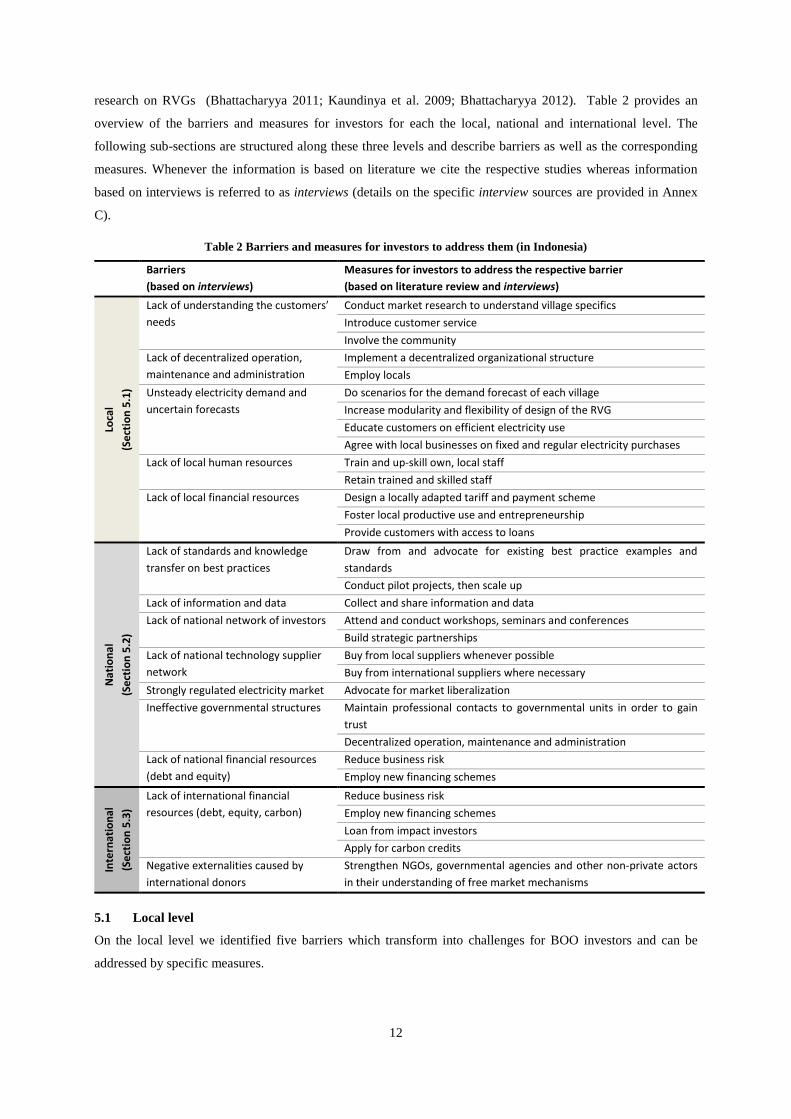
research on RVGs (Bhattacharyya 2011; Kaundinya et al. 2009; Bhattacharyya 2012). Table 2 provides an
overview of the barriers and measures for investors for each the local, national and international level. The
following sub-sections are structured along these three levels and describe barriers as well as the corresponding
measures. Whenever the information is based on literature we cite the respective studies whereas information
based on interviews is referred to as interviews (details on the specific interview sources are provided in Annex
C).
Table 2 Barriers and measures for investors to address them (in Indonesia)
Barriers (based on interviews)
Measures for investors to address the respective barrier (based on literature review and interviews)
Loca
l (S
ectio
n 5.
1)
Lack of understanding the customers’ needs
Conduct market research to understand village specifics Introduce customer service Involve the community
Lack of decentralized operation, maintenance and administration
Implement a decentralized organizational structure Employ locals
Unsteady electricity demand and uncertain forecasts
Do scenarios for the demand forecast of each village Increase modularity and flexibility of design of the RVG Educate customers on efficient electricity use Agree with local businesses on fixed and regular electricity purchases
Lack of local human resources Train and up-skill own, local staff Retain trained and skilled staff
Lack of local financial resources Design a locally adapted tariff and payment scheme Foster local productive use and entrepreneurship Provide customers with access to loans
Nat
iona
l (S
ectio
n 5.
2)
Lack of standards and knowledge transfer on best practices
Draw from and advocate for existing best practice examples and standards Conduct pilot projects, then scale up
Lack of information and data Collect and share information and data Lack of national network of investors Attend and conduct workshops, seminars and conferences
Build strategic partnerships Lack of national technology supplier network
Buy from local suppliers whenever possible Buy from international suppliers where necessary
Strongly regulated electricity market Advocate for market liberalization Ineffective governmental structures Maintain professional contacts to governmental units in order to gain
trust Decentralized operation, maintenance and administration
Lack of national financial resources (debt and equity)
Reduce business risk Employ new financing schemes
Inte
rnat
iona
l (S
ectio
n 5.
3)
Lack of international financial resources (debt, equity, carbon)
Reduce business risk Employ new financing schemes Loan from impact investors Apply for carbon credits
Negative externalities caused by international donors
Strengthen NGOs, governmental agencies and other non-private actors in their understanding of free market mechanisms
5.1 Local level
On the local level we identified five barriers which transform into challenges for BOO investors and can be
addressed by specific measures.
12
5.1.1 Lack of understanding the customers’ needs
In order to assure the sustained success of an RVG, projects ought to be seen rather as projects improving the
livelihood of villagers than as mere energy projects (Kumar et al. 2009; UNDP 2011). To this end, investors must
understand their investment context, including also user practices (Johnson 2013). In our interviews, Indonesian
practitioners stated that RVG projects often suffer from understanding the needs of their customers (Interviews),
i.e., the villagers who consume and pay for the produced electricity. Doing successful business requires knowing
these customers and their needs and designing products and services accordingly. BOO investors specifically face
the challenges of an "electricity is for free" mindset, difficulties in collecting electricity fees, avoiding electricity
theft, and sensitively handling their position as monopolists (Interviews). To address these challenges BOO
investors could start by conducting market research to understand village specifics (UNEP 2005; Roland &
Glania 2011; Sovacool et al. 2011b). Market research tools which are recommended for rural contexts are home
stays, field trips21, contacts with competitors and cooperation with local organizations. In a second step, customer
service can be introduced (De Vries et al. 2010; Bambawale et al. 2011; Gradl & Knobloch 2011; Roland &
Glania 2011; Sovacool et al. 2011a; Sovacool et al. 2011b; Bardouille et al. 2012). Such service consists of proper
maintenance services including product performance guarantees and warranties as well as regular visits in the
villages in order to collect feedback. Further, these activities can be supported by involving the community22
actively (Yadoo & Cruickshank 2010; Sovacool et al. 2011b; Interviews) also with a sensibility for the BOO
investor’s own position as monopolist. Concrete activities include stakeholder meetings (Bardouille et al. 2012;
Rickerson et al. 2012), in-kind support for villagers (Sovacool & Valentine 2011; Rickerson et al. 2012), co-
operation with existing income-generating organizations (e.g., coffee or rice farmers) (Aron et al. 2009), and
community ownership23 and management24 (Yadoo 2012; Aron et al. 2009; Glemarec 2012). Such community
activities are time-consuming, yet as experts from other NGOs state, a prerequisite for customer acceptance
(Alvial-Palavicino et al., 2011; Interviews).
5.1.2 Lack of decentralized operation, maintenance and administration
Typically Indonesian organizations (including rural electrification organizations) tend to implement centralized
structures with headquarters in Jakarta or other major cities. However, this is not the most effective structure in a
decentralized, rural context as local presence matters (see 5.1.1). BOO investors are consequently challenged by
long travel distances and complicated distribution channels (Interviews). Hence, practitioners are convinced that
21 However, the practitioner guide REEDToolkit (UNEP 2005) questions the quality of responses gathered during field trips. 22 While the village chiefs might be good entry points for investors, involving more villagers benefits feedbacks from users,
especially as the local governments’ capacity is often limited (Interviews). Additionally, the concept of user innovation (Von
Hippel 2005) might be considered in an RVG service context. 23 Perceived community ownership (or sometimes also referred to as cooperative approach) is more important than actual legal
ownership (Yadoo 2012). 24 Possible disadvantages of community-centered models can be the time intensity to establish the cooperative, as well as the
risk of technical and financial failure over time and the dependence on the community members (Glemarec 2012). Yadoo and
Cruickshank (2010) and Cook (2011) on the other side stress that operation and management costs are lower in cooperatives
and Palit and Chaurey (2011) explains that “due to equity, commitment and transparency” cooperatives are successful. They
also show that this holds in particular true if there is a productive use of electricity.
13
BOO investors would benefit from implementing a decentralized organizational structure (Interviews),
referring to small, independent and flexible units (Schmidt & Dabur 2013). When implementing such structure,
assuring a continuous knowledge flow between the sub-units is crucial to distribute learning by doing and using
(see 5.1.1). The decentralized structure is strengthened by employing locals, even if skilled labor is scarce
(compare 5.1.4). Concrete actions are, e.g., the training of own, local staff, sub-contracts with local business
partners (e.g. franchises) or cooperation with local organizations (Rickerson et al. 2012; Yadoo & Cruickshank
2010)25.
5.1.3 Unsteady electricity demand and uncertain forecasts
Our field studies revealed that due to the variety of villages across Indonesia with respect to population, prosperity,
cultural and social structure, the demand for rural electricity services can vary greatly26 (Interviews). This makes
it challenging for BOO investors to estimate electricity demand and future growth in demand levels. BOO investors
are therefore urged to take measures to understand the current demand and to perform demand forecast
scenarios. This involves a basic assessment of each village in the development phase of the RVG. The system is
then sized accordingly incorporating future extension of production capacities (Rickerson et al. 2012). The latter
is influenced by possible population and economic growth which can be reinforced by access to electricity (Roland
& Glania 2011). As it is “essential to introduce flexibility and scalability right in the planning phase” (Interview
with public sector representative), BOO investors can increase their flexibility in meeting a growing demand by
increasing the modularity and flexibility in the design of the RVG27. This allows integrating future capacity,
e.g., by adding power sources such as solar panels and integrating several RVGs into a smaller regional grid. In
practice, the creation of a smart (real time metering) flexible system increases the relevance and robustness of the
RVG (Dean et al. 2012; Bardouille et al. 2012; Rickerson et al. 2012; Bazilian et al. 2011). Educating customers
on efficient electricity use, is a supportive measure which helps to shape electricity demands (Yadoo &
Cruickshank 2010; Bazilian et al. 2011; Cook 2011; Glemarec 2012; Rickerson et al. 2012, Interviews). Finally,
arranging fix priced buy-off agreements with small local businesses28 (where possible) lowers insecurities in
the electricity forecasts (Bardouille et al. 2012).
25 The positive side effect of employing locals are the shared responsibilities for service and maintenance as well as independent
operations and management (Gradl & Knobloch 2011; Yadoo 2012; Dasappa et al. 2011). 26 The uncertainty stems – amongst others – from misuse, or overuse of electricity and unknown economic development of the
village. 27 Programs such as Paladin Live by Power Analytics help to plan adjustments in the system size. This particular program
shows the capacity, availability and reliability of a RVG by analyzing real time data (Dean et al. 2012). 28 Including base-load customers like mobile telephone companies (powering their towers) might decrease the relative load
variability, however, system costs might raise strongly, especially in case of solar-powered RVGs, where the battery capacity
needs to be increased to cover consumption during the night.
14
5.1.4 Lack of skilled local human resources
While in 2008 the average Indonesian adult illiteracy rate was at 7.8% (UNESCO 2009), this rate is much higher
in rural areas where RVGs are implemented29. Consequently the lack of skilled (and motivated) local human
resources in rural Indonesia to build, operate and manage RVG power plants30 represents a major barrier
(Interviews) and BOO investors cope with the challenge of identifying and employing skilled local staff. In a first
step they therefore employ, train and up-skill own, local staff (Bardouille et al. 2012; Yadoo 2012) and possibly
also cooperate with local micro and small enterprises in order to enhance technology transfer and ensure long-term
maintenance (Aron et al. 2009; Feibel 2010; Roland & Glania 2011; Rickerson et al. 2012; Interviews). Public
financial resources sourced from international organizations, NGOs and the government can be invested to create
a supporting "capacity building unit". Training tools, cooperation with local academic institutions (Rickerson et
al. 2012) or peer-to-peer trainings (De Vries et al. 2010) have proven successful in practice. In a second step, the
trained and skilled staff has to be retained, which can be fostered through fair salaries (Interviews), potentially
also performance-dependent salaries (Roland & Glania 2011) or additional benefits such as health insurance or
housing programs.
5.1.5 Lack of local finance
Finally, in rural Indonesia the villagers lack financial resources (Interviews). On the one hand, villagers have low
income levels; on the other hand a banking system providing loans to rural locals is absent (Monroy & Hernandez
2005) and as an interviewee from the private sector states “The villagers won’t be able to get funding and realize
a RVG project on their own. Typically they’d have to turn to some sort of institution” (Interview with private
sector representative). BOO investors have the challenging task to implement a business approach that targets
poor customers (also referred to as an inclusive business approach). Only if energy access is affordable, rural
electrification of the poor is sustainable (UNDP 2011). In the case of RVGs such an approach can be threefold; (a)
A locally adapted tariff and payment scheme starts with the determination of the tariff31. Such a tariff results
from balancing commercial viability and the consumer’s WTP (Roland & Glania 2011; Interviews) while
considering levels of demand and supply (Rickerson et al. 2012). Furthermore, the payment has to be organized
29 A report by the Indonesian Ministry of Education and Culture (2012) states the following illiteracy rates for Tenggara: 10-
16%; West Sulawesi: 10%; and Papua: 36%. All three regions have rural electrification rates below 60% (compare Figure 2). 30 An analysis by the IFC (Bardouille et al. 2012, p.92) found that “skills development and capacity building are not major
concerns for most small power providers” of diesel powered village grids, however that RVGs “require higher levels of
technical sophistication to operate smoothly”. We are not aware of any government program which systematically trains
villagers as village grid technicians. 31 Proven tariff schemes (mainly based on Roland and Glania 2011) are the “graded electricity tariff system” where tariffs are
based on pre-determined capacities, “electricity-based tariffs” where electricity meters in households monitor the use of
electricity and consumers pay per kWh, “pre-paid mechanisms” where customers pay in advance for a certain amount of
electricity and a load limiter then regulates the access to electricity, or “demand regulating tariff schemes” where tariffs react
to electricity production (Rickerson et al. 2012). Ideally also future maintenance cost is included in the tariffs (Aron et al.
2009).
15
in an efficient way for customers and the BOO investor32 (Bardouille et al. 2012; Gradl & Knobloch 2011). For
tariffs as well as for actual payments, BOO investors will profit from incorporating the villagers’ preferences as
well as from ensuring clear definitions and high transparency (Roland & Glania 2011; Interviews). (b) In the long
run, private investors in RVGs also benefit from fostering local productive use and entrepreneurship (Monroy
& Hernandez 2005), because with the economic development of the village the customers’ purchasing power
increases and results in a higher likelihood of sustained future cash flows (Roland & Glania 2011; Bardouille et
al. 2012; Aron et al. 2009). Concrete actions that foster productive use and entrepreneurship are e.g. business
incubation services (Bellanca & Wilson 2012), entrepreneurial trainings (Yadoo 2012) and encouraged trade
between villages. Besides capacity building, “soft aid” can be provided, such as technical and agricultural
equipment at low-cost, e.g., machinery for agro-processing, seeds and live-stock (Aron et al. 2009; Gradl &
Knobloch 2011; Interviews). Also investments in complementary infrastructures such as roads and the
communication system support entrepreneurial efforts and trade (Yadoo 2012). (c) BOO investors can provide
their customers with access to loans (Glemarec 2012; Monroy & Hernandez 2005) for production equipment
powered by electricity. As besides equipment, villagers with entrepreneurial intentions33 often require training and
loans. Common ways to provide villagers with this access to finance are via cooperation with local micro-finance
institutions and/or local commercial banks, e.g., the Indonesian Bank Perkreditan Rakyat or People’s Development
Bank (DB Climate Change Advisors 2011), or by integrating micro-finance into the BOO investors’ own business
model and offering tailored financial vehicles to local entrepreneurs34. However, such investors currently have few
RVGs in their lending portfolios as they prefer more small scale electrification options (such as solar home systems
or solar lantern businesses) or grid extension due to these concepts’ lower complexity and hence lower investment
risks (Interviews).
5.2 National level
On the national level we identified seven barriers which BOO investors should address.
5.2.1 Lack of standards and knowledge on best practices
Despite the more than 900 RVG projects and pilots across Indonesia, there is still a lack of standards, certification
and knowledge transfer on the best practices of management and operation (Interviews). In order to close this gap,
BOO investors can heavily draw from and advocate for existing best practices and standards35 (Roland &
Glania, 2011; Interviews), while ensuring that own best practices and standards are advocated through
publications, conferences and seminars. Own attempts are leveraged by cooperating with peer public and private
32 The following factors are at discussion in this matter; the occurrence (monthly, weekly, with harvest), the kind of payment
(cash, “in kind”), and the collection (trained villagers, mobile payment, prepaid payment, leasing of electricity appliances)
(Yumkella et al. 2010; Roland & Glania 2011; Bardouille et al. 2012; Bellanca & Wilson, 2012; Glemarec 2012; Interviews) 33 Lemaire (2011) shows the example of solar home systems that access micro credits to support the creation of a dynamic self-
sustained market for rural electrification through renewable energy. 34 Most beneficial for villagers would be access to loans at lower than usual interest rates (Van Mansvelt 2011). 35 IEC (International Electrotechnical Commission) Technical Specification Series 62257 provides, amongst others, useful
standards for village grids (Roland & Glania 2011).
16
stakeholders. The development of own best practices eventually emerges from conducting robust pilot projects
and scaling them up without too much deviation (Drewienkiewicz 2005; Feibel 2010; Interviews).
5.2.2 Lack of information and data
In Indonesia, as well as in many other non-OECD countries, there is often a lack of reliable data on natural
resources (water flow in rivers, wind strengths, irradiation, and rain fall), population and infrastructure in rural
areas (Interviews). BOO investors have to close this information gap by own means in order to be able to e.g.
identify villages which could be promising business cases. Activities include the collection and sharing of
information and data, which involves own investigations in villages, accessing and improving existing data bases
(such as e.g. Aviation and Aerospace Acency Indonesia 2012; Bureau of Statistics Indonesia 2012; Energypedia
2012), and sharing and distributing data through partners such as universities and national research institutes
(Interviews).
5.2.3 Lack of national network of investors
Despite efforts by the Indonesian Ministry of Energy to synchronize RVG projects, there is currently only little
coordination ongoing between different organizations and projects (Interviews). This testifies to the absence of
national networks. Often, this results in stand-alone projects and few spillovers of knowledge and experience.
BOO investors can act as stimulants in the creation of such networks. They can attend and conduct workshops,
seminars and conferences in order to get in touch with public and private organizations within and outside of
Indonesia (Interviews). Furthermore, they can invest in strategic partnerships with private and public actors
(UNEP 2005), e.g., through collaboration in market analysis, project implementation, financing or through formal
long-term contracts with contractors and suppliers.
5.2.4 Lack of national technology supplier network
Even if Indonesia managed to increase general production levels, this holds only partly true for the technological
components of a RVGs; locally produced micro hydro turbines do exist, but barely any solar photovoltaic panels,
switch gears and control panels. This results in a limited local technology supplier network as most suppliers are
from outside Indonesia (Interviews). The consequences are not so much higher cost – Indonesia has enacted a
VAT and duty exemption for renewable energy core components (The Pew Charitable Trusts 2011) - but long
delivery times for parts for repair or capacity extension. BOO investors face the trade-off of choosing from the
limited selection of Indonesian suppliers (if at all available), accepting longer delivery times (and thus potentially
longer outages), or having higher stocks which involves fixed capital). The recommended approach is to buy from
local suppliers if possible (Interviews) and with this contribute to the extension of a national technology supplier
network. This will keep the investor’s fixed capital low and reduce delivery times for spare parts. If local suppliers
are absent, buy from international suppliers, while considering stocking up with the most important spare parts
(Interviews). This reduces dependence on international delivery times while keeping fixed capital limited.
5.2.5 Strongly regulated electricity market
The Indonesian electricity market is strongly regulated (Interviews, see also Section 2) resulting in fixed sales
tariffs including heavy fuel and electricity subsidies (see e.g. Blum et al. 2013) and in PLN’s dominance over IPPs
17
and cooperatives in terms of power production. The latter is likely to change due to the opening of the power
market since 2009. However, this partly liberalized market still limits BOO investors’ freedom of action and lacks
incentives for private investments. Measures as advocating for market liberalization can be undertaken
(Interviews). However, such efforts are challenging and resource intensive (see Section 6 for policy
recommendations).
5.2.6 Ineffective governmental structures
Practitioners observe that “there are 36 Ministries in Indonesia, several of them have rural electrification programs,
yet still there is little cooperation” (Interview with a development agency representative). Due to the large number
of national Indonesian governmental entities involved in rural electrification (going far beyond the Ministry of
Energy and Resources or rural development), there are often overlapping functionalities and a lack of
transparency36. The role of regional governmental entities is rather marginal (compare also Figure 1). Furthermore,
existing national regulations, and support schemes for rural electrification and renewable energy are not fully
implemented yet. BOO investors can only indirectly address these facts by maintaining professional contacts to
regional governmental units in order to gain trust and to leverage the units’ importance (Interviews). Finally,
this could incentivize the national government to implement a more decentralized, flexible approach. Additionally,
BOO investors benefit from decentralized operation, maintenance and administration (compare section 5.1.2),
e.g. by employing locals who are familiar with the governmental structure and by implementing an organizational
structure which combines strong central offices in main cities with decentralized, flexible branches in order to
cope with the governmental structure (Interviews).
5.2.7 Lack of national financial resources (equity and debt)
Similar to the very scarce financial resources at local level, there is also a lack of equity sponsors and Indonesian
banks that provide capital at reasonable financing cost (for international equity and debt sponsors see 5.3.1) (Aron
et al. 2009; Interviews). The most important measure that BOO investors can undertake in this regard is to reduce
business risks. Common actions which reduce these risks are cost-effective choices of technologies37 (UNEP
2005; Bardouille et al. 2012; Rickerson et al. 2012; Interviews), management and operation models, the bundling
of projects in order to increase the market size and with this the attractiveness of investments (Roland & Glania
2011), the provision of guarantees for debt and equity investors (such as first loss risk guarantees, loan guarantees)
if existent38 (Bellanca & Wilson 2012; Roland & Glania 2011), and finally a sound business plan (UNEP 2005).
Further, BOO investors can employ new financing schemes (Aron et al., 2009; Chaurey et al. 2012; Glemarec
2012; Rickerson et al. 2012; Interviews) such as combined loan equity schemes where e.g. soft loans from private
investors are combined with community equity or public-private loan schemes where loans are partially provided
by private actors and partially by public actors such as a development agency or the government (such undertakings
36 Also more generally (i.e., independent from RVGs), Indonesia’s institutional structures are hampering private sector engagement. This is for instance reflected by Indonesia’s rank in the Ease of Doing Business Ranking - 128 out of 185 - (The World Bank 2013) and in the Corruption Perceptions Index (Transparency International 2013) – 118 out of 174. 37 The village grid modeling software HOMER (Hybridization Optimization Model for Electric Renewables) identifies the
most cost effective option for RVGs (Dean et al. 2012). 38 While single RVGs might not be able to access such financial instruments due to scale and transaction cost issues, the
bundling of projects might open-up such access.
18
are also called Private Public Partnerships39). In our interviews, a non-profit sector representative stated: “Through
the establishment of collateral (i.e., register a company for the single RVG) we demonstrate to the private investor
the potential of a stable return. This becomes sort of a mini IPP scheme” (Interview with non-profit sector
representative).
5.3 International level
On the international level we identified two major barriers, which transform into challenges for BOO investors
and can be addressed by specific measures.
5.3.1 Lack of international financial resources (debt, equity, carbon)
As financial resources on the local and national level are tight, BOO investors try to tap international resources.
However, there is also a lack on the international level which again hits BOO investors in their struggle for funding
(Interviews). It requires keeping up with international standards and involves higher transaction costs as well as
currency challenges as equity and debt are usually provided in USD or EUR and not in the Indonesian currency
IDR. The measures introduced in Section 5.2.7 (reducing business risks and employing new financing schemes)
are applicable, however can be extended by two additional measures: Besides from commercial banks, BOO
investors can lend from impact investors which accept higher risks at lower rates of return (Bellanca & Wilson
2012; Interviews). However, impact investors’ due diligences can be slow and more laborious as they cannot rely
on standard financial assessments alone, but also collect data on e.g., social and environmental impacts (Yadoo
2012). Also their budget is limited compared to that of commercial banks. Concerning the measure of applying
for carbon credits (Glemarec 2012); even if today there already existed a tailored carbon market product which
would fit the requirements of RVGs, e.g., the Clean Development Mechanism (CDM) or its Programme of
Activities (PoA), applying for carbon credits has drawbacks. They have a low financial potential as shown in
Section 3 and the transaction costs for participating in carbon markets are high (Michaelowa et al. 2003;
Michaelowa & Jotzo 2005; Ascui et al. 2007; Schneider et al. 2010). However if the CDM/PoA are understood as
a quality insurance they potentially could lower business risks and help accessing equity and loans40.
5.3.2 Disturbing international donor influence
It occurs that Indonesian private and public actors perceive international involvement as disruptive to national and
local efforts in rural electrification, especially when it hinders the development of a private market (Interviews).
First, one can observe that international donor organizations that consult Indonesian policy makers often follow
their own agenda and miss out on coordinating their efforts with other international and national actors
(Interviews). Furthermore, international donor organizations compete on the Indonesian job market for the most
skilled and trained employees (international and Indonesian ones). In this struggle for labor, international donor
organizations typically attract the best employees as they pay high salaries. In a labor market with a limited number
of skilled labors, this results in a lack of skilled employees for the private and the local public sectors (Interviews).
39 An even more focused variation of the Private Public Partnership is the Pro-Poor Public Private Partnership where the
villagers are considered as consumers that receive benefits while at the same time being partners for business ventures. 40 We regard it as rather speculative whether RVGs in Indonesia might profit from future additional climate finance (e.g.,
provided by the Green Climate Fund).
19
Reacting to such a market environment involves dialogue with international donor organizations in order to
strengthen their understanding of free market practices and their importance for sustainable development
(Bellanca & Wilson 2012).
6 Discussion: The role of government in attracting private investment
Our results in Sections 4 and 5 have shown that RVGs in Indonesia can potentially be an interesting business case
for private investors if managed well. However, the findings also reveal that the investors’ room for maneuvering
is limited. In order to increase the diffusion rate, the investment environment and hence the risk/return profiles of
RVGs need to be further improved via government action (see also Roland & Glania 2011). In Indonesia with its
centralistic governmental organization (compare Section 2), such action has to mainly come from national
regulatory institutions. Two topics seem to be most important: subsidy re-distribution (compare Section 4); and
improving the investment environment through public action (compare Section 5).
Currently fossil fuel and other (non-renewable) energy subsidies in Indonesia are amongst the highest in non-
OECD countries (Braithwaite et al. 2012; Mourougane 2010; Haeni et al. 2008). Due to the increasing pressure of
these subsidies on public budgets and their negative effects in encouraging energy efficiency, the government is
currently in the process of implementing subsidy reforms. However, reductions and abolition of subsidies in
Indonesia is a very sensitive topic and tied politically as phasing out subsidies can have negative social effects,
especially for the poor (Braithwaite et al. 2012; Mourougane 2010). For example, in 2012 “plans to raise subsidized
fuel prices […] failed to get the majority in the voting for approval from House of Representatives” (Permana et
al. 2012, p.21) . The situation might be different when re-distributing subsidies from fossil fuels to renewable
energy (DB Climate Change Advisors 2011). Subsidy shifts towards RVGs leverage private investments into rural
electrification. It is hence the poorest communities – those without electricity – that would profit most. So the
rationale of subsidies (to support the livelihood of the poor) would be upheld while removing their negative
environmental side effects.
The results shown in Figure 4 (Section 4) highlight that per unit of electricity delivered especially by micro hydro
projects only needs a small fraction of the subsidies, which are currently embodied in diesel based off-grid
electricity generation. This is – to a lesser extent and depending on location – also often valid for solar PV/battery
powered RVGs. Therefore, for RVGs to replace the standard option (diesel powered village grids), not all subsidies
that would be embodied in diesel based electricity generation would have to be re-distributed fully. Hence, through
subsidy re-distribution public money could be saved and in fact these savings could increase over time. Assuming
increasing global fossil fuel prices, diesel subsidies would have to be increased over time in order to keep end-
consumer prices in Indonesia relatively stable. At the same time, due to falling technology costs, especially in the
case of solar PV/battery powered RVGs (Peters et al. 2011; ESMAP 2007; IRENA 2012), the re-distributed
subsidies of future projects will have to be much lower; similar to a subsidy phase-out over time. Subsidy reform
20
could also help to terminate the misperception that diesel powered village grids exhibit lower costs than RVGs41
(Blum et al. 2013).
From a climate perspective, as diesel generators can be regarded as the business-as-usual solution for rural
electrification in Indonesia (Haeni et al. 2008), a re-distribution of subsidies from fossil fuels to renewable off-
grid technologies would substantially reduce the baseline emissions from rural electricity generation in Indonesia.
In a recent article, Schmidt and colleagues (2012) argue that subsidy phase-out could be an integrated part of
Nationally Appropriate Mitigation Actions42 (NAMAs) and should be encouraged through future climate finance
schemes. Along the same line, we argue that subsidy re-distributions could potentially be credited as unilateral
contribution to climate finance. Note that in order to assure efficiency of public spending, re-distributed subsidies
should be paid based on the performance of a project instead of solely providing grants for equipment upfront
(Ghosh et al. 2012). Furthermore, subsidies should only be one part of the revenue streams for private investors.
Local payments for energy should especially be an integral part of the RVG business models. Finally, over-
subsidization should be avoided (compare e.g., Hoppmann et al. 2013 for some negative impacts of over-
subsidization in developed countries).
While our paper is focused on RVGs in Indonesia, the above thoughts also generally hold true for most off-grid
technologies for other non-OECD countries, with low electrification rates, large decentralized renewable energy
potentials and high subsidies for fossil-based electricity generation.
The second aspect where government action is required concerns improving the investment environment apart
from a fuel subsidy reform. Our analysis (Section 5) shows that a whole array of barriers (translating into risks)
stands in the way of private investments. While BOO investors can address many barriers via their business models
(mainly those on the local level), others (mainly on the national level) go beyond their sphere of influence. Many
of these barriers can translate into investment risks – scaring off investors and/or increasing financing costs. As
the risk/return profile of projects must be attractive for investors and in the current situation RVG investments in
Indonesia underlie high risks, only few investors with large risk appetite can be attracted (explaining the very low
diffusion rate of privately financed RVGs).
Two recent UNDP studies (Glemarec et al. 2012; Waissbein et al. 2013) show that improving the investment
environment by reducing the investment risks can attract new private investments and lead to lower financing costs
and thereby substantially lower electricity generation costs. While these studies focus on on-grid renewable energy,
we assume this is generally also the case for RVGs, as they are typically also based on a project finance structure,
and therefore discuss them in light of our results43. The UNDP defines two ways of de-risking renewable energy
investments: financial instruments (e.g., guarantees or risk insurance) and policy instruments (e.g., technology
41 Widely spread in Indonesia as an interviewee confirmed “Rural Electrification through renewable energy has two problems:
People can’t afford it and the government can’t afford to provide it” (Interview). 42 NAMAs are a key element of the in international climate negotiations and describe “sets of policies and actions tailored to
the circumstances of individual countries that they agree to undertake as part of their commitment to reduce emissions.” (Höhne
2011, p.32; Michaelowa et al. 2012). 43 We are aware that the risk categories partly differ between on-grid and RVG projects, e.g., due to different stakeholders
involved. However, our discussion refers to the general line of thought that de-risking is essential for project-finance-based
private investment.
21
standards or improved energy legislation). While the former mitigates the financial impact in case of a negative
event affecting the project, the latter reduces or entirely removes the barriers that underlie the risks and thereby
reduces the probability of a negative event occurring. Using the example of on-shore grid connected wind energy,
their study shows that both financial and policy de-risking is effective and efficient.
In case of RVGs, the economic efficiency of financial instruments – if they are available at all – is more
questionable; due to the small project scales of RVGs and the high transaction costs, these instruments can be
expected to be very costly on a per kW basis. A solution to this might be the bundling of projects (e.g., through
the CDM’s PoA) so that the scale (e.g., in terms of kW) is increased and the impact of the transaction costs reduced
at least to some extent. Together with the typically higher cost of financial instruments (compare Waissbein et al.
2013) this lack of micro-financial de-risking instruments and lower efficiency means that the role of policy
instruments gets even more important in the case of RVGs. Other than for financial instruments, the economic
efficiency of policy instruments is much less correlated with the individual project size but rather with the size of
total investment that occurs on the national (in case of national policy instruments) or regional level (in case of
sub-national instruments). Therefore, policy instruments to improve the investment environment should primarily
act on the national/regional level, similarly as Waissbein et al. (2013) argue in the case of on-grid renewable
energy. From our findings in Section 5 and reflecting upon insights from Glemarec et al. (2012) and Waissbein et
al. (2013) the following four policy actions seem most effective in order to improve the investment environment
for RVGs and thus reduce some predominant risks:
1. Energy market risk: Conduct a reform of the national renewable energy and electrification policies in
order to align them. Part of this reform should be the effectively improved market access for private
BOO investors and a re-distribution of subsidies (see above).
2. Institutional/licensing risk: Reduce overlapping functionalities and partly diverging programs of
government bodies and agencies. Similarly to Waissbein et al. (2013) a “one-stop-shop” for RVGs
could be created and equipped with the necessary executive competences. Such a RVG body could also
be responsible for collecting and exchanging data (e.g., on renewable energy potentials, technologies or
suppliers).
3. Technology risk: Introduce technology standards for RVGs so that suppliers, BOO investors and end-
consumers have a good basis for their contracts and so that transaction costs are reduced (see also
Roland & Glania 2011).
4. Financial risk: To improve the access to finance, the newly founded Indonesian Climate Change Trust
Fund (ICCTF) could prioritize the support of RVGs. Special small scale finance vehicles for BOO
investors could be designed and offered (see Section 5.1.5).
While this is just a very short list, further action could improve the investment environment and thereby leverage
the diffusion of RVGs. Very important in this regard is educating investors (meaning both debt and equity
sponsors), as they are often not familiar with the investment opportunities in off-grid projects. Generally, investors
perceive projects in rural areas as riskier than projects in urban areas (Rickerson et al. 2012). By putting this risk
perception in perspective, private investors could become more interested in RVGs (Roland & Glania 2011). The
results on how to improve the investment environment for RVGs are country specific. In order to formulate policy
recommendations for other countries, we regard a barrier analysis for that country as indispensable.
22
All the proposals discussed in this section promise to substantially increase the attractiveness of RVGs for private
investors. However, we are fully aware that implementing these proposals would not be easy. The role of the
political economy is pervasive when it comes to such reform projects, but discussing its role would go far beyond
our research and the scope of this paper.
7 Conclusion
In this paper we ask how the risk/return profile of RVGs can be improved in order to attract private investments.
First, we focus on the return aspect and identify potential local, national and international revenue streams for
RVGs and compare them to costs. The analysis shows that potential local and national revenue streams are able to
cover costs and therefore build the base for a profitable business case, at least in case of micro hydro powered
village grids. While local revenue estimates are based on the WTP for electricity, national revenues are based on
potentially re-distributed subsidies, both revenue streams are substantial. The role of international revenues in the
form of climate credits turns out to be limited. Second, in order to understand the risk aspect, the paper analyzes
investment barriers on a local, national and an international level and matches them with measures that BOO
investors can take to remove the barriers. We find a wide range of measures for investors; however, we argue that
BOO investors cannot solve the low diffusion of RVGs by themselves and that policy reforms are needed. The
two most important governmental activities in this regard include the re-distribution of fossil fuel subsidies towards
RVGs and public de-risking measures such as reforming the national renewable and electrification policies,
reducing overlapping functionalities, introducing technology standards for RVGs, and improving access to
finance.
Acknowledgements
We want to thank V. H. Hoffmann for providing us with the opportunity to carry out this research. We gratefully
acknowledge the support of our interview partners in Indonesia, Cambodia and Lao PDR, as well as for the support
provided by the Mercator Foundation Switzerland, the Swiss Study Foundation and the German Gesellschaft für
Internationale Zusammenarbeit (GIZ). Finally we thank our language editor Justin Strauss.
23
References
Abraham, K., Phadke, H., Riaz M. & Strahl, J., 2012. REwiRE: Rural Electrification with Renewable Energy Meet the REwiRE team. Presentation.
Alvial-Palavicino, C. , Garrido-Echeverría, N., Jiménez-Estévez, G., Reyes, L. & Palma-Behnke, R., 2011. A methodology for community engagement in the introduction of renewable based smart microgrid. Energy for Sustainable Development, 15(3), pp.314–323.
Anon, The Gold Standard - official website. Available at: http://www.cdmgoldstandard.org [Accessed October 25, 2012].
Aron, J.-E. , Kayser, O., Liautaud, L. & Nowlan, A., 2009. Access to Energy for the Base of the Pyramid, Hystra and Ashoka. Paris, France and Washington D.C., USA.
Ascui, F., Kaiser, M., Austin, M. & Helfferich, V., 2007. Guidebook to Financing CDM Projects, UNEP (United Nations Environment Programme), Riso and EcoSecurities. Roskilde, Denmark.
Asia Sustainable and Alternative Energy Program, 2005. Indonesia. Available at: http://web.worldbank.org/WBSITE/EXTERNAL/COUNTRIES/EASTASIAPACIFICEXT/EXTEAPASTAE/0,,contentMDK:21042053~menuPK:2900515~pagePK:64168445~piPK:64168309~theSitePK:2822888,00.html [Accessed October 25, 2012].
Aviation and Aerospace Acency Indonesia, 2013. Lembaga Penerbangan dan Antariksa. Available at: http://www.lapan.go.id/ [Accessed January 3, 2013].
Bambawale, M.J., D’Agostino, A.L. & Sovacool, B.K., 2011. Realizing rural electrification in Southeast Asia: Lessons from Laos. Energy for Sustainable Development, 15(1), pp.41–48.
Bardouille, P., Avato, P., Levin, J., Pantelias, A. & Engelmann-Pilger, H., 2012. From Gap to Opportunity : Business Models for Scaling Up Energy Access, International Finance Corporation (IFC). Washington D.C., USA.
Bazilian, M , Hobbs, B. F., Blyth, W., MacGill, I. & Howells, M., 2011. Interactions between energy security and climate change: A focus on developing countries. Energy Policy, 39(6), pp.3750–3756.
Beck, F. & Martinot, E., 2004. Renewable Energy Policies and Barriers. Encyclopedia of Energy, pp.1–22.
Bellanca, R. & Wilson, E., 2012. Sustainable Energy for All and the private sector, International Institute for Environment and Development (IEED). London, UK.
Bhattacharyya, S.C., 2011. Special issue on Off-grid electrification in developing countries. Energy for Sustainable Development, 15(3), pp.201–202.
Bhattacharyya, S.C., 2012. Review of alternative methodologies for analysing off-grid electricity supply. Renewable and Sustainable Energy Reviews, 16(1), pp.677–694.
Blum, N.U., Sryantoro Wakeling, R. & Schmidt, T.S., 2013. Rural electrification through village grids - Assessing the cost competitiveness of isolated renewable energy technologies in Indonesia. Renewable and Sustainable Energy Reviews, 22, pp.482–496.
Boedoyo, M.S. & Sugiyono, A., 2010. Decentralized Power Generation in Indonesia: Current Issues and Prospects. Tech Monitor, May-Jun, pp.31–36.
Braithwaite, D. et al., 2012. Indonesia’s Fuel Subsidies: Action plan for reform, International Institute for Sustainable Development (IISD). Geneva, Switzerland.
Bureau of Statistics Indonesia, 2012. Badan Pusat Statistik. Available at: www.bps.go.id/ [Accessed January 3, 2013].
Chaurey, A., Krithika, P.R., Palit, D., Rakesh, S. & Sovacool, B.K., 2012. New partnerships and business models for facilitating energy access. Energy Policy, 47, pp.48–55.
24
Cook, P., 2011. Infrastructure, rural electrification and development. Energy for Sustainable Development, 15(3), pp.304–313.
Dasappa, S., Subbukrishna, D.N., Suresh, K.C., Paul, P.J. & Prabhu, G.S., 2011. Operational experience on a grid connected 100kWe biomass gasification power plant in Karnataka, India. Energy for Sustainable Development, 15(3), pp.231–239.
DB Climate Change Advisors, 2011. GET FiT Plus: De-Risking Clean Energy Business Models in a Developing Country Context, DB Climate Change Advisors, Deutsche Bank Group.
Dean, M., Jolly, N. & Trifonov, S., 2012. Microgrids : The BRICS Opportunity, Zpryme Research & Consulting.
Deichmann, U., Meisner, C., Murray, S. & Wheeler, D., 2011. The economics of renewable energy expansion in rural Sub-Saharan Africa. Energy Policy, 39(1), pp.215–227.
Differ Group, 2012. The Indonesian electricity system - a brief overview, Oslo, Norway.
Drewienkiewicz, R., 2005. GVEP / UNDP Documentation and Analysis Of Business Models within The E + Co Portfolio, Global Village Energy Partnership (GEVP) and United Nations Development Programme (UNDP).
Energypedia, 2013. Indonesia Country Situation. Available at: https://energypedia.info/index.php/Indonesia_Country_Situation [Accessed October 25, 2012].
ESMAP, 2008. Maximizing the Productive Uses of Electricity to Increase the Impact of Rural Electrification Programs, Energy Sector Management Assistance Program (ESMAP). Washington D.C., USA.
ESMAP, 2007. Technical and Economic Assessment of Off-grid , Mini-grid and Grid Electrification Technologies, Energy Sector Management Assistance Program (ESMAP). Washington D.C., USA.
Fattouh, B. & El-Katiri, L., 2012. Arab Human Development Report - Energy Subsidies in the Arab World, Oxford Institute for Energy Studies and United Nations Development Programme (UNDP), Oxford, UK.
Feibel, H., 2010. How micro hydro power systems implemented during ENDEV 1 are performing, entec AG and Deutsche Gesellschaft für Technische Zusammenarbeit (GTZ). St.Gallen, Switzerland.
Gallagher, K.S., Holdren, J.P. & Sagar, A.D., 2006. Energy-Technology Innovation. Annual Review of Environment and Resources, 31(1), pp.193–237.
Ghosh, A., Müller, B., Pizer, W. & Wagner, G., 2012. Mobilizing the Private Sector - Quantity-Performance Instruments for Public Climate Funds. Oxford Energy and Environment Brief, (August), pp.1–15.
Glemarec, Yannick, 2012. Financing off-grid sustainable energy access for the poor. Energy Policy, 47, pp.87–93.
Glemarec, Yannick, Rickerson, W. & Waissbein, Oliver, 2012. Transforming On-Grid Renewable Energy Markets: A review of UNDP-GEF Support for Feed-in Tariffs and Related Price and Market-Access Instruments, United Nations Development Programme (UNDP)/Global Environment Facility. New York, USA.
Gradl, C. & Knobloch, C., 2011. Energize the BoP! Energy Business Model Generator for Low-income Markets, endeva. Berlin, Germany.
Gunningham, N., 2013. Managing the energy trilemma: The case of Indonesia. Energy Policy, 54, pp.184–193.
Haeni, J.H., Green, C. & Setianto, E., 2008. Indonesia energy assessment, USAID, Washington, USA.
Von Hippel, E., 2005. Democratizing Innovation, Cambridge, Massachusetts; London, England: The MIT Press.
Höhne, N., 2011. Policy: Changing the rules. Nature Climate Change, 1(1), pp.31–33.
Holland, C.W. & Derbyshire, W., 2009. Electrifying 20 Million Households - An Indonesian Rural Electrification Strategy. In EEA Conference & Exhibition June 2009. Christchurch.
25
Hoppmann, J., Peters, M., Schneider, M. & Hoffmann, V.H., 2013. The two faces of market support—How deployment policies affect technological exploration and exploitation in the solar photovoltaic industry. Research Policy, 42(4), pp.989–1003.
IEA, 2010. World Energy Outlook 2010, Paris, France.
IIEC, 2006. Demand Side Management Best Practices Guidebook for Pacific Island Power Utilities, South Pacific Applied Geoscience Commission (SOPAC), United Nations Department of Economic and Social Affairs (UNDESA), and International Institute for Energy Conservation. Suva, Fiji Islands and New York, USA.
IISD, 2011. A Citizen’s Guide to Energy Subsidies in Indonesia, International Institute for Sustainable Development (IISD). Geneva, Switzerland.
IISD, 2013. Global Subsidies Initative. Available at: http://www.iisd.org/gsi/ [Accessed February 17, 2013].
International Electrotechnical Commission, Technical Specification Series 62257. Available at: http://www.iec.ch/index.html [Accessed March 1, 2013].
IRENA, 2012. Solar Photovoltaics, Abu Dhabi, United Arab Emirates.
Johnson, O., 2013. Universal Energy Access : Moving from Technological Fix to Poverty Reduction, Bonn, Germany.
Kanagawa, M. & Nakata, T., 2007. Analysis of the energy access improvement and its socio-economic impacts in rural areas of developing countries. Ecological Economics, 62(2), pp.319–329.
Kaundinya, D.P., Balachandra, P. & Ravindranath, N.H., 2009. Grid-connected versus stand-alone energy systems for decentralized power—A review of literature. Renewable and Sustainable Energy Reviews, 13(8), pp.2041–2050.
Komatsu, S., Kaneko, S., Shrestha, R.M. & Ghosh, P.P., 2011. Nonincome factors behind the purchase decisions of solar home systems in rural Bangladesh. Energy for Sustainable Development, 15(3), pp.284–292.
Kumar, A., Mohanty, P., Palit, D. & Chaurey, A., 2009. Approach for standardization of off-grid electrification projects. Renewable and Sustainable Energy Reviews, 13(8), pp.1946–1956.
Kusdiana, D., 2012. Indonesia: Renewable Energy polcies and regulation. Challenges in Incentivizing RE Development and Rural Electrification. Presentation.
Legros, G., Havet, I., Bruce, N. & Bonjour, S., 2009. The Energy Access Situation in Developing Countries - A Review Focusing on the Least Developed Countries and Sub-Saharan Africa, United Nations Development Programme (UNDP) and World Health Organization (WHO). New York, USA.
Lemaire, X., 2011. Off-grid electrification with solar home systems: The experience of a fee-for-service concession in South Africa. Energy for Sustainable Development, 15(3), pp.277–283.
Macharia, E., Gupta, G. & Tsan, M., 2010. Solar Lighting for the Base of the Pyramid - Overview of an Emerging Market, Dalberg Global Development Advisors, Lighting Africa, and International Finance Corporation (IFC).
Van Mansvelt, R., 2011. The solar roadmap for Cambodia - How to scale-up solar diffusion in Cambodia? Strategy formulated by stakeholders, Pico Sol Cambodia. Phnom Penh, Cambodia.
Martin, S., 2009. Generating income with renewable energy - preliminary lessons learnd from an innovative public - private partnership in Laos. Presentation.
Michaelowa, A., Dransfeld, B., Blodgett, C., Galante, A., Basu, A. & Eschmann, M., 2012. IRENA Handbook on Renewable Energy Nationally Appropriate Mitigation Actions (NAMAs) for Policy Makers and Project Developers, IRENA (International Renewable Energy Agency). Abu Dhabi, United Arab Emirates.
Michaelowa, A. & Jotzo, F., 2005. Transaction costs, institutional rigidities and the size of the clean development mechanism. Energy Policy, 33(4), pp.511–523.
26
Michaelowa, A., Stronzik, M., Eckermann, F. & Hunt, A., 2003. Transaction costs of the Kyoto mechanisms. Climate Policy, (3), pp.261–278.
Ministry of Energy & Mineral Resources of Indonesia, 2009. Harga Pembelian Tenaga Listrik oleh PT PLN dari Pembangkit Listrik Terbarukan Skala Kecil dan Menengah atau Kelebihan Tenaga Listrik. Jakarta, Indonesia.
Monroy, C. & Hernandez, A., 2005. Main issues concerning the financing and sustainability of electrification projects in rural areas: international survey results. Energy for Sustainable Development, 9(2), pp.17–25.
Mourougane, A., 2010. Phasing Out Energy Subsidies in Indonesia, OECD Economcis Department Working Papers, No. 808, OECD Publishing: Paris, France.
Nussbaumer, P., 2009. On the contribution of labelled Certified Emission Reductions to sustainable development: A multi-criteria evaluation of CDM projects. Energy Policy, 37(1), pp.91–101.
OECD/IEA, 2011. World Energy Outlook 2011 - Energy for all - Fiancing access for the poor, Special early excerpt of the World Energy outlook 2011. International Energy Acency (IEA). Paris, France.
Ölz, S. & Beerepoot, M., 2010. Deploying Renewables in Southeast Asia - Trends and potentials, International Energy Acency (IEA). Paris, France.
Palit, D. & Chaurey, A., 2011. Off-grid rural electrification experiences from South Asia: Status and best practices. Energy for Sustainable Development, 15(3), pp.266–276.
Permana, A.D., Sugiyono, A., Boedoyo, M.S. & Oktaufik, M.A.M., 2012. Outlook Energi Indonesia 2012, Badan Pengkajian dan Penerapan Teknologi (BPPT). Jakarta, Indonesia.
Peskett, L., 2011. The history of mini-grid development in developing countries. Policy briefing by GVEP, 3 Suppl 1(1119168), pp.143–6.
Peters, M., Schmidt, T.S., Wiederkehr, D. & Schneider, M., 2011. Shedding light on solar technologies—A techno-economic assessment and its policy implications. Energy Policy, 39(10), pp.6422–6439.
Phuangpornpitak, N. & Kumar, S., 2011. User acceptance of diesel/PV hybrid system in an island community. Renewable Energy, 36(1), pp.125–131.
Point Carbon, 2013. EU ETS eligible sCER price forecast. Available at: http://www.pointcarbon.com/research/promo/research/1.2009586?&ref=searchlist [Accessed January 4, 2013].
PT Perusahaan Listrik Negara, 2010. Going Through the 2008 Global Financial Crisis. Presentation.
Purra, M.M., 2009. The Indonesian Electricity Sector : Institutional Transition , Regulatory Capacity and Outcomes, National University of Singapore. Singapore.
Purwono, J., 2008. Harga Patokan Dalam Pembelian Tenaga Listrik Dari Pembangkit Tenanga Listrik Swasta. Presentation.
PWC, 2011. Electricity in Indonesia -Investment and Taxation Guide, PricewaterhouseCoopers (PWC). Jakarta, Indonesia.
Rickerson, W. et al., 2012. Renewable Energies for Remote Areas and Islands (REMOTE), (International Energy Agency-Renewable Energy Technology Deployment (IEA-RETD). Paris, France.
Rogger, C., Beaurain, F. & Schmidt, T.S., 2011. Composting projects under the Clean Development Mechanism: sustainable contribution to mitigate climate change. Waste management (New York, N.Y.), 31(1), pp.138–46.
Roland, S. & Glania, G., 2011. Hybrid mini-grids for rural electrification: Lessons learnt, Alliance for Rural Electrification (ARE)/USAID. Brussels, Belgium.
27
Saengprajak, A., 2006. Efficiency of Demand Side Management Measures in Small Village Electrification Systems. PhD Thesis at Kassel University.
Schäfer, M., Kebir, N. & Neumann, K., 2011. Research needs for meeting the challenge of decentralized energy supply in developing countries. Energy for Sustainable Development, 15(3), pp.324–329.
Schmidt, T.S., Born, R. & Schneider, M., 2012. Assessing the costs of photovoltaic and wind power in six developing countries. Nature Climate Change, 2, pp.548–553.
Schmidt, T.S. & Dabur, S., 2013. Explaining the diffusion of biogas in India – a new functional approach considering national borders and technology transfer. Environmental Economics & Policy Studies, (available online).
Schneider, M., Schmidt, T.S. & Hoffmann, V.H., 2010. Performance of renewable energy technologies under the CDM. Climate Policy, 10(1), pp.17–37.
Senoaji, 2008. Rencana dan Strategi PLN dalam Penyediaan PV. In Workshop Peran PV Dalam Penyediaan Energi Listrik di Indonesia. Workshop Peran PV Dalam Penyediaan Energi Listrik Di Indonesia. Presentation.
Sovacool, B.K., Bambawale, M.J., Gippner, O. & Dhakal, S., 2011. Electrification in the Mountain Kingdom: The implications of the Nepal Power Development Project (NPDP). Energy for Sustainable Development, 15(3), pp.254–265.
Sovacool, B.K., D’Agostino, A.L. & Bambawale, M.J., 2011. Gers gone wired: Lessons from the Renewable Energy and Rural Electricity Access Project (REAP) in Mongolia. Energy for Sustainable Development, 15(1), pp.32–40.
Sovacool, B.K. & Valentine, S. V., 2011. Bending bamboo: Restructuring rural electrification in Sarawak, Malaysia. Energy for Sustainable Development, 15(3), pp.240–253.
Takada, M. & Charles, N.A., 2007. Energizing Poverty Reduction - A Review of the Energy-Poverty Nexus in Poverty Reduction Strategy Papers, UNDP (United Nations Development Programme). New York, USA.
Terrado, E., Cabraal, A. & Mukherjee, I., 2008. Operational Guidance for World Bank Group Staff Designing Sustainable Off-Grid Rural Electrification Projects : Principles and Practices, The World Bank/The Energy and Mining Sector Board. Washington D.C., USA.
The CIA World Factbook, 2013. Indonesia’s Geography. Available at: https://www.cia.gov/library/publications/the-world-factbook/geos/id.html [Accessed February 11, 2013].
The Gold Standard Foundation, 2012. The Gold Standard Requirements Version 2.2, Geneva, Switzerland.
The Pew Charitable Trusts, 2011. Who’s Winning the Clean Energy Race?, Philiadelphia and Washington, D.C., USA.
The World Bank, 2013. Doing Business 2013 - Smarter Regulations for Small and Medium-Size Enterprises 10th ed., Washington, D.C., USA: World Bank Group.
Transparency International, 2013. Corruption Perceptions Index Ranking. Available at: http://www.transparency.org/cpi2012/results [Accessed February 27, 2013].
UN AGECC, 2010. Energy for a Sustainable Future: Summary Report and Recommendations, UN (United Nations)/The Secretary-General’s Advisory Group on Energy and Climate Change. New York, USA.
UNDP, 2011. Towards an “ Energy Plus ” Approach for the Poor, Bangkok, Thailand.
UNEP, 2012. Financing renewable energy in developing countries: Drivers and barriers for private finance in sub-Saharan Africa, Geneva, Switzerland.
UNEP, 2008. Reforming Energy Subsidies - Opportunities to Contribute to the Climate Change Agenda, United Nations Environment Programme (UNEP).
28
UNEP, 2005. REED Toolkit A Handbook for Energy Entrepreneurs, ed., UNEP (United Nations Environment Programme), UN Foundation and E+Co. Bloomfield, USA.
UNESCO, 2009. UNESCO Data Centre. Available at: http://stats.uis.unesco.org/unesco/TableViewer/document.aspx?ReportId=136&IF_Language=eng&BR_Topic=0 [Accessed December 19, 2012].
UNFCCC, 2010. Draft revision to the Guidelines on the Assessment of Investment Analysis (Version 04), United Nations Framework Convention on Climate Change (UNFCCC).
De Vries, M., Flink, T., Kauw, K., van der Vleuten, F. & Mulder, T., 2010. Business Models for Energy Access, ETC Foundation and Enabling Access to Sustainable Energy (EASE). Leusden, The Netherlands.
Waissbein, O., Glemarec, Y., Bayraktar, H. & Schmidt, T.S., 2013. Derisking Renewable Energy Investments, United Nations Development Programme (UNDP). New York, USA.
White, H., Blöndal, N., Rota, M. & Vajja, A., 2008. The Welfare Impact of Rural Electrification : A Reassessment of the Costs and Benefits, The World Bank and Independent Evaluation Group. Washington, D.C., USA.
Winoto, A.T., Marliska, E., D., Prasetyo, M. H. & Simangunsong, S., 2012. Rural Electrification in Indonesia Target and Development. Presentation.
Yadoo, A., 2012. Delivery Models for Decentralised Rural Electrification, iied; London, UK.
Yadoo, A. & Cruickshank, H., 2012. The role for low carbon electrification technologies in poverty reduction and climate change strategies: A focus on renewable energy mini-grids with case studies in Nepal, Peru and Kenya. Energy Policy, 42, pp.591–602.
Yadoo, A. & Cruickshank, H., 2010. The value of cooperatives in rural electrification. Energy Policy, 38(6), pp.2941–2947.
Yin, R.K., 2003. Case Study Research _ Design and Methods 3rd ed., Thousand Oaks, USA; London, UK; New Dehli, India: Sage Publications.
Zerriffi, H., 2011. Rural Electrification: Strategies for Distributed Generation, Springer: Dordrecht, Heidelberg, Germany; London, UK; New York, USA.
29
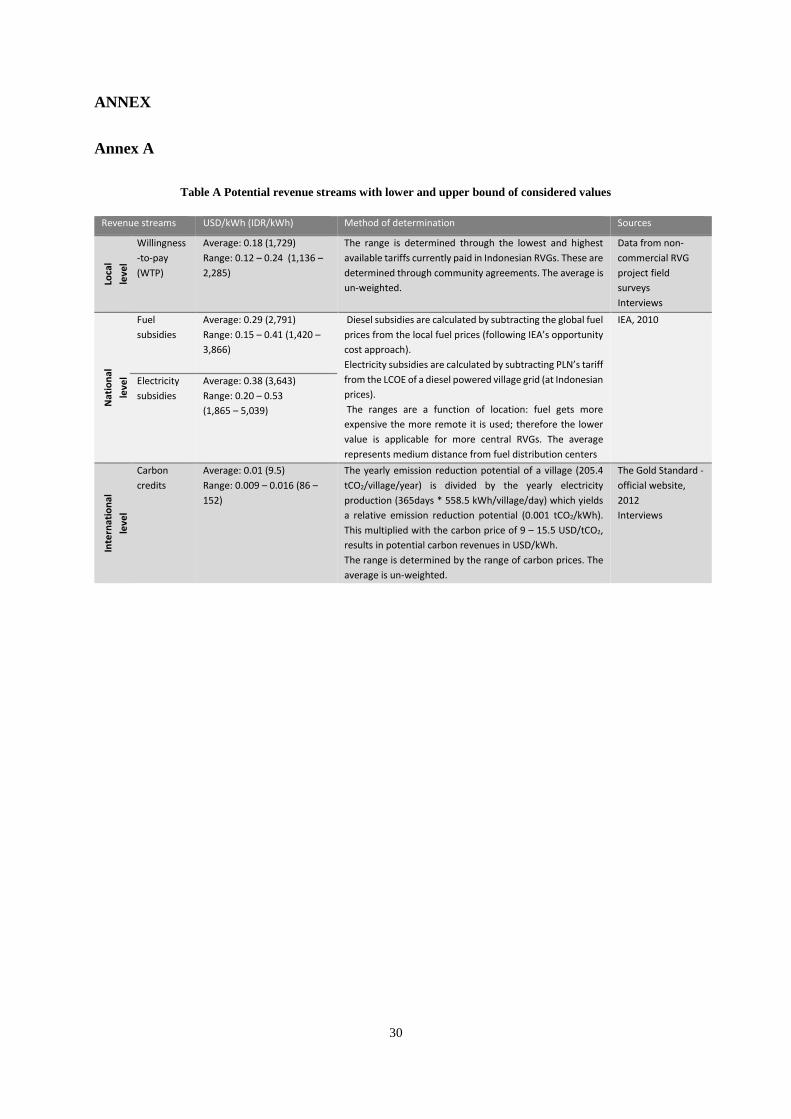
ANNEX
Annex A
Table A Potential revenue streams with lower and upper bound of considered values
Revenue streams USD/kWh (IDR/kWh) Method of determination Sources
Loca
l le
vel
Willingness-to-pay (WTP)
Average: 0.18 (1,729) Range: 0.12 – 0.24 (1,136 – 2,285)
The range is determined through the lowest and highest available tariffs currently paid in Indonesian RVGs. These are determined through community agreements. The average is un-weighted.
Data from non-commercial RVG project field surveys Interviews
Nat
iona
l le
vel
Fuel subsidies
Average: 0.29 (2,791) Range: 0.15 – 0.41 (1,420 – 3,866)
Diesel subsidies are calculated by subtracting the global fuel prices from the local fuel prices (following IEA’s opportunity cost approach). Electricity subsidies are calculated by subtracting PLN’s tariff from the LCOE of a diesel powered village grid (at Indonesian prices). The ranges are a function of location: fuel gets more expensive the more remote it is used; therefore the lower value is applicable for more central RVGs. The average represents medium distance from fuel distribution centers
IEA, 2010
Electricity subsidies
Average: 0.38 (3,643) Range: 0.20 – 0.53 (1,865 – 5,039)
Inte
rnat
iona
l le
vel
Carbon credits
Average: 0.01 (9.5) Range: 0.009 – 0.016 (86 – 152)
The yearly emission reduction potential of a village (205.4 tCO2/village/year) is divided by the yearly electricity production (365days * 558.5 kWh/village/day) which yields a relative emission reduction potential (0.001 tCO2/kWh). This multiplied with the carbon price of 9 – 15.5 USD/tCO2, results in potential carbon revenues in USD/kWh. The range is determined by the range of carbon prices. The average is un-weighted.
The Gold Standard - official website, 2012 Interviews
30
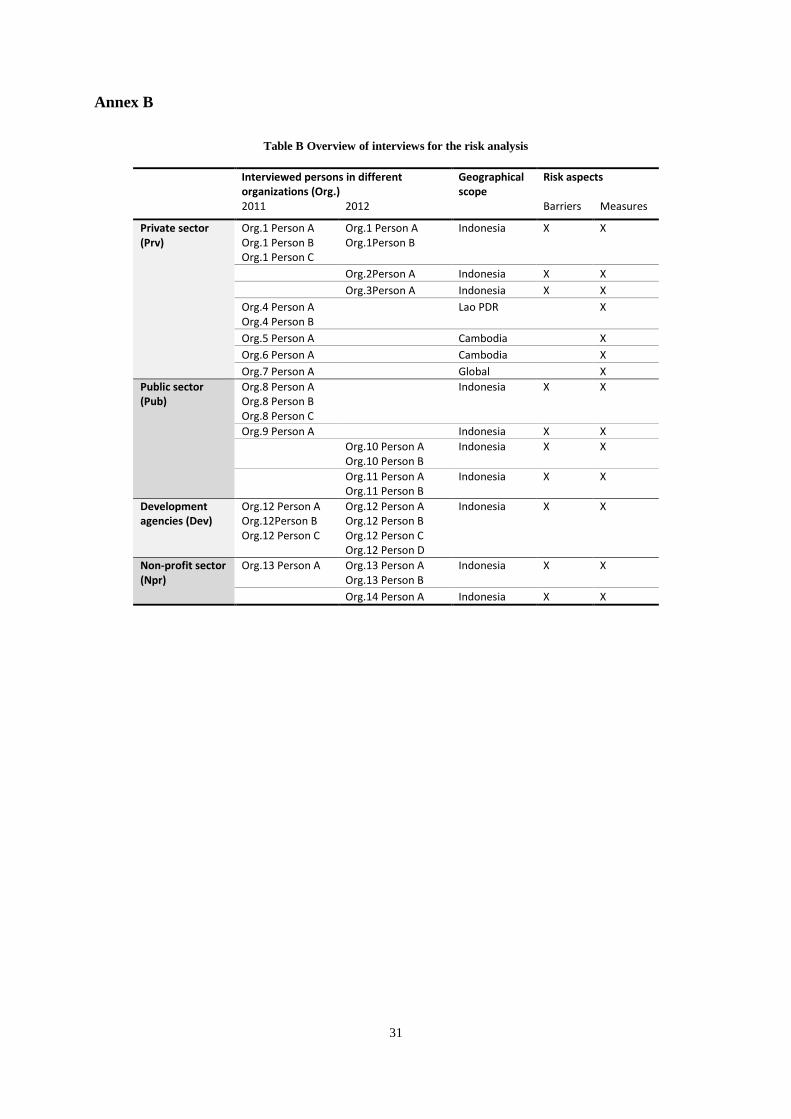
Annex B
Table B Overview of interviews for the risk analysis
Interviewed persons in different organizations (Org.)
Geographical scope
Risk aspects
2011 2012 Barriers Measures
Private sector (Prv)
Org.1 Person A Org.1 Person B Org.1 Person C
Org.1 Person A Org.1Person B
Indonesia X X
Org.2Person A Indonesia X X Org.3Person A Indonesia X X Org.4 Person A Org.4 Person B
Lao PDR X
Org.5 Person A Cambodia X Org.6 Person A Cambodia X Org.7 Person A Global X
Public sector (Pub)
Org.8 Person A Org.8 Person B Org.8 Person C
Indonesia X X
Org.9 Person A Indonesia X X Org.10 Person A
Org.10 Person B Indonesia X X
Org.11 Person A Org.11 Person B
Indonesia X X
Development agencies (Dev)
Org.12 Person A Org.12Person B Org.12 Person C
Org.12 Person A Org.12 Person B Org.12 Person C Org.12 Person D
Indonesia X X
Non-profit sector (Npr)
Org.13 Person A Org.13 Person A Org.13 Person B
Indonesia X X
Org.14 Person A Indonesia X X
31
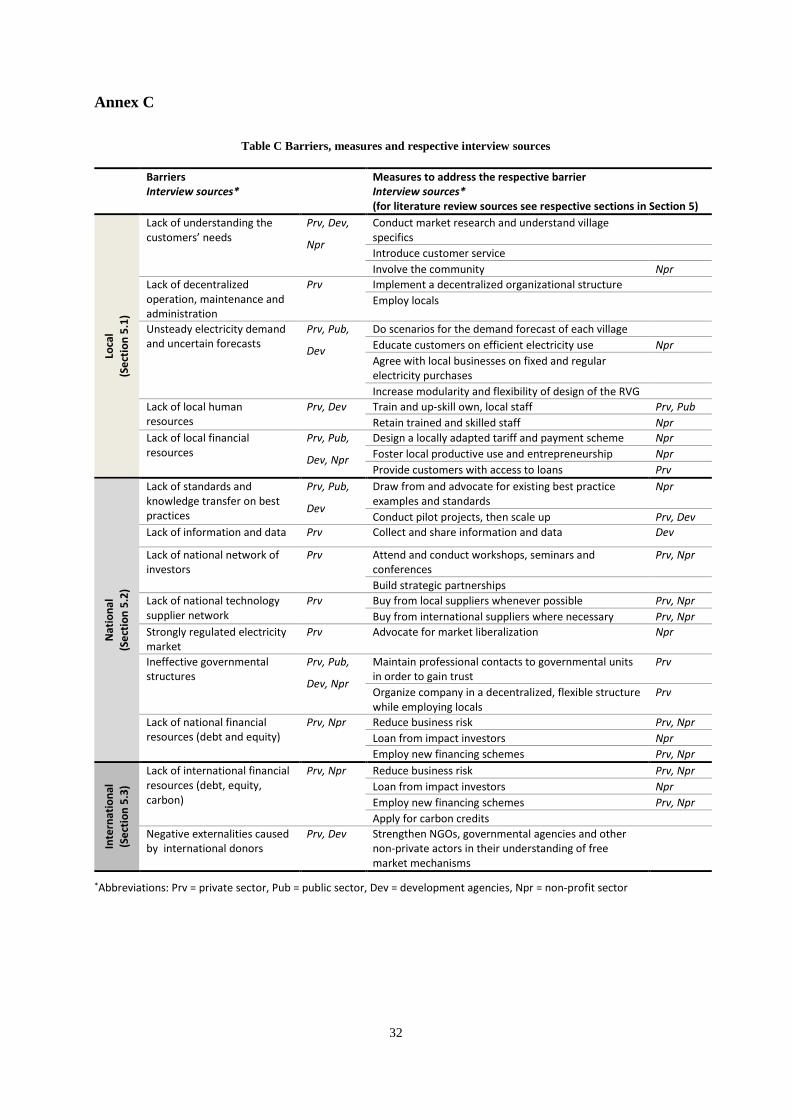
Annex C
Table C Barriers, measures and respective interview sources
Barriers Interview sources*
Measures to address the respective barrier Interview sources* (for literature review sources see respective sections in Section 5)
Loca
l (S
ectio
n 5.
1)
Lack of understanding the customers’ needs
Prv, Dev,
Npr
Conduct market research and understand village specifics
Introduce customer service Involve the community Npr
Lack of decentralized operation, maintenance and administration
Prv Implement a decentralized organizational structure Employ locals
Unsteady electricity demand and uncertain forecasts
Prv, Pub,
Dev
Do scenarios for the demand forecast of each village Educate customers on efficient electricity use Npr Agree with local businesses on fixed and regular electricity purchases
Increase modularity and flexibility of design of the RVG Lack of local human resources
Prv, Dev Train and up-skill own, local staff Prv, Pub Retain trained and skilled staff Npr
Lack of local financial resources
Prv, Pub,
Dev, Npr
Design a locally adapted tariff and payment scheme Npr Foster local productive use and entrepreneurship Npr Provide customers with access to loans Prv
Nat
iona
l (S
ectio
n 5.
2)
Lack of standards and knowledge transfer on best practices
Prv, Pub,
Dev
Draw from and advocate for existing best practice examples and standards
Npr
Conduct pilot projects, then scale up Prv, Dev Lack of information and data Prv Collect and share information and data Dev
Lack of national network of investors
Prv Attend and conduct workshops, seminars and conferences
Prv, Npr
Build strategic partnerships Lack of national technology supplier network
Prv Buy from local suppliers whenever possible Prv, Npr Buy from international suppliers where necessary Prv, Npr
Strongly regulated electricity market
Prv Advocate for market liberalization Npr
Ineffective governmental structures
Prv, Pub,
Dev, Npr
Maintain professional contacts to governmental units in order to gain trust
Prv
Organize company in a decentralized, flexible structure while employing locals
Prv
Lack of national financial resources (debt and equity)
Prv, Npr Reduce business risk Prv, Npr Loan from impact investors Npr Employ new financing schemes Prv, Npr
Inte
rnat
iona
l (S
ectio
n 5.
3)
Lack of international financial resources (debt, equity, carbon)
Prv, Npr Reduce business risk Prv, Npr Loan from impact investors Npr Employ new financing schemes Prv, Npr Apply for carbon credits
Negative externalities caused by international donors
Prv, Dev Strengthen NGOs, governmental agencies and other non-private actors in their understanding of free market mechanisms
*Abbreviations: Prv = private sector, Pub = public sector, Dev = development agencies, Npr = non-profit sector
32