atti - stsn.it · della batimetria del lago. i dati sonar (batimetria e retrodiffusione) sono stati...
TRANSCRIPT

A T T ID E L L A
S O C I E T À T O S C A N AD I
S C I E N Z E N A T U R A L IM E M O R I E • S E R I E B • V O L U M E C X X V I • A N N O 2 0 1 9
E d i z i o n i E T S
Serie_b_126/2019BN.indb 1 10/03/20 08:11

Serie_b_126/2019BN.indb 2 10/03/20 08:11
INDICE - CONTENTS
S. PaSta, a. troìa – From common and used to rare and forgotten: Past and present distribution of the ar-chaeophyte Euphorbia lathyris L. (Euphorbiaceae) in southern Italy and Sicily.Da comune e utilizzata a rara e dimenticata: distribuzio-ne passata e presente dell’archeofita Euphorbia lathyris L. (Euphorbiaceae) in Italia meridionale e Sicilia.
C.M. MuSarella, I. PaglIanItI, a. Cano-ortIz, g. SPaMPInato – Indagine etnobotanica nel territo-rio del Poro e delle Preserre Calabresi (Vibo Valentia, S-Italia).Ethnobotanical study in the Poro and Preserre Calabresi territory (Vibo Valentia, S-Italy).
a. DI CenCIo, S. CaSatI, a. Collareta – A new re-cord of Ocypode italica (Brachyura: Ocypodidae) from the Pliocene of Tuscany (central Italy). Un nuovo esemplare di Ocypode italica (Brachyura: Ocypodidae) dal Pliocene della Toscana (Italia centrale).
l. PeruzzI, D. VICIanI, C. angIolInI, g. aStutI, e. BanfI, S. BranDanI, g. BonarI, S. CaMBrIa, S. CannuCCI, P. CaStagnInI, M. D’antraCColI, P. De gIorgI, S. DI natale, g. ferrettI, t. fIaSChI, V. gonnellI, g. gottSChlICh, l. laStruCCI, l. laz-zaro, a. MISurI, M. MugnaI, B. PIerInI, l. PInzanI, f. roMa-MarzIo, a. SanI, f. SelVI, a. SPInellI, g. BeDInI – Contributi per una flora vascolare di To-scana. XI (664-738).Contributions for a vascular flora of Tuscany. XI (664-738).
a.C. treMBanIS, J.r. gutSChe – Spatial distribution and characteristics of microbialites through the use of sonar techniques- geoacoustic investigations at Pavil-ion Lake (Canada). Distribuzione spaziale e caratteristiche di microbialiti tramite tecniche sonar e indagini geoacustiche nel Lago Pavilion (Canada).
pag. 5
» 13
» 29
» 35
» 47
S. MaCCIonI, r. VangelIStI, l. aMaDeI – I manoscritti del Museo Botanico pisano. Il “Fondo Gaetano Savi” (1769-1844). The manuscripts of Botanic Museum of Pisa. The Col-lection of Gaetano Savi (1769-1844).
g. InnoCentI, r. ManzonI – Catalogues of the Natural History Museum, Zoological Section “La Specola”, of the University of Florence. XXXIV. Crustacea, Class Malacostraca, Order Decapoda. Superfamily Portunoidea (Families Geryonidae, Portunidae). Cataloghi del Museo di Storia Naturale dell’Università di Firenze, Sezione di Zoologia “La Specola”. XXXIV. Crustacea, Classe Malacostraca, Ordine Decapoda. Su-perfamiglia Portunoidea (Famiglie Geryonidae, Portu-nidae).
f. CIanferonI, g. Mazza, g. InnoCentI – Presenza di Potamon fluviatile (Herbst, 1785) nel tratto fioren-tino del Fiume Arno (Malacostraca: Decapoda: Po-tamidae). Presence of Potamon fluviatile (Herbst, 1785) in the Florentine stretch of Arno River (Malacostraca: Deca-poda: Potamidae).
l. VannI, S. farIna – Birds collected by Orazio An-tinori in the Natural History Museum of the Univer-sity of Pisa. Uccelli raccolti da Orazio Antinori presenti nel Museo di Storia Naturale dell’Università di Pisa.
» 61
» 69
» 83
» 91
Serie_b_126/2019BN.indb 3 10/03/20 08:11

Serie_b_126/2019BN.indb 4 10/03/20 08:11

Arthur C. trembAnis (1), JonAthAn r. GutsChe (1)
SPATIAL DISTRIBUTION AND CHARACTERISTICS OF MICROBIALITES THROUGH THE USE OF SONAR TECHNIQUES-
GEOACOUSTIC INVESTIGATIONS AT PAVILION LAKE (CANADA)
(1) College of Earth, Ocean, and Environment, University of Delaware, Newark, DECorresponding author: Arthur C. Trembanis ([email protected])
Atti Soc. Tosc. Sci. Nat., Mem., Serie B, 126 (2019)pagg. 47-60, figg. 8; tabb. 2; doi: 10.2424/ASTSN.M.2019.04
Abstract - A.C. trembAnis, G.r. GutsChe, spatial distribution and characteristics of microbialites through the use of sonar techniques- geo-acoustic investigations at Pavilion Lake (Canada).
Previously collected diver and submersible derived video survey data have documented a diverse community of living microbialites on the lakebed of Pavilion Lake, BC. Research conducted prior to 2005 in-volved discrete sampling locations rather than an examination on a synoptic scale. Through a series of lake-wide sonar survey measure-ments (including swath bathymetric and side-scan systems) utilizing a variety of surface vessel and autonomous underwater vehicle (AUV) mounted sonars, acoustic backscatter derived bottom-type maps were created. These bottom classification maps allowed for the ana-lytical study of the microbialite habitat with respect to the collected bathymetry of the lake. The sonar data (bathymetry and backscatter) was compiled to create a base map of the lakebed at a very high res-olution of 25 cm. The bathymetry data allowed analysis of bedforms within Pavilion Lake, as well as any erosional episodes that may affect the growth of microbialites. By analyzing the dense phase measuring bathymetric coverage of the lake bottom, with respect to rugosity (i.e., localized slope) and depth, it was possible to examine trends in chang-ing benthic conditions in regions with microbialites present. Acoustic backscatter data was used to differentiate between soft sediment ero-sional deposits and hard bottom microbialite morphologies to evaluate changing conditions. The distribution and growth pattern character-istics were then analyzed and allowed for inferences to be made con-cerning preferential habitat characteristics. These maps allowed for a better understanding of the habitat characteristics of the microbialite landscape level patterns found in these lakes. Furthermore, these data products aid in the interpretation of patterns in the paleolimnogical record, in addition to the interpretation of the growth conditions and biological origins of these structures.
Key Words - microbialites, geoacoustic investigations, sonar, Pavilion Lake, Canada
Riassunto - A.C. trembAnis, G.r. GutsChe, Distribuzione spaziale e caratteristiche di microbialiti tramite tecniche sonar e indagini geoacusti-che nel Lago Pavilion (Canada).
Dati ottenuti in precedenza da video ripresi da subacquei o da som-mergibili avevano documentato una ricca comunità di microbialiti viventi sul fondale del Lago Pavilion, British Columbia. Le ricerche condotte prima del 2005 avevano interessato aree di campionamen-to separate anziché rilevamenti a scala sinottica. Tramite una serie di misurazioni dei rilievi sonar sull’intero lago (compresi sistemi batime-trici multi-beam e a scansione laterale) eseguiti con sonar installati su diversi tipi di imbarcazioni di superficie e veicoli subacquei autonomi, sono state create mappe del tipo di fondale derivate da retro diffusione acustica. Queste mappe di classificazione del fondale hanno consenti-to di studiare in modo analitico l’habitat delle microbialiti in funzione
della batimetria del lago. I dati sonar (batimetria e retrodiffusione) sono stati assemblati per creare una mappa di base del fondale lacu-stre alla risoluzione di 25 cm. I dati batimetrici hanno consentito di analizzare le forme di fondale del Lago Pavilion e i fenomeni erosivi che possono influire sulla crescita delle microbialiti. Tramite analisi della copertura batimetrica del fondale relativa alla fase densa rispetto alla rugosità (cioè pendenza locale) e profondità, è stato possibile esa-minare le tendenze delle condizioni bentoniche variabili nelle regioni in cui erano presenti microbialiti. I dati di retro diffusione acustica sono stati usati per differenziare i depositi erosivi di sedimento molle dalle morfologie microbialitiche di fondo duro e valutare le condizioni di variabilità. Sono state quindi analizzate la distribuzione e le carat-teristiche dei modelli di crescita, che hanno permesso di dedurre le caratteristiche degli habitat preferenziali. Queste mappe hanno con-sentito una migliore comprensione delle caratteristiche dell’habitat dei complessi di microbialiti a livello di paesaggio trovata in questi laghi. Inoltre, i dati prodotti aiutano a interpretare i modelli nella do-cumentazione paleolimnologica, oltre alle condizioni di crescita e alle origini biologiche di queste strutture.
Parole chiave - microbialiti, indagini geoacustiche, sonar, Pavilion Lake, Canada
introduCtion
Stromatolitic fossils date to 3500 Ma (Awramik et al., 1983; Lowe, 1980; Walter et al., 1980), and compri-se the most abundant fossil group from 2500 to 570 Ma ago. A variety of stromatolite morphologies are abundant in strata deposited during the last billion years of the Proterozoic (Awramik, 1984). Through advances in lake bottom mapping it has been obser-ved that modern microbialites thrive in freshwater lake environments, much like ancient stromatolites, which are believed to have thrived in similar envi-ronments. Previously collected data shows that a di-verse community of living stromatolites are present within Pavilion Lake, BC, Canada (Laval et al., 2000; Lim et al., 2009). This work utilizes high-resolution geoacoustic data (collected in 2009 and 2010) in or-der to perform detailed morphological analysis of mi-crobialite patterns in modern settings as evidenced from Pavilion Lake.Due to advances in acoustic mapping and automated classification, it is possible to create high-resolution
48 A.C. TREMBANIS, J.R. GUTSCHE
mapping products of lake bottom features that can be used to characterize bedform morphologies with high accuracy (Subramaniam, 1993; Preston 2009). The use of an autonomous underwater vehicle (AUV) can further these efforts because the sensor arrays of the AUV can collect multiple data products that, when combined, give a comprehensive assessment of the lake bottom. Using multiple software packages (e.g., MATLAB®, Fledermaus, ArcGIS, SonarWIZ) the so-nar data was analyzed and the slope and rugosity were calculated and classified in a similar method used for coral reefs in the ocean (Williams et al., 2010; Forrest et al., 2012; Trembanis et al., 2017). Similar to multibe-am sonar systems which have been utilized to collect large amounts of information about seabed characteri-stics (Preston et al., 2001), the sonar data collected for this study can be queried with respect to a self-similar classification structure or catalogue (Raineault et al., 2012; Trembanis et al., 2012) in addition to visualizing lakebed characteristics. It has been speculated that physical factors such as depth and slope are important to the development of microbialite morphologies; however, this relationship remains largely uncharacterized (Andres and Reid 2006; Lim et al., 2009). Modern environments allow for directly observable and testable linkages betwe-en microbialite morphology, environmental factors, and microbial communities. Utilizing a systematic morphometrics-based classification system for micro-bialites in a modern setting and relating morphologi-cal trends to physical influences has the potential to improve the efficiency of subsequent manned explora-tion efforts. Pavilion Lake is an ideal location for just such a study due to the morphological diversity and richness that is unique in its level of documentation among modern microbialite systems (e.g., Lim et al., 2009; Brady et al., 2010).This study utilized backscatter derived classification maps to reveal specific microbialite habitat conditions that reveal strong signs of microbialite biological ac-tivity. A GAVIA autonomous underwater vehicle was used to develop a map of Pavilion Lake using va-rious sonar data products. This information was then analyzed to create a site-specific geoacoustic classifi-cation map. In conjunction with previously collected imagery, this classification map was queried with re-spect to the collected bathymetry data and a volumi-
nous archive of HD video and still camera images in order to ground truth the acoustically derived bottom types. The local bathymetric environment (primarily depth and slope) of the various classes was described and results indicate that the microbialite features grow within specific slope (5-25°) and depth (20-30 m) th-resholds.
study AreA
Pavilion Lake is approximately 420 km northeast of Vancouver, in southern-central British Columbia, Ca-nada. The lake is comprised of three distinct basins and is positioned within the confines of a limestone walled canyon at an altitude of approximately 825 m above sea level (Brady et al., 2010). The relief within the canyon walls is approximately 900 m. The lake is oriented along a northwest to southeast axis and is ~6 km in length. Pavilion Lake is a slightly basic (pH 8.4), freshwater lake. The maximum-recorded depth du-ring this survey was 55 m, which differs slightly from previously reported value of approximately 60 m (Mul-lins et al., 2007). The microbialites found within the lake range from centimeters to meters in height depen-ding on the associated depth in the lake. In addition, morphologies of the microbialites vary widely in the lake (Laval et al., 2000) and this diversity is the source of ongoing investigations (Lim et al., 2009). Previous investigations including surface-based sonar and drop camera work (Mullins et al., 2007) and submersible-based research has confirmed the extensive presence of microbialites at varying depth ranges, throughout Pavilion Lake (Forrest et al., 2009; Lim et al., 2010). Pavilion Lake is particularly notable for its variety of microbialite macro-morphologies. Submersible data have also shown that the macro-morphologies in Pavi-lion Lake are diverse and range from nodular to terete macro- and meso- forms, and vary in discernible size from 0.25 m to > 1 m in diameter.
Previous work
Research work at Pavilion Lake using DeepWorker submersibles and GAVIA Autonomous Underwater Vehicle (AUV) exploration platforms have provided a
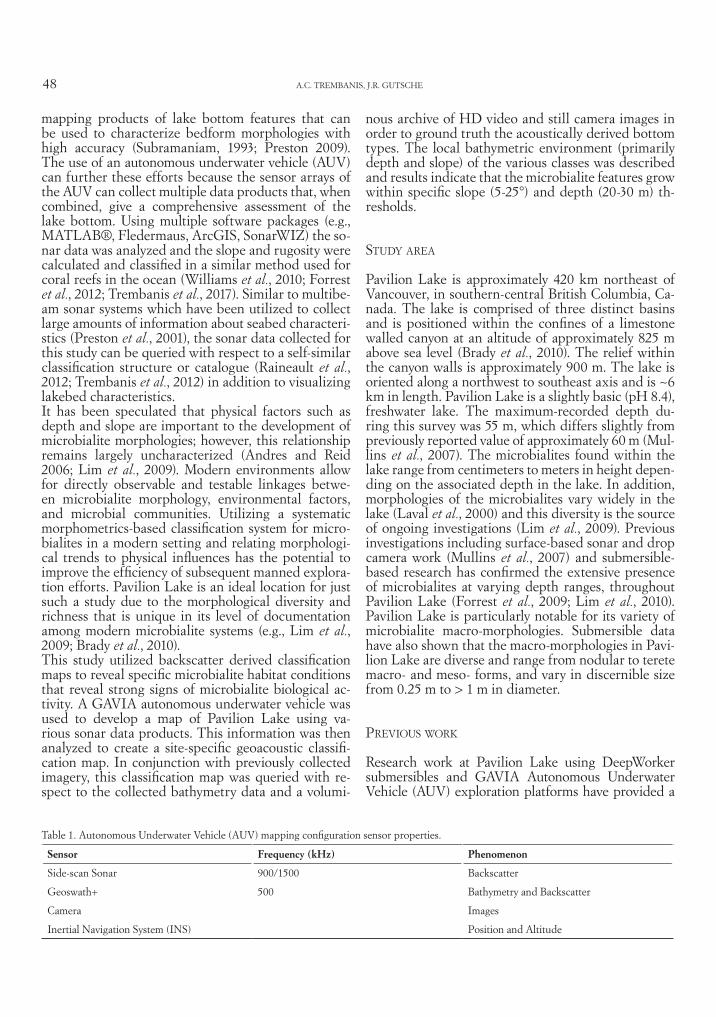
Table 1. Autonomous Underwater Vehicle (AUV) mapping configuration sensor properties.
Sensor Frequency (kHz) Phenomenon
Side-scan Sonar 900/1500 Backscatter
Geoswath+ 500 Bathymetry and Backscatter
Camera Images
Inertial Navigation System (INS) Position and Altitude

SPATIAL DISTRIBUTION AND CHARACTERISTICS OF MICROBIALITES THROUGH THE USE OF SONAR TECHNIQUES 49
coordinate synoptic view of the lake bottom (Lim et al., 2010). These results suggest associations and trends between the macro and meso-microbialite morphologi-cal variation and physical lake properties such as depth and slope. However, these observations had yet to be tested or confirmed. As the basis for this work, it was proposed to characterize the influence of physical lake properties on microbialite morphological variation.Data including water chemistry (Lim et al., 2009), sedimentation rates, microbialite samples and mi-crobialite photos have been collected. By analyzing the microbialite samples, it was determined that the biosignatures of the microbialites show signs of pho-tosynthetic preference (Brady et al., 2010). The study of photosynthetic preference consisted of 27 different microbialite nodules. Preliminary sonar investigations at Pavilion Lake be-gan in October 1998 and August 1999 with field work consisting of both boat mounted swath bathymetry sonar and towfish mounted sidescan sonar measu-rements. Although full coverage of the lake was not completed during these early measurements, micro-bialite features were visually identified in the acoustic backscatter data with accompanying confirmation through the use of drop cameras and scuba investi-gation. As sonar techniques were thus demonstrated
to be a useful tool in the mapping of the lake and di-recting mission planning in for other sampling tech-niques, three additional sonar field measurements were undertaken in June and September of 2005 and September of 2006 (boat mounted swath bathyme-try). Measurements taken in June 2005 yielded the discovery of microbialites at depths greater than 35m in the central basin of Pavilion Lake, however acou-stic refraction from thermal stratification of the water column led to a geometry that was not conducive to mapping the whole lake. Sonar measurements taken in September 2005, 2006 were used to create preliminary backscatter maps to assist in the planning of subse-quent Remotely Operated Vehicle, DeepWorker and AUV missions (Lim et al., 2011; Mullins et al., 2007).
methods
The mapping efforts conducted within Pavilion Lake utilized a Geoswath sonar mounted on a Gavia au-tonomous underwater vehicle (Figure 1). The Gavia Autonomous Underwater Vehicle (AUV) is a modular person portable survey platform configured with geo-acoustic sensors, a positioning system, and a color di-gital camera for seafloor or lakebed mapping (Tab. 1).
Figure 1. Site Map of Pavilion Lake (upper right) located in British Columbia Canada. Gavia AUV as configured for lake mapping (upper left) and workflow of geoacoustic data processing.
50 A.C. TREMBANIS, J.R. GUTSCHE
Data Collection
The Gavia AUV was capable of running missions by either following a set depth or keeping a constant altitude (i.e., height above bottom) above the lake-bed. Preliminary missions were run at a set depth to ensure vehicle safety. The data gathered during tho-se missions was subsequently used to establish safe working altitudes for the vehicle to follow the lake bathymetry. The Gavia AUV allows for variable velo-cities to be selected during mission setup by directly controlling the propeller revolutionary rate. Expe-rience based on trial and error produced optimal re-sults for GeoSwath data gathering in Pavilion Lake of 600 rpm, which is equivalent to 1.5 m/s speed over ground. The three distinct basins of the lake made it possible to build design missions specific to each of basins and areas of the lake.
Data Analysis
DMagicTM was used to grid the bathymetric files (.xyz) that were processed using Geoswath PlusTM softwa-re. The ungridded .xyz files were loaded into a new project file created within DMagicTM. Since the depths of the lake basins vary, all of the Pavilion Lake survey was loaded into one project. This consistency allowed for the data to share one consistent depth scale. Once the ungridded data files were loaded, the trackline of the survey was analyzed. By comparing the trackline to the set list of ungridded .xyz files it was possible to remove any files that may negatively affect the preci-sion of the final bathymetry map. During the survey, the AUV may have collected data at a time when the obstacle avoidance sonar had mo-ved it off of its course, and the data collected would not benefit the survey. After the trackline plot of the .xyz files correctly reflects the survey pattern the grid size was determined. The grid size reflects the lateral
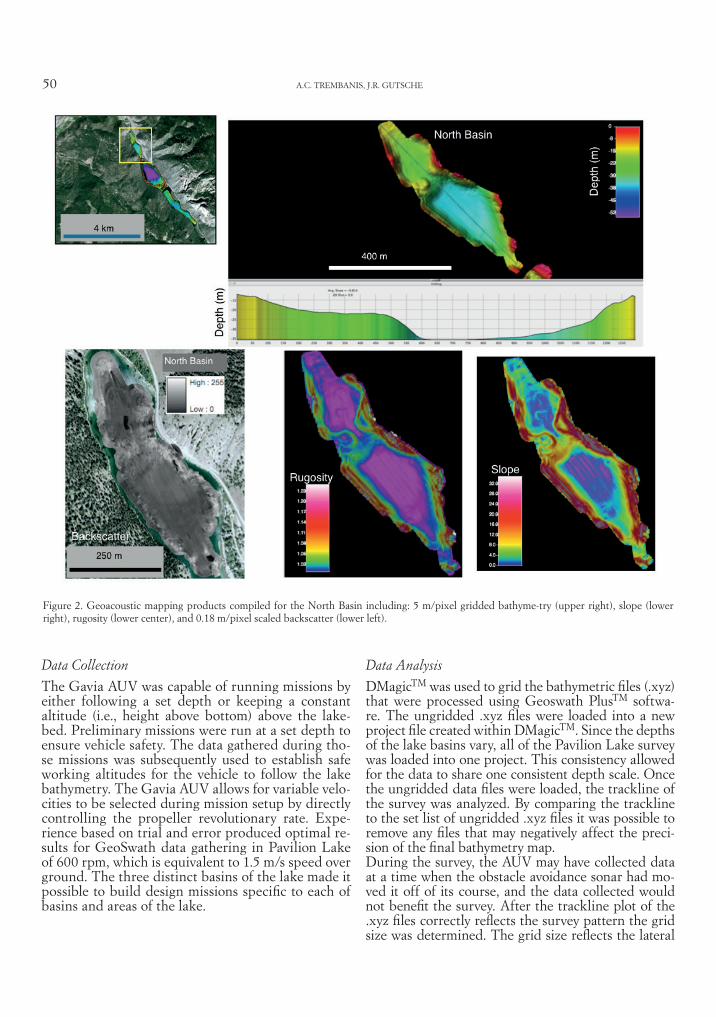
Figure 2. Geoacoustic mapping products compiled for the North Basin including: 5 m/pixel gridded bathyme-try (upper right), slope (lower right), rugosity (lower center), and 0.18 m/pixel scaled backscatter (lower left).
SPATIAL DISTRIBUTION AND CHARACTERISTICS OF MICROBIALITES THROUGH THE USE OF SONAR TECHNIQUES 51
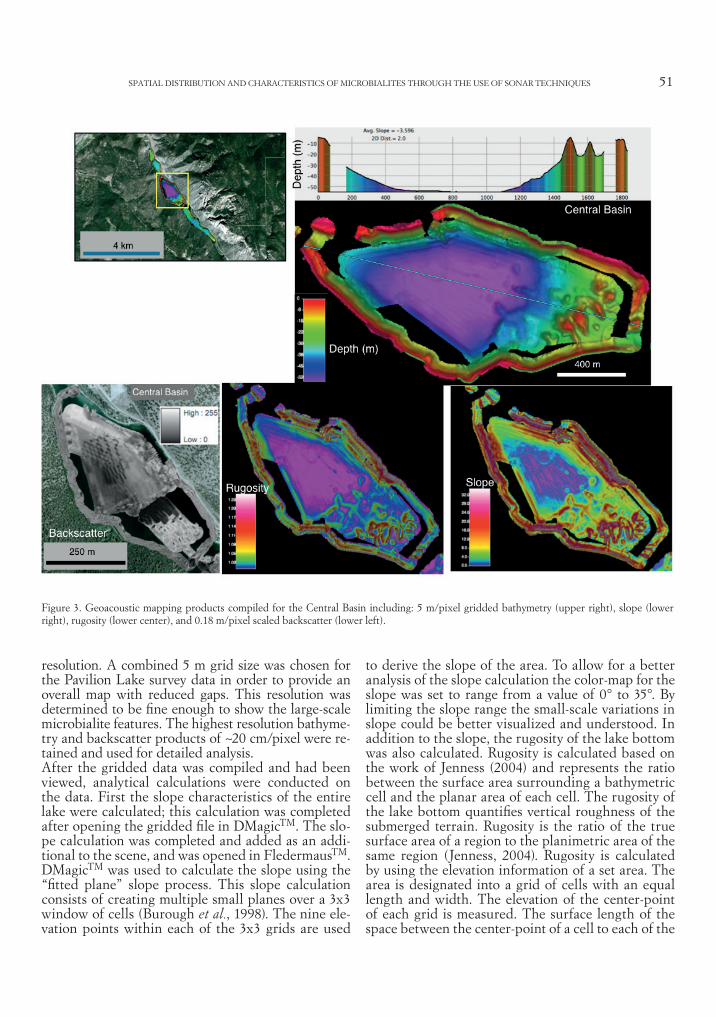
resolution. A combined 5 m grid size was chosen for the Pavilion Lake survey data in order to provide an overall map with reduced gaps. This resolution was determined to be fine enough to show the large-scale microbialite features. The highest resolution bathyme-try and backscatter products of ~20 cm/pixel were re-tained and used for detailed analysis.After the gridded data was compiled and had been viewed, analytical calculations were conducted on the data. First the slope characteristics of the entire lake were calculated; this calculation was completed after opening the gridded file in DMagicTM. The slo-pe calculation was completed and added as an addi-tional to the scene, and was opened in FledermausTM. DMagicTM was used to calculate the slope using the “fitted plane” slope process. This slope calculation consists of creating multiple small planes over a 3x3 window of cells (Burough et al., 1998). The nine ele-vation points within each of the 3x3 grids are used
to derive the slope of the area. To allow for a better analysis of the slope calculation the color-map for the slope was set to range from a value of 0° to 35°. By limiting the slope range the small-scale variations in slope could be better visualized and understood. In addition to the slope, the rugosity of the lake bottom was also calculated. Rugosity is calculated based on the work of Jenness (2004) and represents the ratio between the surface area surrounding a bathymetric cell and the planar area of each cell. The rugosity of the lake bottom quantifies vertical roughness of the submerged terrain. Rugosity is the ratio of the true surface area of a region to the planimetric area of the same region (Jenness, 2004). Rugosity is calculated by using the elevation information of a set area. The area is designated into a grid of cells with an equal length and width. The elevation of the center-point of each grid is measured. The surface length of the space between the center-point of a cell to each of the
Figure 3. Geoacoustic mapping products compiled for the Central Basin including: 5 m/pixel gridded bathymetry (upper right), slope (lower right), rugosity (lower center), and 0.18 m/pixel scaled backscatter (lower left).
52 A.C. TREMBANIS, J.R. GUTSCHE
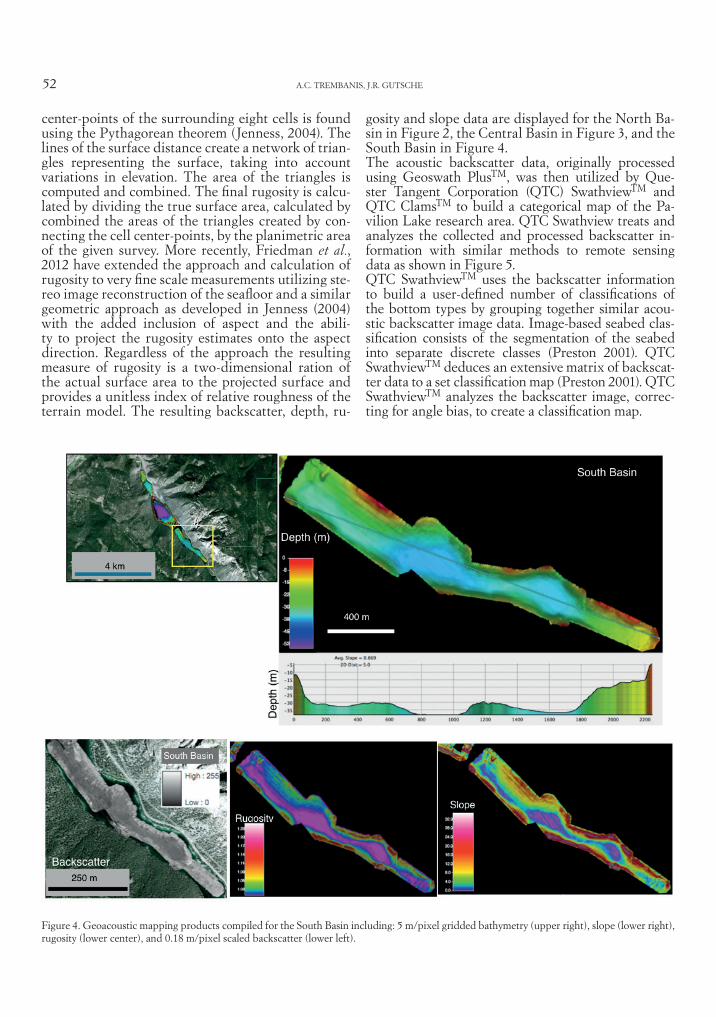
center-points of the surrounding eight cells is found using the Pythagorean theorem (Jenness, 2004). The lines of the surface distance create a network of trian-gles representing the surface, taking into account variations in elevation. The area of the triangles is computed and combined. The final rugosity is calcu-lated by dividing the true surface area, calculated by combined the areas of the triangles created by con-necting the cell center-points, by the planimetric area of the given survey. More recently, Friedman et al., 2012 have extended the approach and calculation of rugosity to very fine scale measurements utilizing ste-reo image reconstruction of the seafloor and a similar geometric approach as developed in Jenness (2004) with the added inclusion of aspect and the abili-ty to project the rugosity estimates onto the aspect direction. Regardless of the approach the resulting measure of rugosity is a two-dimensional ration of the actual surface area to the projected surface and provides a unitless index of relative roughness of the terrain model. The resulting backscatter, depth, ru-
gosity and slope data are displayed for the North Ba-sin in Figure 2, the Central Basin in Figure 3, and the South Basin in Figure 4.The acoustic backscatter data, originally processed using Geoswath PlusTM, was then utilized by Que-ster Tangent Corporation (QTC) SwathviewTM and QTC ClamsTM to build a categorical map of the Pa-vilion Lake research area. QTC Swathview treats and analyzes the collected and processed backscatter in-formation with similar methods to remote sensing data as shown in Figure 5. QTC SwathviewTM uses the backscatter information to build a user-defined number of classifications of the bottom types by grouping together similar acou-stic backscatter image data. Image-based seabed clas-sification consists of the segmentation of the seabed into separate discrete classes (Preston 2001). QTC SwathviewTM deduces an extensive matrix of backscat-ter data to a set classification map (Preston 2001). QTC SwathviewTM analyzes the backscatter image, correc-ting for angle bias, to create a classification map.
Figure 4. Geoacoustic mapping products compiled for the South Basin including: 5 m/pixel gridded bathymetry (upper right), slope (lower right), rugosity (lower center), and 0.18 m/pixel scaled backscatter (lower left).
SPATIAL DISTRIBUTION AND CHARACTERISTICS OF MICROBIALITES THROUGH THE USE OF SONAR TECHNIQUES 53
results
The shallow water slope characteristics of the lake hi-ghlight the steep walls of the lake’s coastal features. Fi-gures 2, 3 and 4 demonstrate the general slope trends of Pavilion Lake: a decrease in slope with depth (lower right subfigure in Figures 2, 3, and 4). This decrease in slope is characteristic of the bowl-like shape of the three lake basins.
Automated classification-QTC Swathview, QTC Clams
QTC SwathviewTM and QTC ClamsTM were used to produce the principal component vector classes (Figure 5 upper panel) and to then spatially portray these categorical classes as maps illustrated in Fi-gure 6. To better highlight regions of the lake, the classification map was divided into the three prima-ry lake basins (North, Central and South Basins). QTC SwathviewTM and QTC ClamsTM were utilized to produce a map that included six classifications of the collected backscatter. QTC Swathview uses the
backscatter information to build a set of classes of the bottom types by grouping together similar acoustic backscatter image data using principal component analysis (Figure 5 upper panel). The number of clas-ses can either be prescribed by the user based on a priori knowledge of the bottom type or determined by an an automated clustering process using a Simu-lated Annealing K-Means algorithm (Preston 2001). The Image-based seabed classification consists of the segmentation of the seabed into separate discrete classes (Preston, 2001). QTC Swathview deduces an extensive matrix of backscatter data to a set of clas-ses (Preston, 2001). QTC Clams takes the categorical output of Swathview and interprets the points to a raster grid. The combination of Swathview (principal components and cluster analysis) and Clams (catego-rical gridding) allows for the backscatter image, cor-recting for angle bias, to produce a final categorical classification map (Figure 6). This automated ground discrimination and classification approach has been used successfully in a variety of other environmental settings from Delaware Bay (Raineault et al., 2012)
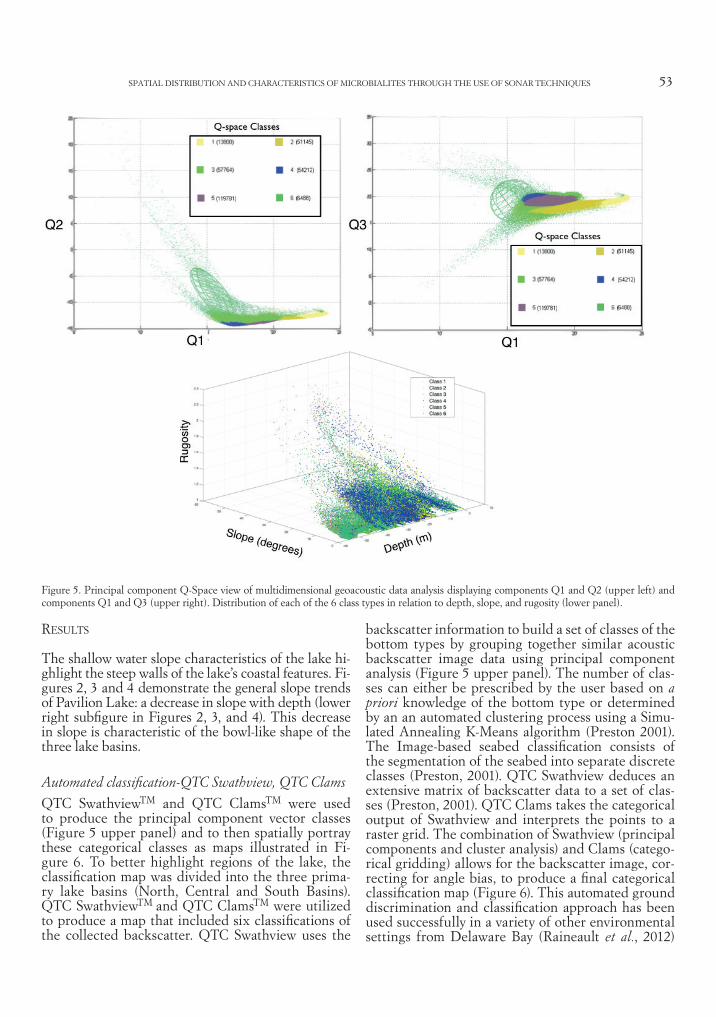
Figure 5. Principal component Q-Space view of multidimensional geoacoustic data analysis displaying components Q1 and Q2 (upper left) and components Q1 and Q3 (upper right). Distribution of each of the 6 class types in relation to depth, slope, and rugosity (lower panel).
54 A.C. TREMBANIS, J.R. GUTSCHE
to coral reefs of Bonaire (Trembanis et al., 2017) The resulting classification map displays variations in sea-floor material and bottom-type. The color-scheme used for the classification was set to “scaled similari-ty” which selected similar colors to represent similar backscatter characteristics. Q-space vectors are based on the proprietary factors extracted from the sonar imagery withing QTC Swathview and are not directly relatable to physical properties such as depth, slope, and rugosity. A plot of Q-space derived classes rela-tive to morphologic parameters or depth, slope, and rugosity did not reveal any clear discernable patterns (Figure 5 lower panel). Further analysis and sampling of the lake bed classes could be conducted to deter-mine what physical parameters are responsible for the similarity and dissimilarity between classes such as organic matter content or chemical composition. Next, MATLAB® was used to visualize the distribu-tion of the principal component vector classes throu-ghout the lake (Figure 5).
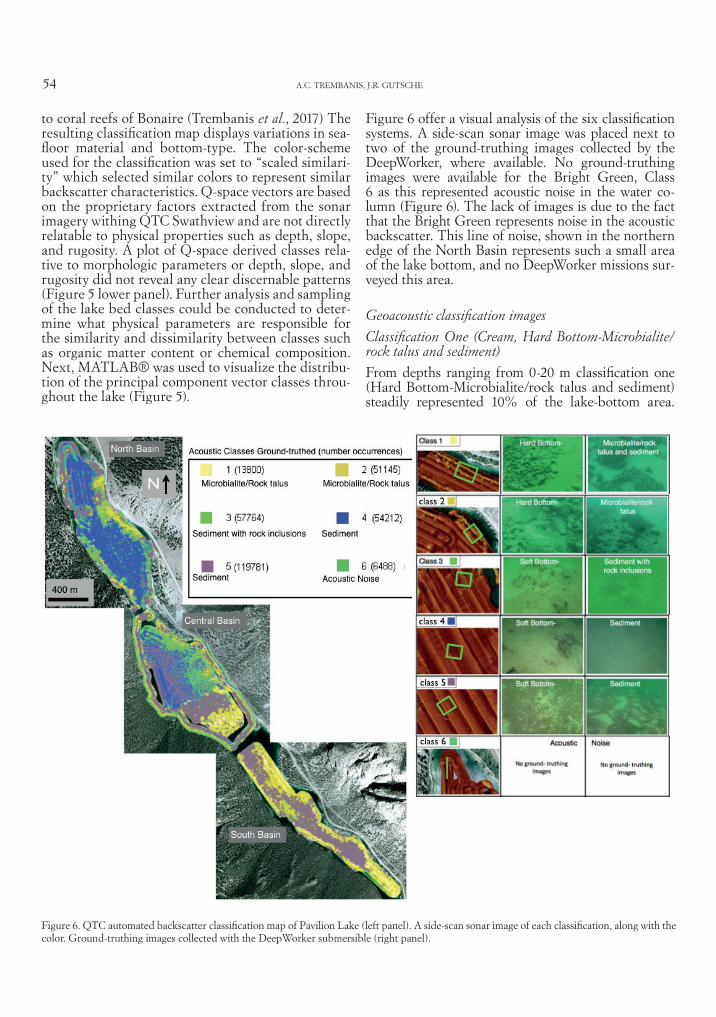
Figure 6 offer a visual analysis of the six classification systems. A side-scan sonar image was placed next to two of the ground-truthing images collected by the DeepWorker, where available. No ground-truthing images were available for the Bright Green, Class 6 as this represented acoustic noise in the water co-lumn (Figure 6). The lack of images is due to the fact that the Bright Green represents noise in the acoustic backscatter. This line of noise, shown in the northern edge of the North Basin represents such a small area of the lake bottom, and no DeepWorker missions sur-veyed this area.
Geoacoustic classification images
Classification One (Cream, Hard Bottom-Microbialite/rock talus and sediment)
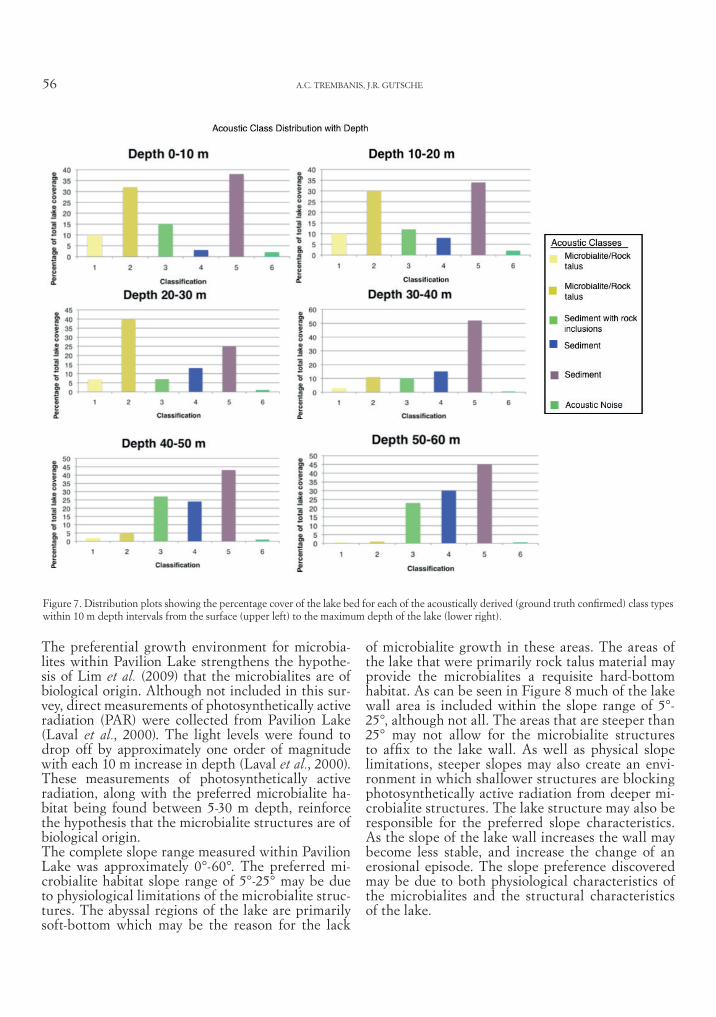
From depths ranging from 0-20 m classification one (Hard Bottom-Microbialite/rock talus and sediment) steadily represented 10% of the lake-bottom area.
Figure 6. QTC automated backscatter classification map of Pavilion Lake (left panel). A side-scan sonar image of each classification, along with the color. Ground-truthing images collected with the DeepWorker submersible (right panel).
SPATIAL DISTRIBUTION AND CHARACTERISTICS OF MICROBIALITES THROUGH THE USE OF SONAR TECHNIQUES 55
This level declined severely in the depth range 20-40 m, from approximately 7% to approximately 2% re-spectively. In the deepest portions of the lake, depth ranges of 40-60 m, classification one was minimal-ly present, making up only approximately 1% of the deep lake-bottom surface area.
Classification Two (Dark Yellow, Hard Bottom-Micro-bialite/Rock talus)
Classification two (Hard Bottom-Microbialite/Rock talus) was found to cover much more of the shallower lake areas than the deeper portions. The percenta-ge of coverage dropped slightly, from approximately 16% to 14%, in the shallower 0 m to 20 m areas of the lake. Classification two covered the largest percentage, 40%, of the lake from the depths 20 m to 30 m. The percentage severely dropped off after a depth of 30 m. From a range of depths 30 m to 40 m classification four covered approximately 12% of the lake-bottom surface area. The percentage of coverage continued to drop with depth; approximately 7% coverage at 40 m to 50 m. The deepest portion of the lake, 50 m to 60 m, consisted of only approximately 2% surface area coverage by classification two.
Classification Three (Dark Green, Soft Bottom-Sediment with rock inclusions)
Classification three (Dark Green, Soft Bottom-Sedi-ment with rock inclusions) varied significantly from the shallow depth segments to the deeper depth segments. Within the shallower depths of the lake classification the percentage of surface area covered by classification three was nearly 15%. The middle depth sections of the lake, 20 m to 40 m, saw a drop on the prevalence of classification three. Within the depth segment ranging from 20 m to 30 m the per-centage of classification three falls to approximately 7% of the total surface area. The deepest segments of the lake, 40 m to 60 m, are where classification three is most prevalent.
Classification Four (Blue, Soft Bottom-Sediment)
Classification four (Soft Bottom-Sediment) was found to be most prevalent in the deeper portions of the lake. From the depths of 50 m to 60 m classification four co-vered nearly 30% of the lake bottom surface area. The middle depth portions of the lake, 20 m to 40 m, con-sisted of a surface area coverage percentage ranging from approximately 13% to 18%. The prevalence of classification four continued to decrease with depth. In the range of 10 m to 20 m depth classification four covered approximately 8% of the lake-bottom surface area. The shallowest portions of the lake, 0 m to 10 m, exhibited the least percent coverage, 2%.
Classification Five (Lavender, Soft Bottom- Sediment)
Classification five (Soft Bottom- Sediment) covers the majority of the lake-bottom surface area in all depth ranges, other than that between 20 m and 30 m. After the percent coverage dipped slightly, 27%, between 20 m and 30 m, the percentage was measured to be the highest, 54%, between 30 m and 40 m. In the deeper portions of the lake, 30 m to 60 m, the percen-tage of surface area covered by classification five rose slightly. Classes Four and Five both represent soft bottom sediment cover and are virtually indistingui-shable based on the DeepWorker camera images but were registered as acoustically unique based on the principal component cluster analysis (Figure 5). Fur-ther investigation into the lake sediments should aim to determine if there is a compositional perhaps gas or organic matter inclusions that set these two classes apart acoustically.
Classification Six (Bright Green, Noise Pings)
The location of the majority of classification six was located in the northern edge of the North Basin. This area was not surveyed using the DeepWorker submer-sible. Because of the lack of survey, there are no images of the area designated as classification six.
Geoacoustic signatures
The biosignatures observed within nodules col-lected from the surface of Pavilion Lake microbiali-tes display a photosynthetic influence (Brady et. al. 2010). The lake depths were separated into depth segments of 10 meters. The percentage of each of the depth segments occupied by a specific backscatter class was then computer and are displayed in Figure 7. The classification of “Hard Bottom-Microbialite/rock talus and sediment” and “Hard Bottom-Mi-crobialite/rock talus” qualitatively suggests a cor-relation between microbialite habitat and depth. The depth and slope preferences of the microbialite communities reinforces the understanding that th e microbialite structures present in Pavilion Lake formed utilizing photosynthetic means. Microbiali-te growth in the Central and South Basins consists of marl reef structures that reach to within appro-ximately 5 m of the lake surface (Lim et. al. 2009). This growth limitation may be due to the chara plant coverage found within the shallower areas of the lake, generally less than 10 m. Because it has been shown that the microbialite structures rely on photosynthetic processes, the lack of microbia-lite formations in the shallow depths may be due to the chara growth covering potential microbialite habitat, reducing the available light for microbialite productivity.
56 A.C. TREMBANIS, J.R. GUTSCHE
The preferential growth environment for microbia-lites within Pavilion Lake strengthens the hypothe-sis of Lim et al. (2009) that the microbialites are of biological origin. Although not included in this sur-vey, direct measurements of photosynthetically active radiation (PAR) were collected from Pavilion Lake (Laval et al., 2000). The light levels were found to drop off by approximately one order of magnitude with each 10 m increase in depth (Laval et al., 2000). These measurements of photosynthetically active radiation, along with the preferred microbialite ha-bitat being found between 5-30 m depth, reinforce the hypothesis that the microbialite structures are of biological origin.The complete slope range measured within Pavilion Lake was approximately 0°-60°. The preferred mi-crobialite habitat slope range of 5°-25° may be due to physiological limitations of the microbialite struc-tures. The abyssal regions of the lake are primarily soft-bottom which may be the reason for the lack
of microbialite growth in these areas. The areas of the lake that were primarily rock talus material may provide the microbialites a requisite hard-bottom habitat. As can be seen in Figure 8 much of the lake wall area is included within the slope range of 5°-25°, although not all. The areas that are steeper than 25° may not allow for the microbialite structures to affix to the lake wall. As well as physical slope limitations, steeper slopes may also create an envi-ronment in which shallower structures are blocking photosynthetically active radiation from deeper mi-crobialite structures. The lake structure may also be responsible for the preferred slope characteristics. As the slope of the lake wall increases the wall may become less stable, and increase the change of an erosional episode. The slope preference discovered may be due to both physiological characteristics of the microbialites and the structural characteristics of the lake.
Figure 7. Distribution plots showing the percentage cover of the lake bed for each of the acoustically derived (ground truth confirmed) class types within 10 m depth intervals from the surface (upper left) to the maximum depth of the lake (lower right).
SPATIAL DISTRIBUTION AND CHARACTERISTICS OF MICROBIALITES THROUGH THE USE OF SONAR TECHNIQUES 57
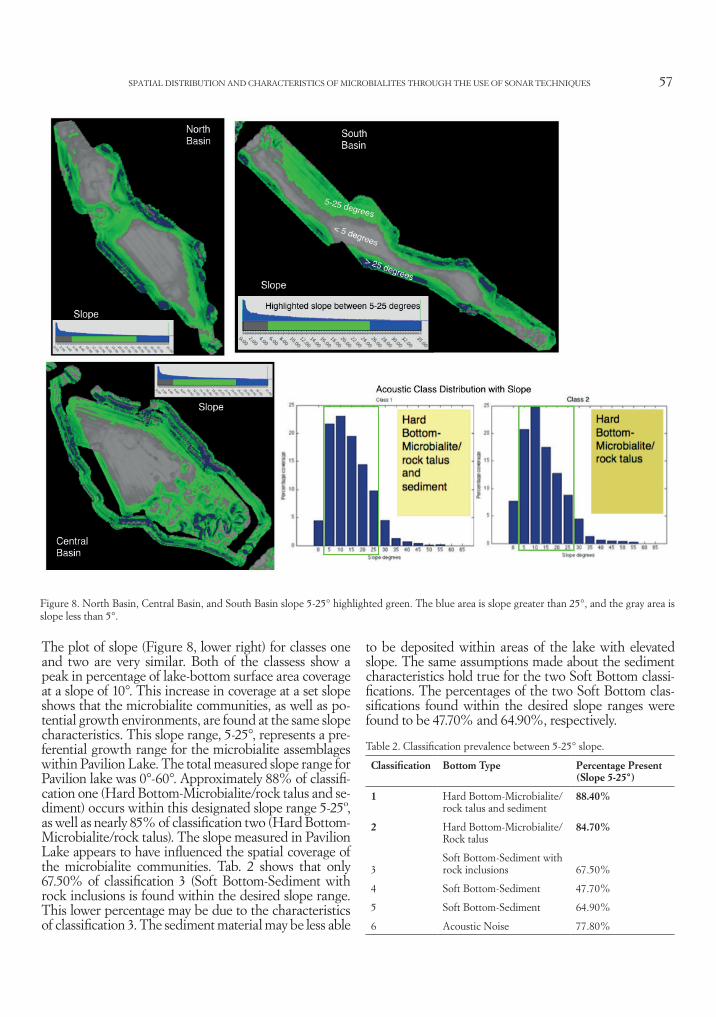
The plot of slope (Figure 8, lower right) for classes one and two are very similar. Both of the classess show a peak in percentage of lake-bottom surface area coverage at a slope of 10°. This increase in coverage at a set slope shows that the microbialite communities, as well as po-tential growth environments, are found at the same slope characteristics. This slope range, 5-25°, represents a pre-ferential growth range for the microbialite assemblages within Pavilion Lake. The total measured slope range for Pavilion lake was 0°-60°. Approximately 88% of classifi-cation one (Hard Bottom-Microbialite/rock talus and se-diment) occurs within this designated slope range 5-25º, as well as nearly 85% of classification two (Hard Bottom-Microbialite/rock talus). The slope measured in Pavilion Lake appears to have influenced the spatial coverage of the microbialite communities. Tab. 2 shows that only 67.50% of classification 3 (Soft Bottom-Sediment with rock inclusions is found within the desired slope range. This lower percentage may be due to the characteristics of classification 3. The sediment material may be less able
to be deposited within areas of the lake with elevated slope. The same assumptions made about the sediment characteristics hold true for the two Soft Bottom classi-fications. The percentages of the two Soft Bottom clas-sifications found within the desired slope ranges were found to be 47.70% and 64.90%, respectively.
Table 2. Classification prevalence between 5-25° slope.
Classification Bottom Type Percentage Present (Slope 5-25°)
1 Hard Bottom-Microbialite/rock talus and sediment
88.40%
2 Hard Bottom-Microbialite/Rock talus
84.70%
3Soft Bottom-Sediment with rock inclusions 67.50%
4 Soft Bottom-Sediment 47.70%
5 Soft Bottom-Sediment 64.90%
6 Acoustic Noise 77.80%
Figure 8. North Basin, Central Basin, and South Basin slope 5-25° highlighted green. The blue area is slope greater than 25°, and the gray area is slope less than 5°.

58 A.C. TREMBANIS, J.R. GUTSCHE
disCussion
The results qualitatively suggest a correlation betwe-en microbialite habitat and depth, slope, and rugosity. Classification one (Hard Bottom-microbialite/rock ta-lus and sediment) and two (Hard Bottom-microbiali-te/rock talus) represent the areas of the lake where the majority of the microbialite growth was found. Althou-gh the areas highlighted by these classifications are not strictly microbialite formations, it can be understood that these regions highlight the present location of microbialite growth as well as potential areas of fu-ture microbialite growth. The high-resolution photos collected by the DeepWorker allow for the classified areas to be differentiated. As can be seen in the ima-ges collected by the DeepWorker submersible, Figu-re 6, erosional deposits of cobble sized rock material appear similar to microbialite growth. The collected sonar data was not capable of differentiating between areas of rock talus and microbialite growth. The high-resolution photos collected by the DeepWorker allow for the classified areas to be differentiated. These simi-larities make QTC Swathview incapable of identifying microbialite growth and rock deposits as separate clas-sifications. Without the high resolution photographs taken by the Deep Worker submersibles, determining the difference between rock and microbialite cannot be completed using sonar data alone. This inability to distinguish microbialites from rocks in the sonar data removes the possibility of estimating lake-bottom sur-face area coverage by microbialite by sonar data alone.
ConClusion
The results of this investigation indicate that the acou-stic data collected using a GAVIA AUV survey plat-form has a high capacity for building bottom-type clas-sification structures. Using Autonomous Underwater Vehicles (AUVs) as exploration platforms to conduct surveys of the lake bottom, very high-resolution sonar data was and analyzed. This success is also partly due to the extensive backlog of mission photographs col-lected by the DeepWorker submersible for a means of ground-truthing. By analyzing the dense phase mea-suring bathymetric sonar of the lake bottom, with re-spect to slope and rugosity, it was possible to map the morphological trends of the stromatolites. The bathy-metric data was compiled to create a base map of the floor of Pavilion Lake. This data is gridded at a very high resolution, 25cm. The bathymetry data allowed analysis of bed forms within Pavilion Lake, as well as any erosional episodes that may affect the growth of microbialites. Backscatter data was also collected and processed. The backscatter data shows the strength of the sonar return, and in turn the density of the base
material. The backscatter data allows the researcher to differentiate between soft sediment erosional depo-sits and hard bottom microbialite morphologies. The combination of backscatter and bathymetry allows for a further understanding of bedforms and microbiali-te growth patterns. A key finding from this investiga-tion is that the majority of the areas within Pavilion Lake, which are rich in microbialite growth, are found within a slope ranging between 5 and 25° and range in depth from 0-30 m.
ACknowledGements
Funding for this project was provided from a NASA grant to A. Trem-banis. We greatly appreciate the field assistance of Dr. Alex Forrest, Dr. Stephanie Nebel, Dr. Bernard Laval, and Dr. Andrew Hamilton.
referenCes
Andres M.S., reid R.P., 2006. Growth Morphologies of Modern Marine Stromatolites: A case study from Highborne Caye, Ba-hamas. Sedimentary Geology 185: 319-328.
AwrAmik S.M., sChoPf J.W., wAlter M.R., 1983. Filamentous fossil bacteria from the Archean of Western Australia. Precam-brian Research 20: 357-374.
AwrAmik S.M., 1984. Ancient stromatolites and microbial mats. In: Cohen Y., Castenholz R.W., Halvorson H.O. (eds.), Micro-bial Mats: Stromatolites. Alan R. Liss, Inc, NY USA: 1-22.
brAdy A.l., slAter G.f., omelon C.r., southAm G., drusChel G., Andersen d. t., hAwes i., lAvAl b., lim d.s.s., 2010. “Photosynthetic Isotope Biosignatures in Laminated Micro-Stromatolitic and Non-Laminated Nodules Associated with Modern, Freshwater Microbialites in Pavilion Lake, B.C.” Chemical Geology 274(1-2): 56-67.
burrouGh P.A., mCdonell r.A., 1998. Principles of Geographical Information Systems. New York: Oxford University Press.
forrest A.l., trembAnis A.C., todd w.l., 2012. Ocean Floor Mapping as a Precursor for Space Exploration. Journal of Oce-an Technology 7(2): 71-87.
friedmAn A., PizArro o., williAms s.b., Johnson-roberson m., 2012. Multi-Scale Measures of Rugosity, Slope and Aspect from Benthic Stereo Image Reconstructions. PLoS ONE 7(12): e50440. doi:10.1371/journal.pone.0050440.
Jenness, J. 2004. Calculating landscape surface area from digital elevation models. Wildlife Society Bulletin 32(3): 829-839.
lAvAl b., CAdy s. l., PollACk J. C., mCkAy C.P., bird J.s., GrotzinGer J.P., ford d.C., bohm h.r., 2000. Modern freshwater microbialite analogues for ancient dendritic reef structures. Nature 405: 626-629.
lim d.s.s., lAvAl b. e., slAter G.f., AntoniAdes d., forrest A., Pike w., Pieters r., sAffAri m., reid d., Andersen d., mCkAy C.P., 2009. Limnology of Pavilion Lake B.C. - Cha-racterization of a microbialite forming environment. Funda-mental and Applied Limnology, 173(4): 329-351.
lim d.s.s., brAdy A.l., And PlrP teAm (AberCromby A.f., Andersen d.t., Andersen m., Arnold r.r., bird J.s., bohm h.r., booth l., CAdy s.l., CArdmAn z., ChAn
SPATIAL DISTRIBUTION AND CHARACTERISTICS OF MICROBIALITES THROUGH THE USE OF SONAR TECHNIQUES 59
A.m., ChAn o., ChénArd C., Cowie b.r., dAvilA A., de-Ans m.C., deArinG w., delAney m., downs m., fonG t., forrest A., GernhArdt m.l., GutsChe J.r., hAdfield C., hAmilton A., hAnsen J., hAwes i., heAton J., imAm y., lAvAl b.l., lees d., leoni l., looPer C., love s., mAri-novA m.m., mCCombs d., mCkAy C.P., mireAu b., mullins G., nebel s.h., nuytten P., Pendery r., Pike w., PointinG s.b., PollACk J., rAineAult n., reAy m., reid d., sAllstedt t., sChulze-mAkuCh d., seibert m., shePArd r., slAter G.f., stonehouse J., sumner d.y., suttle C.A., trembA-nis A.C., turse C., wilhelm m., wilkinson n., williAms d., winGet d.m., winter C.), 2011. A historical overview of the Pavilion Lake Research Project—Analog science and exploration in an underwater environment, in Garry, W.B., and Bleacher, J.E., eds., Analogs for Planetary Exploration: Geological Society of America Special Paper 483, p. 85–115, doi:10.1130/2011.2483(07).
lim d.s.s., wArmAn G.l., GernhArdt m.l., mCkAy C.P., fonG t., mArinovA m.m., dAvilA A.f., Andersen d., brAdy A.l., CArdmAn z., Cowie b., delAney m.d., fAirén A.G., for-rest A.l., heAton J., lAvAl b.e., Arnold r., nuytten P., osinski G., reAy m., reid d., sChulze-mAkuCh d., she-PArd r., slAter G.f., williAms d., 2010. Scientific Field Trai-ning for Human Planetary Exploration. Planetary and Space Science 58(6): 920-930.
lowe d.r., 1980. Stromatolites: 3400-Myr old from the Archean of Western Australia. Nature 284: 441-443.
mullins G.k., bird J.s., 2007. 3D Sidescan with a Small Apertu-re: Imaging Microbialites at Pavilion Lake, IEEE Oceans 07, Vancouver.
Preston J., 2009. Automated acoustic seabed classification of multibeam images of Stanton Banks. Applied Acoustics 70: 1227-1287.
Preston J.m., Christey A.C., bloomer s.f., beAudet i.l., 2001. Seabed classification of multibeam sonar images. Proceedings of the MTS/IEEE Conference ‘01.
rAineAult n.A., trembAnis A.C., miller d.C., 2012. Mapping benthic habitats in Delaware Bay and the coastal Atlantic: acoustic techniques provide greater coverage and high reso-lution in complex shallow water environments. Estuaries and Coasts 35(2): 682-699.
subrAmAniAm s., bArAd h., mArtinez A.b., bourGeois b., 1993. Seafloor Characterization using Texture. Southeastcon ‘93, Proceedings., IEEE, pp. 8.
trembAnis AC, forrest Al, keller bm and PAtterson MR, 2017. Mesophotic Coral Ecosystems: A Geoacoustically Deri-ved Proxy for Habitat and Relative Diversity for the Leeward Shelf of Bonaire, Dutch Caribbean. Frontiers of Marine Scien-ces 4:51. doi: 10.3389/fmars.2017.00051.
trembAnis A.C., forrest A.l., miller d.C., lim d.s.s., Ger-nhArdt m. l., todd w.l., 2012. Multiplatform Ocean Ex-ploration: insights from the NEEMO Space Analog Mission. Marine Technology Society Special Issue on Ocean Exploration 46(4): 7-19.
wAlter m.r., buiCk r., dunloP J.s.r., 1980. Stromatolites 3400-3500 m.y. old from North Pole area, Western Australia. Nature 284: 443-445.
williAms s.b., PizArro o., webster J.m., beAmAn r.J., mA-hon i., Johnson-roberson m., bridGe t.C.l., 2010. Auto-nomous underwater vehicle–assisted surveying of drowned reefs on the shelf edge of the Great Barrier Reef, Australia. Journal of Field Robotics 27: 675-697.
(ms. pres. 14 novembre 2018; ult. bozze 31 ottobre 2019)


Edizioni ETSPalazzo Roncioni - Lungarno Mediceo, 16, I-56127 Pisa
[email protected] - www.edizioniets.comFinito di stampare nel mese di dicembre 2019
Serie_b_126/2019BN.indb 100 10/03/20 08:11