atp bioluminescence to establish a test procedure for hygiene … · the aim of this study was to...
TRANSCRIPT
Sveriges lantbruksuniversitet Fakulteten för veterinärmedicin och husdjursvetenskap Swedish University of Agricultural Sciences Faculty of Veterinary Medicine and Animal Science
ATP bioluminescence to establish a test procedure for hygiene testing of liners and
tubes on farm level
An investigation of the effect of ageing on the hygienic status of rubber liners and tubes
Ida Clemensson Lindell
Examensarbete / SLU, Institutionen för husdjurens utfodring och vård, 511
Uppsala 2015 Degree project / Swedish University of Agricultural Sciences, Department of Animal Nutrition and Management, 511
Examensarbete, 30 hp Masterarbete Husdjursvetenskap
Degree project, 30 hp Master Thesis Animal Science

Sveriges lantbruksuniversitet Fakulteten för veterinärmedicin och husdjursvetenskap Institutionen för husdjurens utfodring och vård Swedish University of Agricultural Sciences
Faculty of Veterinary Medicine and Animal Science Department of Animal Nutrition and Management
ATP bioluminescence to establish a test procedure for hygiene testing of liners and tubes on farm level An investigation of the effect of ageing on the hygienic status of rubber liners and tubes Ida Clemensson Lindell Handledare:
Supervisor: Åse Lundh, SLU, Department of Food Science
Ass. Supervisor: Marika Cederholm, DeLaval Examinator:
Examiner: Kerstin Svennersten Sjaunja, SLU, Department of Animal Nutrition and Management
Omfattning:
Extent: 30 hp Kurstitel:
Course title: Degree project in Animal Science
Kurskod: Course code: EX0551 Program: Agronomprogrammet - Husdjur
Programme:
Nivå:
Level: Advanced A2E Utgivningsort:
Place of publication: Uppsala
Utgivningsår:
Year of publication: 2015 Serienamn, delnr: Examensarbete / Sveriges lantbruksuniversitet, Institutionen för husdjurens utfodring och
vård, 511 Series name, part No: On-line publicering: http://epsilon.slu.se On-line published: Nyckelord: Key words: ATP bioluminescence, milking equipment hygiene, milk quality, ageing milking
equipment, total bacterial count

Abstract When rubber equipment in a milking system ages, physical and chemical deterioration occurs and cracks, crevices, as well as deposits of organic and inorganic material is formed on the surface. Bacterial colonization can accumulate, especially on ageing rubber equipment and if the cleaning procedure is not functioning properly. Formation of biofilm in milking equipment could in turn cause bacterial contamination of bulk tank milk. ATP bioluminescence is a fast and easy way to determine the hygienic status of a surface based on its ATP content, and results are given in relative light units (RLU). The method measures both bacterial contamination as well as residues from other organic material. ATP bioluminescence has previously been assessed in order to investigate the hygienic status of milking equipment but large variations between measurements have been seen and correlations between RLU values and total bacterial count (CFU) have shown deviating results. The aim of this study was to use ATP bioluminescence to establish a test procedure for hygiene testing of liners and tubes that would give reliable and reproducible results. The study also aimed to investigate whether the hygienic status deteriorated as rubber liners and tubes aged and if it was possible to set thresholds for RLU values that could determine when liners should be replaced, based on their hygienic status. The study was carried out on three Swedish farms with milking parlours and the total study period was 7 months. To establish a standard test procedure, several sampling parameters were tested on one of the farms and the effect of each parameter on the obtained RLU values was assessed. The final test procedure was then used on the three farms as liners aged for at least 2400 milkings, and as tubes aged for up to 6 months. CFU was determined for comparison with RLU values on one farm during the whole study, and occasional samples for comparison between CFU and RLU were also taken on another farm. The results showed that RLU values were significantly affected by sampling location on the liner or tube, type of detergent and milk point in the parlour. Liners on the same cluster could show large variations in RLU values, making it difficult to obtain a high reproducibility between measurements. RLU values declined on all three farms when the equipment aged, which may have been due to seasonal effects or that detergent residues quenched the ATP readings. The results from the study indicated that liners and tubes can maintain a clean hygienic status despite ageing- if the cleaning procedure is efficient. There was a strong significant correlation between CFU and RLU (r=0.83, p<0.0001). The study also showed that RLU values are individual for each farm and that high RLU values can be obtained even when the number of CFU is low, due to other organic debris such as milk residues remaining in the equipment. Because of individual differences between farms, it was not possible to propose a general threshold RLU level indicating when aged milking equipment should be replaced. Keywords: ATP bioluminescence, milking equipment hygiene, milk quality, ageing milking equipment, total bacterial count
Sammanfattning
När mjölkningsutrustning av gummi åldras bildas sprickor och både organiskt och oorganiskt material ansamlas successivt på gummits yta. Bakterier kan då tillväxa, speciellt om disken är undermålig. Biofilm som bildas i mjölkningsutrustningen kan i sin tur ge förhöjda bakterietal i tankmjölken. För att snabbt ta reda på hur kontaminerad en yta är avseende bakterier så väl som annat organiskt material kan man använda ATP bioluminescence, en metod som mäter mängden ATP i enheten relativa ljusenheter (RLU). I tidigare studier där man har använt ATP bioluminescence för att undersöka den hygieniska statusen i mjölkningsutrustning har det funnits en stor variation mellan mätningar och korrelationen mellan totalantalet bakterier (CFU) och RLU har varierat. Syftet med denna studie var att använda ATP bioluminescence för att etablera en provtagningsmetodik för hygientester av spengummin och mjölkslangar, som skulle generera repeterbara och tillförlitliga resultat. Ytterligare ett syfte var att undersöka om den hygieniska statusen hos spengummin och mjölkslangar förändrades över tid samt om det var möjligt att bestämma gränsvärden för RLU-värden som kunde avgöra när åldrade spengummin bör bytas ut. Studien genomfördes som en fältstudie på tre svenska gårdar med mjölkgrop och pågick under sammanlagt sju månader. För att etablera en provtagningsmetodik testades flera parametrar på en av gårdarna för att se hur dessa påverkade RLU värdena. Den etablerade provtagningsmetodiken användes på alla tre gårdarna för att följa den hygieniska trenden när spengummin åldrades under minst 2400 mjölkningar och när mjölkslangar åldrades upp till 6 månader. På en av gårdarna skattades totalantalet bakterier (CFU) parallellt med RLU under hela studien och på en annan gård togs jämförande prover mellan CFU och RLU. Resultaten visade att RLU-värdena i en mjölkgrop påverkades signifikant av provtagningsplats på spengummit eller i mjölkslangen, typ av diskmedel samt mjölkningsplats i gropen. Spengummin från samma mjölkningsorgan kunde uppvisa stora skillnader i RLU-värden och det var därför svårt att uppnå en hög reproducerbarhet mellan mätningarna. RLU-värdena minskade över tid vilket kan ha varit en effekt av säsong eller att diskmedelsrester på den svabbade ytan påverkade ATP avläsningen negativt. Resultaten från studien indikerade att spengummin och mjölkslangar kan bibehålla en ren hygienisk status när de åldras, om disken fungerar effektivt. En stark korrelation fanns mellan CFU och RLU (r=0,83, p<0,0001) och det var tydligt att en förändring i RLU följdes av en liknande förändring i CFU genom hela studien. Studien visade även att RLU värden är unika för varje gård och att höga RLU värden kan erhållas även när CFU är lågt om det finns annat organiskt material på den svabbade ytan. Eftersom värdena skiljde sig mellan gårdar var det inte möjligt att sätta generella gränsvärden som indikerar när åldrad mjölkningsutrustning bör bytas ut. Nyckelord: ATP bioluminescence, hygien i mjölkningsutrustning, mjölkkvalitet, åldrande mjölkningsutrustning, totalantal bakterier
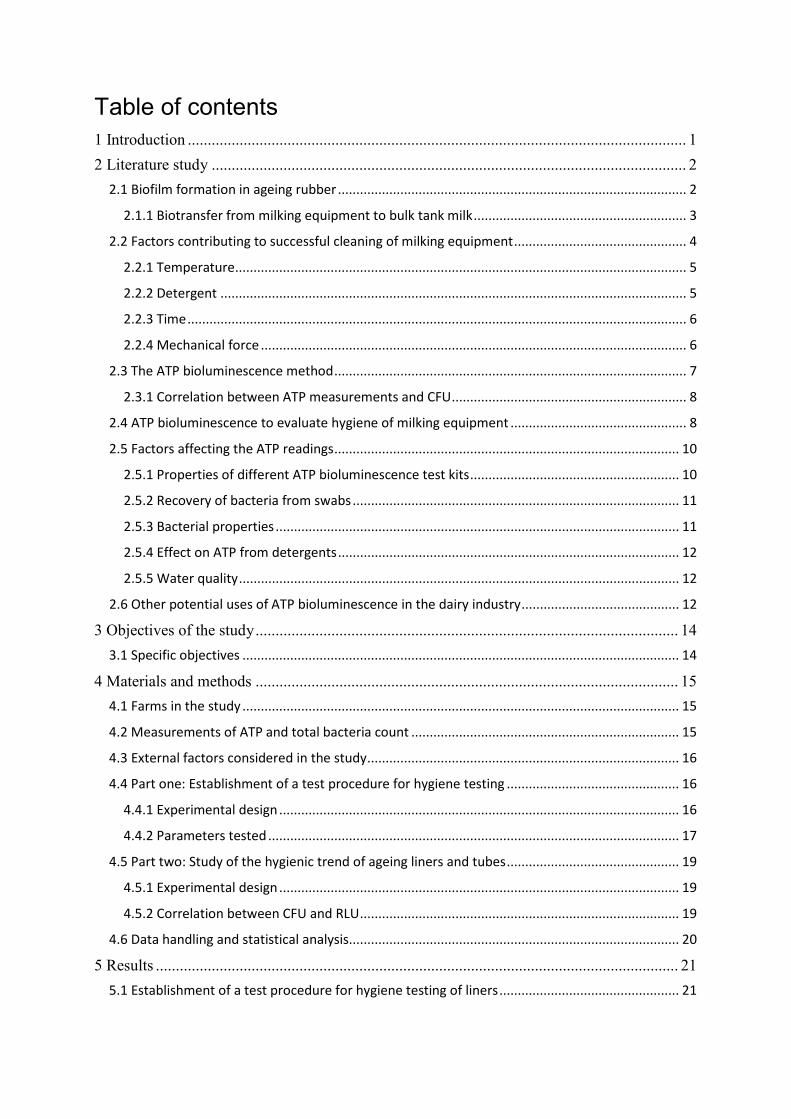
Table of contents 1 Introduction ............................................................................................................................. 1
2 Literature study ....................................................................................................................... 2
2.1 Biofilm formation in ageing rubber ............................................................................................... 2
2.1.1 Biotransfer from milking equipment to bulk tank milk .......................................................... 3
2.2 Factors contributing to successful cleaning of milking equipment ............................................... 4
2.2.1 Temperature ........................................................................................................................... 5
2.2.2 Detergent ............................................................................................................................... 5
2.2.3 Time ........................................................................................................................................ 6
2.2.4 Mechanical force .................................................................................................................... 6
2.3 The ATP bioluminescence method ................................................................................................ 7
2.3.1 Correlation between ATP measurements and CFU ................................................................ 8
2.4 ATP bioluminescence to evaluate hygiene of milking equipment ................................................ 8
2.5 Factors affecting the ATP readings .............................................................................................. 10
2.5.1 Properties of different ATP bioluminescence test kits ......................................................... 10
2.5.2 Recovery of bacteria from swabs ......................................................................................... 11
2.5.3 Bacterial properties .............................................................................................................. 11
2.5.4 Effect on ATP from detergents ............................................................................................. 12
2.5.5 Water quality ........................................................................................................................ 12
2.6 Other potential uses of ATP bioluminescence in the dairy industry ........................................... 12
3 Objectives of the study .......................................................................................................... 14
3.1 Specific objectives ....................................................................................................................... 14
4 Materials and methods .......................................................................................................... 15
4.1 Farms in the study ....................................................................................................................... 15
4.2 Measurements of ATP and total bacteria count ......................................................................... 15
4.3 External factors considered in the study ..................................................................................... 16
4.4 Part one: Establishment of a test procedure for hygiene testing ............................................... 16
4.4.1 Experimental design ............................................................................................................. 16
4.4.2 Parameters tested ................................................................................................................ 17
4.5 Part two: Study of the hygienic trend of ageing liners and tubes ............................................... 19
4.5.1 Experimental design ............................................................................................................. 19
4.5.2 Correlation between CFU and RLU ....................................................................................... 19
4.6 Data handling and statistical analysis .......................................................................................... 20
5 Results ................................................................................................................................... 21
5.1 Establishment of a test procedure for hygiene testing of liners ................................................. 21
5.1.1 Results from testing different sampling parameters on liners ............................................ 21
5.1.2 Summary: Established test procedure for liners .................................................................. 24
5.2 Establishment of a test procedure for hygiene testing of tubes ................................................. 24
5.2.1 Results from testing different sampling parameters on tubes ............................................ 24
5.2.2 Summary: Established test procedure for tubes .................................................................. 26
5.3 Hygienic trend of liners and tubes .............................................................................................. 26
5.3.1 Hygienic trend on farm A ..................................................................................................... 26
5.3.2 Hygienic trend on farm B ...................................................................................................... 29
5.3.3 Hygienic trend on Farm C ..................................................................................................... 30
5.3.4 Correlation between CFU and RLU on farm C ...................................................................... 32
6 Discussion ............................................................................................................................. 34
7 Conclusions ........................................................................................................................... 38
8 Future perspectives ................................................................................................................ 39
9 Acknowledgements ............................................................................................................... 39
10 References ........................................................................................................................... 40
1 Introduction
Microbial contamination of milk can be derived from three major sources; within the udder, the exterior of the teats and udder, and from the milking and storage equipment (Bramley & McKinnon, 1990). Two factors that contribute to microbial contamination of milking equipment are insufficient cleaning and hygiene (Nieuwenhof, 1996; Slaghuis & Wiegersma, 1996) as well as aged rubber material, such as in liners and tubes, where biofilm can be formed (Teixeira et al. 2005; Hillerton et al. 2004). One of the rubber parts of a milking machine that deteriorate most rapidly are teat-cup liners (Clegg, 1962). As liners age, their milking performance deteriorate (Davis & Reinemann, 2001), and the chemical composition of the rubber material change. This causes cracks and deposits of organic as well as inorganic material on the surface which makes the equipment more prone to cleaning failures. For these reasons, teat cup liners in rubber usually have a recommended maximum life of up to 2500 milking’s (Boast et al. 2008; Hillerton et al. 2004). If cleaning and sanitation of milking equipment is not properly executed, bacteria that are deposited in the equipment will multiply and can become a major source of raw milk contamination (Reinemann & Ruegg, 2000). When cleaning milking equipment on the farm, clean-in-place (CIP) methods are most often used. CIP is an automated method of cleaning that involves little or no dismantling of piping or equipment and it is usually based on a combination of alkaline and acid treatment (Storgards et al. 1999a). However, the complexity of milking machines and their components may lead to failures in cleaning and disinfection even when CIP programs have been correctly applied (Teixeira et al. 2005). Milking equipment is usually not uniformly contaminated; bacteria and milk residues accumulate in areas that are difficult to clean, as well as in parts of badly designed components, and except in very cold weather, these bacteria will multiply between milking’s and their number may rapidly increase (Bramley & McKinnon, 1990). To ensure that milk is of high hygienic quality it is of importance to prevent biofilm formation in milking equipment. Once a biofilm is established, it can act as a source of contamination due to release of microorganisms to the bulk tank milk and this is a cause for concern in the food process industry (Teixiera et al. 2005; Hood & Zottola, 1995). Hygiene in the milking routine, correct implementation of milking equipment, cleaning protocols and replacing materials in the milking equipment that are susceptible to wear on a regular basis is of importance to prevent biofilm formation (Latorre et al. 2010). In order to determine the hygienic status of milking equipment, ATP bioluminescence has shown potential to be a fast and easy tool (Meyer & Schmidt, 1997; Vilar et al. 2008; Reinemann & Ruegg, 2000). The method indirectly measures the amount of microorganisms in a sample, and in contrast to traditional plate count methods, the results are obtained within minutes and no laboratory skills are necessary. Previous studies investigating the correlation between ATP levels in milking equipment and total bacterial count in equipment or bulk tank milk have shown deviating results and large variations between measurements have been seen when using ATP bioluminescence to field test milking equipment (Benfalk et al. 2001; Reinemann & Ruegg, 2000; Slaghuis & Wiegersma, 1996). In the following study, ATP bioluminescence was used to establish and verify a test procedure for hygiene testing of liners and tubes on farm level. It was also investigated whether the hygienic status of liners and tubes deteriorated when the rubber material aged.
1
2 Literature study
The literature study will begin with describing what happens to the rubber material in a milking system when it ages, and how this is associated to biofilm formation and contamination of bulk tank milk. Further on, the most important factors for a successful CIP procedure of a milking system will be brought up. The basic principles of ATP bioluminescence will be presented and this leads on to a review of previous studies using ATP bioluminescence to assess hygiene in a milking system. Factors that may affect the ATP readings will be outlined as well as other potential uses of the ATP bioluminescence technique for the dairy industry.
2.1 Biofilm formation in ageing rubber
A newly installed rubber component in a milking system has a smooth surface; however, due to actions of light, oxygen and fat, degeneration will occur progressively. Attack by ozone can induce crack initiation on the rubber surface, which then propagates as a result of flexing (Mark et al. 2013; Boast et al. 2008). Today, nitrile is the most common rubber compound used for liners but silicone formulations are also used to a minor extent (Hillerton et al. 2004). A study by Storgards et al. (1999b) investigated different rubber materials and the effect of ageing, susceptibility to biofilm formation and cleanability for up to 432 repeated CIP cycles in a dairy processing environment, as well as in a laboratory. Clear physical signs of deterioration were seen on the aged materials, such as a rougher surface structure and cracks on NBR (nitrile butyl rubber, also known as Buna-N) and Viton (fluoroelastomer). All materials showed a reduced cleanability with increasing age, though NBR was especially susceptible to biofilm formation. PTFE (polytetrafluoroethylene) was the material most resistant to ageing. Biofilm formation was also found after completed CIP procedures on new materials (Storgards et al. 1999a). In a study by Hillerton et al. (2004) it was found that after approximately 1500 milkings, the inner surface of the liner barrel had a crazed appearance with a layer of finely structured material present, consisting of calcium and phosphate. Hillerton et al. (2004) also stated that the swelling of the liner from milk fat was concentrated in the area where the liner contacts the teat end. The surface structure of rubber on a milking liner at different stages of ageing can be seen in Figure 1, and the different parts of a liner are illustrated in Figure 2.
Figure 1: Scanning electron micrographs of a liner barrel at different numbers of milkings (Hillerton et al. 2004).
In another study by Boast et al. (2008), liners were aged for up to 4000 milkings. A considerable amount of butterfat had been absorbed by the aged liners, and the inner surface of the liner barrel was coated with calcium, phosphorous and other organic material. Different
2
areas of the liner had aged in different ways and the maximum changes in chemical and physical properties occurred in the region 40-60 mm from the top of the liner. In this area, the surface roughness was at its highest, and circumferential, longitudinal and diagonal cracks in the liner were found. Approximately 50 mm from the liner mouthpiece, the antidegradent 6PPD, which will protect the rubber from ozone cracking, was entirely removed.
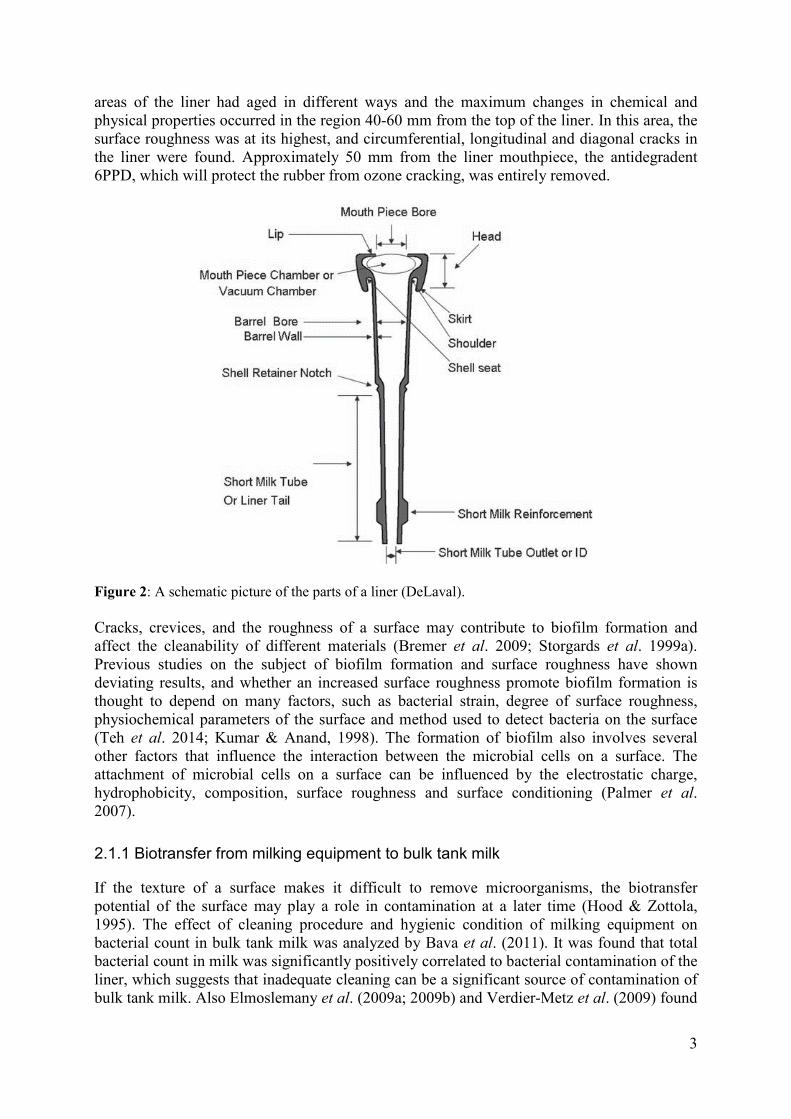
Figure 2: A schematic picture of the parts of a liner (DeLaval). Cracks, crevices, and the roughness of a surface may contribute to biofilm formation and affect the cleanability of different materials (Bremer et al. 2009; Storgards et al. 1999a). Previous studies on the subject of biofilm formation and surface roughness have shown deviating results, and whether an increased surface roughness promote biofilm formation is thought to depend on many factors, such as bacterial strain, degree of surface roughness, physiochemical parameters of the surface and method used to detect bacteria on the surface (Teh et al. 2014; Kumar & Anand, 1998). The formation of biofilm also involves several other factors that influence the interaction between the microbial cells on a surface. The attachment of microbial cells on a surface can be influenced by the electrostatic charge, hydrophobicity, composition, surface roughness and surface conditioning (Palmer et al. 2007).
2.1.1 Biotransfer from milking equipment to bulk tank milk
If the texture of a surface makes it difficult to remove microorganisms, the biotransfer potential of the surface may play a role in contamination at a later time (Hood & Zottola, 1995). The effect of cleaning procedure and hygienic condition of milking equipment on bacterial count in bulk tank milk was analyzed by Bava et al. (2011). It was found that total bacterial count in milk was significantly positively correlated to bacterial contamination of the liner, which suggests that inadequate cleaning can be a significant source of contamination of bulk tank milk. Also Elmoslemany et al. (2009a; 2009b) and Verdier-Metz et al. (2009) found
3
that the hygiene of milking equipment had an influence on bacterial count in bulk tank milk and that high numbers in bulk tank milk was mainly related to equipment hygiene. The presence of Listeria monocytogenes in milking equipment was studied by Latorre et al. (2009; 2010) who stated that when bacteria establish themselves in a milking system as a biofilm, detachment from this biofilm could possibly result in their presence in bulk tank milk. In addition to this, the frequency by which liners are changed can affect the total bacterial score in bulk tank milk. Kelly et al. (2009) looked at farms that changed liners more than once a year, or less than once a year, and found that when the frequency of liner changing increased, the total bacterial count decreased. In a field trial conducted by Falkenberg et al. (2005), microbial colonization in a newly installed milking parlour was investigated. The authors found that season and position of sampling had significant effects on microbial colonization where the winter season had lower numbers from the plate count compared to the summer season. Also Elmoslemany et al. (2010) found season to be strongly associated with total aerobic count (TAC), laboratory pasteurization count (LPC) and coliform count (CC) of bulk tank milk, where the summer had higher levels of bacteria. According to Elmoslemany et al. (2010), higher numbers of bacteria during summer can be related to higher ambient temperatures which allow bacteria to grow faster. Soler et al. (1995) found the same seasonal trend and stated that the higher temperature during summer may enhance microbial growth on milking equipment, especially under conditions of improper cleaning and sanitation of milking equipment.
2.2 Factors contributing to successful cleaning of milking equipment
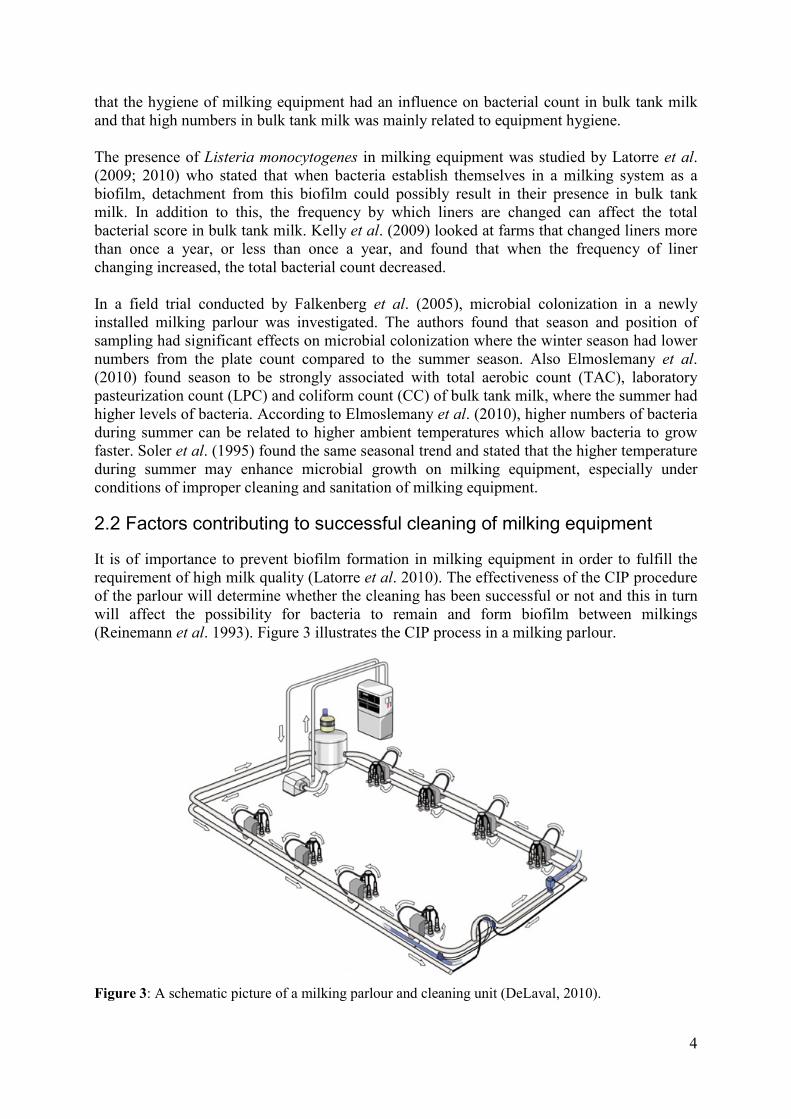
It is of importance to prevent biofilm formation in milking equipment in order to fulfill the requirement of high milk quality (Latorre et al. 2010). The effectiveness of the CIP procedure of the parlour will determine whether the cleaning has been successful or not and this in turn will affect the possibility for bacteria to remain and form biofilm between milkings (Reinemann et al. 1993). Figure 3 illustrates the CIP process in a milking parlour.
Figure 3: A schematic picture of a milking parlour and cleaning unit (DeLaval, 2010).
4
There are four major factors that contribute to a successful CIP procedure of milking equipment (Teh et al. 2014; Reinemann et al. 2003; Christiansson et al. 2011; Gibson et al. 1999); 1) Thermal factor, the temperature of the water used for cleaning 2) Chemical factors, type and concentration of detergent 3) Time, how long each step of the cleaning procedure lasts 4) Physical factors, the mechanical turbulence in the water used for cleaning Up to a certain point, the factors can compensate in losses for each other, for example, a lower temperature can be compensated by a higher concentration of detergent (Reinemann et al. 2003). The CIP procedure may differ between countries, but common steps for much of Europe include a pre-rinse, main-rinse with acid or alkali detergent, post-rinse and lastly drainage (Christiansson et al. 2011; Reinemann et al. 2003).
2.2.1 Temperature
During the different phases of the CIP procedure in a milking parlor, the temperature of the water must be kept within certain intervals, which differ slightly between countries. The temperature during pre-rinse should be between 35-40 ̊C in order to warm up the system and to ensure that the water used for the main washing cycle is not cooled down too much. For the main washing cycle, the start temperature of the water should not be below 80 ̊C as the temperature will decrease with 10-15 ̊C already after the first circulation in the parlour system (Christiansson et al. 2011). A study by Sundberg et al. (2009) found that the temperature in the system during the main rinse should not decrease to less than 55 ̊C in order to obtain a maximum reduction of bacterial spores. The returning water should have a temperature that does not fall below 42-45 ̊C, as this will result in hardening of milk fat. It is important that milk fat is kept in a soluble form for it to be successfully removed from the system (Christiansson et al. 2011).
2.2.2 Detergent
The purpose of using chemical detergents is to break down dirt and reduce its attachment strength, in order to enable removal from the surface (Gibson et al. 1999). The two main types of detergents used for cleaning of milking equipment are alkali and acid detergents. Other than that, disinfectants are sometimes used with the purpose of reducing viability of the microbes that remain after cleaning (Gibson et al. 1999; Reinemann et al. 2003). Alkali and acid detergents serve different purposes, where the alkali detergent dissolves organic compounds, such as milk fat and protein, whereas acid detergent dissolves inorganic deposits, such as minerals from water and milk (Christiansson et al. 2011; Reinemann et al. 2003). The chemical effect from detergents increases linearly with temperature (Gibson et al. 1999). This effect can also be seen in Figure 4, where an increased temperature is required in order to remove biofilm when using acid or alkali detergent in a situation where there is no turbulence in the water. Gibson et al. (1999) found that the use of detergents did not have any significant effect on removal of bacteria, but both alkali and acid detergent had a significant effect on the viability of bacteria. The authors also stated that the role of detergents in removal of bacteria may be more significant when food residues are present, as microorganisms may be attached to these residues, which can in turn be removed by appropriate detergents. Further on,
5
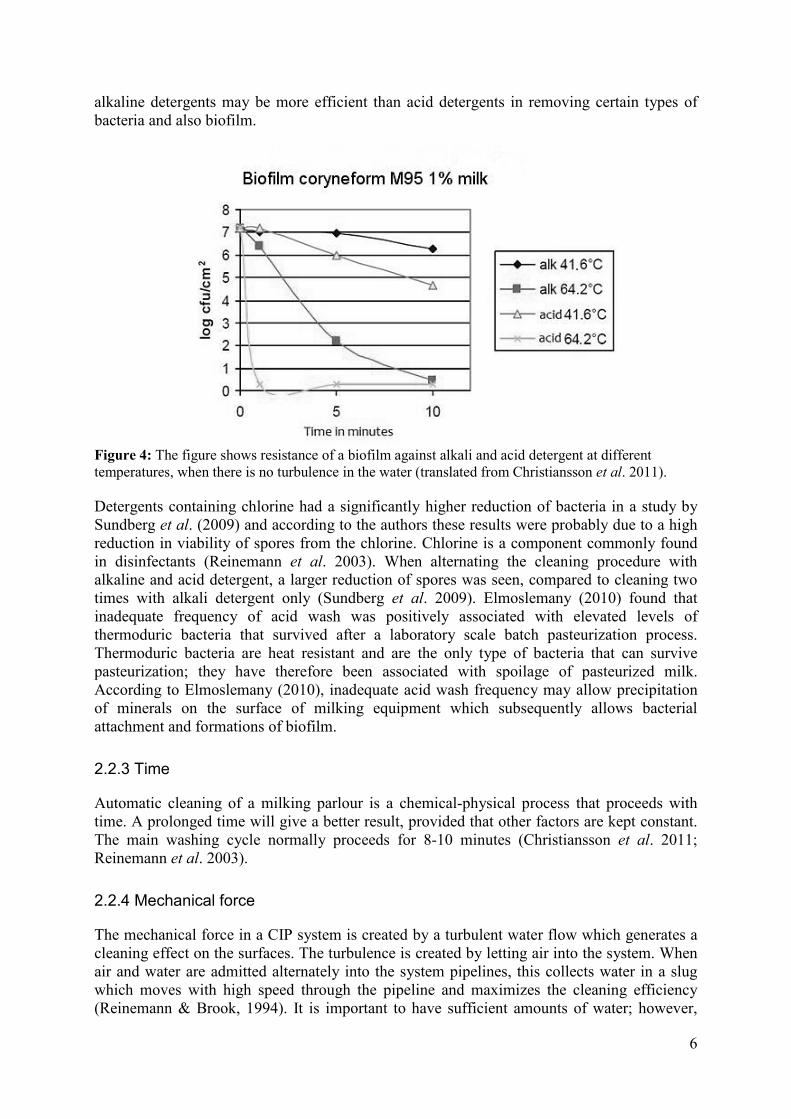
alkaline detergents may be more efficient than acid detergents in removing certain types of bacteria and also biofilm.
Figure 4: The figure shows resistance of a biofilm against alkali and acid detergent at different temperatures, when there is no turbulence in the water (translated from Christiansson et al. 2011). Detergents containing chlorine had a significantly higher reduction of bacteria in a study by Sundberg et al. (2009) and according to the authors these results were probably due to a high reduction in viability of spores from the chlorine. Chlorine is a component commonly found in disinfectants (Reinemann et al. 2003). When alternating the cleaning procedure with alkaline and acid detergent, a larger reduction of spores was seen, compared to cleaning two times with alkali detergent only (Sundberg et al. 2009). Elmoslemany (2010) found that inadequate frequency of acid wash was positively associated with elevated levels of thermoduric bacteria that survived after a laboratory scale batch pasteurization process. Thermoduric bacteria are heat resistant and are the only type of bacteria that can survive pasteurization; they have therefore been associated with spoilage of pasteurized milk. According to Elmoslemany (2010), inadequate acid wash frequency may allow precipitation of minerals on the surface of milking equipment which subsequently allows bacterial attachment and formations of biofilm.
2.2.3 Time
Automatic cleaning of a milking parlour is a chemical-physical process that proceeds with time. A prolonged time will give a better result, provided that other factors are kept constant. The main washing cycle normally proceeds for 8-10 minutes (Christiansson et al. 2011; Reinemann et al. 2003).
2.2.4 Mechanical force
The mechanical force in a CIP system is created by a turbulent water flow which generates a cleaning effect on the surfaces. The turbulence is created by letting air into the system. When air and water are admitted alternately into the system pipelines, this collects water in a slug which moves with high speed through the pipeline and maximizes the cleaning efficiency (Reinemann & Brook, 1994). It is important to have sufficient amounts of water; however,
6
too much water will decrease the formation of water slugs, which are important for the turbulence (Christiansson et al. 2011). When washing a milking parlour system, it can be a problem to obtain an adequate and even distribution of water to all units (Reinemann & Brook, 1994). The water flow in the milking system can show a large variation, with excessive flow through the first units and little or no flow through the units at the end of the line, if no attempt is made to adjust the flow. By ensuring that mechanical forces are used to their greatest advantage, energy consumption and usage of chemicals and water can be reduced and this is beneficial from an environmental point of view (Reinemann et al. 2003). In a study by Gibson et al. (1999) it was found that the mechanical force from some types of cleaning techniques with a high kinetic energy was significantly affecting the removal of biofilm. A study by Sundberg et al. (2009) found that the mechanical force resulted in a greater reduction of spores compared to the chemical detergents- with the exception of chlorine detergents.
2.3 The ATP bioluminescence method
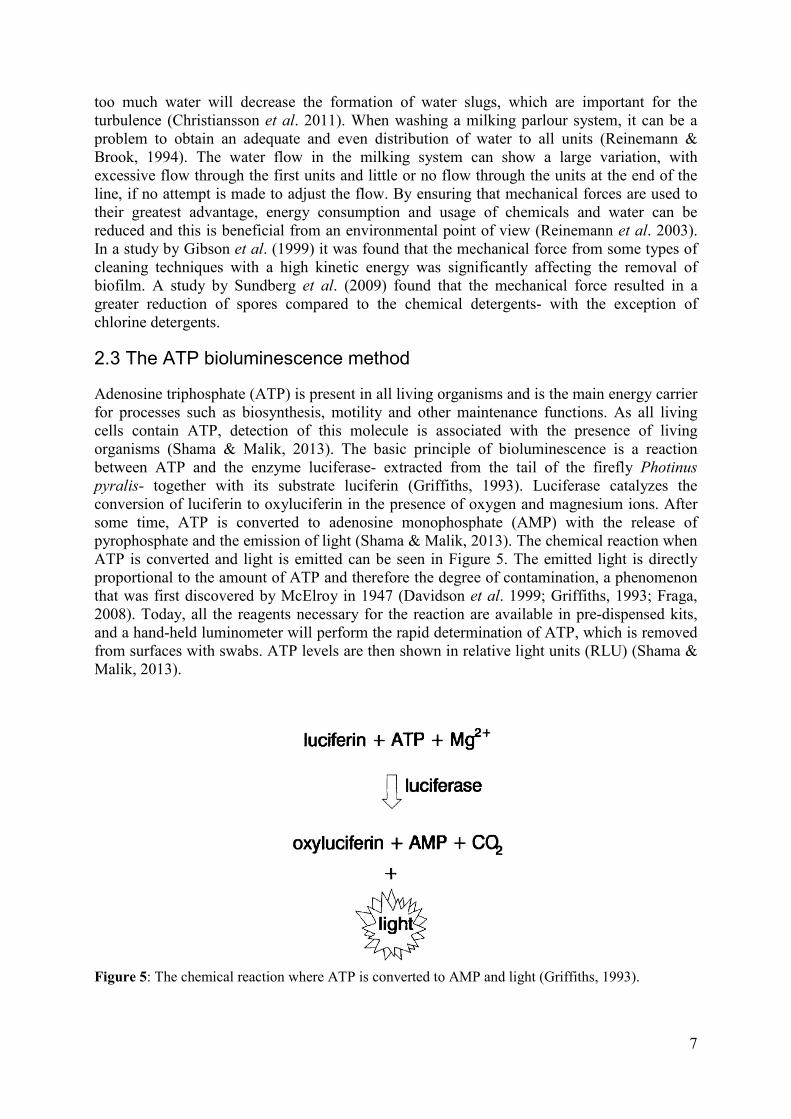
Adenosine triphosphate (ATP) is present in all living organisms and is the main energy carrier for processes such as biosynthesis, motility and other maintenance functions. As all living cells contain ATP, detection of this molecule is associated with the presence of living organisms (Shama & Malik, 2013). The basic principle of bioluminescence is a reaction between ATP and the enzyme luciferase- extracted from the tail of the firefly Photinus pyralis- together with its substrate luciferin (Griffiths, 1993). Luciferase catalyzes the conversion of luciferin to oxyluciferin in the presence of oxygen and magnesium ions. After some time, ATP is converted to adenosine monophosphate (AMP) with the release of pyrophosphate and the emission of light (Shama & Malik, 2013). The chemical reaction when ATP is converted and light is emitted can be seen in Figure 5. The emitted light is directly proportional to the amount of ATP and therefore the degree of contamination, a phenomenon that was first discovered by McElroy in 1947 (Davidson et al. 1999; Griffiths, 1993; Fraga, 2008). Today, all the reagents necessary for the reaction are available in pre-dispensed kits, and a hand-held luminometer will perform the rapid determination of ATP, which is removed from surfaces with swabs. ATP levels are then shown in relative light units (RLU) (Shama & Malik, 2013).
Figure 5: The chemical reaction where ATP is converted to AMP and light (Griffiths, 1993).
7
The ATP bioluminescence technique has evolved during the last decades and it has become increasingly used, mainly in the food processing industry but also in the healthcare sector. It is a fast and easy way to make sure cleaning practices have been successful (Shama & Malik, 2013; Griffiths, 1993). As traditional microbiological methods, such as hygiene swabbing and agar contact methods require incubation periods for up to 48 hours before results can be seen, ATP bioluminescence is a good complement when it is important to get results quickly (Moore & Griffith, 2002). The technique can be effectively used under field conditions; however, it is not a substitute for quantification of microbial load on food contact surfaces and should be integrated with microbiological testing (Aycicek et al. 2006). ATP is present in both eukaryotes and prokaryotes, and therefore the method does not only measure microbiological contamination, but also other organic debris, which might remain after inadequate cleaning and provide a source of nutrients for microbial growth (Davidson et al. 1999; Corbitt et al. 2000). For example, ATP is present in somatic cells and food debris, such as in milk residues, and presence of any material containing ATP will affect the results of the ATP reading (Murphy et al. 1998; Corbitt et al. 2000; Shama & Malik, 2013; Reinemann & Ruegg, 2000)
2.3.1 Correlation between ATP measurements and CFU
Several studies have looked at correlations between results from ATP measurements and traditional plate count methods, in various environments. Shama and Malik (2013) reviewed a number of studies and found that there was strong evidence for relatively high correlations between microbial counts and ATP levels, especially when the contribution of ATP from somatic cells and other organic matter had been corrected for. Chen and Godwin (2006) used a microbial ATP assay and found a high correlation when comparing the results with aerobic plate count methods (r=0.82). Moore and Griffith (2002) found the level of agreement (r2) between ATP measurements and traditional plate count after a cleaning procedure to be between 55.6 % and up to 89%, with the level of agreement varying between different environments. Murphy et al. (1998) found the level of agreement between ATP and microbial counts from surfaces in contact with fluid milk to be 74%. However, Poulis et al. (1993) did not find any clear relationship between ATP measurements and number of CFU and stated that this might have been due to varying amounts of ATP in microorganisms depending on type of microorganism and their physiological condition, or the presence of ATP with other than microbiological origin, or the sensitivity of the ATP-detection system.
2.4 ATP bioluminescence to evaluate hygiene of milking equipment
The ATP bioluminescence technique has potential to be used as an instrument to evaluate the hygienic status of milking equipment. However, previous research in this specific field is limited and results have been deviating. In a study by Meyer and Schmidt (1997), ATP bioluminescence was used to evaluate the effectiveness of cleaning and sanitation in four areas of a milking parlour. Total aerobic count was used in parallel to this; however, no correlation between RLU values and microbial count was found. In the same study, swabs from clean, sanitized surfaces had low RLU values and microbes were generally not detected. It was also found that RLU values could be high even when the total plate count indicated a clean hygienic status. According to the authors, the discrepancy between CFU and RLU values illustrated that ATP bioluminescence also reacts on milk residues and residual dirt, whereas total plate count only measure microbial contamination. The authors stated that total plate counts are real numbers, but the same cannot
8
be said about RLU values. A surface with 900 RLU is not necessarily more contaminated with aerobic bacteria than a surface with 350 RLU whereas a surface with 1000 CFU/ml is more contaminated than a surface with 100 CFU/ml. The hygienic state of a milking machine with biofilm present on the surface was studied by Pintaric and Pengov (2007) under laboratory conditions. In the study it was found that RLU values did not rise with the increase of microorganisms on a surface. According to the authors, the recovery of microorganisms from a milking equipment surface could have been affected by the presence of biofilm. They suggested that the exopolysaccharide layer that covers the microorganisms can make it impossible to obtain actual levels of ATP. The authors found a correlation of 0.647 between RLU values and level of microorganisms when the system was cleaned with alkali and acid detergent. They also found that the cleaning agents used influenced the results of RLU values on the test surfaces. Nieuwenhof (1996) swabbed equipment in a milking parlour and found that places with an increased level of bacterial contamination were always ATP positive; in addition, many more places were found with an increased ATP level but without bacteria. A large variation with a variation coefficient of 0.37 was found when two different swabs were taken from the same area. According to the author, this result was probably caused by the inhomogeneity of dirt on the swabbed area. When comparisons were made between RLU values and CFU/ml, the results showed that the majority of swabs with high RLU values also had more CFU/ml compared to swabs with lower RLU values. The sanitation of a milking parlour using ATP bioluminescence was also studied by Reinemann and Ruegg (2000). Their results showed considerable variation between different test sites. The authors did not find any correlation between bacterial counts in bulk tank milk and RLU values, and stated that it may have been because the difference in cleanliness detected with ATP bioluminescence was not sufficient to cause a major cleaning failure or significant change in the bacterial population in the bulk tank milk. In their laboratory test, a correlation of 0.73 was found between RLU values and CFU/ml when swabbing adjacent areas of the equipment. The authors performed the swabbing 4 hours after a completed cleaning procedure as this allowed the surfaces to drain completely. Their previous experience had indicated that water residuals on a surface typically resulted in a high variability of the ATP readings. Reinemann and Ruegg (2000) concluded that the ATP bioluminescence method must be used carefully in order to obtain meaningful results and that the variability in the ATP readings can be reduced significantly by using the same measurement location over time. The authors also mentioned that type and presence of detergents affected the results. A large study was carried out in Spain by Vilar et al. (2008), where ATP bioluminescence was used to evaluate the cleanliness of milking equipment surfaces on teat cup rubbers, teat dip containers, milk receivers and pipeline joints. The study also aimed to investigate if the RLU values were influenced by any of various milking and cleaning system practices. In the study, no correlation was found between ATP measurements and bacterial count in bulk tank milk. The presence of detergents affected the results as farms that never used acid detergent had the highest RLU values in teat cup rubbers and teat dip containers and farms that used acid detergent weekly had the lowest RLU values. On the contrary, for milk receivers and pipeline joints, RLU values were highest on farms where acid detergent was used daily and lowest on farms where acid detergent was used once a week or less. The authors explained this to be a possible thrust effect in milk receivers and pipeline joints, or alternatively caused
9
by undetermined management practices between farms. In the study it was found that the hygienic quality of the water used for cleaning also affected the results. Slaghuis and Wiegersma (1996) studied the milking equipment on five farms using ATP bioluminescence. Differences in RLU values were found between farms as well as between parts of the installation. On one farm, the barrel of the liner had values between 43 and 372 RLU and the liner mouthpiece had values between 104 and 4544 RLU. In the same study, a high RLU value of 2067 was found on a liner barrel with a very rough surface. In Sweden a study using ATP bioluminescence was carried out at Kungsängen research Centre (Benfalk et al. 2001). The aim of the study was to develop a sampling routine for ATP bioluminescence to control the cleaning result in the milking plant. A laboratory test and field test in a milking parlour was conducted. Large variations between farms and within farms were found. In the study it was concluded that the results may have been affected by the fact that the swab does not remove all milk residues and bacteria on the swabbed surface. Also the amount of dirt that can be removed is dependent on the material and structure of the surface being swabbed, and therefore the ATP level varies. In line with other studies, Benfalk et al. (2001) stated that the measurements can be affected by residues from detergents. A dirty surface can be classified as clean if there have been residues of detergent in the sample. According to the authors, it is better to set a few critical control points rather than measuring several locations. The control points must be chosen carefully, it should not be places that are very easy to clean and it should not be the areas where visual dirt is easily accumulated. Also Roberts and Haslam (2011) used ATP bioluminescence to assess hygiene on dairy farms and they proposed RLU<1000 as a threshold value for when liners should be considered clean. Normal farm results were between 280-896 RLU and results from farms with hygienic problems were 2700-30 000 RLU.
2.5 Factors affecting the ATP readings
In addition to the level of cleanliness on a surface, ATP readings can be affected by a number of factors. These factors include properties of differences ATP bioluminescence test kits, recovery of bacteria from swabs, bacterial properties, effect from detergent residues and water quality.
2.5.1 Properties of different ATP bioluminescence test kits
There are many commercial luminometers available on the market today, and despite the basic chemical reaction between ATP and its reagents being the same between brands, the sensitivity, and repeatability differ. Carrick et al. (2001) performed a comparative study between four luminometers and found that all four were inconsistent at detecting ATP and none of the meters gave linear results for detecting increasing, known concentrations of ATP. The authors suggested that the inconsistent measurements were due to properties of the swab and that the release of microorganism from the swab to the buffer was not consistent. Another comparative study of luminometers was conducted by Sciortino and Giles (2012). In their study, a great variability in the recovery of microorganisms was found when using three different systems. The design of the swab was considered to explain a large part of the differences in pick-up efficiency of microorganisms from the tested surfaces, where the wettest swab with a flat surface had the highest pick-up efficiency. Limits of detection varied
10
from 10 to 103 CFU, and there was also a variation between operators and systems. Davidson et al. (1999) found that the minimum detection limit for ATP bioluminescence was 104 CFU/100cm2, for both wet and dry surfaces and for both Staphylococcus aureus and Escherichia coli. Four leading ATP meters were tested by Omidbakhsh et al. (2014) who found that all of them demonstrated an acceptable linearity and repeatability in their readings; however there was a limited sensitivity in detecting low levels of microbial contamination and the ATP meters were prone to interference by disinfectant chemicals. The authors found a high correlation between solutions containing different concentrations of ATP or S. aureus and the corresponding RLU values.
2.5.2 Recovery of bacteria from swabs
When sampling a surface for ATP bioluminescence analysis, a swab is almost exclusively used. The characteristics of the swabbed material will affect the recovery of each class of ATP contributing material (Shama & Malik, 2013). Results are depending on removal of bacteria from the surface, release of bacteria from the swab and the overall bacterial recovery. The proportion of bacteria recovered from a swabbed surface is often low and Nieuwenhof (1996) found that only 0-20% of the total ATP initially present on stainless steel was removed when swabbing. Moore and Griffith (2007) found in their study that the recovery of bacteria was poor, especially from dry surfaces, and that the release of bacteria from a swab is of importance in order to get representative results. According to Moore and Griffith (2007), surface swabbing is subject to a number of inherent errors, such as standardizing the swabbing pattern and the angle and degree of pressure applied to the swab. This can lead to a high variability in the results obtained. In their study, Moore and Griffith (2007) found that an increased level of mechanical energy generated during swabbing, increased the number of bacteria removed from a wet surface. However, efficient removal of bacteria from a surface did not necessarily correlate with higher recovery if bacteria were not effectively released into the diluent. Swabbing efficiency is therefore dependent on both recoveries from the surface as well as the following release of bacteria into a diluent (Moore & Griffith, 2007). Also Rose et al. (2004) and Landers et al. (2010) found that a pre- moistened swab was more efficient in recovering bacteria from a surface. Factors that will influence the minimum detection limit of ATP bioluminescence and plate count methods include the ability of the swab to remove bio burden from the surface, which will to some extent be influenced by the swabbing procedure used. An effective swab wetting agent is required for a high pick up efficiency according to a study by Davidson et al. (1999). Bacteria that have formed a biofilm are more difficult to remove from a surface, and a conventional swabbing procedure may not be efficient enough to detach and recover cells in a biofilm from a surface (Bower at al. 1996; Bredholt et al. 1999).
2.5.3 Bacterial properties
Bacterial properties may affect the results obtained from an ATP bioluminescence assay. Shama and Malik (2013) looked at data from different studies concerning ATP content of microorganisms and found that the ATP content of microbial cells differ, with values for yeasts and fungal spores being higher than for bacteria. Bacteria isolated from natural environments generally contain less ATP per cell than those cultured under laboratory
11
conditions. The ATP content within a microorganism may also vary as a result of environmental stresses.
2.5.4 Effect on ATP from detergents
When detergent residues are present on a surface, such as after a CIP procedure in a milking system, an enhancing or quenching effect on the ATP bioluminescence signal can be seen. The effect is due to interference from cleaning agents and disinfectants with the luciferin- luciferase enzyme system and because of this effect, results from an ATP reading may be false. For example, a dirty surface can be classified as clean in the presence of detergent residues in the sample (Velazquez & Feirtag, 1997; Lappalainen et al. 2000; Benfalk et al. 2001). Lappalainen et al. (2000) stated that even though there is ATP in the measurement solution, it does not necessarily implicate that living bacteria are present. Detergents can disrupt cell walls, but preserve ATP in a measurable form, and therefore the correlation with culture methods can be poor. Velazquez and Feirtag (1997) found that alkali and acid cleansers caused a concentration dependent effect, from enhancing the ATP signal to quenching it, as the concentration increased. Similar results were found by Green et al. (1998) who stated that the use of commercial sanitizers and cleansers may affect the RLU values from ATP bioluminescence when the chemical detergent comes into direct contact with the reagents. The RLU value may be significantly reduced and it is also possible that an increased value is shown, depending on type and concentration, and this may in turn lead to false interpretations of the ATP readings (Green et al. 1998). Omidbakhsh et al. (2014) found that different detergents had unique effects in either quenching or enhancing ATP readings, and residues can have a very high impact on the ATP readings. The authors stated that the quenching may be due to a chemical reaction with ATP molecules, or that chemicals affect the enzymatic activity from luciferase.
2.5.5 Water quality
Water that is used for cleaning of milking equipment must maintain a good bacteriological quality, as high bacterial numbers can affect the suitability of using the water for rinsing the milking system after the main washing cycle (Christiansson et al. 2011). Also the hardness of the water will affect the effectiveness of the cleaning procedure, where decreased water hardness gives an increased effectiveness (Reinemann et al. 2003). Hard water will lead to formation of inorganic material on the surface of the equipment, and to avoid this problem, a higher concentration of detergent is required when the water is hard. In a study by Vilar et al. (2008) it was found that the hygienic quality of the water used for cleaning was important and the mean RLU values were significantly higher in teat cup rubbers and milk receivers from farms using water from private wells without any chlorination treatment.
2.6 Other potential uses of ATP bioluminescence in the dairy industry
Among other fields of practice where ATP bioluminescence has been evaluated, mastitis detection is one of them. In a study by Frundzhyan et al. (2008), a strong correlation was found between somatic cell count (SCC) and total non-bacterial ATP in milk (r2=0, 99), as well as between SCC and ATP from somatic cells (r2=0.95). Also Meyer et al. (1998) used ATP bioluminescence to detect mastitis in milk samples. The authors stated that bacteria have an increased multiplication rate in mastitis milk and that an increase in microbial ATP seems to correlate well with indicators for mastitis inflammation. In the study, somatic cell ATP and native milk ATP was selectively removed from milk samples through extraction and
12
filtration, in order to only measure microbial ATP. A strong correlation (r= 0.91) was found between the microbial load of milk samples determined by ATP assays, and SCCs. When using ATP bioluminescence to assess the ATP content of milk, it is important to obtain information about all factors affecting the ATP level, such as parity and stage of lactation which have significant effects on the ATP content of milk (Emanuelson et al. 1988). ATP bioluminescence has also been used to assess teat cleanliness in a study by Finger and Sischo (2001) and the authors found an acceptable relationship between RLU and CFU; however they also meant that bioluminescence measurements included more than bacterial contamination. ATP bioluminescence has also been used to assess the bacteriological quality of raw milk in studies by Bell et al. (1996) and Niza-Ribeiro et al. (2000). It was concluded in both studies that the method gave accurate and precise results of the bacterial quality and that it is practical and reliable, however it is not intended to provide a quantitative estimate of the bacterial load and interpretations should rather be done qualitatively.
13
3 Objectives of the study
The general objective of the study was to use ATP bioluminescence to establish and verify a test procedure for hygiene testing of rubber liners and tubes on farm level, which would give reliable and reproducible results. The study also aimed to investigate whether ATP bioluminescence could be used to detect a possible deterioration of the hygienic status when liners and tubes aged. The hypotheses of the study were following: 1. The results of the ATP readings are affected by different parameters associated to the sampling procedure in a milking system
2. The hygienic condition deteriorates when rubber liners and tubes age, and this is reflected in elevated RLU values
3.1 Specific objectives
The study was divided into two parts with more specific objectives that are described in further detail below. Part one- Establishment of a test procedure for hygiene testing of liners and tubes The specific objective was to establish a suitable test procedure for hygiene testing of
rubber liners and tubes using ATP bioluminescence. This would be accomplished by determining a number of sampling parameters that could be of importance for the results when hygiene testing liners and tubes on farm level. The determined parameters would then be assessed in order to see how they affected the ATP readings when using ATP bioluminescence.
Part two- Study of the hygienic trend of liners and tubes
The first specific objective of part two was to use the established test procedure from part one on three farms, and to follow the hygienic trend as liners and tubes aged. The intention was also to investigate the possibility to set thresholds for RLU values that could determine when liners should be replaced, based on their hygienic status.
The second specific objective of part two was to investigate the correlation between RLU values and total bacterial counts on liners as they aged.
14
4 Materials and methods
4.1 Farms in the study
The study was conducted as a field trial on three different dairy farms with milking parlour in Sweden and data collection took place from April to October 2014. Below follows descriptions of the basic cleaning routines on the farms that were included in the study.
• Farm A was a conventional farm that milked 95-100 cows twice a day in a milking parlour with 2x8 milk points. A CIP procedure of the system took place after each milking, using a DeLaval C200 cleaning unit (DeLaval, Tumba, Sweden). Acid and alkali detergents were alternated each CIP procedure and detergents used were Mepa Acid NP free and Mepa CIP NP free (Ecolab, Älvsjö, Sweden). DeLaval original liners and tubes made of rubber were used on the farm. The outer surfaces of the parlour were cleaned manually after each milking, though dirt sometimes remained after cleaning.
• Farm B was an organic farm that milked around 100 cows twice a day in a milking parlour with 2x4 milk points. A CIP procedure took place after each milking, using a DeLaval C200 cleaning unit and detergents used were DeLaval CidMax and DeLaval chlorine free detergent 25. Acid and alkali detergents were alternated each CIP procedure. DeLaval original liners and tubes made of rubber were used on the farm. The outer surfaces of the parlour were cleaned manually after each milking and the parlour appeared impeccable clean.
• Farm C was an organic farm that milked around 160 cows two times per day in a
milking parlour with 2x8 milk points. A CIP procedure of the milking system took place after each milking, using a DeLaval C100E cleaning unit. Detergents used were DeLaval CidMax and DeLaval chlorine free detergent 25. In addition to this, the farm also used a chlorinated alkali disinfectant (DeLaval Alkali 1+) approximately once a week. DeLaval original liners made of rubber, and DeLaval silicone tubes were used on the farm. The outer surfaces of the parlour appeared impeccable clean after cleaning.
4.2 Measurements of ATP and total bacteria count
A ready to use kit with pre-moistened surface swabs and reagents from 3MTMClean-TraceTMATP (3M Svenska AB, Sollentuna, Sweden) were used for swabbing the milking equipment surfaces and a luminometer from 3MTM Clean-TraceTM NG was used for measuring the ATP levels, with the results shown in RLU. The predetermined pass limit for a clean surface in the present study was <150 RLU, and the fail limit for a dirty surface was >300 RLU, based on recommendations (Indevex Watertech AB, 2011). The manufacturers of the 3MTMClean-TraceTMATP surface swabs used in the study recommend swabbing a surface of approximately 10 x 10 cm (3M, 2012). The repeatability of the 3MTMClean-TraceTMATP bioluminescence system was investigated in a study by Simpson et al. (2006). The authors obtained a variation coefficient of 0.074 when swabs were prepared with identical amounts of ATP for each test reading. In order to obtain a low variation between measurements in the present study, the swabbing technique was
15
standardized. All sample areas were swabbed in two directions, rotating the swab while sampling, in accordance with manufacturer’s instructions (3M, 2012). Pressure was applied when swabbing in order to increase uptake of material. The same person conducted all sampling throughout the study. The surfaces were swabbed for approximately 15 seconds. The time between swabbing and reading of the results was never more than 30 minutes. Manufacturers recommend a maximum of 4 hours before reading the results (3M, 2012). Plastic gloves were used and changed frequently in order to avoid contamination of the swab or equipment. In order to estimate the hygienic quality of the water used for cleaning, ATP measurements of water were taken on all three farms using 3MTMClean-TraceTM water plus total ATP. The kit measures the hygienic status of water and a high RLU value indicates that the water may have a poor hygienic quality. In the present study, water samples with less than 100 RLU were considered clean and values above 200 RLU were considered unclean, based on recommendations (Indevex Watertech AB, 2011). Total bacterial counts were estimated in parallel to the ATP measurements on two of the farms using Hygicult®TPC slides (Food Diagnostics AB, Göteborg, Sweden). The main purpose of a Hygicult®TPC test is to detect an elevation of total bacterial counts and the results are given in colony forming units (CFU).
4.3 External factors considered in the study
The three farms in the study had cleaning systems that were automatically programmed with regards to water temperature, detergent dosage, water pressure and time, and only farm C used manual dosing of detergent. The start temperature of the water used for the main rinse was set to reach 80 ºC on all farms and therefore within the acceptable level. The return temperature varied and was shown on the cleaning unit as the washing cycle proceeded, or recorded on an external thermometer connected to the cleaning unit. If any error would occur during the cleaning procedure, such as too low water temperature, water pressure or detergent concentration, the washing machine would show an alarm. In this study, it was decided to not take samples after a failed cleaning procedure, and in those cases, the farms were re-visited another day. The reason for not sampling after a failed cleaning procedure was that the values would not be representative for the general hygienic status of the equipment. On each sampling occasion and farm, three water samples were taken for measurements of the ATP level and an average of the obtained RLU values was used to estimate the hygienic quality of the water. Also the surrounding temperature in the barn was recorded. The milk meter was used as a control point in order to see if the cleaning procedure had been successful or not.
4.4 Part one: Establishment of a test procedure for hygiene testing
4.4.1 Experimental design
Based on previous research concerning hygiene testing of milking equipment using ATP bioluminescence, a number of parameters were chosen and one parameter at a time was varied while others were kept constant. This was done in order to see how the obtained RLU values
16
would vary and to establish which factors were significant for the result. The chosen parameters were: different sampling locations on the liner and tube, sampling from different milk points in the parlour, sampling wet and dry liners and sampling after both acid and alkali detergent. To get several repeats from each parameter tested, a number of samples were taken from liners on the same and adjacent clusters, and from several tubes in the parlour. It was a prerequisite that the test procedure 1) could be used on farm level without damaging any equipment and 2) that the obtained values were representative for the general hygienic status of the equipment and 3) that the test procedure showed a high reproducibility. Sampling for part one of the study took place on farm A, on old liners that had been used for approximately 3000 milkings, and on tubes that were more than one year old. Samples were taken after a CIP procedure in the morning with acid detergent and in the evening with alkali detergent. Complementary samples for the first part of the study were taken on newly installed liners after 120 milkings. The parlour had 16 milk points and was numbered 1-16, starting from the receiver and the liners of a cluster were numbered 1-4, as seen in Figure 6.
Figure 6: A schematic picture showing the numbering of milk points and liner in a parlour with 2 x 4 milk points. R = receiver.
4.4.2 Parameters tested
Below follows descriptions of the sampling parameters that were tested on farm A.
Location on the liner and tube Three locations with different surface areas were swabbed on the inside of the liner; lip (appr.16.5cm2), head (appr.35cm2) and barrel (appr.80cm2). The different locations can be seen in Figure 7. When swabbing locations on the liner, the cluster was kept in position so that the lip was the lowest point. It was avoided to turn the cluster upside down in order to prevent remaining water in the equipment to spread.
17
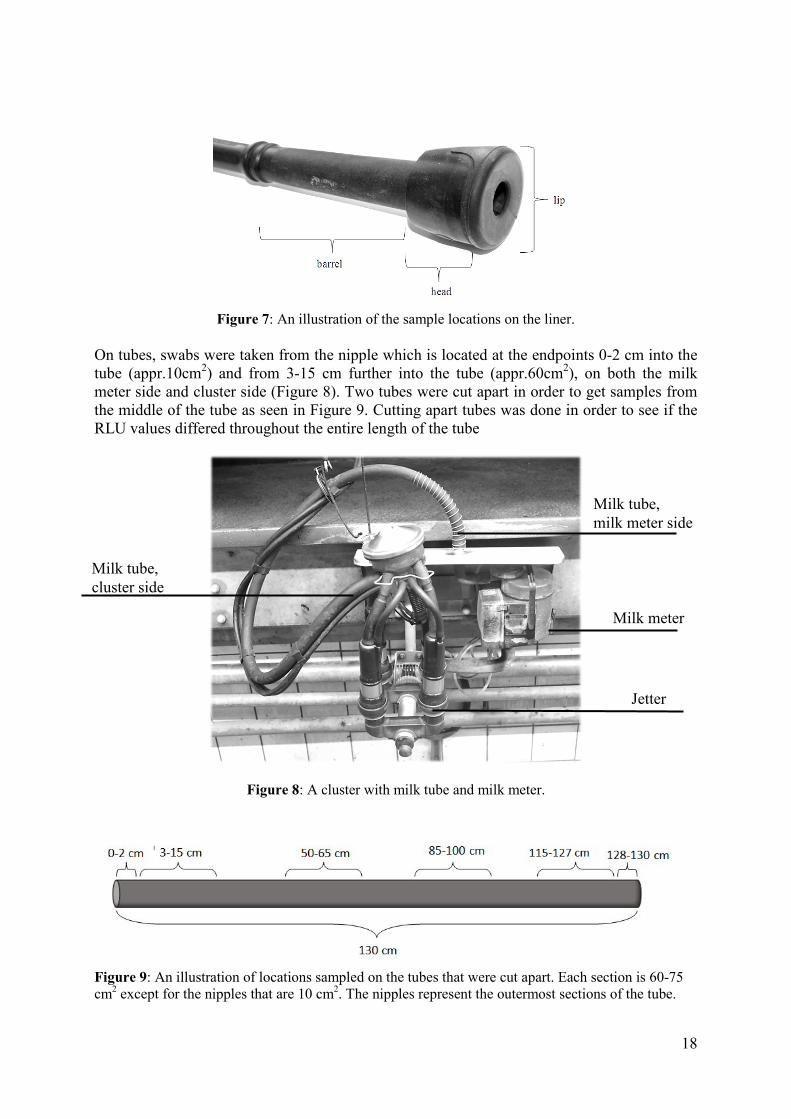
Figure 7: An illustration of the sample locations on the liner.
On tubes, swabs were taken from the nipple which is located at the endpoints 0-2 cm into the tube (appr.10cm2) and from 3-15 cm further into the tube (appr.60cm2), on both the milk meter side and cluster side (Figure 8). Two tubes were cut apart in order to get samples from the middle of the tube as seen in Figure 9. Cutting apart tubes was done in order to see if the RLU values differed throughout the entire length of the tube
Figure 8: A cluster with milk tube and milk meter.
Figure 9: An illustration of locations sampled on the tubes that were cut apart. Each section is 60-75 cm2 except for the nipples that are 10 cm2. The nipples represent the outermost sections of the tube.
Milk tube, milk meter side
Milk tube, cluster side
Milk meter
Jetter
18
Time after washing To investigate if a dry surface would result in a lower variability in the ATP readings, all liners of a cluster were allowed to dry completely for four hours before swabbing the barrel. The RLU values from dry liners were compared with values from liners swabbed directly after the finished cleaning procedure. Milk point in parlour In order to investigate if the hygienic status varied at different milk points in the parlour, the barrel of one liner at each milk point was sampled and the milk points on the receiver side were compared with the milk points on the opposite side of the parlour.
Alkali or acid of detergent Samples were taken from liners and tubes after the use of an acid and alkali detergent and the results of the ATP readings were compared. This was done in order to see if there was any difference in the results when sampling after each type of detergent.
4.5 Part two: Study of the hygienic trend of ageing liners and tubes
4.5.1 Experimental design
Liners and tubes were sampled once a month during 6 months on all three farms, with an interval of 21-35 days, using the test procedure established in part one. The sampling began on new liners and tubes on the same day as they were installed, with the exception of farm B where the new equipment had been in place for about two weeks already. Sampling continued until the liners had reached at least 2400 milkings and until the tubes were up to 6 months old. Samples were first taken from the old liners and tubes that were about to be changed, and right after from the new liners and tubes. Samples were always taken from the same milk points in the parlour. This was done in order to minimize variation in the results due to differences between different clusters, liners and tubes. On farm A and C, samples for liners were taken from milk point 4 and 5. On farm B, samples for liners were taken from milk point 2 and 3. For tubes, samples on farm A were taken from milk point 3, 4, 5, 6 and 7 and on farm B, samples for tubes were taken from milk point 1, 2, 3, 4, 6 and 7.
4.5.2 Correlation between CFU and RLU
On two liners located on the same cluster, adjacent areas of each barrel with an area of approximately 10 cm2 were swabbed for both CFU and RLU during the whole trial period, as liners aged for 2820 milkings. This was done on farm C. On farm A, comparative samples for CFU and RLU were taken from one old and one newly installed tube as well as from the barrels of liners at two occasions. Swabs for the Hygicult®TPC plate were pre-moistened using sterile saline solution. The swab was stroked against the surfaces of the equipment to be tested, and thereafter on the two sides of the Hygicult®TPC plate. Test tubes were put in room temperature for 4-5 days for the bacteria to grow. The number of CFU on each side of the slide was counted and a mean value from both sides of the slide was used in the calculations, which gave a measurement per sample of 10cm2.
19
4.6 Data handling and statistical analysis
In order to perform statistical calculations, Excel and the statistical software program “R”, by R core team (R Foundation for Statistical Computing, Vienna, Austria, 2014), version 3.0.0, was used. Before statistical calculations were made, outlying values were removed from the dataset of RLU values. Based on the third quartile (Q3) and inter quartile range (IQR), outliers above the upper inner fence (Q3+ 1, 5 x IQR) and upper outer fence (Q3 + 3 x IQR) were removed in the statistical calculations. Exceptions were made for outlying values below 100 RLU because such low values are not likely caused by external contamination, and these values were not removed. T-tests were conducted to test for general differences in mean values between acid and alkali detergents, different locations, milk points and drying time. The variation coefficient (CV) was calculated, as a stable test procedure should have a low variation coefficient for repeated measurements. When looking at the hygienic trend for the three farms, a mean value of the obtained RLU values was calculated from each sampling occasion. A regression analyze was made to investigate the relationship between CFU and RLU in the study. For the regression analysis, a log10 transformation of the RLU values and CFU was used, since the distribution of values was skewed with a tail extending towards the higher values.
20
5 Results
The results of the study are presented for part one and part two separately. It is emphasized that the obtained values are specific for the three farms in the study and those values should not be generalized as standard values, as external factors may vary between farms. The values do however show how RLU values may vary when using different test procedures, and how the hygienic trend of liners and tubes can change over time.
5.1 Establishment of a test procedure for hygiene testing of liners
The specific objective of part one was to test different parameters that could be of importance when conducting hygiene testing of liners and tubes in a milking system, and to see how these parameters affected the results of the ATP readings. The results from the parameters tested are presented for liners and tubes separately.
5.1.1 Results from testing different sampling parameters on liners
Location on liner After 3000 milkings and the use of an acid detergent, the mean RLU value for the lip was significantly higher (p<0.01) compared to the mean RLU value for the head and the barrel (Table 1). After 120 milkings and the use of an acid detergent, there was a tendency (p<0.1) towards higher RLU values when sampling the lip compared to the barrel (Table 2). At other sampling occasions, no significant difference was found between the three sampling locations. When sampling the lip, there was often a large variation between measurements. The area was often very wet, and the jetter which is in contact with the lip was sometimes visibly dirty, which may have contributed to the high values and large variation between measurements. The area therefore appeared easily contaminated and to be most prone to cleaning failures among the three locations. Because the lip is not in direct contact with the milk, and not subject to as much physical tension and deterioration as the rest of the liner, the lip was excluded as a suitable sampling location. Swabbing the head resulted in lower RLU values and a smaller variation between measurements compared to the lip (Table 1 and 2). The head was not as wet as the lip, but appeared wetter than the barrel and the area of 35 cm² is smaller than what manufacturers recommend. The head is in contact with the teat but it is not subject to as much physical tension as the barrel, and signs of deterioration may not be representative for the general hygienic status of the liner based on the study by Boast et al. (2008). The above mentioned properties excluded the head as a suitable sample location. Swabbing the barrel often showed a lower variation coefficient compared to the lip (Table 1 and 2). The swabbed area of the barrel was approximately 80 cm² and most similar to what manufacturers recommend, which is 100cm². The barrel did not appear to be as prone to cleaning failures as the lip, since the area did not include any dead ends and does not come in contact with external dirt to the same extent as the lip. During milking, milk flows through this part of the liner and the barrel is subject to physical tension. The barrel is the part of the liner where most signs of deterioration can be seen when the liner age (Boast et al. 2008) and it can therefore be considered representative for the general hygienic status of the liner. The barrel was chosen as the most suitable sample location based on the above mentioned properties.
21
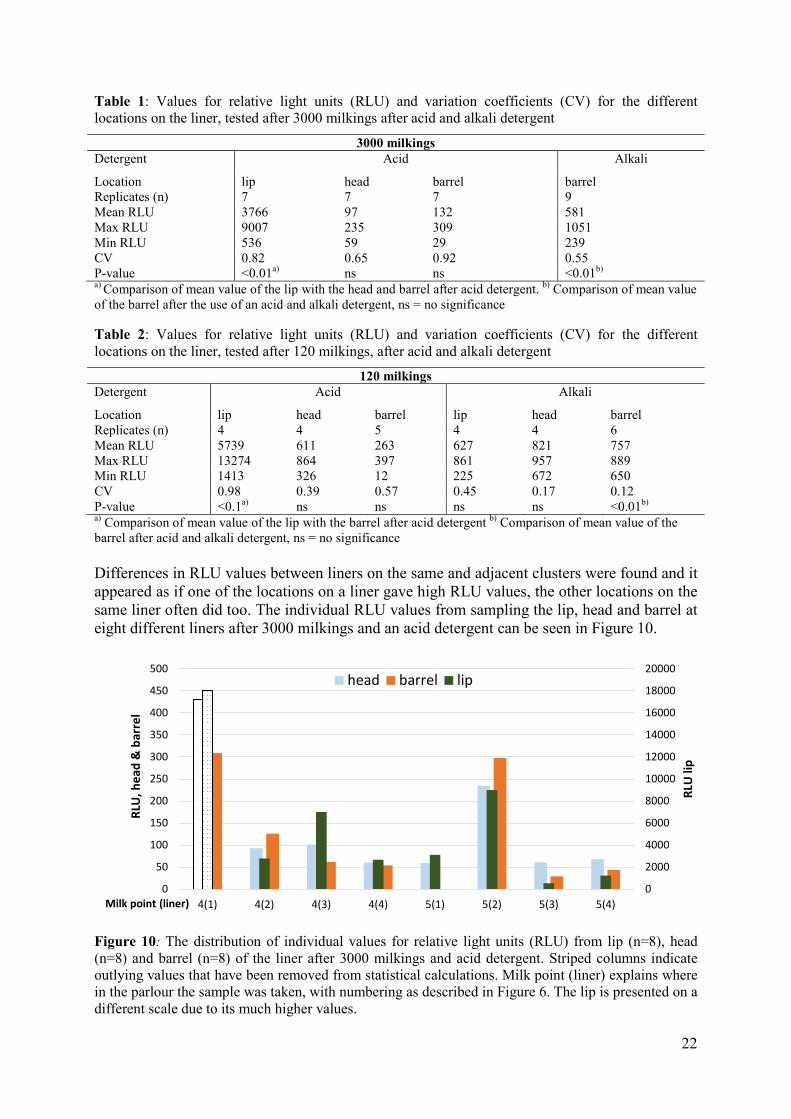
Table 1: Values for relative light units (RLU) and variation coefficients (CV) for the different locations on the liner, tested after 3000 milkings after acid and alkali detergent
3000 milkings Detergent Acid Alkali
Location lip head barrel barrel Replicates (n) 7 7 7 9 Mean RLU 3766 97 132 581 Max RLU 9007 235 309 1051 Min RLU 536 59 29 239 CV 0.82 0.65 0.92 0.55 P-value <0.01a) ns ns <0.01b)
a) Comparison of mean value of the lip with the head and barrel after acid detergent. b) Comparison of mean value of the barrel after the use of an acid and alkali detergent, ns = no significance Table 2: Values for relative light units (RLU) and variation coefficients (CV) for the different locations on the liner, tested after 120 milkings, after acid and alkali detergent
120 milkings Detergent Acid Alkali
Location lip head barrel lip head barrel Replicates (n) 4 4 5 4 4 6 Mean RLU 5739 611 263 627 821 757 Max RLU 13274 864 397 861 957 889 Min RLU 1413 326 12 225 672 650 CV 0.98 0.39 0.57 0.45 0.17 0.12 P-value <0.1a) ns ns ns ns <0.01b) a) Comparison of mean value of the lip with the barrel after acid detergent b) Comparison of mean value of the barrel after acid and alkali detergent, ns = no significance Differences in RLU values between liners on the same and adjacent clusters were found and it appeared as if one of the locations on a liner gave high RLU values, the other locations on the same liner often did too. The individual RLU values from sampling the lip, head and barrel at eight different liners after 3000 milkings and an acid detergent can be seen in Figure 10.
Figure 10: The distribution of individual values for relative light units (RLU) from lip (n=8), head (n=8) and barrel (n=8) of the liner after 3000 milkings and acid detergent. Striped columns indicate outlying values that have been removed from statistical calculations. Milk point (liner) explains where in the parlour the sample was taken, with numbering as described in Figure 6. The lip is presented on a different scale due to its much higher values.
0
2000
4000
6000
8000
10000
12000
14000
16000
18000
20000
0
50
100
150
200
250
300
350
400
450
500
4(1) 4(2) 4(3) 4(4) 5(1) 5(2) 5(3) 5(4)
RLU
lip
RLU
, hea
d &
bar
rel
Milk point (liner)
head barrel lip
22
Milk point in parlour A t-test indicated that there were significant differences between milk points located at the side closest to the milk receiver and the opposite side of the parlour (p<0.01). After 3000 milkings and acid detergent, the barrels at milk point nr 1-8, (on the receiver side) had a mean value of 55 RLU while barrels at milk point nr 9-16 had a mean value of 224 RLU as seen in Figure 11. Because of this effect, samples further on in the study were taken from liners located on the same side of the parlour.
Figure 11: The distribution of individual values for relative light units (RLU) when swabbing the barrel at different milk points in the parlour after 3000 milkings and acid detergent (n=12). The samples from milk point 1-8 had a significantly lower (p<0.01) mean value compared to the samples from milk point 9-16. Striped columns indicate outlying values that have been removed from statistical calculations. Time after washing Letting the barrels dry for four hours after the CIP procedure did not significantly affect the RLU values (p= 0.80) when sampling was performed after 3000 milkings and the use of an acid detergent. Dry barrels had a mean value of 149 RLU and a variation coefficient of 0.91, while those swabbed directly after a completed washing cycle had a mean value of 132 RLU and a variation coefficient of 0.92. Type of detergent Swabbing after the use of an acid detergent on liners that had been used for 3000 milkings resulted in a significantly lower mean value of 132 RLU compared to 581 RLU for samples taken after an alkali detergent (p<0.01). The variation coefficient was higher when sampling after the use of an acid detergent (Table 1, Figure 12). Samples taken after 120 milkings also resulted in significantly lower RLU values for swabs taken after the use of an acid detergent compared to alkali detergent (p<0.001). The mean value after acid detergent was 263 RLU and after alkali detergent 757 RLU. Also in this case, the variation between measurements was higher when samples were taken after the use of an acid detergent (Table 2, Figure 12).
1(3) 2(3) 4(3) 5(3) 7(3) 8(3) 9(3) 10(3) 11(3) 12(3) 15(3) 16(3)RLU values 62 22 62 29 121 35 766 144 202 625 217 334
0
100
200
300
400
500
600
700
800
900
RLU
Milk point (liner)
milk point 9-16, mean value = 224 RLU p<0.01
Milk point 1-8, mean value = 55 RLU
23
Sampling after the use of an alkali detergent appeared more suitable for the test procedure due to its lower variation coefficient and because the significantly lower values obtained after acid detergent may result in incorrect interpretations of the hygienic status.
Figure 12: Comparison of mean values for relative light units (RLU) after washing with acid and alkali detergent after 3000 milkings (nacid=7, nalkali=9) and 120 milkings (nacid=5, nalkali=6). Significantly lower RLU values were found when sampling after the use of an acid detergent (p<0.01 and p<0.001).
5.1.2 Summary: Established test procedure for liners
The results indicate that the most suitable procedure for hygiene testing of liners is swabbing the barrel after washing with alkali detergent. The barrel area is close to what manufacturers recommend, and it is also the area where most physical signs of deterioration have been seen, and therefore most representable for the hygienic status of the liner. Swabbing can take place up to four hours after a completed and successful cleaning procedure since letting the liners dry for four hours did not seem to affect the results. Because a large variation was sometimes obtained between measurements, it is necessary to take several samples from liners on the same and adjacent clusters to be able to exclude outlying values. Using this test procedure gives preconditions to obtain a higher reproducibility compared to the other test procedures evaluated in part one of the study.
5.2 Establishment of a test procedure for hygiene testing of tubes
5.2.1 Results from testing different sampling parameters on tubes
Location on tube The nipple is not in contact with the milk and this area was often visibly dirty on the outside and therefore easily contaminated. There was no significant difference (p>0.1) when comparing the mean value from the nipple on the cluster side (n=3) and the milk meter side (n=4), after the use of acid detergent in tubes older than one year. Because the nipple is not in contact with the milk, and the area is very small and easily contaminated, this location is not suitable for hygiene sampling. Swabbing 3-15 cm into the tube, on the cluster or milk meter side is the furthest that is possible without cutting the tube apart. The mean values were lower on the milk meter side compared to the cluster side, both on tubes older than one year after acid detergent and on
p<0.01
p<0.001
0
100
200
300
400
500
600
700
800
3000 milkings 120 milkings
RLU
Number of milkings
Alkali Acid
24
newly installed tubes after alkali detergent (Figure 13, Table 3); however there was no significant difference between the locations. The higher values on the cluster side may have been caused by transfer of external dirt from the nipple, as the nipple near the cluster side was often more dirty compared to the milk meter side.
Figure 13: Comparison of mean values for relative light units (RLU), when sampling 3-15 cm into the tube on the cluster side (n=8) and milk meter side (n=9) after the use of acid detergent in tubes older than 1 year. Comparison of mean RLU values, when sampling 3-15 cm into the tube on the cluster side (n=5) and milk meter side (n=5) after alkali detergent on tubes 8 days after installation. There were no significant differences between the two locations (p>0.1). There was a large variation in RLU values from the different parts of the tube, with the lowest values in the middle of the tube and the highest values near the endpoints (Figure 14). The tube from milk point nr 5 had higher RLU values for all locations, except for 0-2 cm, compared to the tube from milk point nr 4, which indicates that the hygienic status of tubes in the parlour may differ. Swabbing on the milk meter side was chosen for the test procedure, as mean values were lower and therefore more representative for the general hygienic status of the tube.
Figure 14: Values for relative light units (RLU) obtained when cutting old tubes apart. Samples taken 0-2 cm into the tube are from the cluster side and samples taken 128-130 cm into the tube are from the milk meter side.
p>0.1
p>0.1
0
100
200
300
400
500
600
acid detergent> 1 year
alkali detergent8 days
cluster side milk meter side
0-2 cm 3-15 cm 50-65 cm 85-100 cm 115-127 cm 128-130 cmTube 4 3619 117 39 37 246 514Tube 5 810 283 221 451 553 1878
0
500
1000
1500
2000
2500
3000
3500
4000
RLU
swabbing location in tube
25
Type of detergent There was a tendency (p<0.1) towards lower RLU values after washing with an acid detergent (n=3) compared to alkali detergent (n=4) in tubes that were 10 days old, when samples were taken 3-15 cm into the tube on the milk meter side. The mean value after acid detergent was 22 RLU and after alkali detergent 64 RLU (Table 3). This trend is the same as for liners. For old tubes, the mean values after the use of acid and alkali detergents were not compared as samples were taken on different days and effects from the cleaning procedure on the different days may have interfered with the results. Table 3: Values for Relative light units (RLU) for the different parameters tested after acid and alkali detergent, 3-15 cm into the tube on the milk meter side and cluster side
Age of tube: 8 days 10 days > 1 year Detergent Alkali Acid Alkali Acid Alkali
Location Milk meter side
Cluster side
Milk meter side
Milk meter side
Milk meter side
Cluster side
Milk meter side
Replicates (n) 5 5 3 4 9 8 3 Mean RLU 95 157 22 64 213 505 169 Max RLU 189 221 28 95 553 2032 209 Min RLU 36 72 13 33 67 40 144 CV 0.66 0.43 0.36 0.54 0.71 1.35 0.21 P-value ns ns ns <0.1 a) ns ns ns a) Comparison between samples taken after acid and alkali detergent on tubes, 10 days old, ns= no significance
5.2.2 Summary: Established test procedure for tubes
The results from varying different parameters when sampling tubes indicate that the most suitable test procedure is swabbing after alkali detergent. Swabbing 3-15 cm into the tube on the milk meter side appeared more suitable than swabbing on the cluster side, as values were lower and therefore more representable for the whole tube. However, there were no significant differences between the two locations, and therefore the cluster side can be used in cases where it is not possible to sample the milk meter side. As for the liners, it is necessary to take several samples if there is a large variation between measurements, to be able to exclude outlying values.
5.3 Hygienic trend of liners and tubes
In part two of the study, the specific objective was to follow the hygienic trend as liners and tubes aged on three farms. The objective was also to investigate the correlation between RLU values and CFU. In common for all three farms during the trial period was that the hygienic status did not decrease as liners and tubes aged, based on RLU values. There were some differences between the farms that will be presented further. The results from part two are presented separately for each farm.
5.3.1 Hygienic trend on farm A
New liners and tubes were installed on the farm on April 14. Samples from the old liners, taken before installation had a mean value of 581 RLU (n=9), after alkali detergent, and old tubes (>1 year) had a mean value of 169 RLU (n=3), after alkali detergent. The RLU values from the first sampling after installation showed unexpectedly high values for both liners and tubes, with mean values up to 5453 RLU on liners (Figure 15 and 16, Table 4). In contrast to this, the milk meter which was used as a control point showed lower values of 196 and 441
26
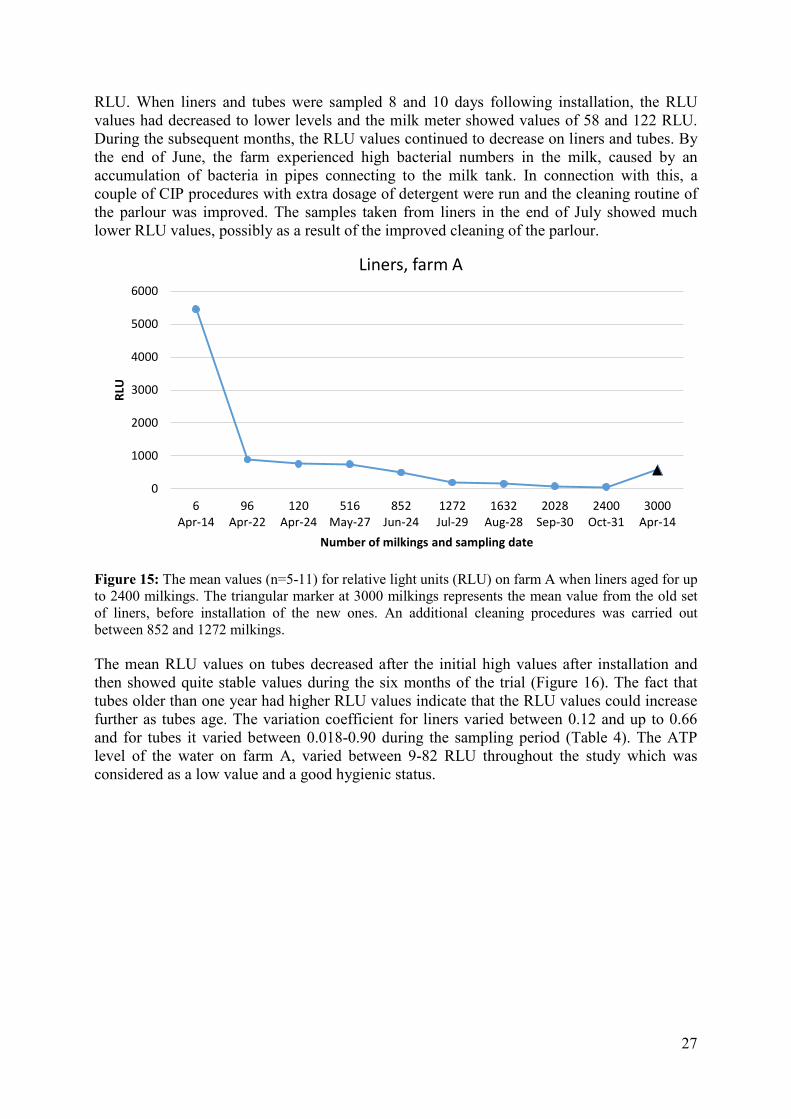
RLU. When liners and tubes were sampled 8 and 10 days following installation, the RLU values had decreased to lower levels and the milk meter showed values of 58 and 122 RLU. During the subsequent months, the RLU values continued to decrease on liners and tubes. By the end of June, the farm experienced high bacterial numbers in the milk, caused by an accumulation of bacteria in pipes connecting to the milk tank. In connection with this, a couple of CIP procedures with extra dosage of detergent were run and the cleaning routine of the parlour was improved. The samples taken from liners in the end of July showed much lower RLU values, possibly as a result of the improved cleaning of the parlour.
Figure 15: The mean values (n=5-11) for relative light units (RLU) on farm A when liners aged for up to 2400 milkings. The triangular marker at 3000 milkings represents the mean value from the old set of liners, before installation of the new ones. An additional cleaning procedures was carried out between 852 and 1272 milkings. The mean RLU values on tubes decreased after the initial high values after installation and then showed quite stable values during the six months of the trial (Figure 16). The fact that tubes older than one year had higher RLU values indicate that the RLU values could increase further as tubes age. The variation coefficient for liners varied between 0.12 and up to 0.66 and for tubes it varied between 0.018-0.90 during the sampling period (Table 4). The ATP level of the water on farm A, varied between 9-82 RLU throughout the study which was considered as a low value and a good hygienic status.
0
1000
2000
3000
4000
5000
6000
6Apr-14
96Apr-22
120Apr-24
516May-27
852Jun-24
1272Jul-29
1632Aug-28
2028Sep-30
2400Oct-31
3000Apr-14
RLU
Number of milkings and sampling date
Liners, farm A
27
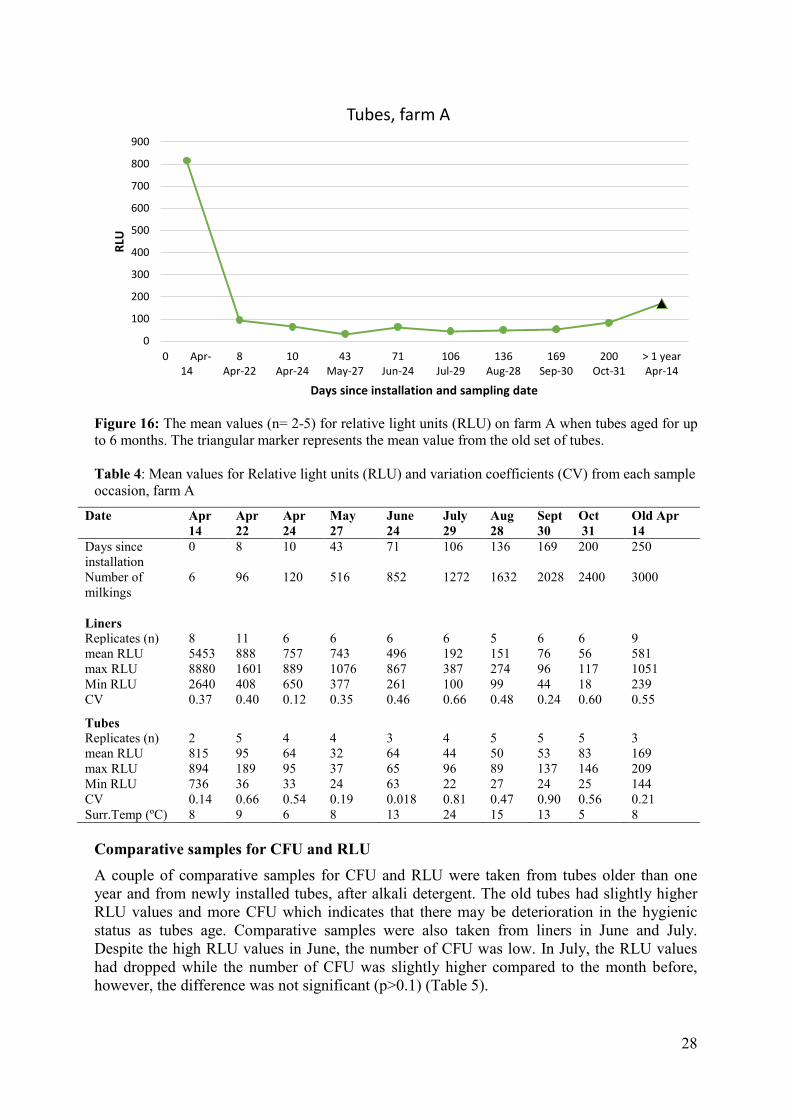
Figure 16: The mean values (n= 2-5) for relative light units (RLU) on farm A when tubes aged for up to 6 months. The triangular marker represents the mean value from the old set of tubes. Table 4: Mean values for Relative light units (RLU) and variation coefficients (CV) from each sample occasion, farm A
Date Apr 14
Apr 22
Apr 24
May 27
June 24
July 29
Aug 28
Sept 30
Oct 31
Old Apr 14
Days since installation
0 8 10 43 71 106 136 169 200 250
Number of milkings Liners
6 96 120 516 852 1272 1632 2028 2400 3000
Replicates (n) 8 11 6 6 6 6 5 6 6 9 mean RLU 5453 888 757 743 496 192 151 76 56 581 max RLU 8880 1601 889 1076 867 387 274 96 117 1051 Min RLU 2640 408 650 377 261 100 99 44 18 239 CV 0.37 0.40 0.12 0.35 0.46 0.66 0.48 0.24 0.60 0.55
Tubes Replicates (n) 2 5 4 4 3 4 5 5 5 3 mean RLU 815 95 64 32 64 44 50 53 83 169 max RLU 894 189 95 37 65 96 89 137 146 209 Min RLU 736 36 33 24 63 22 27 24 25 144 CV 0.14 0.66 0.54 0.19 0.018 0.81 0.47 0.90 0.56 0.21 Surr.Temp (ºC) 8 9 6 8 13 24 15 13 5 8
Comparative samples for CFU and RLU A couple of comparative samples for CFU and RLU were taken from tubes older than one year and from newly installed tubes, after alkali detergent. The old tubes had slightly higher RLU values and more CFU which indicates that there may be deterioration in the hygienic status as tubes age. Comparative samples were also taken from liners in June and July. Despite the high RLU values in June, the number of CFU was low. In July, the RLU values had dropped while the number of CFU was slightly higher compared to the month before, however, the difference was not significant (p>0.1) (Table 5).
0
100
200
300
400
500
600
700
800
900
0 Apr-14
8Apr-22
10Apr-24
43May-27
71Jun-24
106Jul-29
136Aug-28
169Sep-30
200Oct-31
> 1 yearApr-14
RLU
Days since installation and sampling date
Tubes, farm A
28
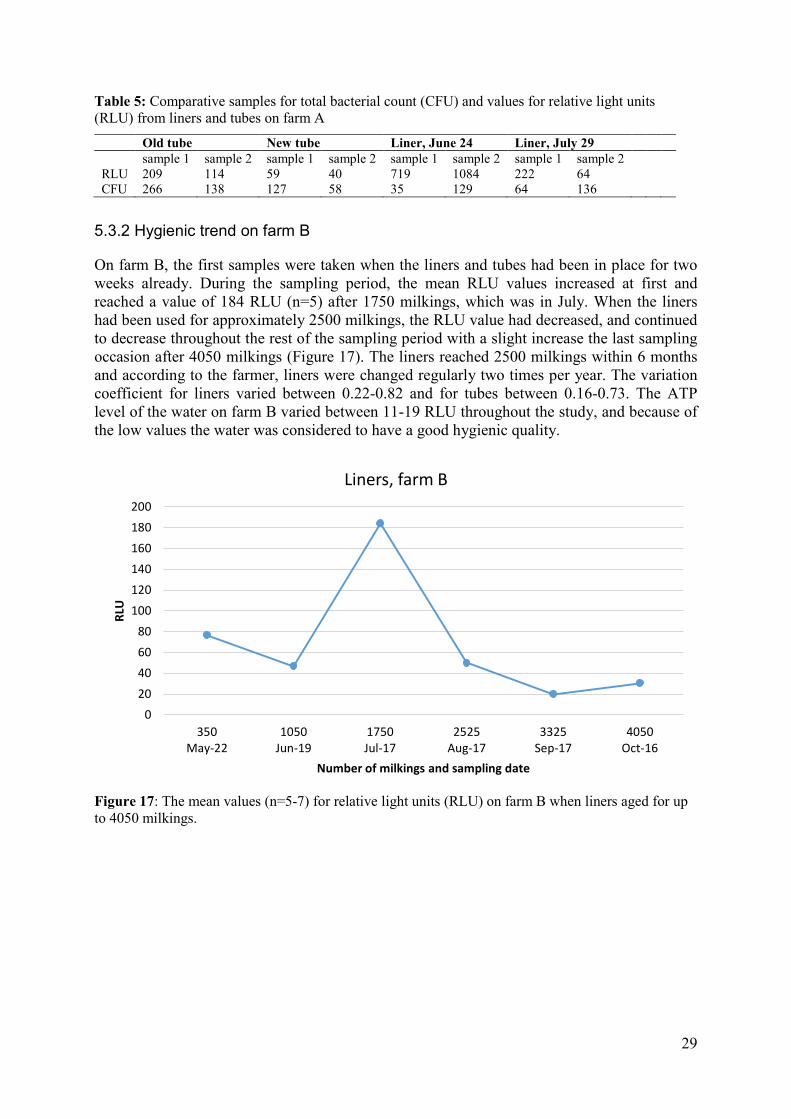
Table 5: Comparative samples for total bacterial count (CFU) and values for relative light units (RLU) from liners and tubes on farm A
Old tube New tube Liner, June 24 Liner, July 29 sample 1 sample 2 sample 1 sample 2 sample 1 sample 2 sample 1 sample 2 RLU 209 114 59 40 719 1084 222 64 CFU 266 138 127 58 35 129 64 136
5.3.2 Hygienic trend on farm B
On farm B, the first samples were taken when the liners and tubes had been in place for two weeks already. During the sampling period, the mean RLU values increased at first and reached a value of 184 RLU (n=5) after 1750 milkings, which was in July. When the liners had been used for approximately 2500 milkings, the RLU value had decreased, and continued to decrease throughout the rest of the sampling period with a slight increase the last sampling occasion after 4050 milkings (Figure 17). The liners reached 2500 milkings within 6 months and according to the farmer, liners were changed regularly two times per year. The variation coefficient for liners varied between 0.22-0.82 and for tubes between 0.16-0.73. The ATP level of the water on farm B varied between 11-19 RLU throughout the study, and because of the low values the water was considered to have a good hygienic quality.
Figure 17: The mean values (n=5-7) for relative light units (RLU) on farm B when liners aged for up to 4050 milkings.
020406080
100120140160180200
350May-22
1050Jun-19
1750Jul-17
2525Aug-17
3325Sep-17
4050Oct-16
RLU
Number of milkings and sampling date
Liners, farm B
29
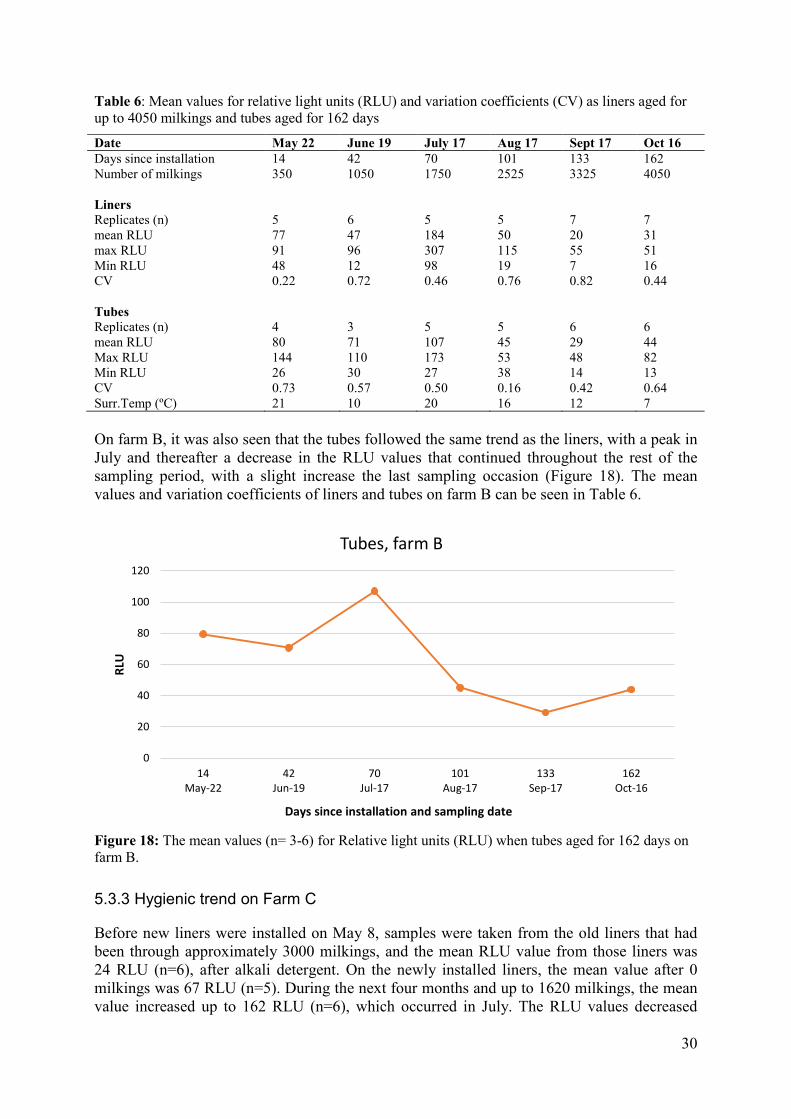
Table 6: Mean values for relative light units (RLU) and variation coefficients (CV) as liners aged for up to 4050 milkings and tubes aged for 162 days
Date May 22 June 19 July 17 Aug 17 Sept 17 Oct 16 Days since installation 14 42 70 101 133 162 Number of milkings 350 1050 1750 2525 3325 4050 Liners
Replicates (n) 5 6 5 5 7 7 mean RLU 77 47 184 50 20 31 max RLU 91 96 307 115 55 51 Min RLU 48 12 98 19 7 16 CV 0.22 0.72 0.46 0.76 0.82 0.44 Tubes
Replicates (n) 4 3 5 5 6 6 mean RLU 80 71 107 45 29 44 Max RLU 144 110 173 53 48 82 Min RLU 26 30 27 38 14 13 CV 0.73 0.57 0.50 0.16 0.42 0.64 Surr.Temp (ºC) 21 10 20 16 12 7 On farm B, it was also seen that the tubes followed the same trend as the liners, with a peak in July and thereafter a decrease in the RLU values that continued throughout the rest of the sampling period, with a slight increase the last sampling occasion (Figure 18). The mean values and variation coefficients of liners and tubes on farm B can be seen in Table 6.
Figure 18: The mean values (n= 3-6) for Relative light units (RLU) when tubes aged for 162 days on farm B.
5.3.3 Hygienic trend on Farm C
Before new liners were installed on May 8, samples were taken from the old liners that had been through approximately 3000 milkings, and the mean RLU value from those liners was 24 RLU (n=6), after alkali detergent. On the newly installed liners, the mean value after 0 milkings was 67 RLU (n=5). During the next four months and up to 1620 milkings, the mean value increased up to 162 RLU (n=6), which occurred in July. The RLU values decreased
0
20
40
60
80
100
120
14May-22
42Jun-19
70Jul-17
101Aug-17
133Sep-17
162Oct-16
RLU
Days since installation and sampling date
Tubes, farm B
30
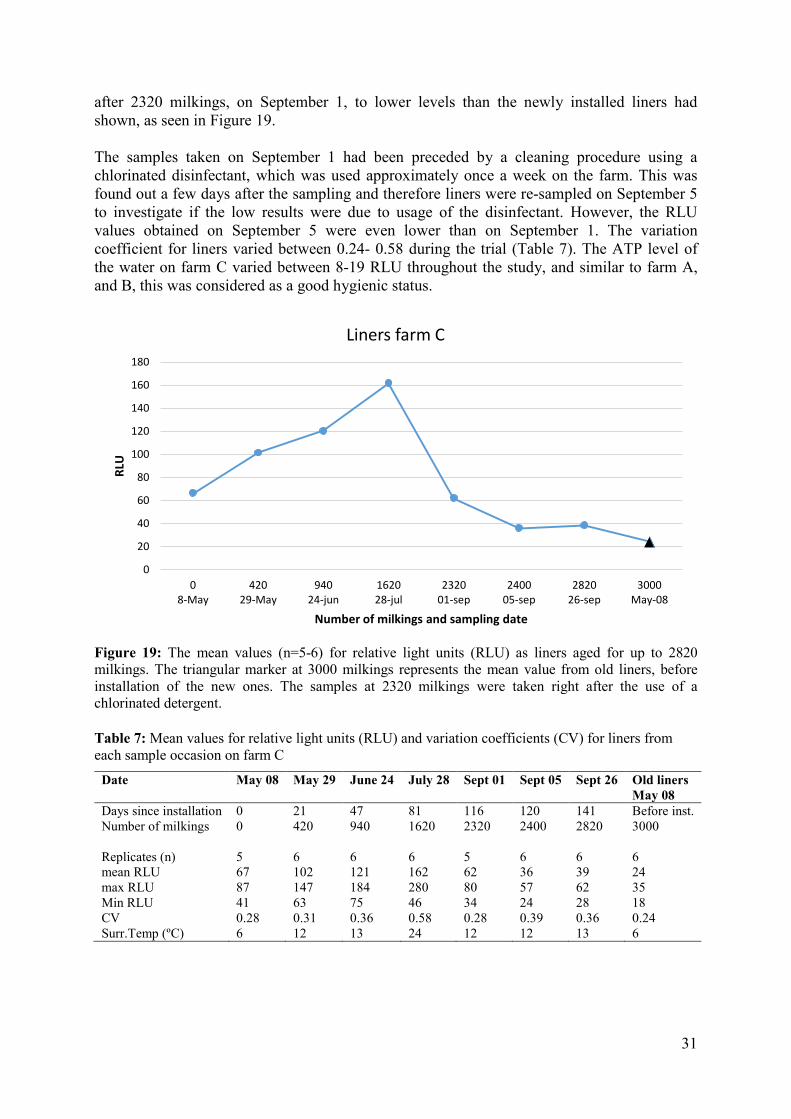
after 2320 milkings, on September 1, to lower levels than the newly installed liners had shown, as seen in Figure 19. The samples taken on September 1 had been preceded by a cleaning procedure using a chlorinated disinfectant, which was used approximately once a week on the farm. This was found out a few days after the sampling and therefore liners were re-sampled on September 5 to investigate if the low results were due to usage of the disinfectant. However, the RLU values obtained on September 5 were even lower than on September 1. The variation coefficient for liners varied between 0.24- 0.58 during the trial (Table 7). The ATP level of the water on farm C varied between 8-19 RLU throughout the study, and similar to farm A, and B, this was considered as a good hygienic status.
Figure 19: The mean values (n=5-6) for relative light units (RLU) as liners aged for up to 2820 milkings. The triangular marker at 3000 milkings represents the mean value from old liners, before installation of the new ones. The samples at 2320 milkings were taken right after the use of a chlorinated detergent. Table 7: Mean values for relative light units (RLU) and variation coefficients (CV) for liners from each sample occasion on farm C
Date May 08 May 29 June 24 July 28 Sept 01 Sept 05 Sept 26 Old liners May 08
Days since installation 0 21 47 81 116 120 141 Before inst. Number of milkings 0 420 940 1620 2320 2400 2820 3000
Replicates (n) 5 6 6 6 5 6 6 6 mean RLU 67 102 121 162 62 36 39 24 max RLU 87 147 184 280 80 57 62 35 Min RLU 41 63 75 46 34 24 28 18 CV 0.28 0.31 0.36 0.58 0.28 0.39 0.36 0.24 Surr.Temp (ºC) 6 12 13 24 12 12 13 6
0
20
40
60
80
100
120
140
160
180
08-May
42029-May
94024-jun
162028-jul
232001-sep
240005-sep
282026-sep
3000May-08
RLU
Number of milkings and sampling date
Liners farm C
31
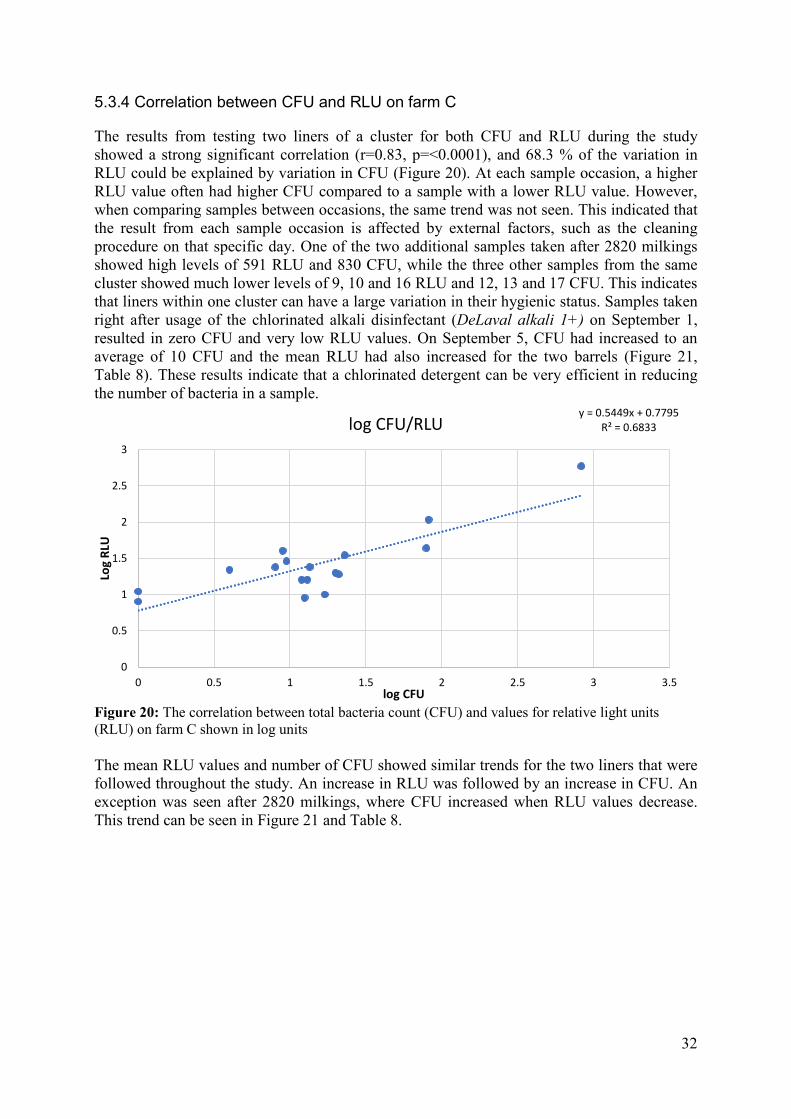
5.3.4 Correlation between CFU and RLU on farm C
The results from testing two liners of a cluster for both CFU and RLU during the study showed a strong significant correlation (r=0.83, p=<0.0001), and 68.3 % of the variation in RLU could be explained by variation in CFU (Figure 20). At each sample occasion, a higher RLU value often had higher CFU compared to a sample with a lower RLU value. However, when comparing samples between occasions, the same trend was not seen. This indicated that the result from each sample occasion is affected by external factors, such as the cleaning procedure on that specific day. One of the two additional samples taken after 2820 milkings showed high levels of 591 RLU and 830 CFU, while the three other samples from the same cluster showed much lower levels of 9, 10 and 16 RLU and 12, 13 and 17 CFU. This indicates that liners within one cluster can have a large variation in their hygienic status. Samples taken right after usage of the chlorinated alkali disinfectant (DeLaval alkali 1+) on September 1, resulted in zero CFU and very low RLU values. On September 5, CFU had increased to an average of 10 CFU and the mean RLU had also increased for the two barrels (Figure 21, Table 8). These results indicate that a chlorinated detergent can be very efficient in reducing the number of bacteria in a sample.
Figure 20: The correlation between total bacteria count (CFU) and values for relative light units (RLU) on farm C shown in log units The mean RLU values and number of CFU showed similar trends for the two liners that were followed throughout the study. An increase in RLU was followed by an increase in CFU. An exception was seen after 2820 milkings, where CFU increased when RLU values decrease. This trend can be seen in Figure 21 and Table 8.
y = 0.5449x + 0.7795 R² = 0.6833
0
0.5
1
1.5
2
2.5
3
0 0.5 1 1.5 2 2.5 3 3.5
Log
RLU
log CFU
log CFU/RLU
32
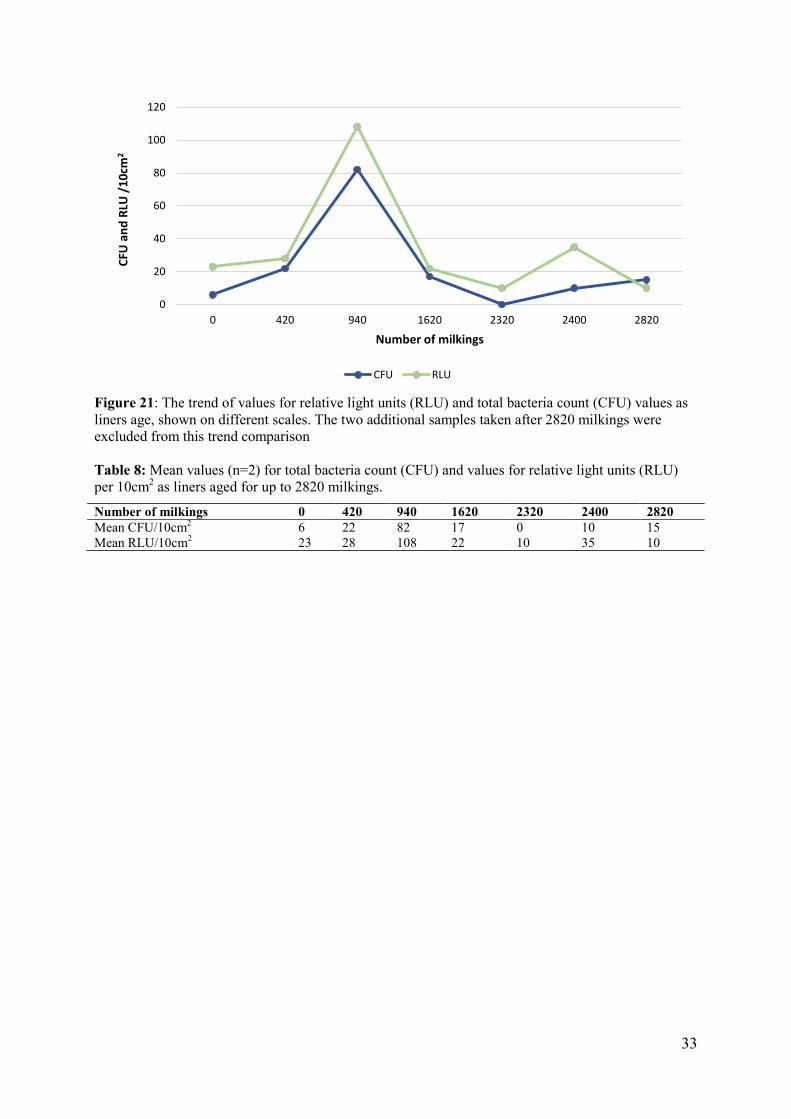
Figure 21: The trend of values for relative light units (RLU) and total bacteria count (CFU) values as liners age, shown on different scales. The two additional samples taken after 2820 milkings were excluded from this trend comparison Table 8: Mean values (n=2) for total bacteria count (CFU) and values for relative light units (RLU) per 10cm2 as liners aged for up to 2820 milkings.
Number of milkings 0 420 940 1620 2320 2400 2820 Mean CFU/10cm2 6 22 82 17 0 10 15 Mean RLU/10cm2 23 28 108 22 10 35 10
0
20
40
60
80
100
120
0 420 940 1620 2320 2400 2820
CFU
and
RLU
/10
cm2
Number of milkings
CFU RLU
33
6 Discussion
The first part of the study aimed to establish a test procedure for hygiene testing of liners and tubes that would give reliable and reproducible results. When testing different sampling parameters, the results from this study showed that location, milk point and type of detergent had significant effects on the RLU values. Differences in RLU values between locations were found for both liners and tubes and it was difficult to obtain a high reproducibility between measurements using ATP bioluminescence. The variation between locations was possibly due to the different areas of the swabbed locations, the amount of water remaining on the surface, the shape of the swabbed location (such as if the area was easy to clean or not) as well as the degree of physical deterioration of the rubber on the specific location. The results from this study are in accordance with studies by Reinemann and Ruegg (2000) as well as Benfalk et al. (2001), who stated that their results showed a large variation between test sites. Reinemann and Ruegg (2000) mentioned that the variability in the ATP data could be reduced significantly by using the same measurement location over time. In the present study when a test procedure had been established and the same measurement location was used at all sample occasions, there was still sometimes a large variation between measurements. The variation coefficient in part one and part two of the study varied from 0.12 to 0.82 on liners and from 0.018-0.90 on tubes. In comparison to this, Nieuwenhof (1996) reported a variation coefficient of 0.37 when using ATP bioluminescence on equipment in a milking parlour. A low variation coefficient indicate a good precision in the measurements, however, there are no defined limits for what is considered low or high. A variation coefficient of 0 would be a perfect replicate. In the study where the repeatability of 3MTMClean-TraceTMATP was investigated, a variation coefficient of 0.074 was obtained when swabs were prepared with identical amounts of ATP for each test reading (Simpson et al. 2006). Samples in this study were taken from different test sites in field situations where the amount of ATP was varying, and therefore it could not be expected to reach as high repeatability as in the study by Simpson et al. (2006). A significant difference in the hygienic status between milk points on the left and right side of the parlour was seen (Figure 11), and the degree of contamination differed between liners on the same or adjacent clusters, as seen in Figure 10. Differences between liners on a cluster were also seen when testing all liners of a cluster for both CFU and RLU after 2820 milkings on farm C. One of four liners showed high values of 591 RLU and 830 CFU, whereas the other three liners showed very low levels between 9 to 16 RLU and 12 to 17 CFU. RLU values therefore appeared to be affected by factors that cannot be controlled by the sampler in a field environment. In a milking parlour, the identical sampling condition cannot be created for different liners or tubes. A natural variation in the hygienic status may occur due to local differences in cleaning efficiency in the parlour. For example, uneven distribution of water in the parlour system, as mentioned by Reinemann and Brook (1994), may cause liners and tubes at some milk points to obtain a lower degree of cleaning, which decreases their hygienic status over time. Individual differences in hygiene between liners can also be caused by several other events. At some milk points, liners may be exposed to more physical damage and wear than others. For example, certain cows often kick of the cluster or drop a liner from the teat, so that it is exposed to dirt on the floor and also has to be re-attached. If such cows are usually milked at
34
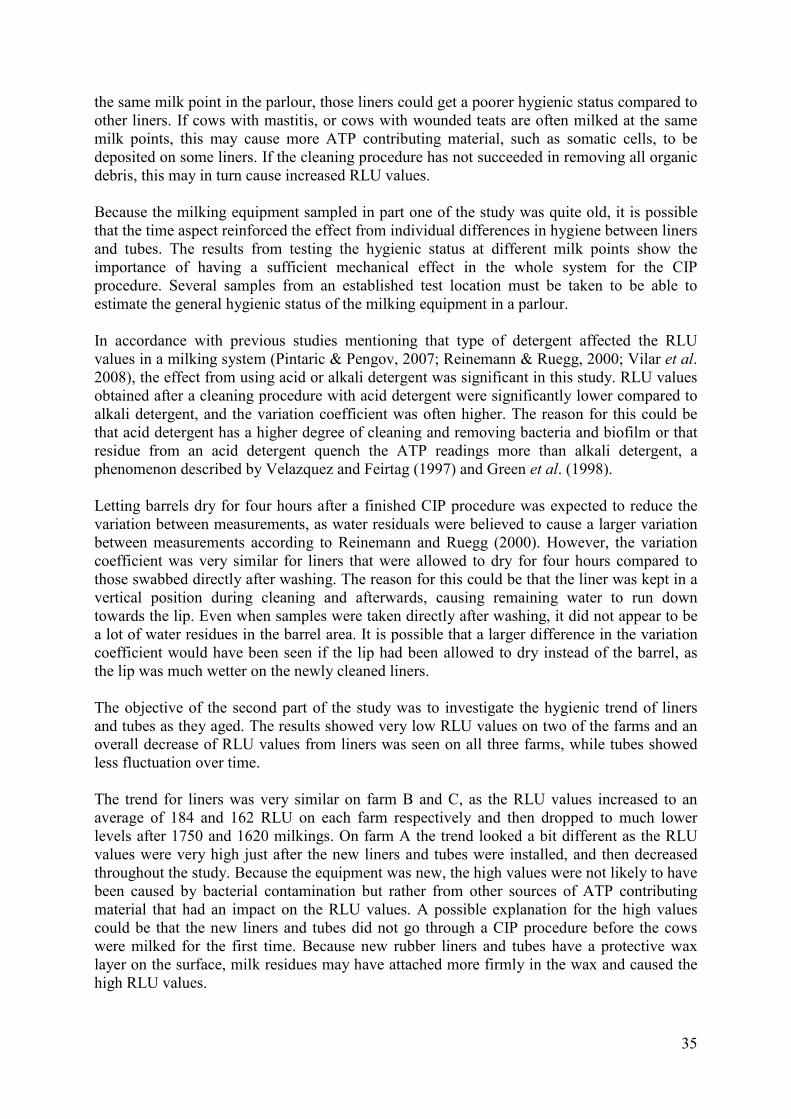
the same milk point in the parlour, those liners could get a poorer hygienic status compared to other liners. If cows with mastitis, or cows with wounded teats are often milked at the same milk points, this may cause more ATP contributing material, such as somatic cells, to be deposited on some liners. If the cleaning procedure has not succeeded in removing all organic debris, this may in turn cause increased RLU values. Because the milking equipment sampled in part one of the study was quite old, it is possible that the time aspect reinforced the effect from individual differences in hygiene between liners and tubes. The results from testing the hygienic status at different milk points show the importance of having a sufficient mechanical effect in the whole system for the CIP procedure. Several samples from an established test location must be taken to be able to estimate the general hygienic status of the milking equipment in a parlour. In accordance with previous studies mentioning that type of detergent affected the RLU values in a milking system (Pintaric & Pengov, 2007; Reinemann & Ruegg, 2000; Vilar et al. 2008), the effect from using acid or alkali detergent was significant in this study. RLU values obtained after a cleaning procedure with acid detergent were significantly lower compared to alkali detergent, and the variation coefficient was often higher. The reason for this could be that acid detergent has a higher degree of cleaning and removing bacteria and biofilm or that residue from an acid detergent quench the ATP readings more than alkali detergent, a phenomenon described by Velazquez and Feirtag (1997) and Green et al. (1998). Letting barrels dry for four hours after a finished CIP procedure was expected to reduce the variation between measurements, as water residuals were believed to cause a larger variation between measurements according to Reinemann and Ruegg (2000). However, the variation coefficient was very similar for liners that were allowed to dry for four hours compared to those swabbed directly after washing. The reason for this could be that the liner was kept in a vertical position during cleaning and afterwards, causing remaining water to run down towards the lip. Even when samples were taken directly after washing, it did not appear to be a lot of water residues in the barrel area. It is possible that a larger difference in the variation coefficient would have been seen if the lip had been allowed to dry instead of the barrel, as the lip was much wetter on the newly cleaned liners. The objective of the second part of the study was to investigate the hygienic trend of liners and tubes as they aged. The results showed very low RLU values on two of the farms and an overall decrease of RLU values from liners was seen on all three farms, while tubes showed less fluctuation over time. The trend for liners was very similar on farm B and C, as the RLU values increased to an average of 184 and 162 RLU on each farm respectively and then dropped to much lower levels after 1750 and 1620 milkings. On farm A the trend looked a bit different as the RLU values were very high just after the new liners and tubes were installed, and then decreased throughout the study. Because the equipment was new, the high values were not likely to have been caused by bacterial contamination but rather from other sources of ATP contributing material that had an impact on the RLU values. A possible explanation for the high values could be that the new liners and tubes did not go through a CIP procedure before the cows were milked for the first time. Because new rubber liners and tubes have a protective wax layer on the surface, milk residues may have attached more firmly in the wax and caused the high RLU values.
35
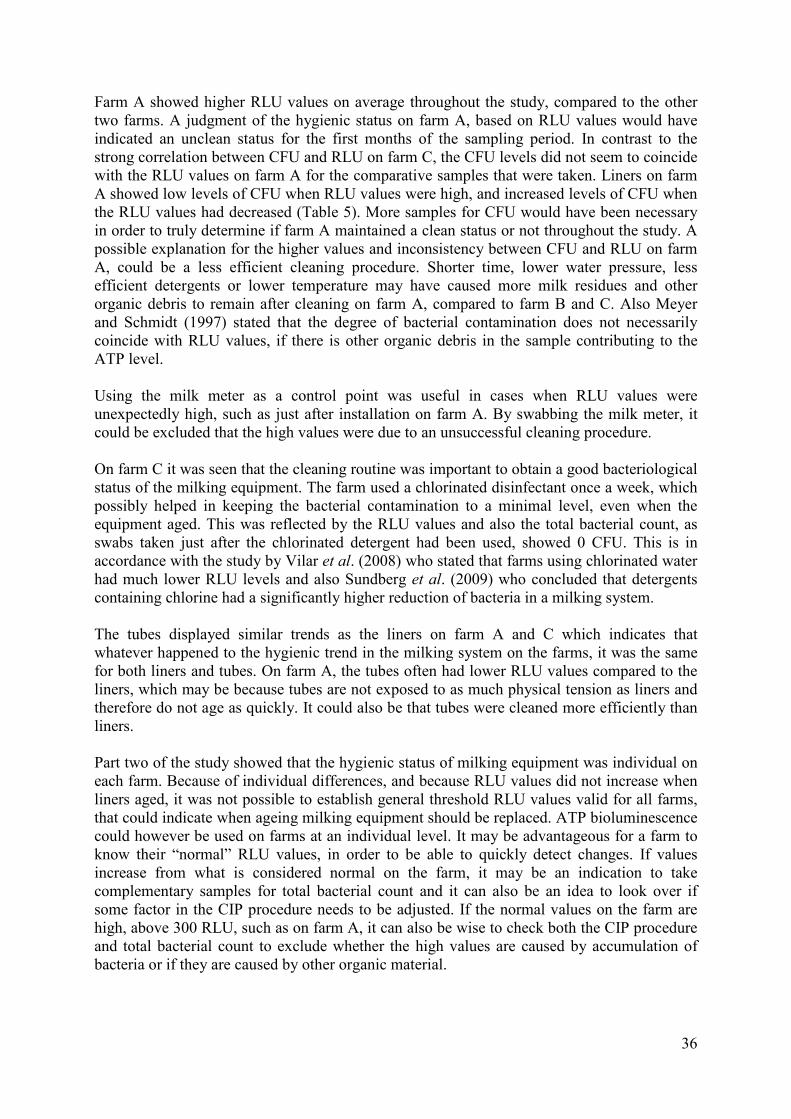
Farm A showed higher RLU values on average throughout the study, compared to the other two farms. A judgment of the hygienic status on farm A, based on RLU values would have indicated an unclean status for the first months of the sampling period. In contrast to the strong correlation between CFU and RLU on farm C, the CFU levels did not seem to coincide with the RLU values on farm A for the comparative samples that were taken. Liners on farm A showed low levels of CFU when RLU values were high, and increased levels of CFU when the RLU values had decreased (Table 5). More samples for CFU would have been necessary in order to truly determine if farm A maintained a clean status or not throughout the study. A possible explanation for the higher values and inconsistency between CFU and RLU on farm A, could be a less efficient cleaning procedure. Shorter time, lower water pressure, less efficient detergents or lower temperature may have caused more milk residues and other organic debris to remain after cleaning on farm A, compared to farm B and C. Also Meyer and Schmidt (1997) stated that the degree of bacterial contamination does not necessarily coincide with RLU values, if there is other organic debris in the sample contributing to the ATP level. Using the milk meter as a control point was useful in cases when RLU values were unexpectedly high, such as just after installation on farm A. By swabbing the milk meter, it could be excluded that the high values were due to an unsuccessful cleaning procedure. On farm C it was seen that the cleaning routine was important to obtain a good bacteriological status of the milking equipment. The farm used a chlorinated disinfectant once a week, which possibly helped in keeping the bacterial contamination to a minimal level, even when the equipment aged. This was reflected by the RLU values and also the total bacterial count, as swabs taken just after the chlorinated detergent had been used, showed 0 CFU. This is in accordance with the study by Vilar et al. (2008) who stated that farms using chlorinated water had much lower RLU levels and also Sundberg et al. (2009) who concluded that detergents containing chlorine had a significantly higher reduction of bacteria in a milking system. The tubes displayed similar trends as the liners on farm A and C which indicates that whatever happened to the hygienic trend in the milking system on the farms, it was the same for both liners and tubes. On farm A, the tubes often had lower RLU values compared to the liners, which may be because tubes are not exposed to as much physical tension as liners and therefore do not age as quickly. It could also be that tubes were cleaned more efficiently than liners. Part two of the study showed that the hygienic status of milking equipment was individual on each farm. Because of individual differences, and because RLU values did not increase when liners aged, it was not possible to establish general threshold RLU values valid for all farms, that could indicate when ageing milking equipment should be replaced. ATP bioluminescence could however be used on farms at an individual level. It may be advantageous for a farm to know their “normal” RLU values, in order to be able to quickly detect changes. If values increase from what is considered normal on the farm, it may be an indication to take complementary samples for total bacterial count and it can also be an idea to look over if some factor in the CIP procedure needs to be adjusted. If the normal values on the farm are high, above 300 RLU, such as on farm A, it can also be wise to check both the CIP procedure and total bacterial count to exclude whether the high values are caused by accumulation of bacteria or if they are caused by other organic material.
36
It is known that rubber material deteriorates with time (Hillerton et al. 2004; Boast et al. 2008; Storgards et al. 1999b) and that bacteria are more prone to biofilm formation and colonization in aged rubber equipment due to a reduced cleanability and development of cracks and crevices (Storgards et al. 1999b; Bremer et al. 2009). It is therefore questionable why RLU values decreased with time when liners and tubes aged. Season may have had an effect on the decreasing values, as the highest RLU values on farm B and C were obtained during the peak of the summer when the ambient temperatures had been high. Elmoslemany et al. (2010) and Falkenberg et al. (2005) have in previous studies found that bacterial count in bulk tank milk was positively associated to seasonal effects, where the summer had elevated levels. This strengthens the explanation that the trend curve is mainly affected by ambient temperatures, and in that case liners could maintain a good hygienic quality when they age, as long as the cleaning procedure is successful. The fact that the RLU values on farm A did not peak at the same time as on farm B and C, could possibly be explained by the fact that the RLU values on farm A were affected by other organic debris than bacteria, which could mask a possible peak caused by bacterial growth. The low and decreasing RLU values could also have been caused by other factors. A possible explanation is that the crazed structure of the aged rubber material could contain more detergent residues, which are in turn absorbed by the swab and quench the result, such as described by Velazquez and Feirtag (1997), Lappalainen et al. (2000) and Omidbakhsh (2014). The true hygienic level may then be masked by the fact that detergent residues quench the actual values. If more detergent residues can be kept in the accumulating number of cracks, a decreasing trend would also be seen. Another explanation could be that the surface structure on aged rubber equipment prevents uptake of bacteria when using swabs. Only a low proportion of existing bacteria are said to be recovered from a swabbed surface (Nieuwenhof, 1996; Moore and Griffith, 2007) and if bacteria are accumulated in cracks and crevices they may be protected from uptake of swabs by the uneven surface structure, which makes it difficult to obtain actual numbers of bacterial contamination. Because the surface structure becomes rougher with age, a trend towards lower values could be caused by this. A fourth possible explanation is that the exopolysaccharide matrix in a biofilm protects the bacteria from being recovered by the swab. Biofilm has been found to decrease the uptake of bacteria from a surface (Bower at al. 1996; Bredholt et al. 1999). This explanation was suggested by Pintaric and Pengov (2007) who also experienced decreasing RLU values when using ATP bioluminescence to hygiene test milking equipment material under laboratory conditions, when no detergent was used. According to instructions from the manufacturer (3M, 2007), values as low as those obtained on farm B and C, represent normal background levels of ATP and may reflect cleaning at a very high level. It may also indicate that detergent residues remained on the swabbed surface or that the swabbing technique is incorrect. Because high values were obtained on farm A, when using the exact same test procedure and swabbing technique as on farm B and C, the low values should not have been caused by an incorrect swabbing technique, but rather by the fact that the cleaning procedure had been very successful or by detergent residues. The fact that one liner of a cluster showed a high RLU value and number of CFU, while the other three liners showed low levels on the same sampling occasion on farm C, indicates that the low values were due to a very efficient cleaning procedure, and that the occasional high values were due to individual differences in hygienic status between liners. The very low values on farm B and C makes it difficult to detect a trend in the hygienic status, since all values obtained on the two farms were considered clean based on the predetermined levels for pass
37
and fail limits. If a classification of the hygienic status would have been made with fewer categories, such as pass, pass with remark and fail, a trend would have been difficult to detect. The second objective in part two of the study was to investigate the correlation between RLU values and total bacterial count. A strong correlation of r= 0.83 between CFU and RLU on farm C was found. This is stronger than the correlation of 0.647, found by Pintaric and Pengov (2007) when they looked at total bacterial count and RLU values in a simulated milking system. It is also stronger than the correlation of r= 0.73 found by Reinemann and Ruegg (2000) when adjacent areas of milking equipment was swabbed. When looking at the trend for CFU and RLU as liners aged, an increase in RLU was clearly followed by an increase in CFU on farm C, which can be seen in Figure 21. Because farm C had very low RLU values in general, this may have been beneficial in order to obtain the strong correlation and similar trend between CFU and RLU values, since there was a low amount of other organic debris affecting the ATP levels. It is possible that in order to obtain a strong correlation, the cleaning procedure must be such that there is a minimum of other organic debris remaining on the surface. This is in line with the statement by Shama and Malik (2013) who mentioned that high correlations could be obtained especially when ATP contributing materials from other sources had been corrected for. A farm with more organic debris remaining on the equipment after cleaning would possibly have a larger discrepancy between CFU and RLU values, where RLU values can be high, whereas the number of CFU are low, such as seen on farm A. It is possible that the obtained values and trends in this study are to some extent affected by the sampler. Even with an established test procedure, it is impossible to perform an identical sampling pattern each time, such as the pressure of the swab and the angle of swabbing. If different samplers would take simultaneous tests, results would also probably differ. The hygienic trend may have looked different if samples had been taken from one liner at each milk point instead of sampling liners from only two milk points in the parlour. This is something that could have been done differently in the study, however; sampling from the same clusters at all occasions was done in order to reduce the variation between measurements. The study could also have been complemented with more information regarding details about the cleaning procedure since this is likely to have caused some of the differences between farms. 7 Conclusions
Based on the results from this study, the conclusion is that ATP bioluminescence may be used to evaluate and monitor the overall hygienic status in a milking system at an individual farm level. However, if values are high it is necessary with complementary samples for total bacterial count. The ATP bioluminescence method must be used carefully when assessing bacterial contamination, as high values can be obtained if there is other organic matter than bacteria in a sample which may cause wrong interpretations of the results. ATP bioluminescence also shows potential to be used to check whether the CIP procedure is functioning properly, or to assess the effect of different detergents. Using an established test procedure makes it possible to obtain fairly reproducible results in a milking parlour. The hygienic status of different liners and tubes in the same parlour could show large variations, possibly due to environmental factors that affect the results under field conditions. The hygienic trend of milking equipment did not decrease with age in this study, and with a well-functioning cleaning procedure, it appeared as if liners and tubes can maintain a clean
38
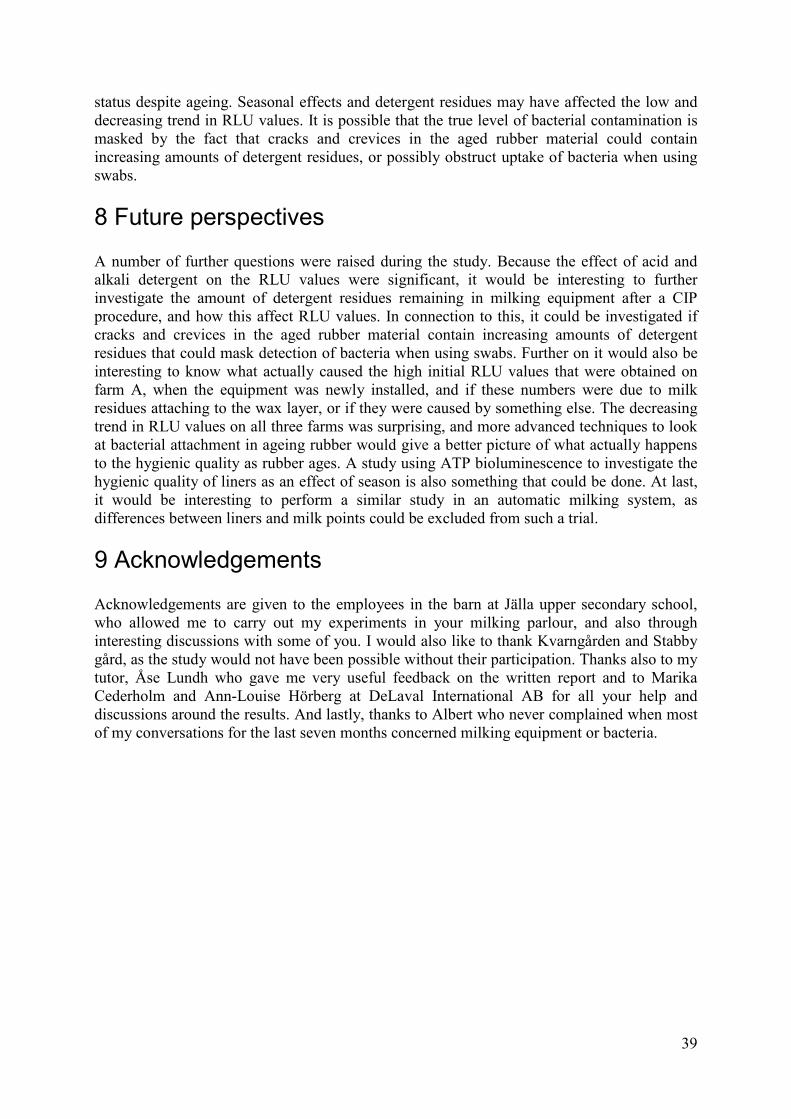
status despite ageing. Seasonal effects and detergent residues may have affected the low and decreasing trend in RLU values. It is possible that the true level of bacterial contamination is masked by the fact that cracks and crevices in the aged rubber material could contain increasing amounts of detergent residues, or possibly obstruct uptake of bacteria when using swabs. 8 Future perspectives
A number of further questions were raised during the study. Because the effect of acid and alkali detergent on the RLU values were significant, it would be interesting to further investigate the amount of detergent residues remaining in milking equipment after a CIP procedure, and how this affect RLU values. In connection to this, it could be investigated if cracks and crevices in the aged rubber material contain increasing amounts of detergent residues that could mask detection of bacteria when using swabs. Further on it would also be interesting to know what actually caused the high initial RLU values that were obtained on farm A, when the equipment was newly installed, and if these numbers were due to milk residues attaching to the wax layer, or if they were caused by something else. The decreasing trend in RLU values on all three farms was surprising, and more advanced techniques to look at bacterial attachment in ageing rubber would give a better picture of what actually happens to the hygienic quality as rubber ages. A study using ATP bioluminescence to investigate the hygienic quality of liners as an effect of season is also something that could be done. At last, it would be interesting to perform a similar study in an automatic milking system, as differences between liners and milk points could be excluded from such a trial. 9 Acknowledgements
Acknowledgements are given to the employees in the barn at Jälla upper secondary school, who allowed me to carry out my experiments in your milking parlour, and also through interesting discussions with some of you. I would also like to thank Kvarngården and Stabby gård, as the study would not have been possible without their participation. Thanks also to my tutor, Åse Lundh who gave me very useful feedback on the written report and to Marika Cederholm and Ann-Louise Hörberg at DeLaval International AB for all your help and discussions around the results. And lastly, thanks to Albert who never complained when most of my conversations for the last seven months concerned milking equipment or bacteria.
39
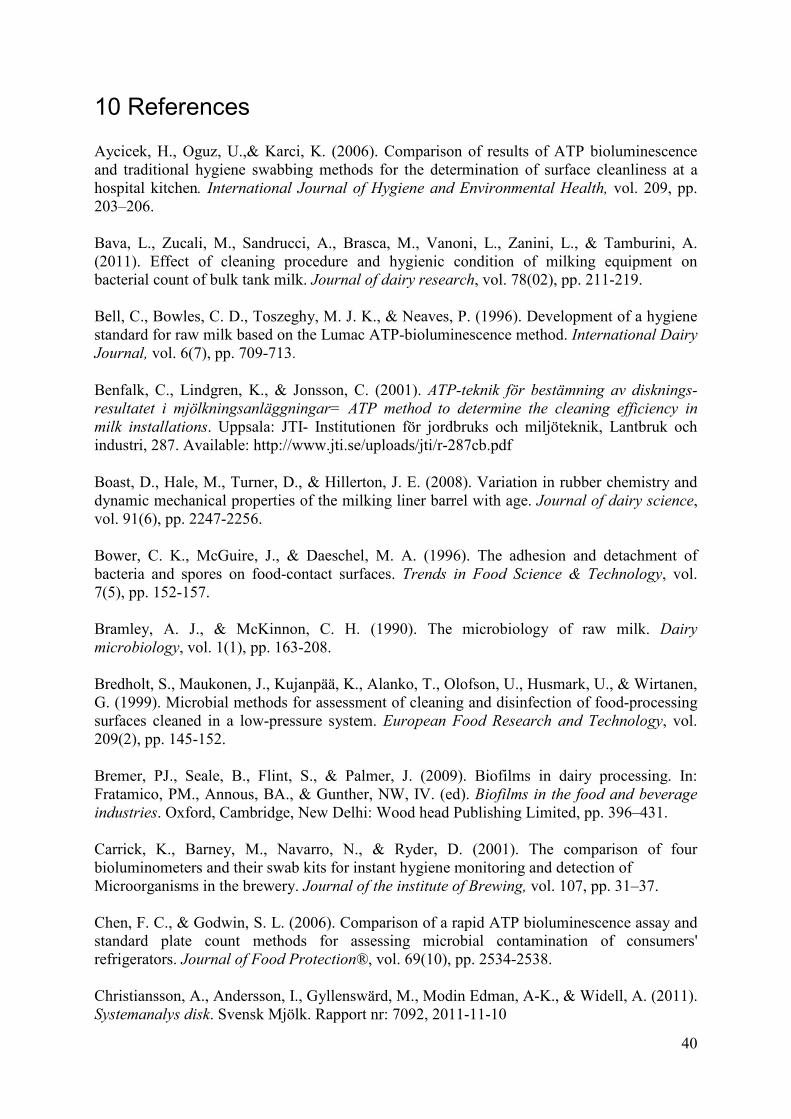
10 References
Aycicek, H., Oguz, U.,& Karci, K. (2006). Comparison of results of ATP bioluminescence and traditional hygiene swabbing methods for the determination of surface cleanliness at a hospital kitchen. International Journal of Hygiene and Environmental Health, vol. 209, pp. 203–206. Bava, L., Zucali, M., Sandrucci, A., Brasca, M., Vanoni, L., Zanini, L., & Tamburini, A. (2011). Effect of cleaning procedure and hygienic condition of milking equipment on bacterial count of bulk tank milk. Journal of dairy research, vol. 78(02), pp. 211-219. Bell, C., Bowles, C. D., Toszeghy, M. J. K., & Neaves, P. (1996). Development of a hygiene standard for raw milk based on the Lumac ATP-bioluminescence method. International Dairy Journal, vol. 6(7), pp. 709-713.
Benfalk, C., Lindgren, K., & Jonsson, C. (2001). ATP-teknik för bestämning av disknings-resultatet i mjölkningsanläggningar= ATP method to determine the cleaning efficiency in milk installations. Uppsala: JTI- Institutionen för jordbruks och miljöteknik, Lantbruk och industri, 287. Available: http://www.jti.se/uploads/jti/r-287cb.pdf
Boast, D., Hale, M., Turner, D., & Hillerton, J. E. (2008). Variation in rubber chemistry and dynamic mechanical properties of the milking liner barrel with age. Journal of dairy science, vol. 91(6), pp. 2247-2256. Bower, C. K., McGuire, J., & Daeschel, M. A. (1996). The adhesion and detachment of bacteria and spores on food-contact surfaces. Trends in Food Science & Technology, vol. 7(5), pp. 152-157. Bramley, A. J., & McKinnon, C. H. (1990). The microbiology of raw milk. Dairy microbiology, vol. 1(1), pp. 163-208. Bredholt, S., Maukonen, J., Kujanpää, K., Alanko, T., Olofson, U., Husmark, U., & Wirtanen, G. (1999). Microbial methods for assessment of cleaning and disinfection of food-processing surfaces cleaned in a low-pressure system. European Food Research and Technology, vol. 209(2), pp. 145-152. Bremer, PJ., Seale, B., Flint, S., & Palmer, J. (2009). Biofilms in dairy processing. In: Fratamico, PM., Annous, BA., & Gunther, NW, IV. (ed). Biofilms in the food and beverage industries. Oxford, Cambridge, New Delhi: Wood head Publishing Limited, pp. 396–431. Carrick, K., Barney, M., Navarro, N., & Ryder, D. (2001). The comparison of four bioluminometers and their swab kits for instant hygiene monitoring and detection of Microorganisms in the brewery. Journal of the institute of Brewing, vol. 107, pp. 31–37. Chen, F. C., & Godwin, S. L. (2006). Comparison of a rapid ATP bioluminescence assay and standard plate count methods for assessing microbial contamination of consumers' refrigerators. Journal of Food Protection®, vol. 69(10), pp. 2534-2538. Christiansson, A., Andersson, I., Gyllenswärd, M., Modin Edman, A-K., & Widell, A. (2011). Systemanalys disk. Svensk Mjölk. Rapport nr: 7092, 2011-11-10
40
Clegg, L. F. L. (1962). Cleaning and sterilization of milking equipment on the farm. FAO/WHO, Milk hygiene. World Health Organization, Geneva, pp. 195-220. Corbitt, A.J., Bennion, N., & Forsythe, S.J. (2000). Adenylate kinase amplification of ATP Bioluminescence for hygiene monitoring in the food and beverage industry. Letters in Applied Microbiology, vol. 30, pp. 443–447 Davidson, C.A., Griffith, C.J., Peters, A.C., & Fielding, L.M. (1999). Evaluation of two methods for monitoring surface cleanliness-ATP bioluminescence and traditional hygiene swabbing. Luminescence, vol. 14, pp. 33–38. Davis, M. A., & Reinemann, D. J. (2001). Effect of Liner Age on Milking Characteristics of the Liner. In: Proceedings, AABP-NMC International Symposium on Mastitis and Milk Quality, Vancouver, BC, Canada. DeLaval. (2010). DeLaval cleaning unit C200. Availble: http://www.delaval.com/ImageVaultFiles/id_193/cf_5/cleaning_unit_C200.PDF [2014-09-15] Elmoslemany, A. M., Keefe, G. P., Dohoo, I. R., & Jayarao, B. M. (2009a). Risk factors for bacteriological quality of bulk tank milk in Prince Edward Island dairy herds. Part 1: Overall risk factors. Journal of dairy science, vol. 92(6), pp. 2634-2643. Elmoslemany, A. M., Keefe, G. P., Dohoo, I. R., & Jayarao, B. M. (2009b). Risk factors for bacteriological quality of bulk tank milk in Prince Edward Island dairy herds. Part 2: Bacteria count-specific risk factors. Journal of dairy science, vol. 92(6), pp. 2644-2652. Elmoslemany, A. M., Keefe, G. P., Dohoo, I. R., Wichtel, J. J., Stryhn, H., & Dingwell, R. T. (2010). The association between bulk tank milk analysis for raw milk quality and on-farm management practices. Preventive veterinary medicine, vol. 95(1), pp. 32-40. Emanuelson U., Olsson T., Mattila T., Åström G., & Holmberg O. (1988). Effects of parity and stage of lactation on adenosine triphosphate, somatic cell count and antitrypsin content in cow’s milk. Journal of Dairy Research, vol. 55, pp. 49–55. Falkenberg, U., Reinhold, P., Hildebrandt, G., Heuwieser, W., Tančin, V., Mihina, Š., & Uhrinčať, M. (2005). Development of microbiological colonisation in a newly installed milking system. ICAR Technical Series, vol. 10, pp. 171-176. Finger, R., & Sischo, W. M. (2001). Bioluminescence as a technique to evaluate udder preparation. Journal of dairy science, vol. 84(4), pp. 818-823. Fraga, H. (2008). Firefly luminescence: A historical perspective and recent developments. Photochemical & Photobiological Sciences, vol. 7(2), pp. 146-158. Frundzhyan, V. G., Parkhomenko, I. M., Brovko, L. Y., & Ugarova, N. N. (2008). Improved bioluminescent assay of somatic cell counts in raw milk. Journal of dairy research, vol. 75(03), pp. 279-283.
41
Gibson, H., Taylor, J. H., Hall, K. E., & Holah, J. T. (1999). Effectiveness of cleaning techniques used in the food industry in terms of the removal of bacterial biofilms. Journal of applied microbiology, vol. 87(1), pp. 41-48. Green, T.A., Russel, S.M., & Fletcher, D.L. (1998). Effect of chemical sanitizing agents on ATP bioluminescence measurements. Journal of Food Protection, vol. 61(8), pp. 1013-1017 Griffiths, M.W. (1993). Applications of bioluminescence in the dairy industry. Journal of Dairy Science, vol. 76, pp. 3118–3125 Hillerton, E., Boast, D., Middleton, N., & Ohnstad, I. (2004). Changing in milking-liner performance with age. Bulletin-International Dairy Federation, (388), pp. 35-40. Hood, S. K., & Zottola, E. A. (1995). Biofilms in food processing. Food control, vol. 6(1), pp. 9-18. Indevex Watertech AB. (2011). 3MTMClean-TraceTM, Snabb och säker hygienkontroll. Indevex Watertech AB, Backa Bergögata 5, Hisingsbacka, Sweden. Available: http://www.iwab.se/Documents/IWAB%20Clean-Trace%20Broschyr.pdf Kelly, P. T., O'Sullivan, K., Berry, D. P., More, S. J., Meaney, W. J., O'Callaghan, E. J., & O'Brien, B. (2009). Farm management factors associated with bulk tank total bacterial count in Irish dairy herds during 2006/07. Irish veterinary journal, vol. 62(1), pp. 36. Kumar, C. G., & Anand, S. K. (1998). Significance of microbial biofilms in food industry: a review. International journal of food microbiology, vol. 42(1), pp. 9-27. Landers, T.F., Hoet, A., & Wittum, T.E. (2010). Swab type, moistening, and preenrichment for Staphylococcus aureus on environmental surfaces. J. Clin. Microbiol, vol. 48, pp. 2235–2236. Lappalainen,J., Loikkanen,S., Havana,M., Karp,M., Sjöberg,A.M., & Wirtanen, G. (2000). Microbial testing methods for detection of residual cleaning agents and disinfectants- prevention of ATP bioluminescence measurement errors in the food industry. Journal of Food protection, vol. 63(2), pp. 210-215. Latorre, A. A., Van Kessel, J. S., Karns, J. S., Zurakowski, M. J., Pradhan, A. K., Boor, K. J., & Schukken, Y. H. (2010). Biofilm in milking equipment on a dairy farm as a potential source of bulk tank milk contamination with Listeria monocytogenes. Journal of dairy science, vol. 93(6), pp. 2792-2802. Latorre, A. A., Van Kessel, J. A. S., Karns, J. S., Zurakowski, M. J., Pradhan, A. K., Zadoks, R. N., & Schukken, Y. H. (2009). Molecular ecology of Listeria monocytogenes: evidence for a reservoir in milking equipment on a dairy farm. Applied and environmental microbiology, vol. 75(5), pp. 1315-1323. Mark, J. E., Erman, B., & Roland, M. (Eds.). (2013). The science and technology of rubber. Academic Press, pp 444-446.
42
Meyer, M. J., & Schmidt, K. A. (1997). ATP bioluminescence can evaluate cleaning and sanitizing effectiveness in the milking parlor. Dairy day 1997, conference paper. Kansas Agricultural Experiment Station and Cooperative Extension Service, pp. 47-50. Meyer, M. J.; Schmidt, K. A., & Shirley, J. E. (1998). Assessment of mastitic infection in bovine milk using ATP bioluminescence. Dairy Day, 1998, conference paper. Kansas Agricultural Experiment Station and Cooperative Extension Service, pp. 32-35 Moore, G., & Griffith, C. (2007). Problems associated with traditional hygiene swabbing: the need for in-house standardization. Journal of Applied Microbiology, vol. 103, pp. 1090–1103. Moore, G., & Griffith, C. (2002). A comparison of traditional and recently developed methods for monitoring surface hygiene within the food industry: an industry trial. International journal of environmental health research, vol. 12(4), pp. 317-329. Murphy, S.C.; Kozlowski, S.M.; Bandler, D.K. & Boor, K.J. (1998). Evaluation of adenosin triphosphate-bioluminescence hygiene monitoring for troubleshooting fluid milk shelf-life problems. Journal of Dairy Science, Vol. 81, pp. 817-820. Nieuwenhof, F. (1996). Raw milk, hygiene management and ATP bioluminescence. Proceedings, IDF Symposium on Bacteriological Quality of Raw Milk. Austria, 13–15 March, pp. 113–118. Niza-Ribeiro, J., Louzã, A. C., Santos, P., & Lima, M. (2000). Monitoring the microbiological quality of raw milk through the use of an ATP bioluminescence method. Food Control, vol. 11(3), pp. 209-216. Omidbakhsh, N., Ahmadpour, F., & Kenny, N. (2014). How reliable are ATP bioluminescence meters in assessing decontamination of environmental surfaces in healthcare settings?. PloS one, vol. 9(6), e99951 Palmer, J., Flint, S., & Brooks, J. (2007). Bacterial cell attachment, the beginning of a biofilm. Journal of Industrial Microbiology and Biotechnology, vol. 34, pp. 577- 588. Pintaric, S., & Pengov, A. (2007). Use of quick diagnostic methods in milking. International Journal of Environment and Pollution, vol. 31(1), pp. 167-177. Poulis, J.A., De Pipijper, M., Mossel, D.A.A., & Dekkers, P.P.A. (1993). Assessment of cleaning and disinfection in the food-industry with the rapid ATP-bioluminescence technique combined with the tissue-fluid contamination test and a conventional microbiological method. International Journal of Food Microbiology, vol. 20, pp. 109–116. R Core Team. (2013). R: A language and environment for statistical computing. R Foundation for Statistical Computing, Vienna, Austria. URL: http://www.R-project.org/ Reinemann, D. J., & Book, J. M. (1994). Airflow requirements, design parameters and troubleshooting for cleaning milking systems. In: Proc. ASAE/NMC Dairy Housing Conference. Orlando, Florida, USA 31 Jan- 4 Feb, 1994, vol. 31, pp. 26-35.
43
Reinemann, D. J., & Ruegg, P. (2000). An investigation of ATP bioluminescence and quantitative bulk tank cultures to assess cleanliness of milking machines. In 2000 ASAE Annual International Meeting, Milwaukee, Wisconsin, USA, 9-12 July 2000. American Society of Agricultural Engineers, pp. 1-8. Reinemann, D. J., Wolters, G. M. V. H., Billon, P., Lind, O., & Rasmussen, M. D. (2003). Review of practices for cleaning and sanitation of milking machines. Bulletin-International Dairy Federation, pp. 3-18. Reinemann, D. J., Wong, A. C. L., & Rabotski, E. (1993). Interaction of chemical, thermal and physical actions on the removal of bacteria from milk contact surfaces. In: Präsentation am 1993 International Winter Meeting des ASAE (The American Society of Agricultural Engineers), Chicago, Illinois, USA, December 14-17. Roberts, J., & Haslam, M. (2011). Use of the 3MTM Clean-Trace surface ATP test to assess parlour hygiene and investigate bactosan breakdowns. In: Pocknee, B. (ed). British Mastitis Conference. Sixways, Worcester, 2nd November, 2011, pp. 57-58. Available: http://www.britishmastitisconference.org.uk/BMC2011proceedings.pdf [2014-04-10] Rose, L., Jensen, B., Peterson, A., Banerjee, S.N., & Srduino, M.J. (2004). Swab materials and Bacillus anthracis spore recovery from nonporous surfaces. Emerging Infectious Diseases, vol. 10(6), pp. 1023–1029 Sciortino, C. V., & Giles, R. A. (2012). Validation and comparison of three adenosine triphosphate luminometers for monitoring hospital surface sanitization: A Rosetta Stone for adenosine triphosphate testing. American journal of infection control, vol. 40(8), pp. 233-239. Shama, G., & Malik, D. J. (2013). The uses and abuses of rapid bioluminescence-based ATP assays. International journal of hygiene and environmental health, vol. 216(2), pp. 115-125. Simpson, W.J., Giles, H.A., & Flockhart. (2006). Repeatability of hygiene test systems in measurements of low levels of ATP. Surrey: Cara Technology Limited. UK Report 30606. Slaghuis, B. (1996). Sources and significance of contaminants on different levels of raw milk production. Proceedings, IDF Symposium on Bacteriological Quality of Raw Milk, pp. 19-27. Austria, 13–15 March Slaghuis, B., & Wiegersma, W. (1996). Use of ATP-technique for the control of the cleaning of milking equipment. Proceedings, IDF Symposium on Bacteriological Quality of Raw Milk. Austria, 13–15 March, pp. 173–174 Soler, A., Ponsell, C., De Paz, M., & Nunez, M. (1995). The microbiological quality of milk produced in the Balearic Islands. International Dairy Journal, vol. 5(1), pp. 69-74. Storgards, E., Simola, H., Sjöberg, A. M., & Wirtanen, G. (1999a). Hygiene of gasket materials used in food processing equipment part 1: new materials. Food and bioproducts processing, vol. 77(2), pp. 137-145.
44
Storgards, E., Simola, H., Sjöberg, A. M., & Wirtanen, G. (1999b). Hygiene of gasket materials used in food processing equipment part 2: aged materials. Food and bioproducts processing, vol. 77(2), pp. 146-155. Sundberg, M., Lindahl, C., Christiansson, A., & Birgersson, C. (2009). Klorfria diskmedel för gårdsdisk- studier av olika faktorers inverkan på diskresultatet= Chlorine free detergents for use on dairy farms: study of the influence of different factors on cleaning effectiveness. Uppsala: JTI- Institutet för jordbruks och miljöteknik. Available: http://www.jti.se/uploads/jti/R-389_MS_m_fl.pdf Teh, K. H., Flint, S., Palmer, J., Andrewes, P., Bremer, P., & Lindsay, D. (2014). Biofilm− An unrecognised source of spoilage enzymes in dairy products? International Dairy Journal, vol. 34(1), pp. 32-40. Teixeira P, Lopes Z, Azeredo J, Oliveira R, & Vieira MJ. (2005). Physico-chemical surface characterization of a bacterial population isolated from a milking machine. Food Microbiology, vol. 22(2–3), pp. 247–51. Velazquez, M., & Feirtag, J. M. (1997). Quenching and enhancement effects of ATP extractants, cleansers, and sanitizers on the detection of the ATP bioluminescence signal. Journal of Food Protection®, vol. 60(7), pp. 799-803. Verdier-Metz, I., Michel, V., Delbes, C., & Montel, M. C. (2009). Do milking practices influence the bacterial diversity of raw milk? Food microbiology, vol. 26(3), pp. 305-310. Vilar, M. J., Rodríguez-Otero, J. L., Diéguez, F. J., Sanjuán, M. L., & Yus, E. (2008). Application of ATP bioluminescence for evaluation of surface cleanliness of milking equipment. International journal of food microbiology, vol. 125(3), pp. 357-361. 3MTMClean-TraceTM. (2012-05). Product Instructions UXL 100. Available: http://multimedia.3m.com/mws/mediawebserver?mwsId=66666UF6EVsSyXTtoXTcmxMyEVtQEVs6EVs6EVs6E666666--[2014-04-03] 3MTMClean-TraceTM. (2007). The 3MTM Clean-TraceTM Hygiene Management Guide. 3M Health Care. St. Paul, MN, 55144-1000 USA
45
I denna serie publiceras examensarbeten (motsvarande 15, 30, 45 eller 60 högskolepoäng) vid Institutionen för husdjurens utfodring och vård, Sveriges lantbruksuniversitet. Institutionens examensarbeten finns publicerade på SLUs hemsida www.slu.se.
In this series Degree projects (corresponding 15, 30, 45 or 60 credits) at the Depart- ment of Animal Nutrition and Management, Swedish University of Agricultural Sciences, are published. The department's degree projects are published on the SLU website www.slu.se.
Sveriges lantbruksuniversitet Fakulteten för veterinärmedicin och husdjursvetenskap Institutionen för husdjurens utfodring och vård Box 7024 750 07 Uppsala Tel. 018/67 10 00 Hemsida: www.slu.se/husdjur-utfodring-vard
Swedish University of Agricultural Sciences Faculty of Veterinary Medicine and Animal Science Department of Animal Nutrition and Management PO Box 7024 SE-750 07 Uppsala Phone +46 (0) 18 67 10 00 Homepage: www.slu.se/animal-nutrition-management
46