atomically engineered ferroic layers yield a room...
TRANSCRIPT
2 2 s e p t e m b e r 2 0 1 6 | V O L 5 3 7 | N A t U r e | 5 2 3
Letterdoi:10.1038/nature19343
Atomically engineered ferroic layers yield a room-temperature magnetoelectric multiferroicJulia A. mundy1*, Charles m. brooks2*, megan e. Holtz1*, Jarrett A. moyer3, Hena Das1, Alejandro F. rébola1, John t. Heron2,4, James D. Clarkson5, steven m. Disseler6, Zhiqi Liu5, Alan Farhan7, rainer Held2, robert Hovden1, elliot padgett1, Qingyun mao1, Hanjong paik2, rajiv misra8, Lena F. Kourkoutis1,9, elke Arenholz7, Andreas scholl7, Julie A. borchers6, William D. ratcliff6, ramamoorthy ramesh5,10,11, Craig J. Fennie1, peter schiffer3, David A. muller1,9 & Darrell G. schlom2,9
Materials that exhibit simultaneous order in their electric and magnetic ground states hold promise for use in next-generation memory devices in which electric fields control magnetism1,2. Such materials are exceedingly rare, however, owing to competing requirements for displacive ferroelectricity and magnetism3. Despite the recent identification of several new multiferroic materials and magnetoelectric coupling mechanisms4–15, known single-phase multiferroics remain limited by antiferromagnetic or weak ferromagnetic alignments, by a lack of coupling between the order parameters, or by having properties that emerge only well below room temperature, precluding device applications2. Here we present a methodology for constructing single-phase multiferroic materials in which ferroelectricity and strong magnetic ordering are coupled near room temperature. Starting with hexagonal LuFeO3—the geometric ferroelectric with the greatest known planar rumpling16—we introduce individual monolayers of FeO during growth to construct formula-unit-thick syntactic layers of ferrimagnetic LuFe2O4 (refs 17, 18) within the LuFeO3 matrix, that is, (LuFeO3)m/(LuFe2O4)1 superlattices. The severe rumpling imposed by the neighbouring LuFeO3 drives the ferrimagnetic LuFe2O4 into a simultaneously ferroelectric state, while also reducing the LuFe2O4 spin frustration. This increases the magnetic transition temperature substantially—from 240 kelvin for LuFe2O4 (ref. 18) to 281 kelvin for (LuFeO3)9/(LuFe2O4)1. Moreover, the ferroelectric order couples to the ferrimagnetism, enabling direct electric-field control of magnetism at 200 kelvin. Our results demonstrate a design methodology for creating higher-temperature magnetoelectric multiferroics by exploiting a combination of geometric frustration, lattice distortions and epitaxial engineering.
Advances in thin-film deposition have enabled materials to be rationally designed at the atomic-scale where the local chemistry, bonding and electronic environment can be tailored to stabilize emergent phenomena19. Here we exploit such techniques to directly perturb the structural environment of the frustrated hexagonal ferrimagnet LuFe2O4 at the sub-ångström scale, tuning the magnetic order to construct a new magnetoelectric multiferroic. LuFe2O4 was purported to be simultaneously ferrimagnetic and ferroelectric at 250 K—the highest temperature of any known material17. Although its ferrimagnetic ordering is widely affirmed18, recent studies find that LuFe2O4 is not ferroelectric20,21. A robust high- temperature fer-roelectric with a closely related structure exists, however: hexagonal LuFeO3. Although metastable, hexagonal LuFeO3 has been grown in thin-film form by epitaxial stabilization22. Isostructural to YMnO3,
1School of Applied and Engineering Physics, Cornell University, Ithaca, New York 14853, USA. 2Department of Materials Science and Engineering, Cornell University, Ithaca, New York 14853, USA. 3Department of Physics and Frederick Seitz Materials Research Laboratory, University of Illinois at Urbana-Champaign, Urbana, Illinois 61801, USA. 4Department of Materials Science and Engineering, University of Michigan, Ann Arbor, Michigan 48103, USA. 5Department of Materials Science and Engineering, University of California, Berkeley, California 94720, USA. 6NIST Center for Neutron Research, National Institute of Standards and Technology, Gaithersburg, Maryland 20899, USA. 7Advanced Light Source, Lawrence Berkeley National Laboratory, Berkeley, California 94720, USA. 8Department of Physics, Pennsylvania State University, University Park, Pennsylvania 16802, USA. 9Kavli Institute at Cornell for Nanoscale Science, Ithaca, New York 14853, USA. 10Department of Physics, University of California, Berkeley, California 94720, USA. 11Materials Sciences Division, Lawrence Berkeley National Laboratory, California 94720, USA.*These authors contributed equally to this work.
a LuFe2O4 LuFeO3
2 nm
b
Lu
Fe
O
(LuFeO3)m/(LuFe2O4)1 superlatticesm = 1 m = 2 m = 3 m = 4 m = 5
m = 6 m = 7 m = 8 m = 9 m = 10
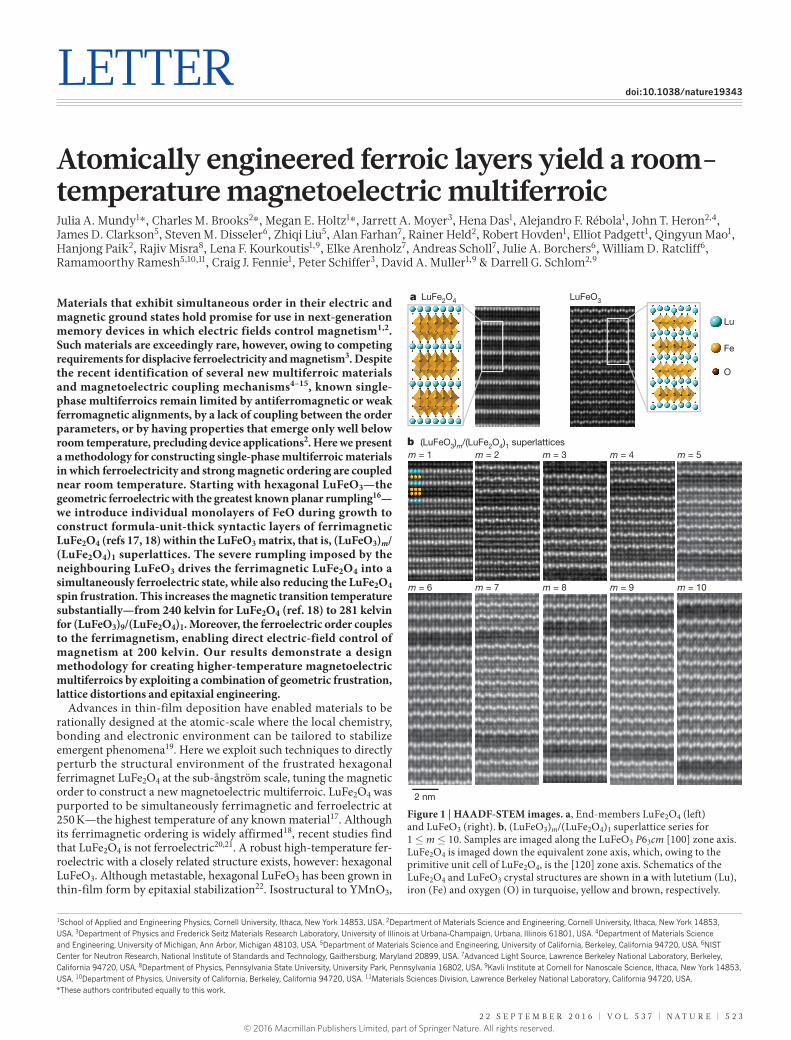
Figure 1 | HAADF-STEM images. a, End-members LuFe2O4 (left) and LuFeO3 (right). b, (LuFeO3)m/(LuFe2O4)1 superlattice series for 1 ≤ m ≤ 10. Samples are imaged along the LuFeO3 P63cm [100] zone axis. LuFe2O4 is imaged down the equivalent zone axis, which, owing to the primitive unit cell of LuFe2O4, is the [120] zone axis. Schematics of the LuFe2O4 and LuFeO3 crystal structures are shown in a with lutetium (Lu), iron (Fe) and oxygen (O) in turquoise, yellow and brown, respectively.
© 2016 Macmillan Publishers Limited, part of Springer Nature. All rights reserved.
LetterreSeArCH
5 2 4 | N A t U r e | V O L 5 3 7 | 2 2 s e p t e m b e r 2 0 1 6
it is an improper ferroelectric16,23, in which the rumpling of the Lu–O planes and corresponding tilt of the Fe–O trigonal bipyramids lead to geometric ferroelectricity that persists well above room temperature24,25. At low temperature (below the Néel temperature TN), hexagonal LuFeO3 orders antiferromagnetically; slight canting of the spins gives rise to weak ferromagnetism16,24,25.
Here we synthesize superlattices of LuFe2O4 and LuFeO3 by reactive-oxide molecular-beam epitaxy (see Methods); the ferroelectric distortions of LuFeO3 are exploited to reduce the spin frustration and enhance the magnetic transition of LuFe2O4. The resulting (LuFeO3)9/(LuFe2O4)1 superlattice is magnetically ordered up to 281 K and exhibits short-range ferromagnetic fluctuations that persist, together with ferroelectricity, above room temperature. We corroborate this result using methods that are insensitive to magnetic impurity phases (for example, neutron diffraction) or electrical leakage (for example, high-resolution electron microscopy) and show that our results are consistent with first-principles calculations.
Figure 1a shows high-angle annular dark field scanning transmission electron microscopy (HAADF-STEM) images of the LuFeO3 and LuFe2O4 end-members and Fig. 1b the (LuFeO3)m/(LuFe2O4)1 superlattices for m = 1 to m = 10. X-ray diffraction (XRD) patterns are shown in Extended Data Fig. 1, supporting the observed high structural quality. The characteristic ‘up-up-down’ pattern of the lutetium atoms in LuFeO3 (ref. 24), which is also present in the hexagonal manganites26, is evident and reflects the polar nature of these superlattices.
The polarization monotonically tracks the magnitude of this lutetium trimer distortion16 (Methods, Extended Data Fig. 2), rendering HAADF-STEM a local probe of ferroelectricity27. Inspecting the images in Fig. 1, we note that distortions are present in the (LuFeO3)m/(LuFe2O4)1 series for m ≥ 2. The ferroelectric rumpling was not observed in LuFe2O4, consistent with previous work28, or the (LuFeO3)1/(LuFe2O4)n series at room temperature.
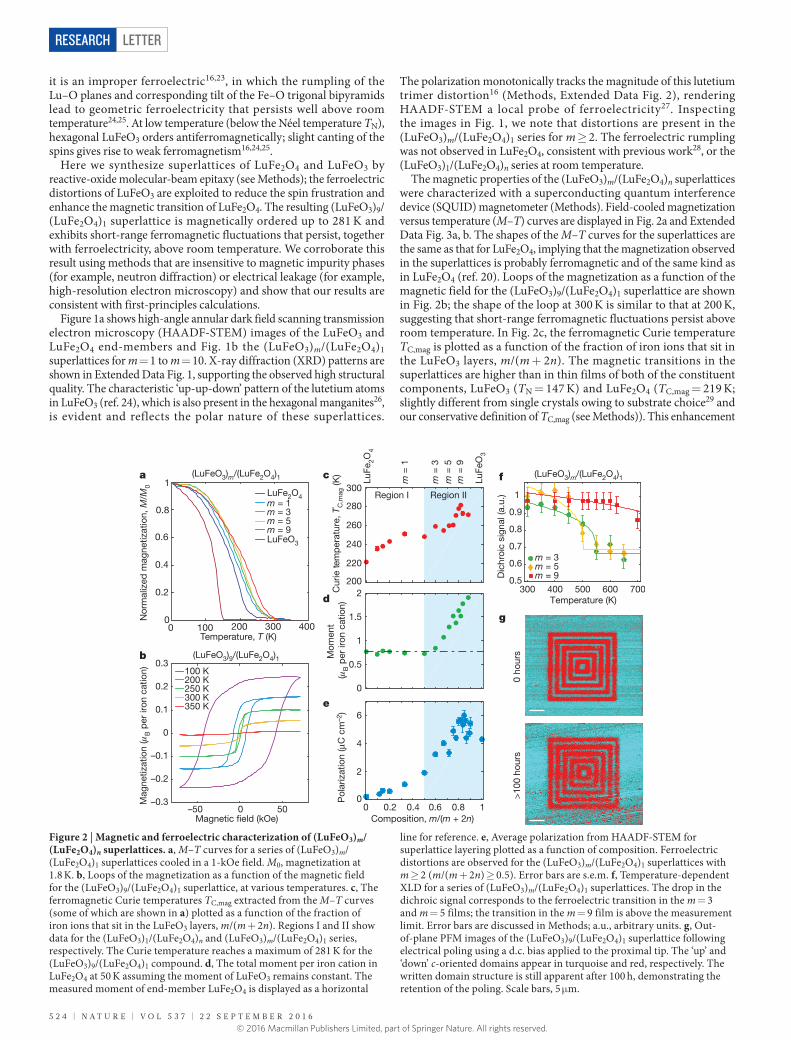
The magnetic properties of the (LuFeO3)m/(LuFe2O4)n superlattices were characterized with a superconducting quantum interference device (SQUID) magnetometer (Methods). Field-cooled magnetization versus temperature (M–T) curves are displayed in Fig. 2a and Extended Data Fig. 3a, b. The shapes of the M–T curves for the superlattices are the same as that for LuFe2O4, implying that the magnetization observed in the superlattices is probably ferromagnetic and of the same kind as in LuFe2O4 (ref. 20). Loops of the magnetization as a function of the magnetic field for the (LuFeO3)9/(LuFe2O4)1 superlattice are shown in Fig. 2b; the shape of the loop at 300 K is similar to that at 200 K, suggesting that short-range ferromagnetic fluctuations persist above room temperature. In Fig. 2c, the ferromagnetic Curie temperature TC,mag is plotted as a function of the fraction of iron ions that sit in the LuFeO3 layers, m/(m + 2n). The magnetic transitions in the superlattices are higher than in thin films of both of the constituent components, LuFeO3 (TN = 147 K) and LuFe2O4 (TC,mag = 219 K; slightly different from single crystals owing to substrate choice29 and our conservative definition of TC,mag (see Methods)). This enhancement
300 400 500 600 7000.5
0.6
0.7
0.8
0.9
1
Temperature (K)
Dic
hroi
c si
gnal
(a.u
.)
a
Nor
mal
ized
mag
netiz
atio
n, M
/M0
Temperature, T (K)
Magnetic �eld (kOe)
Mag
netiz
atio
n (
B p
er ir
on c
atio
n)
b
Pol
ariz
atio
n (μ
C c
m–2
)M
omen
t (
B p
er ir
on c
atio
n)C
urie
tem
per
atur
e, T
C,m
ag (K
)
Composition, m/(m + 2n)
c
d
Region I Region II
LuFe
2O4
LuFe
O3
m =
1
m =
3m
= 5
m =
9
f
e
g
0
m = 3m = 5m = 9
100 K200 K250 K300 K350 K
0
0.5
1
1.5
2
0.2 0.4 0.6 0.8 10
2
4
6
200
220
240
260
280
300
–50 0–0.3
–0.2
–0.1
0
0.1
0.2
0.3
50
0 ho
urs
>10
0 ho
urs
0 100 200 300 4000
0.2
0.4
0.6
0.8
1LuFe2O4m = 1m = 3m = 5m = 9LuFeO3
(LuFeO3)m/(LuFe2O4)1
(LuFeO3)9/(LuFe2O4)1
(LuFeO3)m/(LuFe2O4)1
Figure 2 | Magnetic and ferroelectric characterization of (LuFeO3)m/(LuFe2O4)n superlattices. a, M–T curves for a series of (LuFeO3)m/(LuFe2O4)1 superlattices cooled in a 1-kOe field. M0, magnetization at 1.8 K. b, Loops of the magnetization as a function of the magnetic field for the (LuFeO3)9/(LuFe2O4)1 superlattice, at various temperatures. c, The ferromagnetic Curie temperatures TC,mag extracted from the M–T curves (some of which are shown in a) plotted as a function of the fraction of iron ions that sit in the LuFeO3 layers, m/(m + 2n). Regions I and II show data for the (LuFeO3)1/(LuFe2O4)n and (LuFeO3)m/(LuFe2O4)1 series, respectively. The Curie temperature reaches a maximum of 281 K for the (LuFeO3)9/(LuFe2O4)1 compound. d, The total moment per iron cation in LuFe2O4 at 50 K assuming the moment of LuFeO3 remains constant. The measured moment of end-member LuFe2O4 is displayed as a horizontal
line for reference. e, Average polarization from HAADF-STEM for superlattice layering plotted as a function of composition. Ferroelectric distortions are observed for the (LuFeO3)m/(LuFe2O4)1 superlattices with m ≥ 2 (m/(m + 2n) ≥ 0.5). Error bars are s.e.m. f, Temperature-dependent XLD for a series of (LuFeO3)m/(LuFe2O4)1 superlattices. The drop in the dichroic signal corresponds to the ferroelectric transition in the m = 3 and m = 5 films; the transition in the m = 9 film is above the measurement limit. Error bars are discussed in Methods; a.u., arbitrary units. g, Out-of-plane PFM images of the (LuFeO3)9/(LuFe2O4)1 superlattice following electrical poling using a d.c. bias applied to the proximal tip. The ‘up’ and ‘down’ c-oriented domains appear in turquoise and red, respectively. The written domain structure is still apparent after 100 h, demonstrating the retention of the poling. Scale bars, 5 μm.
© 2016 Macmillan Publishers Limited, part of Springer Nature. All rights reserved.
Letter reSeArCH
2 2 s e p t e m b e r 2 0 1 6 | V O L 5 3 7 | N A t U r e | 5 2 5
was previously observed in single-crystalline Lu2Fe3O7 (ref. 30). For the (LuFeO3)m/(LuFe2O4)1 series, TC,mag increases to 281 K for m = 9. The saturated magnetic moment per LuFe2O4 iron cation at 50 K is plotted in Fig. 2d (see Methods). There is a pronounced deviation in the (LuFeO3)m/(LuFe2O4)1 superlattices for m ≥ 2: here, the LuFe2O4 moment increases with m reaching about 2μB per iron cation (with μB the Bohr magneton) for the m = 15 superlattice. Similar enhancements in the moment are observed at 100 K and 200 K as well (Methods, Extended Data Fig. 3c). We further corroborate the enhancement in TC,mag with neutron diffraction of a (LuFeO3)6/(LuFe2O4)2 superlattice (Methods, Extended Data Fig. 4). Not only is the onset of magnetic order revealed by neutron scattering consistent with that measured by SQUID, but the magnetic ordering corresponds to a reflection in the superlattice structure that is not present in bulk LuFe2O4. Further, it is coherent through six superlattice repeats along the c direction of the lattice.
In addition to magnetic order, spontaneous polarization can also be tracked across the superlattice series. We quantify the ferroelectric lutetium distortions at 300 K from HAADF-STEM images such as those in Fig. 1 (Methods, Extended Data Figs 2, 5, 6). The polarization resulting from this displacement is plotted in Fig. 2e; it continuously increases in the (LuFeO3)m/(LuFe2O4)1 superlattices for m ≥ 2, reaching approximately 6 μC cm−2 for the high-m superlattices. The temperature dependence of the ferroelectric order in the (LuFeO3)m/(LuFe2O4)1 superlattices was further probed using variable- temperature X-ray linear dichroism (XLD) as shown in Fig. 2f (see Methods, Extended Data Fig. 7)31,32. Fittings to a universal order parameter suggest ferroelectric transitions at about 550 K and 500 K for the m = 3 and m = 5 samples, respectively. The dichroic signal for the
m = 9 sample persists beyond the measurement range, suggesting a higher- temperature ferroelectric transition. Finally, piezoresponse force microscopy (PFM) was used to investigate the local ferroelectric switching in the (LuFeO3)9/(LuFe2O4)1 film (Methods). As shown in Fig. 2g, the poled domain structure persists for at least 100 h after writing, demonstrating the ability to reversibly and robustly switch the spontaneous polarization. See Methods for the in-plane electrical characterization.
Figure 2 suggests two distinct regions in the (LuFeO3)m/(LuFe2O4)n phase diagram: region I for 0 < m/(m + 2n) < 0.5 where TC,mag saturates at about 250 K and region II for 0.5 ≤ m/(m + 2n) < 1 where a further increase in TC,mag to 281 K occurs simultaneously with a near-linear enhancement of the magnetic moment and (of particular note) the ferroelectric polarization. See Methods for a discussion of region I. The behaviour of the region II superlattices is elucidated from first- principles density functional theory (DFT) calculations of both ‘model LuFe2O4’ systems and particular superlattices; see Methods. The key to understanding the observed enhancements in TC,mag is the interplay between ferroelectricity associated with the LuFeO3 layers and magnetism in the LuFe2O4 layers.
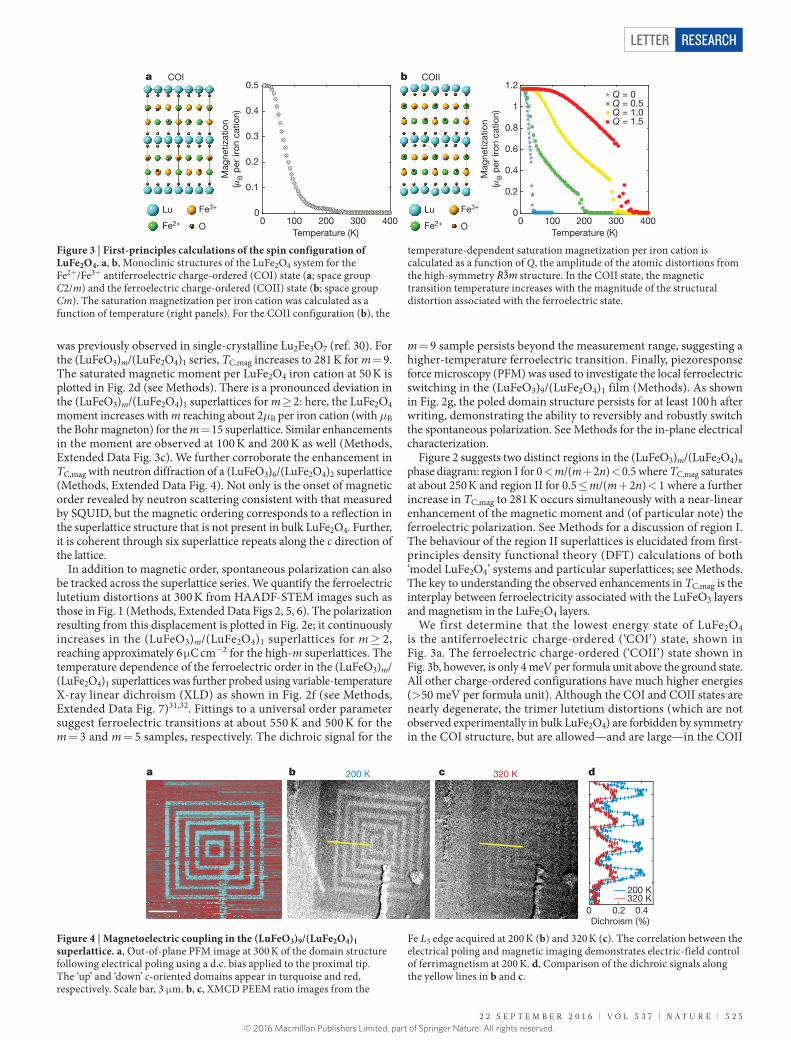
We first determine that the lowest energy state of LuFe2O4 is the antiferroelectric charge-ordered (‘COI’) state, shown in Fig. 3a. The ferroelectric charge-ordered (‘COII’) state shown in Fig. 3b, however, is only 4 meV per formula unit above the ground state. All other charge-ordered configurations have much higher energies (> 50 meV per formula unit). Although the COI and COII states are nearly degenerate, the trimer lutetium distortions (which are not observed experimentally in bulk LuFe2O4) are forbidden by symmetry in the COI structure, but are allowed—and are large—in the COII
0 100 200 300 4000
0.2
0.4
0.6
0.8
1
1.2
Temperature (K)M
agne
tizat
ion
(B p
er ir
on c
atio
n)
Mag
netiz
atio
n(
B p
er ir
on c
atio
n)
a COI b COII
Lu
Fe2+
Fe3+
OTemperature (K)
Lu
Fe2+
Fe3+
O 0 100 200 300 4000
0.1
0.2
0.3
0.4
0.5Q = 0Q = 0.5Q = 1.0Q = 1.5
Figure 3 | First-principles calculations of the spin configuration of LuFe2O4. a, b, Monoclinic structures of the LuFe2O4 system for the Fe2+/Fe3+ antiferroelectric charge-ordered (COI) state (a; space group C2/m) and the ferroelectric charge-ordered (COII) state (b; space group Cm). The saturation magnetization per iron cation was calculated as a function of temperature (right panels). For the COII configuration (b), the
temperature-dependent saturation magnetization per iron cation is calculated as a function of Q, the amplitude of the atomic distortions from the high-symmetry R m3 structure. In the COII state, the magnetic transition temperature increases with the magnitude of the structural distortion associated with the ferroelectric state.
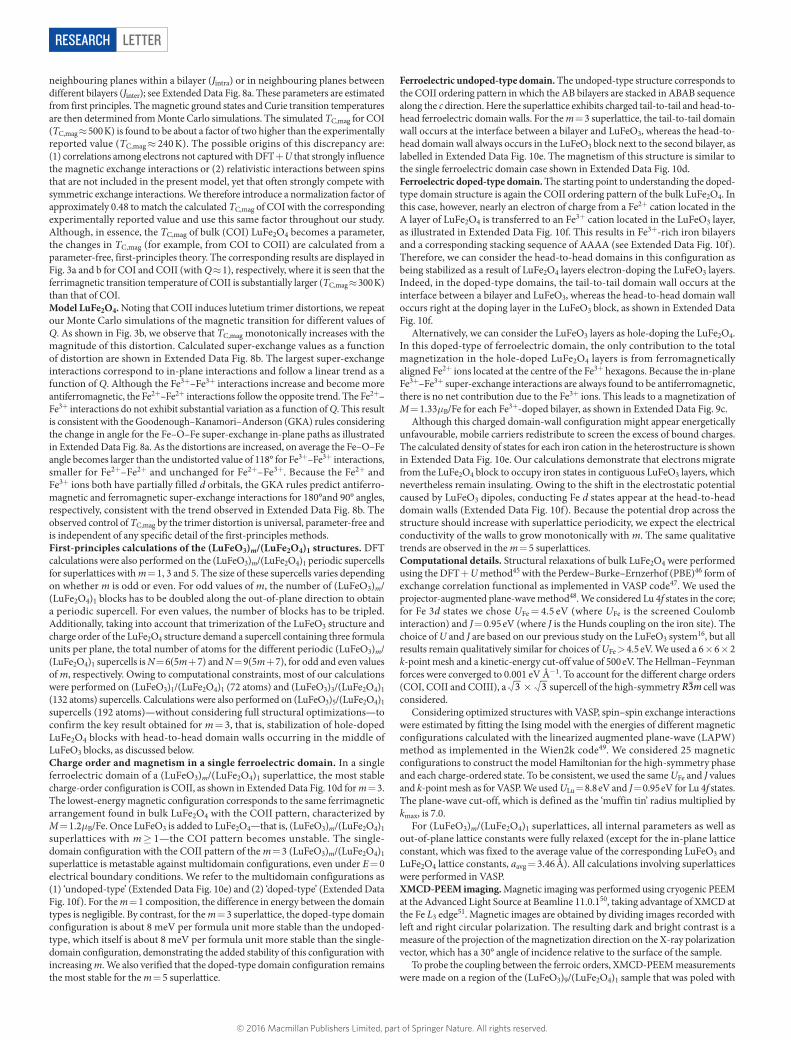
Figure 4 | Magnetoelectric coupling in the (LuFeO3)9/(LuFe2O4)1 superlattice. a, Out-of-plane PFM image at 300 K of the domain structure following electrical poling using a d.c. bias applied to the proximal tip. The ‘up’ and ‘down’ c-oriented domains appear in turquoise and red, respectively. Scale bar, 3 μm. b, c, XMCD PEEM ratio images from the
Fe L3 edge acquired at 200 K (b) and 320 K (c). The correlation between the electrical poling and magnetic imaging demonstrates electric-field control of ferrimagnetism at 200 K. d, Comparison of the dichroic signals along the yellow lines in b and c.
© 2016 Macmillan Publishers Limited, part of Springer Nature. All rights reserved.

LetterreSeArCH
5 2 6 | N A t U r e | V O L 5 3 7 | 2 2 s e p t e m b e r 2 0 1 6
structure. We parameterize an Ising spin model from first principles to simulate the temperature dependence of the magnetization for the COI and COII states as shown in Fig. 3a, b. Additionally, we construct ‘model LuFe2O4’ COII structures, varying the magnitude of the lutetium trimer distortion Q; the power of a first-principles approach is that it gives us access to structures that are not available experimentally. Artificially increasing the trimer distortion tunes the relative strength of the in-plane interactions and reduces the magnetic frustration (Extended Data Fig. 8b); this in turn increases the magnetic transition TC,mag as shown in Fig. 3b. Furthermore, the trimer distortion immediately destabilizes the COI state and transforms the system to the COII state. These observations suggest that the enhancement of TC,mag in the (LuFeO3)m/(LuFe2O4)1 superlattices is attributable to the ferroelectric trimer distortions imposed by the LuFeO3 layers.
Next we consider the enhancement of the magnetic moment that occurs simultaneously with the increase in the ferroelectric polarization in region II (Fig. 2d). We note the presence of many magnetic configurations within a few millielectronvolts of each other in each charge-ordered state (Extended Data Fig. 9b) and no clear experimental evidence as to the magnetic ground state. Nevertheless, we outline two potential scenarios for magnetic enhancement. First, direct first-principles calculations for m ≥ 3 superlattices reveal the existence of ‘self-doped’ structures, which consist of bilayers with a 2:1 ratio between Fe3+ and Fe2+ (Extended Data Fig. 10). For example, in the m = 3 superlattice this increases the net magnetization from M = 1.2μB per iron cation to M = 1.3μB per iron cation. As the trimer distortion increases, the system is driven from a ferroelectric state to this self-doped structure, thereby leading to an increase in M as the polarization increases. Second, if we can take seriously the magnetic energies for LuFe2O4 determined from DFT, then the ground-state magnetization of the COI state is M = 0.5μB per iron cation, whereas the lowest energy of the COII state has M = 1.2μB per iron cation. As the trimer distortion transforms the system from the COI state to the COII state, the saturated magnetization increases by nearly 1μB per iron cation. In this case, the linear dependence of M on the polarization is probably an indication of different atomic-scale, coexisting magnetic domains in each charge-ordered state.
Finally, we demonstrate that the near-room-temperature ferrim-agnetism observed in the (LuFeO3)9/(LuFe2O4)1 superlattice directly couples to the ferroelectric order. A (LuFeO3)9/(LuFe2O4)1 film was electrically poled at 300 K to construct distinct ‘up’ and ‘down’ c- oriented polar domains as shown in Fig. 4a (and similar to Fig. 2g). The resulting magnetic order was then imaged at 200 K and 320 K using X-ray magnetic circular dichroic photoemission electron microscopy (XMCD PEEM) on the Fe L3 edge (see Methods). As shown in the ratio images in Fig. 4b, c, the magnetic ordering directly correlates with the electrically poled domain structure, demonstrating magnetoelectric coupling between ferroelectricity and magnetism. As shown in Fig. 4d, the dichroic contrast on the iron sites decreases by about 70% between 200 K and 300 K, consistent with the reduction in the magnetization observed at these temperatures in the same film by SQUID (Extended Data Fig. 3e).
We have engineered a strong, magnetically ordered ferroelectric with simultaneous order near room temperature. In particular, we show that the ferroelectric trimer distortions intrinsic to hexagonal LuFeO3 can be used to locally tune the structural environment of the frustrated magnetism that is present on adjacent LuFe2O4 layers in a manner that enhances the magnetic transition. We demonstrate magnetoelectric coupling of this ferroelectric polarization to the co- linear ferrimagnetic order at 200 K. Such coupling is probably distinct from the better- studied Dzyaloshinskii–Moriya coupling previously observed between ferroelectricity and weakly canted antiferromagnetism at room temperature in BiFeO3 (refs 6, 12). Further understanding of
this coupling mechanism could guide the design of higher- temperature ferromagnetic ferroelectrics that can be deterministically switched between symmetry-equivalent states using an electric field.
Online Content Methods, along with any additional Extended Data display items and Source Data, are available in the online version of the paper; references unique to these sections appear only in the online paper.
received 2 February; accepted 25 July 2016.
1. Spaldin, N. A. & Fiebig, M. The renaissance of magnetoelectric multiferroics. Science 309, 391–392 (2005).
2. Eerenstein, W., Mathur, N. D. & Scott, J. F. Multiferroic and magnetoelectric materials. Nature 442, 759–765 (2006).
3. Hill, N. A. Why are there so few magnetic ferroelectrics? J. Phys. Chem. B 104, 6694–6709 (2000).
4. Ascher, E., Rieder, H., Schmid, H. & Stössel, H. Some Properties of ferromagnetoelectric nickel-iodine boracite, Ni3B7O13I. J. Appl. Phys. 37, 1404–1405 (1966).
5. Kimura, T. et al. Magnetic control of ferroelectric polarization. Nature 426, 55–58 (2003).
6. Wang, J. et al. Epitaxial BiFeO3 multiferroic thin film heterostructures. Science 299, 1719–1722 (2003).
7. Lee, J. H. et al. A strong ferroelectric ferromagnet created by means of spin-lattice coupling. Nature 466, 954–958 (2010).
8. Kumar, A., Katiyar, R. S., Premnath, R. N., Rinaldi, C. & Scott, J. F. Strain-induced artificial multiferroicity in Pb(Zr0.53Ti0.47)O3/Pb(Fe0.66W0.33)O3 layered nanostructure at ambient temperature. J. Mater. Sci. 44, 5113–5119 (2009).
9. Sanchez, D. A., Kumar, A., Ortega, N., Katiyar, R. S. & Scott, J. F. Near-room temperature relaxor multiferroic. Appl. Phys. Lett. 97, 202910 (2010).
10. Keeney, L. et al. Room temperature ferroelectric and magnetic investigations and detailed phase analysis of Aurivillius phase Bi5Ti3Fe0.7CoO15 thin films. J. Appl. Phys. 112, 052010 (2012).
11. Li, M.-R. et al. A polar corundum oxide displaying weak ferromagnetism at room temperature. J. Am. Chem. Soc. 134, 3737–3747 (2012).
12. Heron, J. T. et al. Deterministic switching of ferromagnetism at room temperature using an electric field. Nature 516, 370–373 (2014).
13. Zhao, H. J. et al. Near room-temperature multiferroic materials with tunable ferromagnetic and electrical properties. Nat. Commun. 5, 4021 (2014).
14. Pitcher, M. J. et al. Tilt engineering of spontaneous polarization and magnetization above 300 K in a bulk layered perovskite. Science 347, 420–424 (2015).
15. Mandal, P. et al. Designing switchable polarization and magnetization at room temperature in an oxide. Nature 525, 363–366 (2015).
16. Das, H., Wysocki, A. L., Geng, Y., Wu, W. & Fennie, C. J. Bulk magnetoelectricity in the hexagonal manganites and ferrites. Nat. Commun. 5, 2998 (2014).
17. Ikeda, N. et al. Ferroelectricity from iron valence ordering in the charge-frustrated system LuFe2O4. Nature 436, 1136–1138 (2005).
18. Christianson, A. D. et al. Three-dimensional magnetic correlations in multiferroic LuFe2O4. Phys. Rev. Lett. 100, 107601 (2008).
19. Mannhart, J. & Schlom, D. G. Oxide interfaces—an opportunity for electronics. Science 327, 1607–1611 (2010).
20. Niermann, D., Waschkowski, F., de Groot, J., Angst, M. & Hemberger, J. Dielectric properties of charge-ordered LuFe2O4 revisited: the apparent influence of contacts. Phys. Rev. Lett. 109, 016405 (2012).
21. Lafuerza, S. et al. Intrinsic electrical properties of LuFe2O4. Phys. Rev. B 88, 085130 (2013).
22. Bossak, A. A. et al. XRD and HREM studies of epitaxially stabilized hexagonal orthoferrites RFeO3 (R = Eu–Lu). Chem. Mater. 16, 1751–1755 (2004).
23. Magome, E., Moriyoshi, C., Kuroiwa, Y., Masuno, A. & Inoue, H. Noncentrosymmetric structure of LuFeO3 in metastable state. Jpn. J. Appl. Phys. 49, 09ME06 (2010).
24. Wang, W. et al. Room-temperature multiferroic hexagonal LuFeO3 films. Phys. Rev. Lett. 110, 237601 (2013).
25. Disseler, S. M. et al. Magnetic structure and ordering of multiferroic hexagonal LuFeO3. Phys. Rev. Lett. 114, 217602 (2015).
26. Zhang, Q. H. et al. Direct observation of interlocked domain walls in hexagonal RMnO3 (R = Tm, Lu). Phys. Rev. B 85, 020102 (2012).
27. Jia, C.-L. et al. Unit-cell scale mapping of ferroelectricity and tetragonality in epitaxial ultrathin ferroelectric films. Nat. Mater. 6, 64–69 (2007).
28. Mundy, J. A., Mao, Q., Brooks, C. M., Schlom, D. G. & Muller, D. A. Atomic-resolution chemical imaging of oxygen local bonding environments by electron energy loss spectroscopy. Appl. Phys. Lett. 101, 042907 (2012).
29. Brooks, C. M. et al. The adsorption-controlled growth of LuFe2O4 by molecular-beam epitaxy. Appl. Phys. Lett. 101, 132907 (2012).
30. Iida, J., Tanaka, M. & Funahashi, S. Magnetic property of single crystal Lu2Fe3O7. J. Magn. Magn. Mater. 104–107, 827–828 (1992).
31. Arenholz, E. et al. Probing ferroelectricity in PbZr0.2Ti0.8O3 with polarized soft x rays. Phys. Rev. B 82, 140103(R) (2010).
32. Polisetty, S. et al. X-ray linear dichroism dependence on ferroelectric polarization. J. Phys. Condens. Matter 24, 245902 (2012).
© 2016 Macmillan Publishers Limited, part of Springer Nature. All rights reserved.

Letter reSeArCH
2 2 s e p t e m b e r 2 0 1 6 | V O L 5 3 7 | N A t U r e | 5 2 7
Acknowledgements We acknowledge discussions with G. Stiehl, R. Haislmaier, A. SenGupta, V. Gopalan, W. Wang, W. Wu and E. Barnard and technical support with the electron microscopy from E. J. Kirkland, M. Thomas and J. Grazul. Research primarily supported by the US Department of Energy, Office of Basic Energy Sciences, Division of Materials Sciences and Engineering, under Award No. DE-SC0002334, which supported the work of J.A.Mu. (2010–2014), C.M.B., M.E.H., J.A.Mo., H.D., A.F.R., R.He., Q.M., H.P., R.M., C.J.F., P.S., D.A.M. and D.G.S. Substrate preparation was performed in part at the Cornell NanoScale Facility, a member of the National Nanotechnology Coordinated Infrastructure (NNCI), which is supported by the National Science Foundation (Grant ECCS-15420819). The electron microscopy studies made use of the electron microscopy facility of the Cornell Center for Materials Research, a National Science Foundation (NSF) Materials Research Science and Engineering Centers programme (DMR 1120296) and NSF IMR-0417392. X-ray dichroism was performed at the Advanced Light Source at Lawrence Berkeley National Laboratory. The Advanced Light Source is supported by the Director, Office of Science, Office of Basic Energy Sciences, of the US Department of Energy under Contract No. DE-AC02-05CH11231. J.A.Mu. acknowledges fellowship support from the Army Research Office in the form of a National Defense Science and Engineering Graduate Fellowship and from the National Science Foundation in the form of a Graduate Research Fellowship. J.A.Mu. was funded (July 2015–) by C-SPINS, one of six centres of STARnet, a Semiconductor Research Corporation programme, sponsored by MARCO and DARPA. J.T.H. acknowledges support from the Semiconductor Research Corporation (SRC) under grant 2014-IN-2534. J.D.C. acknowledges support from SRC-FAME, one of six centres of STARnet, a Semiconductor Research Corporation programme sponsored by MARCO and DARPA. S.M.D. acknowledges the support of a National Research Council NIST postdoctoral research associateship. Z.L. acknowledges support from the NSF under Grant No. EEC-1160504 NSF Nanosystems Engineering Research Center for Translational Applications of Nanoscale Multiferroic
Systems (TANMS). A.F. is supported by the Swiss National Science Foundation. R.Ho. and L.F.K. acknowledge support by the David and Lucile Packard Foundation. E.P. acknowledges support from the National Science Foundation in the form of a Graduate Research Fellowship (DGE-1144153). Certain commercial equipment, instruments, or materials are identified in this paper to foster understanding. Such identification does not imply recommendation or endorsement by the National Institute of Standards and Technology, nor does it imply that the materials or equipment identified are necessarily the best available for the purpose.
Author Contributions The thin films were synthesized by C.M.B. and J.A.Mu. with assistance from R.He. and H.P. DFT calculations were performed by H.D., A.F.R. and C.J.F. The films were characterized by SQUID by J.A.Mo., R.M. and P.S.; by STEM by M.E.H., J.A.Mu., R.Ho., E.P., L.F.K. and D.A.M.; by variable-temperature STEM by Q.M., M.E.H. and D.A.M.; by neutron scattering by S.M.D., J.A.B. and W.D.R.; by transport by J.T.H.; by PFM by J.D.C., J.T.H. and R.R.; by X-ray spectroscopy by J.A.Mu., Z.L. and E.A.; by PEEM by A.F., Z.L., J.D.C., R.R. and A.S. J.A.Mu., C.J.F. and D.G.S. wrote the manuscript. The study was conceived and guided by D.G.S. All authors discussed results and commented on the manuscript.
Author Information Reprints and permissions information is available at www.nature.com/reprints. The authors declare no competing financial interests. Readers are welcome to comment on the online version of the paper. Correspondence and requests for materials should be addressed to D.G.S. ([email protected]).
reviewer Information Nature thanks M. Fiebig, T. Kimura and the other anonymous reviewer(s) for their contribution to the peer review of this work.
© 2016 Macmillan Publishers Limited, part of Springer Nature. All rights reserved.

LetterreSeArCH
MethOdsGrowth of (LuFeO3)m/(LuFe2O4)n thin films. Thin films of (LuFeO3)m/(LuFe2O4)n were grown by reactive-oxide molecular-beam epitaxy in a Veeco GEN10 system on (111) (ZrO2)0.905(Y2O3)0.095 (or 9.5 mol% yttria-stabilized zirconia) substrates, denoted YSZ, held at a temperature of about 700 °C. This substrate temperature was determined by an optical pyrometer focused on an opaque, 200-nm-thick, platinum layer on the backside of the YSZ substrates used to absorb the heat from the SiC radiative substrate heater. Lutetium and iron were evaporated from elemental sources each at a flux of approximately 1 × 10¹³ atoms per square centimetre per second. The fluxes were first calibrated (approximately) with a quartz crystal microbalance. The lutetium flux was then more accurately refined using the reflection high-energy electron diffraction (RHEED) intensity oscillations that occurred when (111) Lu2O3 was deposited on (111) YSZ. With the known lutetium flux, the iron flux was adjusted to produce a stoichiometric LuFeO3 film as judged by the out-of-plane lattice parameter measured by XRD33. The background oxygen partial pressure was meticulously varied during the superlattice growth to provide an environment sufficiently oxidizing for the Fe3+ in the LuFeO3 without over-oxidizing the Fe2.5+ in the LuFe2O4 layers. The background partial pressure of a mixture of about 2% O3 and O2 was varied between 3 × 10⁻⁷ Torr and 9 × 10⁻⁷ Torr using a capacitance manometer to control the inlet pressure of a piezoelectric leak valve. Each growth sequence commenced with at least five monolayers of the LuFeO3 structure before the first LuFe2O4 layer to avoid over- oxidation of the LuFe2O4 by oxygen supplied by the YSZ substrate. (LuFeO3)m/(LuFe2O4)n superlattices with thicknesses ranging from 28 nm to 35 nm were studied.
The structure was characterized by XRD using a four-circle Rigaku SmartLab diffractometer equipped with a Ge(220) × 2 monochromator on the incident side and a Ge(220) × 2 analyser on the diffracted side, with Cu Kα radiation. XRD θ–2θ scans of all samples presented as well as a representative rocking curve are shown in Extended Data Fig. 1.High-resolution and variable-temperature electron microscopy. Cross-sectional TEM specimens were prepared using an FEI Strata 400 Focused Ion Beam (FIB) with a final milling step of 2 keV to reduce surface damage. High-resolution HAADF-STEM images were acquired on a 100-keV Nion UltraSTEM, a fifth- order aberration-corrected microscope. The images in Fig. 1b were acquired from a single sample containing the representative layering patterns in this study.
The lutetium distortions were quantified from HAADF-STEM images. Several images were averaged to reduce scan noise and the lutetium atomic positions were determined through an iterative two-dimensional Gaussian fitting procedure and segmentation using a watershed algorithm. The position of each atom was then compared to its neighbouring atom on each side in the same atomic plane. The magnitude and direction of the distortion was calculated by comparing the height difference of the three atoms as shown in Extended Data Fig. 6a. The schematics show different patterns of three-atom sets corresponding to the marked polarization. This distortion directly correlates with the ferroelectric polarization as shown in Extended Data Fig. 2. The resulting polarization at different locations in the structure is plotted in Extended Data Fig. 5 and in the aggregate in Extended Data Fig. 6b, c. In sum, the distortions from over 90,000 lutetium atoms were analysed to generate the results shown in Fig. 2e.
The temperature dependence of the lutetium distortions was measured using a Protochips Aduro double-tilt heating holder in a 200-keV FEI Tecnai F20-ST microscope as shown in Extended Data Fig. 6d. A cross-sectional TEM specimen was prepared by FIB as above and then mounted onto a ceramic heating chip. The temperature was controlled on the chip by passing a current, which was calibrated to be within 50 K of the intended temperature. HAADF-STEM images were recorded at intervals as the sample was heated from 290 K to 675 K. The ferroelectric distortions were estimated from the strength of the superlattice reflections observed in the fast Fourier transform of the image corresponding to the tripling of the unit cell from the lutetium distortions. We label regions where ferroelectric distortions were observed, where weak distortions were observed and where the distortions were not observed (although they may be present, they are below our resolution limit).Magnetic characterization with SQUID. Magnetic measurements were performed with a Quantum Design MPMS3 SQUID magnetometer. M–T curves with the sample field-cooled in 1 kOe and zero-field-cooled were measured for each sample, along with a bare YSZ substrate that had undergone identical deposition conditions as a superlattice (same oxygen partial pressure and time at growth temperature, but not exposed to the lutetium or iron molecular beams). The M–T curves of the YSZ substrate were used to subtract the diamagnetic and paramagnetic backgrounds from the (LuFeO3)m/(LuFe2O4)n M–T curves. The curves in Fig. 2a were normalized to facilitate comparison of the Curie temperatures (TC,mag) at which the superlattices order ferromagnetically (or ferrimagnetically).
The ferromagnetic (or ferrimagnetic) Curie temperature was taken to be the intersection between a line extending from the point of steepest descent of the field-cooled curve and a line extending from the high-temperature background.
M–H loops (where H is the magnetic field) out to 70 kOe were measured for each sample at 50 K, 100 K, 200 K and 300 K. The linear diamagnetic back-ground for each of these loops was subtracted with a linear fit to the high-field data. At higher temperature the loops saturate, but below 130 K the loops did not saturate, and an additional M–H loop was measured with the sample field-cooled in 70 KOe to measure the saturated magnetic moment at these temperatures. The known bulk magnetic moment of LuFeO3 (ref. 11) was subtracted from the total measured magnetic moment to obtain the LuFe2O4 magnetic moments shown in Fig. 2d. Extended Data Fig. 3c displays ‘excess magnetization’ as a function of composition at 50 K, 100 K and 200 K. This value was found by subtracting the magnetization due to the end-member LuFeO3 and LuFe2O4 signals from the total moment observed.Neutron scattering. Neutron diffraction was performed on the BT-4 triple-axis spectrometer at the NIST Center for Neutron Research using pyrolytic graphite monochromator and analyser crystals with neutrons of initial and final energies of 14.7 meV (λ = 2.359 Å). Relaxed horizontal collimation settings of the neutron optics in stream order were open–monochromator–40′ –sample–40′ –analyser–open–detector to maximize the intensity of the very weak scattered signal. The sample was mounted onto a silicon wafer using a small amount of aluminium foil and sealed in an aluminium canister with 4He gas to ensure thermal equilibration with the closed-cycle refrigerator.
Neutron diffraction was used to determine the onset of long-range magnetic order of a (LuFeO3)6/(LuFe2O4)2 superlattice. Neutron scattering is not sensitive to small impurity phases that may influence other bulk characterization techniques. Magnetic reflections of the (LuFeO3)6/(LuFe2O4)2 superlattice were observed in neutron diffraction by scanning along the [10L] reciprocal lattice direction, where the Miller index L is along the c axis or growth direction, at several temperatures between 5 K and 325 K. We found a single 101 magnetic reflection (indexed to the magnetic unit cell of 10.4 nm, or two superlattice repeat distances) at 5 K that was not present at room temperature. This peak is observed to show considerable change in intensity between 5 K and room temperature as shown in Extended Data Fig. 4a. The centre of the peak is offset slightly from the 101 reflection owing to a slight misalignment of the sample. A Gaussian function is fit to the signal to determine the integrated intensity as a function of temperature. Disregarding finite-size effects of the films along the growth direction, the full width of the resolution function is shown as the horizontal line (black), demonstrating that the peak is not resolution-limited. The magnetic correlation length from this is found to be ξ ≈ 30 nm, or roughly six superlattice units along the c direction.
The onset of magnetic order was determined by fitting the temperature- dependent integrated intensity of the peak with a mean-field order parameter. Shown in Extended Data Fig. 4b, we find TC,mag = 238 ± 28 K. This is consistent with the onset of ferromagnetism (or ferrimagnetism) determined from magnetometry of a (LuFeO3)6/(LuFe2O4)2 superlattice (246 K).
To understand the origin of this 101 reflection, we calculated the magnetic structure factors for the magnetic moment arrangement obtained from DFT for the COII and Fe3+-doped configurations of the (LuFeO3)3/(LuFe2O4)1 superlattice. These calculations show that 10L-type reflections are particularly sensitive to the onset of ferrimagnetic order along the c axis in the LuFe2O4 layers in the charge- ordered state.X-ray linear dichroism. X-ray absorption spectroscopy on the Fe L2,3 edge was performed at Beamline 4.0.2 at the Advanced Light Source at Lawrence Berkeley National Laboratory. Spectra were acquired with 100% linearly polarized light oriented nearly parallel to and perpendicular to the c axis of the sample for an angle of X-ray incidence of 20° to the sample surface. The normalized difference between these spectra was collected for temperatures ranging from 300 K to 700 K for (LuFeO3)9/(LuFe2O4)1, (LuFeO3)5/(LuFe2O4)1, (LuFeO3)3/(LuFe2O4)1 and (LuFeO3)1/(LuFe2O4)3. All temperatures measured were above the magnetic transition temperatures of the corresponding films and so the dichroic signal records an asymmetry in the electronic structure, as previously recorded for ferroelectric thin films31. As shown in Extended Data Fig. 7b, the (LuFeO3)1/(LuFe2O4)3 sample displays dichroism of about 20% at 300 K due to the structural anisotropy between the in-plane and out-of-plane electronic configurations in the hexagonal structure. A smaller anisotropy was also previously recorded for LuFe2O4 (ref. 34).
Previous calibration of the endstation has identified a systematic error of approximately ± 5% in the measured dichroism due to the variation of the degree of X-ray polarization, the angle of X-ray incidence and photon energy with time. To further determine the uncertainty associated with these measurements, we measured the dichroic signal from the (LuFeO3)9/(LuFe2O4)1 sample multiple
© 2016 Macmillan Publishers Limited, part of Springer Nature. All rights reserved.

Letter reSeArCH
times before sample heating and again after the sample heating/irradiation. From comparison of the dichroic signal, we find a standard error of the mean of approximately 0.016 (4% in un-normalized units), within the uncertainty estimated from the previous calibration.
The (LuFeO3)9/(LuFe2O4)1, (LuFeO3)5/(LuFe2O4)1 and (LuFeO3)3/(LuFe2O4)1 samples, which were identified as displaying ferroelectric lutetium distortions by HAADF-STEM, demonstrated a dichroism of about 40% at 300 K. The temperature-dependent fits of the recorded difference spectra as a linear combination of the structural (LuFeO3)1/(LuFe2O4)3 component and (LuFeO3)9/(LuFe2O4)1 component at 300 K are shown in Fig. 2f. There is a drop in the recorded signal for the (LuFeO3)5/(LuFe2O4)1 and (LuFeO3)3/(LuFe2O4)1 samples indicative of a ferroelectric transition. The XLD signal does not decrease fully to the signal observed in (LuFeO3)1/(LuFe2O4)3, suggesting that there may be an additional structural component in the (LuFeO3)m/(LuFe2O4)1 films that is not captured by the (LuFeO3)1/(LuFe2O4)3 component. The data shown in Fig. 2f were fitted to an order parameter plus a constant background using a Bayesian fitting algorithm. From this, we identify a transition TC,el at about 550 K and 500 K in the (LuFeO3)3/(LuFe2O4)1 and (LuFeO3)5/(LuFe2O4)1 sample, respectively. Assuming the same constant background for the (LuFeO3)9/(LuFe2O4)1 sample, we estimate a transition near 900 K, beyond the measurement range of this experiment. The variable-temperature HAADF-STEM images (Extended Data Fig. 6d) recorded from these layering patterns are also consistent with transitions at comparable temperatures, although slightly different transitions between the m = 3 and m = 5 superlattices are found. The high-temperature transition in the (LuFeO3)9/(LuFe2O4)1 superlattice is consistent with the observation of superlattice reflections in RHEED corresponding to the trimer distortion24 during thin-film deposition at the growth temperature for this film.Piezoelectric force microscopy. Vertical (or out-of-plane) PFM was used to measure the ferroelectric polarizability of the (LuFeO3)9/(LuFe2O4)1 superlattice shown in Figs 2g and 4a35–37. A bottom electrode was added to the sample after thin-film deposition. The substrate was first thinned using tripod mechanical polishing at a 1° angle; the measured region had a substrate thickness of approximately 150 nm. A copper adhesion layer and subsequent platinum layer were deposited onto the thinned substrate by direct-current magnetron sputtering in an argon background of 3 × 10⁻³ Torr at room temperature. This provided a conducting back electrode for the PFM experiments without disturbing the epitaxy of the (LuFeO3)9/(LuFe2O4)1 film on the insulating YSZ substrate.
In Fig. 2g, a 20 μm × 20 μm region was poled with a d.c. bias of − 15 V to switch the sample to the ‘upward’-oriented out-of-plane polarization. A second switch with a d.c. bias of + 15 V was then performed to write the pattern shown with the corresponding ‘downward’-oriented polarization. The resulting structure was imaged directly after poling and again 100 h later using a 2-V a.c. voltage. The image acquired after 100 h was rotated after acquisition to follow the orientation in the original image. The persistence of the written structure demonstrates the ability to reversibly switch the ferroelectric polarization with an electric field. In Fig. 4a, a 15 μm × 15 μm region was poled using a single switch of a d.c. bias at + 15 V and − 15 V (applied to the cantilever tip), generating a ‘downward’- and ‘upward’- oriented out-of-plane polarization, plotted in red and turquoise, respectively. The magnetic structure presented in Fig. 4b–d was measured nearly 200 h after the initial poling shown in Fig. 4a, further corroborating the persistence of the switched state.Variable-temperature and magnetic field transport measurements. Variable-temperature and magnetic field transport measurements were made in the van der Pauw geometry and performed using the combination of a Quantum Design PPMS and external Keithley electronics. Measurements were made of the in-plane resistivity, for example, parallel to the (0001) planes. The resistivity increases substantially as the temperature is lowered until it is beyond our measurement abilities below about 200 K. Resistivity values for the entire stack of the two samples we measured, (LuFeO3)6/(LuFe2O4)1 and (LuFeO3)8/(LuFe2O4)1, are 4.3–86.5 Ω cm over the 330–198 K temperature range. Plotting the natural logarithm of the conductivity as various powers of inverse temperature suggests that conduction is primarily through thermally activated carriers. No anomaly in the resistivity at TC,mag or any changes in resistivity with the application of a magnetic field (0 T, 5 T and 9 T) were observed. We attempted, but were unable (the sample was too resistive), to measure a bare YSZ substrate that had undergone identical deposition conditions as a superlattice (the same oxygen partial pressure and time at growth temperature, but not exposed to the lutetium or iron molecular beams) to determine if the primary conduction path was mediated by oxygen vacancies generated in the substrate.Possible origin of the enhancement of the magnetic transition of the (LuFeO3)1/(LuFe2O4)n superlattices. The enhancement of TC,mag in region I could be caused by strain or oxygen stoichiometry effects. Lutetium atom distortions were not
observed in these superlattices. A slight mismatch between the LuFeO3 in-plane lattice (a = 5.989 ± 0.005 Å in thick relaxed epitaxial films25 or 3.458 Å for the primitive cell) and the bulk LuFe2O4 (a = 3.4406 Å; ref. 38) produces a tensile strain of up to 0.25% on the LuFe2O4 layers; epitaxial strain has previously been shown to affect ferromagnetic transitions7,39,40. In region I, TC,mag reaches 250 K, approximately the transition observed in LuFe2O4 single crystals17. Previous experiments have shown that the magnetic properties of LuFe2O4 are extremely sensitive to deviations in oxygen stoichiometry41 and thus a small amount of oxygen diffusion between the LuFe2O4 and LuFeO3 layers could have also caused the increase in TC,mag to 250 K.LuFe2O4, ‘model LuFe2O4’ and the increase in TC,mag from first principles. We use first-principles DFT calculations to elucidate the origin of the increase in the magnetic transition temperature TC,mag with the number of LuFeO3 layers (Fig. 2c) and, correspondingly, the magnitude of the electrical polarization (Fig. 2e). In particular, we perform DFT calculations on what we call ‘model LuFe2O4’ systems: bulk-like LuFe2O4 structures with the addition of the trimer distortion Q. This trimer distortion is characteristic of LuFeO3 and, as shown in Fig. 1b, is experimentally observed in the (LuFeO3)m/(LuFe2O4)1 superlattices, yet is not observed in bulk LuFe2O4. This allows us to derive a simple model that elucidates the origin of the effect in the superlattices, without performing DFT calculations directly on these larger structures.First-principles calculations of bulk LuFe2O4. Previous experimental work17 has suggested that bulk LuFe2O4 has a net polarization due to a charge disproportionation between the composing iron bilayers. In the first layer (A), an Fe2+ ion is at the centre of a hexagon composed of six Fe3+ ions, leading to a 1:2 ratio of the charges. The second layer (B) has a similar arrangement with a majority of Fe2+. It was proposed that the bilayers order to form an ABAB stacking along the c direction. We denote this structure as ‘COII’, which is displayed in Fig. 3b and reproduced in Extended Data Fig. 10b. This stacking sequence breaks inversion symmetry and so is compatible with a ferroelectric state (space group Cm).
We have also considered multiple additional charge-order arrangements, including those compatible with a non-ferroelectric state, consistent with later experimental results42,43. We introduce only the low-energy arrangements here. One such arrangement has the same bilayer structure as COII, but an opposite stacking of the bilayers, for example, ABBA ordering. In this case, a mirror plane is located at the Lu–O plane, preserving inversion symmetry (space group C2/m). We refer to this structure, displayed in Fig. 3a and reproduced in Extended Data Fig. 10a, as ‘COI’. In additional, the layers can be stacked in an AABB arrangement (proposed in ref. 42, but studied theoretically for the first time here), which we denote ‘COIII’ (space group C2/m) and display in Extended Data Fig. 10c. In this configuration, the AA and BB bilayers have excess charge and a mirror plane located at the centre between two A (B) layers. COI and COIII are non-polar (space group C2/m)42,43 and therefore not ferroelectric. We find that COI is the lowest- energy configuration, followed by COII, which is higher than COI by only about 4 meV per formula unit. COIII is higher in energy than COI by more than about 50 meV per formula unit and therefore will not be considered further. The small difference in energy between COI and COII is expected because the two structures differ only in long-range inter-bilayer Coulomb interactions. Structurally, however, COI and COII have a quite distinct (and relatively easy to experimentally discern) difference: the COII configuration induces the lutetium trimer distortions, which are forbidden by symmetry in COI.Magnetic configurations of COI and COII from first principles. One difficulty in definitively determining the magnetic ground state of LuFe2O4 from first principles is the presence of multiple magnetic configurations of COI and COII with similar energy. The energetics of these magnetic configurations in COI and COII are shown in Extended Data Fig. 9b. The ground-state magnetization identified for COI is M = 0.5μB/Fe, whereas the lowest energy of COII has M = 1.2μB/Fe. Both COI and COII have low-energy states with M ranging from 0μB/Fe to 1.2μB/Fe.M versus T from a first-principles parameterized Ising model. According to experimental measurements44, LuFe2O4 undergoes a ferrimagnetic transition at TC,mag = 240–250 K, resulting in an Ising-like net magnetic moment along the c direction. The reported moment ranges from 0.8μB/Fe to 1.4μB/Fe and is particularly sensitive to oxygen stoichiometry41. We thus consider an Ising Hamiltonian to describe the magnetic properties of the LuFe2O4 system:
∑=H J S Sij
ij i j
Here Jij is the symmetric super-exchange interaction and the spin Si = ± 2 (Si = 5/2) for Fe2+ (Fe3+) in trigonal bipyramidal coordination with high spin. The six super-exchange interactions considered correspond to nearest- neighbour interactions for iron (2+ /3+ ) located either in the same plane (Jin-plane), in
© 2016 Macmillan Publishers Limited, part of Springer Nature. All rights reserved.
LetterreSeArCH
neighbouring planes within a bilayer (Jintra) or in neighbouring planes between different bilayers (Jinter); see Extended Data Fig. 8a. These parameters are estimated from first principles. The magnetic ground states and Curie transition temperatures are then determined from Monte Carlo simulations. The simulated TC,mag for COI (TC,mag ≈ 500 K) is found to be about a factor of two higher than the experimentally reported value (TC,mag ≈ 240 K). The possible origins of this discrepancy are: (1) correlations among electrons not captured with DFT + U that strongly influence the magnetic exchange interactions or (2) relativistic interactions between spins that are not included in the present model, yet that often strongly compete with symmetric exchange interactions. We therefore introduce a normalization factor of approximately 0.48 to match the calculated TC,mag of COI with the corresponding experimentally reported value and use this same factor throughout our study. Although, in essence, the TC,mag of bulk (COI) LuFe2O4 becomes a parameter, the changes in TC,mag (for example, from COI to COII) are calculated from a parameter-free, first-principles theory. The corresponding results are displayed in Fig. 3a and b for COI and COII (with Q ≈ 1), respectively, where it is seen that the ferrimagnetic transition temperature of COII is substantially larger (TC,mag ≈ 300 K) than that of COI.Model LuFe2O4. Noting that COII induces lutetium trimer distortions, we repeat our Monte Carlo simulations of the magnetic transition for different values of Q. As shown in Fig. 3b, we observe that TC,mag monotonically increases with the magnitude of this distortion. Calculated super-exchange values as a function of distortion are shown in Extended Data Fig. 8b. The largest super-exchange interactions correspond to in-plane interactions and follow a linear trend as a function of Q. Although the Fe3+–Fe3+ interactions increase and become more antiferromagnetic, the Fe2+–Fe2+ interactions follow the opposite trend. The Fe2+–Fe3+ interactions do not exhibit substantial variation as a function of Q. This result is consistent with the Goodenough–Kanamori–Anderson (GKA) rules considering the change in angle for the Fe–O–Fe super-exchange in-plane paths as illustrated in Extended Data Fig. 8a. As the distortions are increased, on average the Fe–O–Fe angle becomes larger than the undistorted value of 118° for Fe3+–Fe3+ interactions, smaller for Fe2+–Fe2+ and unchanged for Fe2+–Fe3+. Because the Fe2+ and Fe3+ ions both have partially filled d orbitals, the GKA rules predict antiferro-magnetic and ferromagnetic super-exchange interactions for 180°and 90° angles, respectively, consistent with the trend observed in Extended Data Fig. 8b. The observed control of TC,mag by the trimer distortion is universal, parameter-free and is independent of any specific detail of the first-principles methods.First-principles calculations of the (LuFeO3)m/(LuFe2O4)1 structures. DFT calculations were also performed on the (LuFeO3)m/(LuFe2O4)1 periodic supercells for superlattices with m = 1, 3 and 5. The size of these supercells varies depending on whether m is odd or even. For odd values of m, the number of (LuFeO3)m/(LuFe2O4)1 blocks has to be doubled along the out-of-plane direction to obtain a periodic supercell. For even values, the number of blocks has to be tripled. Additionally, taking into account that trimerization of the LuFeO3 structure and charge order of the LuFe2O4 structure demand a supercell containing three formula units per plane, the total number of atoms for the different periodic (LuFeO3)m/(LuFe2O4)1 supercells is N = 6(5m + 7) and N = 9(5m + 7), for odd and even values of m, respectively. Owing to computational constraints, most of our calculations were performed on (LuFeO3)1/(LuFe2O4)1 (72 atoms) and (LuFeO3)3/(LuFe2O4)1 (132 atoms) supercells. Calculations were also performed on (LuFeO3)5/(LuFe2O4)1 supercells (192 atoms)—without considering full structural optimizations—to confirm the key result obtained for m = 3, that is, stabilization of hole-doped LuFe2O4 blocks with head-to-head domain walls occurring in the middle of LuFeO3 blocks, as discussed below.Charge order and magnetism in a single ferroelectric domain. In a single ferroelectric domain of a (LuFeO3)m/(LuFe2O4)1 superlattice, the most stable charge-order configuration is COII, as shown in Extended Data Fig. 10d for m = 3. The lowest-energy magnetic configuration corresponds to the same ferrimagnetic arrangement found in bulk LuFe2O4 with the COII pattern, characterized by M = 1.2μB/Fe. Once LuFeO3 is added to LuFe2O4—that is, (LuFeO3)m/(LuFe2O4)1 superlattices with m ≥ 1—the COI pattern becomes unstable. The single- domain configuration with the COII pattern of the m = 3 (LuFeO3)m/(LuFe2O4)1 superlattice is metastable against multidomain configurations, even under E = 0 electrical boundary conditions. We refer to the multidomain configurations as (1) ‘undoped-type’ (Extended Data Fig. 10e) and (2) ‘doped-type’ (Extended Data Fig. 10f). For the m = 1 composition, the difference in energy between the domain types is negligible. By contrast, for the m = 3 superlattice, the doped-type domain configuration is about 8 meV per formula unit more stable than the undoped-type, which itself is about 8 meV per formula unit more stable than the single- domain configuration, demonstrating the added stability of this configuration with increasing m. We also verified that the doped-type domain configuration remains the most stable for the m = 5 superlattice.
Ferroelectric undoped-type domain. The undoped-type structure corresponds to the COII ordering pattern in which the AB bilayers are stacked in ABAB sequence along the c direction. Here the superlattice exhibits charged tail-to-tail and head-to-head ferroelectric domain walls. For the m = 3 superlattice, the tail-to-tail domain wall occurs at the interface between a bilayer and LuFeO3, whereas the head-to-head domain wall always occurs in the LuFeO3 block next to the second bilayer, as labelled in Extended Data Fig. 10e. The magnetism of this structure is similar to the single ferroelectric domain case shown in Extended Data Fig. 10d.Ferroelectric doped-type domain. The starting point to understanding the doped-type domain structure is again the COII ordering pattern of the bulk LuFe2O4. In this case, however, nearly an electron of charge from a Fe2+ cation located in the A layer of LuFe2O4 is transferred to an Fe3+ cation located in the LuFeO3 layer, as illustrated in Extended Data Fig. 10f. This results in Fe3+-rich iron bilayers and a corresponding stacking sequence of AAAA (see Extended Data Fig. 10f). Therefore, we can consider the head-to-head domains in this configuration as being stabilized as a result of LuFe2O4 layers electron-doping the LuFeO3 layers. Indeed, in the doped-type domains, the tail-to-tail domain wall occurs at the interface between a bilayer and LuFeO3, whereas the head-to-head domain wall occurs right at the doping layer in the LuFeO3 block, as shown in Extended Data Fig. 10f.
Alternatively, we can consider the LuFeO3 layers as hole-doping the LuFe2O4. In this doped-type of ferroelectric domain, the only contribution to the total magnetization in the hole-doped LuFe2O4 layers is from ferromagnetically aligned Fe2+ ions located at the centre of the Fe3+ hexagons. Because the in-plane Fe3+–Fe3+ super-exchange interactions are always found to be antiferromagnetic, there is no net contribution due to the Fe3+ ions. This leads to a magnetization of M = 1.33μB/Fe for each Fe3+-doped bilayer, as shown in Extended Data Fig. 9c.
Although this charged domain-wall configuration might appear energetically unfavourable, mobile carriers redistribute to screen the excess of bound charges. The calculated density of states for each iron cation in the heterostructure is shown in Extended Data Fig. 10e. Our calculations demonstrate that electrons migrate from the LuFe2O4 block to occupy iron states in contiguous LuFeO3 layers, which nevertheless remain insulating. Owing to the shift in the electrostatic potential caused by LuFeO3 dipoles, conducting Fe d states appear at the head-to-head domain walls (Extended Data Fig. 10f). Because the potential drop across the structure should increase with superlattice periodicity, we expect the electrical conductivity of the walls to grow monotonically with m. The same qualitative trends are observed in the m = 5 superlattices.Computational details. Structural relaxations of bulk LuFe2O4 were performed using the DFT + U method45 with the Perdew–Burke–Ernzerhof (PBE)46 form of exchange correlation functional as implemented in VASP code47. We used the projector-augmented plane-wave method48. We considered Lu 4f states in the core; for Fe 3d states we chose UFe = 4.5 eV (where UFe is the screened Coulomb interaction) and J = 0.95 eV (where J is the Hunds coupling on the iron site). The choice of U and J are based on our previous study on the LuFeO3 system16, but all results remain qualitatively similar for choices of UFe > 4.5 eV. We used a 6 × 6 × 2 k-point mesh and a kinetic-energy cut-off value of 500 eV. The Hellman–Feynman forces were converged to 0.001 eV Å−1. To account for the different charge orders (COI, COII and COIII), a ×3 3 supercell of the high-symmetry R m3 cell was considered.
Considering optimized structures with VASP, spin–spin exchange interactions were estimated by fitting the Ising model with the energies of different magnetic configurations calculated with the linearized augmented plane-wave (LAPW) method as implemented in the Wien2k code49. We considered 25 magnetic configurations to construct the model Hamiltonian for the high-symmetry phase and each charge-ordered state. To be consistent, we used the same UFe and J values and k-point mesh as for VASP. We used ULu = 8.8 eV and J = 0.95 eV for Lu 4f states. The plane-wave cut-off, which is defined as the ‘muffin tin’ radius multiplied by kmax, is 7.0.
For (LuFeO3)m/(LuFe2O4)1 superlattices, all internal parameters as well as out-of-plane lattice constants were fully relaxed (except for the in-plane lattice constant, which was fixed to the average value of the corresponding LuFeO3 and LuFe2O4 lattice constants, aavg = 3.46 Å). All calculations involving superlattices were performed in VASP.XMCD-PEEM imaging. Magnetic imaging was performed using cryogenic PEEM at the Advanced Light Source at Beamline 11.0.150, taking advantage of XMCD at the Fe L3 edge51. Magnetic images are obtained by dividing images recorded with left and right circular polarization. The resulting dark and bright contrast is a measure of the projection of the magnetization direction on the X-ray polarization vector, which has a 30° angle of incidence relative to the surface of the sample.
To probe the coupling between the ferroic orders, XMCD-PEEM measurements were made on a region of the (LuFeO3)9/(LuFe2O4)1 sample that was poled with
© 2016 Macmillan Publishers Limited, part of Springer Nature. All rights reserved.
Letter reSeArCH
a PFM tip to form distinct regions of ‘up’ and ‘down’ c-oriented ferroelectric polarization. The PFM poling was performed eight days before PEEM imaging to ensure that the polarization configuration that was imaged was robust. The PFM poling was performed at 300 K. In the PEEM, the sample was first cooled to 200 K to increase the magnetic contrast from the buried LuFe2O4 layer. As shown in Fig. 4b, the magnetic structure displays the same distinct pattern as the ferroelectric polarization. Finally, to confirm that the magnetic image shown in Fig. 4b could not be due to extrinsic effects, the sample was heated to 320 K. As shown in Fig. 4d, the resulting dichroism dropped by about 70%, consistent with the drop in the saturation magnetization between these temperatures identified in SQUID. Because the overall XLD contrast was constant between those two temperatures (not displayed in Fig. 2f, but acquired using the same experimental configuration) and any extrinsic chemical contrast would similarly be constant, this indicates that the strong dichroism observed at 200 K must arise from the magnetic order.
33. Moyer, J. A. et al. Intrinsic magnetic properties of hexagonal LuFeO3 and the effects of nonstoichiometry. APL Mater. 2, 012106 (2014).
34. Lafuerza, S. et al. Hard and soft x-rays XAS characterization of charge ordered LuFe2O4. J. Phys. Conf. Ser. 592, 012121 (2015).
35. Kalinin, S. V., Rar, A. & Jesse, S. A decade of piezoresponse force microscopy: progress, challenges, and opportunities. IEEE Trans. Ultrason. Ferroelectr. Freq. Control 53, 2226–2252 (2006).
36. Kholkin, A. L., Kalinin, S. V., Roelofs, A. & Gruverman, A. in Scanning Probe Microscopy: Electrical and Electromechanical Phenomena at the Nanoscale Vol. 1 (eds Kalinin, S. & Gruverman, A.) 173–214 (Springer, 2007).
37. Balke, N., Bdikin, I., Kalinin, S. V. & Kholkin, A. L. Electromechanical imaging and spectroscopy of ferroelectric and piezoelectric materials: state of the art and prospects for the future. J. Am. Ceram. Soc. 92, 1629–1647 (2009).
38. Isobe, M., Kimizuka, N., Iida, J. & Takekawa, S. Structures of LuFeCoO4 and LuFe2O4. Acta Crystallogr. C 46, 1917–1918 (1990).
39. Beach, R. S. et al. Enhanced Curie temperatures and magnetoelastic domains in Dy/Lu superlattices and films. Phys. Rev. Lett. 70, 3502–3505 (1993).
40. Tsui, F., Smoak, M. C., Nath, T. K. & Eom, C. B. Strain-dependent magnetic phase diagram of epitaxial La0.67Sr0.33MnO3 thin films. Appl. Phys. Lett. 76, 2421–2423 (2000).
41. Wang, F. et al. Oxygen stoichiometry and magnetic properties of LuFe2O4+δ. J. Appl. Phys. 113, 063909 (2013).
42. de Groot, J. et al. Charge order in LuFe2O4: an unlikely route to ferroelectricity. Phys. Rev. Lett. 108, 187601 (2012).
43. de Groot, J. et al. Competing ferri- and antiferromagnetic phases in geometrically frustrated LuFe2O4. Phys. Rev. Lett. 108, 037206 (2012).
44. Iida, J., Nakagawa, Y., Funahashi, S., Takekawa, S. & Kimizuka, N. Two-dimensional magnetic order in hexagonal LuFe2O4. J. Phys. Colloq. 49, 1497–1498 (1988).
45. Anisimov, V. I., Aryasetiawan, F. & Lichtenstein, A. I. First-principles calculations of the electronic structure and spectra of strongly correlated systems: the LDA + U method. J. Phys. Condens. Matter 9, 767–808 (1997).
46. Perdew, J. P., Burke, K. & Ernzerhof, M. Generalized gradient approximation made simple. Phys. Rev. Lett. 77, 3865–3868 (1996).
47. Kresse, G. & Hafner, J. Ab initio molecular dynamics for liquid metals. Phys. Rev. B 47, 558–561 (1993).
48. Kresse, G. & Furthmüller, J. Efficient iterative schemes for ab initio total-energy calculations using a plane-wave basis set. Phys. Rev. B 54, 11169–11186 (1996).
49. Blaha, P., Schwarz, K., Madsen, G. K. H., Kvasnicka, D. & Luitz, J. WIEN2k: An Augmented Plane Wave Plus Local Orbitals Program for Calculating Crystal Properties http://www.wien2k.at/reg_user/textbooks/usersguide.pdf (Tech. Univ. Wien, 2002).
50. Doran, A. et al. Cryogenic PEEM at the advanced light source. J. Electron Spectrosc. Relat. Phenom. 185, 340–346 (2012).
51. Stöhr, J. et al. Element-specific magnetic microscopy with circularly polarized X-rays. Science 259, 658–661 (1993).
© 2016 Macmillan Publishers Limited, part of Springer Nature. All rights reserved.

LetterreSeArCHIn
tens
ity (a
.u.)
0 10 20 30 40 2θ (degrees)
LuFe2O4
LuFeO3
1-3
1-2
1-1
2-1
3-1
4-1
5-1
7-1
9-1 0 -0.3 -0.2 -0.1 0.1 0.3 0.2 ω (degrees)
Sub
stra
te In
tens
ity (a
.u.)
100
101
102
103
104
105
106
100
101
102
103
104
Film Intensity (a.u.)
Substrate FWHM ~ 0.009°
Film FWHM ~
0.010°
a
b (LuFeO3)1/(LuFe2O4)1
(LuFeO3)m/(LuFe2O4)n
Extended Data Figure 1 | X-ray diffraction characterization of the (LuFeO3)m/(LuFe2O4)n superlattices. a, θ–2θ XRD scans for the (LuFeO3)m/(LuFe2O4)n films for which either n or m is equal to 1. The composition is labelled (m-n) on the right. The asterisk (* ) indicates the
111 XRD peak from the (111) YSZ substrate. b, Rocking-curve XRD scan of the 005 film peak of the (LuFeO3)1/(LuFe2O4)1 film (blue) compared with the 111 peak of the YSZ substrate (black). FWHM, full-width at half-maximum.
© 2016 Macmillan Publishers Limited, part of Springer Nature. All rights reserved.

Letter reSeArCH
Extended Data Figure 2 | Relation between the lutetium displacements and polarization. The magnitude of the lutetium displacement d can be measured by HAADF-STEM. Using first-principles calculations, this displacement can be directly related to the polarization of the structure. Lutetium is shown in turquoise, iron in yellow and oxygen in brown.
d
Displacement (pm)
Pol
ariz
atio
n (μ
C/c
m2 )
-100 -80 -60 -40 -20 0 20 40 60 80 100-20
-15
-10
-5
0
5
10
15
20
© 2016 Macmillan Publishers Limited, part of Springer Nature. All rights reserved.

LetterreSeArCH
Extended Data Figure 3 | Magnetic characterization of the (LuFeO3)m/(LuFe2O4)n superlattices. a, M–T curves for a series of (LuFeO3)m/(LuFe2O4)1 superlattices cooled in a 1-kOe field. b, M–T curves for a series of (LuFeO3)1/(LuFe2O4)n superlattices cooled in a 1-kOe field. c, The “excess magnetization” is found by subtracting the bulk magnetization of the LuFe2O4 and LuFeO3 from the measured moment. It is plotted normalized to the number of iron atoms in the LuFe2O4 layers in the sample. The composition is plotted according to the fraction of iron atoms in the LuFeO3 layers in the (LuFeO3)m(LuFe2O4)n structure. d, Loops of the magnetization M as a function of the
magnetic field H for the (LuFeO3)9/(LuFe2O4)1 superlattice. The M–H loop at 300 K has a distinctly different shape that is more reminiscent of the 250-K loop, demonstrating that ferromagnetic (or ferrimagnetic) fluctuations still exist at 300 K even if the entire film is not ferromagnetic (or ferrimagnetic). e, The saturation magnetization of the (LuFeO3)9/(LuFe2O4)1 superlattice at 70 KOe as a function of temperature. Although the remanent magnetization, as measured by the field-cooled curve, disappears around the Curie temperature of 281 K, ferromagnetic (or ferrimagnetic) fluctuations remain in this sample to temperatures above room temperature.
Norm
alize
d M
agne
tizat
ion
(M/M
o)
Temperature (K)
Mag
netiz
atio
n (µ
B/Fe)
Magnetic Field (kOe)
(LuFeO3)m/(LuFe2O4)1 (LuFeO3)9/(LuFe2O4)1
-50 0 50-0.3
-0.2
-0.1
0
0.1
0.2
0.3100K200K250K300K350K
0 100 200 300 4000
0.2
0.4
0.6
0.8
1 LuFe2O4
m = 1m = 2m = 3m = 4m = 5m = 6m = 7m = 8m = 9m = 10m = 15LuFeO3
Norm
alize
d M
agne
tizat
ion
(M/M
o)
Temperature (K) Temperature (K)
(LuFeO3)9/(LuFe2O4)1
0 100 200 300 4000
0.05
0.1
0.15
0.2
0.25
0.3
0.35
0 100 200 300 4000
0.2
0.4
0.6
0.8
1 LuFe2O4
n = 5n = 3n = 2n = 1LuFeO3
0 0.2 0.4 0.6 0.8 1-0.2
0
0.2
0.4
0.6
0.8
1
1.250 K100 K200 K
(LuFeO3)m/(LuFe2O4)n
Composition (m/2m+n)
Exce
ss M
agn.
(µB/F
e in
LuF
e 2O4)
a d
Sat.
Mag
n. (µ
B/Fe)
(LuFeO3)1/(LuFe2O4)nb e
c
© 2016 Macmillan Publishers Limited, part of Springer Nature. All rights reserved.

Letter reSeArCH
Extended Data Figure 4 | Neutron diffraction of the (LuFeO3)6/(LuFe2O4)2 superlattice. a, Magnetic reflections for the (LuFeO3)6/(LuFe2O4)2 superlattice were observed in neutron diffraction by scanning along the [10L] direction in reciprocal space at several temperatures between 5 K and 325 K. A single peak is observed showing considerable change in intensity between 5 K and room temperature. The offset from
the 101 position is due to a slight misalignment of the sample. r.l.u. in a denotes reciprocal lattice units. b, Integrated intensity of the 101 magnetic reflection for the (LuFeO3)6/(LuFe2O4)2 superlattice as a function of temperature. The solid line is the mean-field fit. Error bars in a and b represent one standard deviation.
0 100 200 300-10
0
10
20
30
40
50
Temperature (K)
Inte
grat
ed In
tens
ity (a
.u.)
0 0.5 1 1.5 2 2.5180
200
220
240
260
280
300
320
340
360
3805 K325 K
1 0 L (r.l.u.)
Cou
nts
/ 10
min
utes
a b
© 2016 Macmillan Publishers Limited, part of Springer Nature. All rights reserved.
LetterreSeArCH
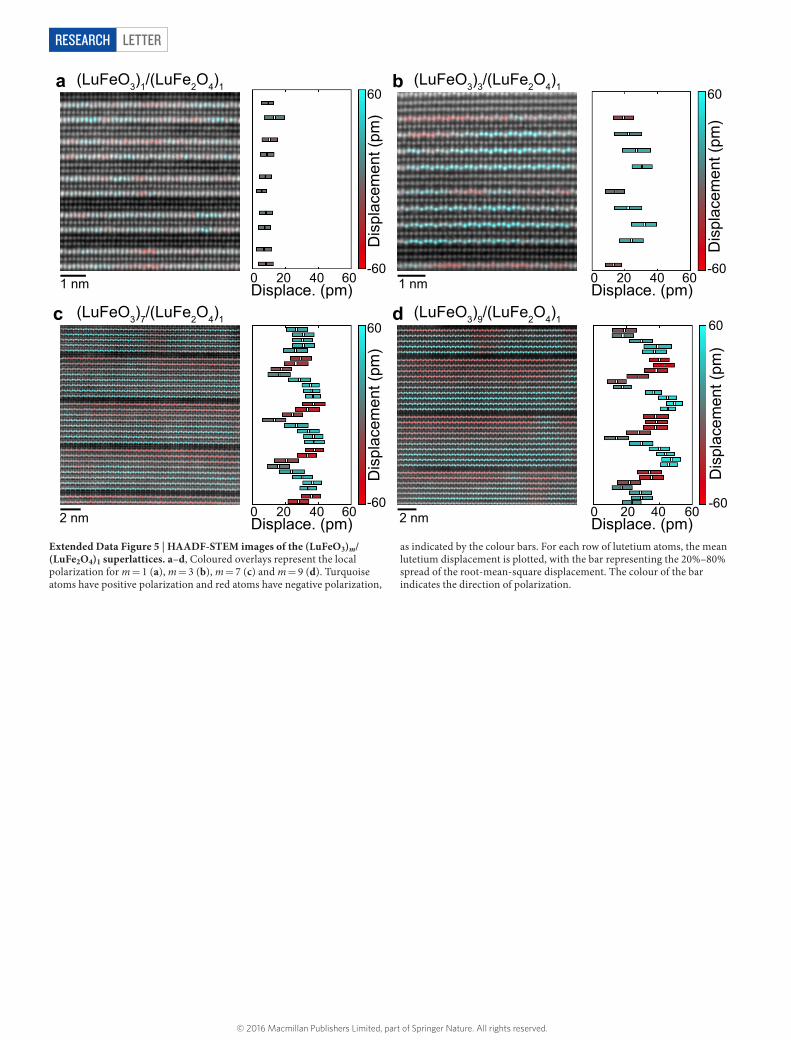
Extended Data Figure 5 | HAADF-STEM images of the (LuFeO3)m/(LuFe2O4)1 superlattices. a–d, Coloured overlays represent the local polarization for m = 1 (a), m = 3 (b), m = 7 (c) and m = 9 (d). Turquoise atoms have positive polarization and red atoms have negative polarization,
as indicated by the colour bars. For each row of lutetium atoms, the mean lutetium displacement is plotted, with the bar representing the 20%–80% spread of the root-mean-square displacement. The colour of the bar indicates the direction of polarization.
1 nm 1 nm
a
c
2 nm 2 nm
b
d
0 20 40 60
60
-60
Dis
plac
emen
t (pm
)
Displace. (pm)0 20 40 60
60
-60
Dis
plac
emen
t (pm
)
Displace. (pm)
0 20 40 60
60
-60
Dis
plac
emen
t (pm
)
Displace. (pm)0 20 40 60
60
-60
Dis
plac
emen
t (pm
)
Displace. (pm)
(LuFeO3)1/(LuFe2O4)1 (LuFeO3)3/(LuFe2O4)1
(LuFeO3)7/(LuFe2O4)1 (LuFeO3)9/(LuFe2O4)1
© 2016 Macmillan Publishers Limited, part of Springer Nature. All rights reserved.

Letter reSeArCH
Extended Data Figure 6 | Quantification of the ferroelectric displacements from HAADF-STEM images. After identifying the position of the lutetium atom with sub-ångström precision, it is compared to the neighbouring atoms and the displacement is calculated. a, Schematics of the ‘down’, ‘up’ and non-polar polarization states. b, Average displacement of the lutetium atoms as a function of the number of LuFeO3 layers m in the (LuFeO3)m/(LuFe2O4)1 structure. The displacement of the end-member LuFeO3 is shown for reference; this displacement of 29 pm corresponds to approximately 4.3 μC cm−2. Error
bars in a and b are s.e.m. c, A comparison of the distortion observed in the middle of the LuFeO3 block to those in the edge layers, for example, those adjacent to the LuFe2O4 bilayers. d, In situ TEM heating experiment of the (LuFeO3)m/(LuFe2O4)n superlattices. We infer the ferroelectric phase from where distortions in the lutetium rows are resolved. With increasing temperature, ferroelectricity disappears starting with lower m. Above T = 675 K, we see no ferroelectric distortions; however, the electrical noise in the images at these temperatures is quite large.
Polarization “down” Polarization “up” Non-polar a
b
c
10 12 14 16 180
10
20
30
40
50LuFeO3
total
0 2 4 6 8
Dis
plac
emen
t (pm
)D
ispl
acem
ent (
pm)
LuFeO3 layers (m)
0 2 4 6 8 10 12 14 16 180
10
20
30
40
50
LuFeO3middleedge
LuFeO3 layers (m)
290
475
525
575
675
FE FE FE FE
FE FE FE
FE FE FE
FE
Tem
pera
ture
(K)
0 1 2 3 4 5LuFeO3 layers (m)
FE FE
No distortionsWeak distortionsDistortions
© 2016 Macmillan Publishers Limited, part of Springer Nature. All rights reserved.
LetterreSeArCH
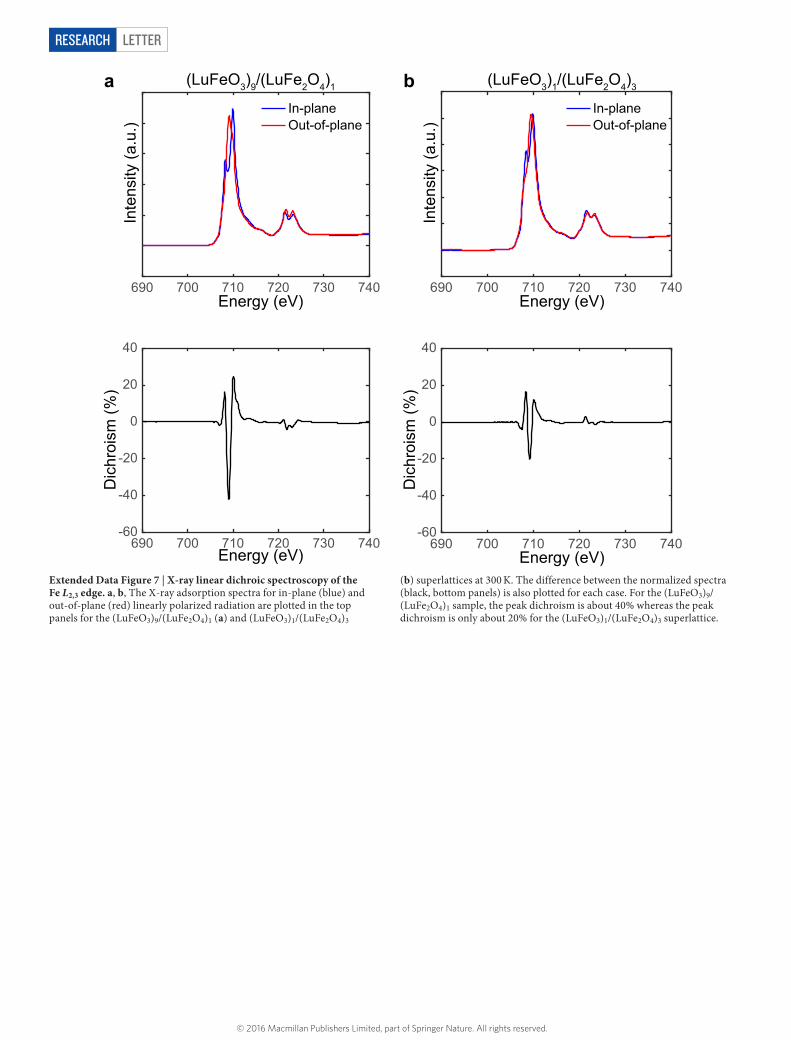
Extended Data Figure 7 | X-ray linear dichroic spectroscopy of the Fe L2,3 edge. a, b, The X-ray adsorption spectra for in-plane (blue) and out-of-plane (red) linearly polarized radiation are plotted in the top panels for the (LuFeO3)9/(LuFe2O4)1 (a) and (LuFeO3)1/(LuFe2O4)3
(b) superlattices at 300 K. The difference between the normalized spectra (black, bottom panels) is also plotted for each case. For the (LuFeO3)9/(LuFe2O4)1 sample, the peak dichroism is about 40% whereas the peak dichroism is only about 20% for the (LuFeO3)1/(LuFe2O4)3 superlattice.
690 700 710 720 730 740
690 700 710 720 730 740-60
-40
-20
0
20
40
690 700 710 720 730 740Energy (eV)
690 700 710 720 730 740-60
-40
-20
0
20
40
Inte
nsity
(a.u
.)D
ichr
oism
(%)
aIn-plane Out-of-plane
Energy (eV)
(LuFeO3)9/(LuFe2O4)1
Inte
nsity
(a.u
.)D
ichr
oism
(%)
Energy (eV)
bIn-plane Out-of-plane
Energy (eV)
(LuFeO3)1/(LuFe2O4)3
© 2016 Macmillan Publishers Limited, part of Springer Nature. All rights reserved.

Letter reSeArCH
Extended Data Figure 8 | Exchange interactions in the COII structure of LuFe2O4. a, Schematic of the COII LuFe2O4 structure with intra-layer, inter-layer and in-plane interactions labelled. The Fe–O–Fe bond angles in the undistorted structure are indicated by the black arrows. The red arrows demonstrate the change to the bond angles as the distortions turn on. Lutetium, Fe3+, Fe2+ and oxygen are shown in turquoise, yellow, green
and brown, respectively. b, Calculated exchange interactions as a function of the lutetium distortion Q. Circles, squares and diamonds denote the DFT-estimated value of the exchange interactions between two Fe2+ spins, two Fe3+ spins and Fe2+–Fe3+ spins, respectively. We considered in-plane interactions, intra-bilayer interactions and the interaction between two FeO2 bilayers.
Jintra
Jin-plane LuFe2O4 (COII)
a
Jinter
In-plane
Intra-bilayer
Inter-bilayer
4
2
0 2
0
-2 2
0
-2 0 0.5 1 1.5
Ene
rgy
(meV
)
Q (arb. units)
Fe2+-Fe2+
Fe2+-Fe3+
Fe3+-Fe3+
b
© 2016 Macmillan Publishers Limited, part of Springer Nature. All rights reserved.

LetterreSeArCH
Extended Data Figure 9 | Spin configurations of the COI and COII structures of LuFe2O4. a, Left, calculated density of states (DOS) for LuFe2O4 with the COI magnetic ground state, along with the occupancy of the iron 3d channel. Upper and lower panels show the DOS for the Fe2+ and Fe3+ ions, respectively. Oxygen 2p states are plotted in each case. Right, the crystal field splitting from the trigonal bipyramid symmetry and occupancy of the iron 3d channel. b, Low-energy spin configurations of COI and COII states labelled with the corresponding magnetization.
Although the ground states of COI and COII have magnetizations of 0.5μB/Fe and 1.17μB/Fe, respectively, each has additional low-energy configurations with M ranging from 0μB/Fe to 1.17μB/Fe. Lutetium, Fe3+, Fe2+ and oxygen are shown in turquoise, yellow (spins in red), green (spins in blue) and brown, respectively. c, Low-energy spin configurations of hole-doped COI and COII states labelled with the corresponding magnetization.
Fe2+
Fe+3
-2
-1
0
1
2
-8 -6 -4 -2 0 2 4 6 8
DO
S (s
tate
s/ev
)
Energy (eV)
O-2pFe3+3-3dFe4+3-3d
O-2pFe1+2-3dFe1+2-3d
Energy (eV)
DO
S (s
tate
s/ev
)
0 2 4 6 8 10 12 14 16
Energy (meV/f.u.)
Spin Configurations: Hole Doping c
2 2
dxz dyz
dxy dx -y
d3z2
2 2
dxz dyz
dxy dx -y
d3z2
2
1
0
-1
-2-8 -6 -4 -2 0 2 4 6 8
1.17 μB/Fe10 meV/f.u.
0.0 μB/Fe12 meV/f.u.
0.5 μB/Fe0 meV/f.u.
0.0 μB/Fe4 meV/f.u.
Magn.:Energy:
COI
1.17 μB/Fe4 meV/f.u.
0.0 μB/Fe5 meV/f.u.
0.5 μB/Fe10 meV/f.u.
Magn.:Energy:
COI
0.5 μB/Fe 1.33 μB/Fe 1.17 μB/Fe 1.33 μB/Fe
a
0.0 μB/Fe16 meV/f.u.
COI COII
Hole Doping
Hole Doping
Spin Configurationsb
© 2016 Macmillan Publishers Limited, part of Springer Nature. All rights reserved.
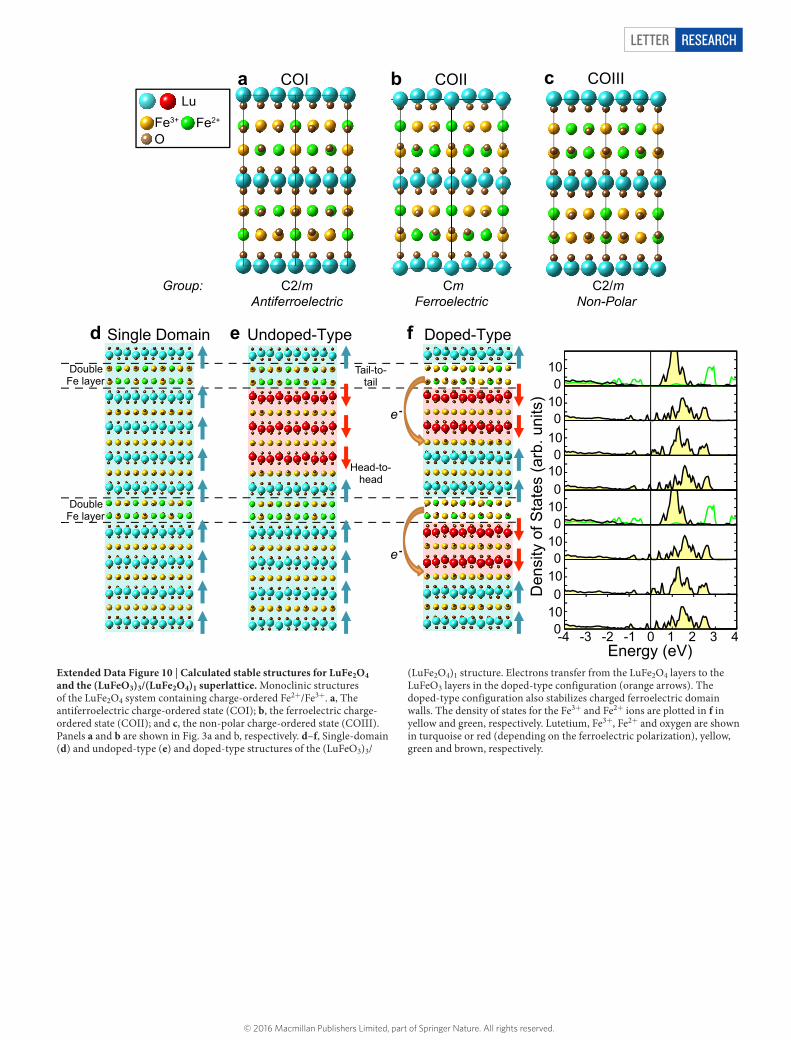
Letter reSeArCH
Extended Data Figure 10 | Calculated stable structures for LuFe2O4 and the (LuFeO3)3/(LuFe2O4)1 superlattice. Monoclinic structures of the LuFe2O4 system containing charge-ordered Fe2+/Fe3+. a, The antiferroelectric charge-ordered state (COI); b, the ferroelectric charge-ordered state (COII); and c, the non-polar charge-ordered state (COIII). Panels a and b are shown in Fig. 3a and b, respectively. d–f, Single-domain (d) and undoped-type (e) and doped-type structures of the (LuFeO3)3/
(LuFe2O4)1 structure. Electrons transfer from the LuFe2O4 layers to the LuFeO3 layers in the doped-type configuration (orange arrows). The doped-type configuration also stabilizes charged ferroelectric domain walls. The density of states for the Fe3+ and Fe2+ ions are plotted in f in yellow and green, respectively. Lutetium, Fe3+, Fe2+ and oxygen are shown in turquoise or red (depending on the ferroelectric polarization), yellow, green and brown, respectively.
LuFe2+Fe3+
O
b COII
Cm Ferroelectric
a COI
C2/mAntiferroelectric
c COIII
C2/m Non-Polar
Group:
0 1 2 3 4 -4 -3 -2 -1 0 10 0
10 0
10 0
10 0
10 0
10 0
10 0
10
Energy (eV)
Den
sity
of S
tate
s (a
rb. u
nits
)
Tail-to- tail
Head-to- head
e -
d
Double Fe layer
Double Fe layer
Single Domain e Undoped-Type f Doped-Type
e -
© 2016 Macmillan Publishers Limited, part of Springer Nature. All rights reserved.