atmospheric sulfur as related to acid precipitation and soil fertility1
TRANSCRIPT
DIVISION S-4—SOIL FERTILITY AND PLANTNUTRITION
Atmospheric Sulfur as Related to Acid Precipitation and Soil Fertility1
E. L. SUAREZ AND U. S. JONES2
ABSTRACTIn experiments conducted to determine the major acidic compo-
nents of precipitation in the southeastern United States, amounts ofsulfur (S) deposited on the soil with rainfall were estimated andrelationships between applied sulfur and crop yields in South Carolinawere established.
Precipitation was collected at three locations from 10 Apr. 1979to 8 Apr. 1980, at Clemson, S. C., Experiment, Ga., and Franklin,N. C., using a wet/dry collector. Conductivity, pH, and ionic com-ponents were determined in the rainfall and particulate matter. Sulfurin the air was collected at Clemson on a 30-d interval in a standardlead peroxide sampler. Soil samples were taken from 15 locations inSouth Carolina and analyzed for sulfur.
U was observed that the average loading concentration of anionsin rainwater increased during the spring-summer months and de-creased during the fall-winter months. Sulfuric and nitric acids werefound to be the major components of acid rainfall. Rainfall and airdeposition contributed approximately 10.7 and 1.8 kg/ha of sulfurper year, respectively, at Clemson. Atmospheric deposition from the
particulate matter contributed an estimated 3.0 kg/ha of sulfur duringthe year.
Increases in corn grain and silage yields were obtained with theapplication of 18 kg/ha of sulfur at Darlington, S. C. A relationshipbetween applied sulfur and crop response for the other crops con-sidered could not be established. A need for reevaluating the findingsand recommendations for sulfur fertilizers was apparent because ofthe contribution of atmospheric-deposited sulfur to the soil and plantsulfur supply.
Additional Index Words: acid rain, atmospheric deposition, atmo-spheric sulfur, mass loading rates.
Suarez, E. L., and U. S. Jones. 1982. Atmospheric sulfur as relatedto acid precipitation and soil fertility. Soil Sci. Soc. Am. J46:976-980.
1 Technical Contribution no. 1966 from the South Carolina Agric.Exp. Stn., Clemson University, Clemson, SC 29631. Received 4Sept. 1981. Approved 4 May 1982.
Instructor, Experimental Statistics Unit, and Professor, De-partment of Agronomy and Soils, respectively.
SUAREZ & JONES: ATMOSPHERIC s AS RELATED TO ACID PRECIPITATION AND SOIL FERTILITY 977
ACID PRECIPITATION has been defined as rain or snowwith pH values of < 5.6, which is the minimum
pH value expected for pure water in equilibrium withatmospheric carbon dioxide (CO2) at 25°C. That at-mospheric depositions of ions are constantly changingis clearly documented by Cogbill and Likens (1974)in the history and character of acid precipitation ineastern North America.
Various contaminants have always been present inthe atmosphere. Several of them, such as sulfur (S)and nitrogen (N) compounds, are present mostly ina partially oxidized state. A high oxidation state is thedistinguishing characteristic of acidic precipitation.
Experiments conducted to determine if S is one ofthe major contributors to acid rainfall have shown thatsignificant quantities of S are being added to the soilby dry deposition and precipitation. Sulfur dioxide(SO2) is also adsorbed on soil from the air. Depositedor adsorbed S, upon infiltration into soils, increasesthe hydrogen ion concentration by leaching calcium(Ca) and other essential plant nutrients from the soilprofile. On the other hand, S in the atmosphere cansupplement the soils' limited supplies of this nutrientelement.
In humid regions, ground limestone used to neu-tralize acidity in cultivated soils may overshadow acidprecipitation influences. In the same regions, how-ever, large areas of poorly buffered, unlimed, forestedsoils are significantly influenced by acid precipitationpercolating through the soil profile.
The objectives of this research were to determinethe time and space variations in the deposition ofatmospheric S and its contribution to plant-availablesupplies. The temporal and spatial variations consid-ered were those that have taken place in the south-eastern U.S. during 1979 to 1980.
MATERIALS AND METHODS
Short-term ExperimentsParticipate matter and precipitation were collected from
10 Apr. 1979 to 8 Apr. 1980 at three sites. At Clemson,S.C., the sampling device was located on the campus ofClemson University. The sampling site at Franklin, N.C.,was located 80 km northwest of Clemson. At Experiment,Ga., the sampler was located 51 km south of Atlanta and300 km from Clemson. The latter two stations, because ofthe geographic proximity to the main station at Clemson,provided means to corroborate the data. Each site wasequipped with one wet/dry collector manufactured by Aero-chem Metrics at Miami, Fla. The wet/dry collector containedtwo high-density polyethylene buckets with a capacity of13 L and an effective horizontal surface area of 638 cm2.One of these, the "dry bucket," was normally covered.During periods of precipitation a sensor activated a motorwhich moved the cover from the wet collector to the drycollector. When the sensor dried, the motor moved the coverback to the wet bucket. The wet bucket was changed onTuesday each week and the dry bucket on Tuesday every2 months. The buckets were weighed, and a 20-ml aliquotwas taken from the wet bucket for pH and conductivitymeasurements using a Markson Electromark Analyzer no.4403.
The buckets were sent to the Central Analytical Labo-ratory, Illinois State Water Survey, Champaign, 111., to de-termine the concentration of sodium (Na+), magnesium
(Mg2+), potassium (K+), and calcium (Ca2+) using absorp-tion spectroscopy, and ammonium (NH4
+), sulfate.(SO4~),nitrate (NO3~), chloride (Cl~), and phosphate (PO4
3~) usingwet chemical techniques with a Technicon Autoanalyzer.Correlations between each of the acidic components and thehydrogen ion (H+) concentration in rainfall were conductedto examine interrelationships.
Air samples were collected at Clemson from 1 Apr. 1970to 31 Mar. 1980. Sulfur in the air was determined in arepresentative sample collected in a standard lead peroxidesampler obtained from Research Appliance Co., Gibsonia,Pa. The sampler consisted of a cylinder wrapped with acotton fabric having a surface area of 100 cm and coatedwith a lead peroxide paste. The cylinders were exposedfreely to the air but were protected from rain by a cowl.After a 30-day exposure period, the fabric and coating wereremoved from the cylinder and the amount of S was de-termined by the turbidimetric barium sulfate method (lordanet al., 1959).
Long-term ExperimentsPrecipitation and air samples were collected from 1 lan.
1979 through 31 Dec. 1980 at 15 locations near Blackville,Cameron, Darlington, Clemson, Columbia, Wedgefield,Wateree, Fort Motte, Sumter, Saint Matthews, and Charles-ton, S.C. Sulfur in precipitation was determined in a rep-resentative sample collected in a standard 3-L plastic bucket,20 cm in diameter and 180 cm above ground, with a metalring to protect the rainwater collected from pollution bybirds (lones and Suarez, 1980). After a 30-d exposure period,the entire quantity of water was taken from the bucket,screened through a 20-mesh sieve, and evaporated to dry-ness in a S-free hood. The residue was taken up in a solutionof 0.5N NH4C2H3O2 in 0.25N CH3COOH, filtered, andwashed. Sulfur was precipitated and determined colorimet-rically with methylene blue (Lazrus et al., 1965). The airsamples were collected, and S was determined in the samefashion as for the short-term experiment explained above.
Uniform field experiments were conducted from 1973 to1980 with 'Keowee' barley (Hordeum vulgare L.) on Cecilsandy loam near Clemson; with 'Purple Top' turnip (Bras-sica rapa L.) and 'Miami' snapbean (Phaseolus vulgaris L.)on Lakeland sand near Columbia; with 'Walter' tomato(Lycopersicon esculentum Milli.) on a Wagram loamy sandnear Columbia; with 'Davis' soybean (Glycine max L.),'Silver Queen' sweet corn (Zea mays L.), and 'Ashley'cucumber (Cucumis cativus L.) on Marlboro loamy sandnear Blackville; and with 'S.C. 236' field corn (Zea maysL.) on Norfolk loamy sand near Darlington. The basic fer-tilizer, 27-4-15 manufactured from urea-ammonium phos-phate and muriate potash, contained S-free materials. SoilpH was maintained about 6.0 by the use of Ca(OH)2.
Treatments consisted of 0, 9, 18, and 36 kg/ha of S broad-cast as CaSO4-2H2O, 18 kg/ha S and 14 kg/ha of Mg asMgSO4-7H2O and 14 kg/ha of Mg as CaMg(CO3)2 replicatedfive times in a randomized, complete block design. Thetreatments were repeated on the same plots during succes-sive years. Plot size was 41 m2 for soybean, sweet corn,and cucumber, 49 m2 for field corn, 5.5 m for turnip, tomato,and snapbean, and 18.6 m2 for barley. Cecil sandy loam isa clayey, kaolinitic, thermic Typic Hapludult (CIC). Wagramloamy sand is a loamy, siliceous, thermic Arenic Paleudult(WgB). Marlboro loamy sand is a clayey, kaolinitic, thermicPaleudult (MbA). Lakeland sand is a thermic, coated TypicQuartzipsamment (LaB), and Norfolk loamy sand is a fine-loamy, siliceous, thermic Typic Paleudult (NoB).
Soil samples were taken for the 1973-1980 experimentswith a hand post-hole digger at the 0 to 15, 15 to 30, and30 to 45-cm depths. Five grams of soil were extracted with20 ml of 0.5N NH4C2H3O2 in 0.25N CH3COOH by shaking
978 SOIL SCI. SOC. AM. J., VOL. 46, 1982
for 5 min. About 0.2 g of charcoal was added and the extractwas filtered. Sulfur was precipitated as BaSO4 by seedingwith a BaSO4 solution. After 5 min, the BaSO4 concentrationwas estimated employing the standard turbidimetric methodby reading on a spectrophotometer at 420 nm (Jordan et al.,1959).
RESULTS AND DISCUSSIONShort-term Experiments
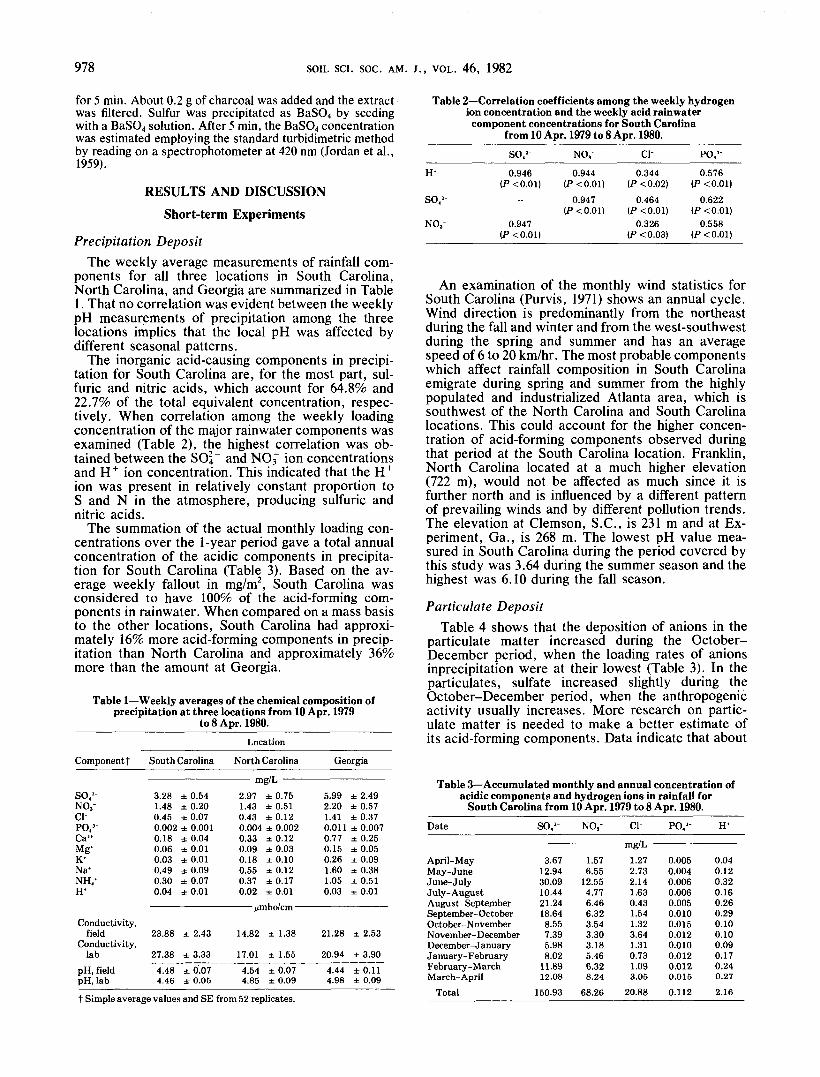
Precipitation DepositThe weekly average measurements of rainfall com-
ponents for all three locations in South Carolina,North Carolina, and Georgia are summarized in Table1. That no correlation was evident between the weeklypH measurements of precipitation among the threelocations implies that the local pH was affected bydifferent seasonal patterns.
The inorganic acid-causing components in precipi-tation for South Carolina are, for the most part, sul-furic and nitric acids, which account for 64.8% and22.7% of the total equivalent concentration, respec-tively. When correlation among the weekly loadingconcentration of the major rainwater components wasexamined (Table 2), the highest correlation was ob-tained between the SOl~ and NO3~ ion concentrationsand H+ ion concentration. This indicated that the H+
ion was present in relatively constant proportion toS and N in the atmosphere, producing sulfuric andnitric acids.
The summation of the actual monthly loading con-centrations over the 1-year period gave a total annualconcentration of the acidic components in precipita-tion for South Carolina (Table 3). Based on the av-erage weekly fallout in mg/m2, South Carolina wasconsidered to have 100% of the acid-forming com-ponents in rainwater. When compared on a mass basisto the other locations, South Carolina had approxi-mately 16% more acid-forming components in precip-itation than North Carolina and approximately 36%more than the amount at Georgia.
Table 1—Weekly averages of the chemical composition ofprecipitation at three locations from 10 Apr. 1979
to 8 Apr. 1980.
Table 2—Correlation coefficients among the weekly hydrogenion concentration and the weekly acid rainwatercomponent concentrations for South Carolina
from 10 Apr. 1979 to 8 Apr. 1980.
Location
Component t
S04!-
NOrci-P04
3-Ca"Mg*K*Na*NH4*H*
Conductivity,field
Conductivity,lab
pH, fieldpH, lab
South Carolina
3.281.480.450.0020.180.060.030.490.300.04
± 0.54± 0.20± 0.07± 0.001± 0.04± 0.01± 0.01±0.09± 0.07±0.01
North Carolina
2.971.430.430.0040.330.090.180.550.37
g/I±±±±±±±±±
0.750.510.120.0020.120.030.100.120.17
0.02 ± 0.01
Georgia
5.992.201.410.0110.770.150.261.601.050.03
±
±±±±±±±±±
2.490.570.370.0070.250.050.090.380.510.01
23.88
27.384.484.46
± 2.43
± 3.33
± 0.07± 0.05
14.82
17.01
4.544.85
±
±±±
1.38
1.55
0.070.09
21.28
20.944.444.98
±
±±±
2.53
3.90
0.110.09
H'
so,!-NO,-
so4>-0.946
0.947
NO,-
0.944
0.947tP<0.01)
ci-0.344
(P <0.02)0.464
(P<0.01)0.326
(P <0.03)
PO43-
0.576(P<0.01)
0.622(P<0.01)
0.558
An examination of the monthly wind statistics forSouth Carolina (Purvis, 1971) shows an annual cycle.Wind direction is predominantly from the northeastduring the fall and winter and from the west-southwestduring the spring and summer and has an averagespeed of 6 to 20 km/hr. The most probable componentswhich affect rainfall composition in South Carolinaemigrate during spring and summer from the highlypopulated and industrialized Atlanta area, which issouthwest of the North Carolina and South Carolinalocations. This could account for the higher concen-tration of acid-forming components observed duringthat period at the South Carolina location. Franklin,North Carolina located at a much higher elevation(722 m), would not be affected as much since it isfurther north and is influenced by a different patternof prevailing winds and by different pollution trends.The elevation at Clemson, S.C., is 231 m and at Ex-periment, Ga., is 268 m. The lowest pH value mea-sured in South Carolina during the period covered bythis study was 3.64 during the summer season and thehighest was 6.10 during the fall season.
Paniculate DepositTable 4 shows that the deposition of anions in the
particulate matter increased during the October-December period, when the loading rates of anionsinprecipitation were at their lowest (Table 3). In theparticulates, sulfate increased slightly during theOctober-December period, when the anthropogenicactivity usually increases. More research on partic-ulate matter is needed to make a better estimate ofits acid-forming components. Data indicate that about
Table 3—Accumulated monthly and annual concentration ofacidic components and hydrogen ions in rainfall for
South Carolina from 10 Apr. 1979 to 8 Apr. 1980.
t Simple average values and SE from 52 replicates.
Date
April-MayMay-JuneJune-JulyJuly-AugustAugust-SeptemberSeptember-OctoberOctober-NovemberNovember-DecemberDecember-JanuaryJanuary-FebruaryFebruary-MarchMarch- April
Total
so42-
3.6712.9430.0910.4421.2418.648.557.395.988.02
11.8912.08
150.93
NOS-
1.576.55
12.554.776.466.323.543.303.185.466.328.24
68.26
ci-- mg/L -
1.272.732.141.630.431.541.323.641.310.731.093.05
20.88
P043-
0.0050.0040.0060.0060.0050.0100.0150.0120.0100.0120.0120.0150.112
H*
0.040.120.320.160.260.290.100.100.090.170.240.27
2.16
SUAREZ & JONES: ATMOSPHERIC s AS RELATED TO ACID PRECIPITATION AND SOIL FERTILITY 979
Table 4—Particulate matter chemical analysis for South Carolina from 3 Apr. 1979 to 4 Dec. 1979.
Deposition
Date Ca" Mg" Na* NH,* NO,'- ci- so,2- PO43
April-JuneJune-AugustAugust-OctoberOctober-DecemberAccumulated total
18.8918.6010.1628.9876.63
5.522.821.39
17.0126.74
17.764.002.20
44.7368.69
12.099.02
12.0989.01
122.21
9.50 35.727.18 1.106.81 3.50
50.85 79.5674.34 119.88
3.310.480.92
162.99167.70
97.22114.9073.28
280.44565.84
11.970.090.01
27.2739.34
0.100.120.010.540.77
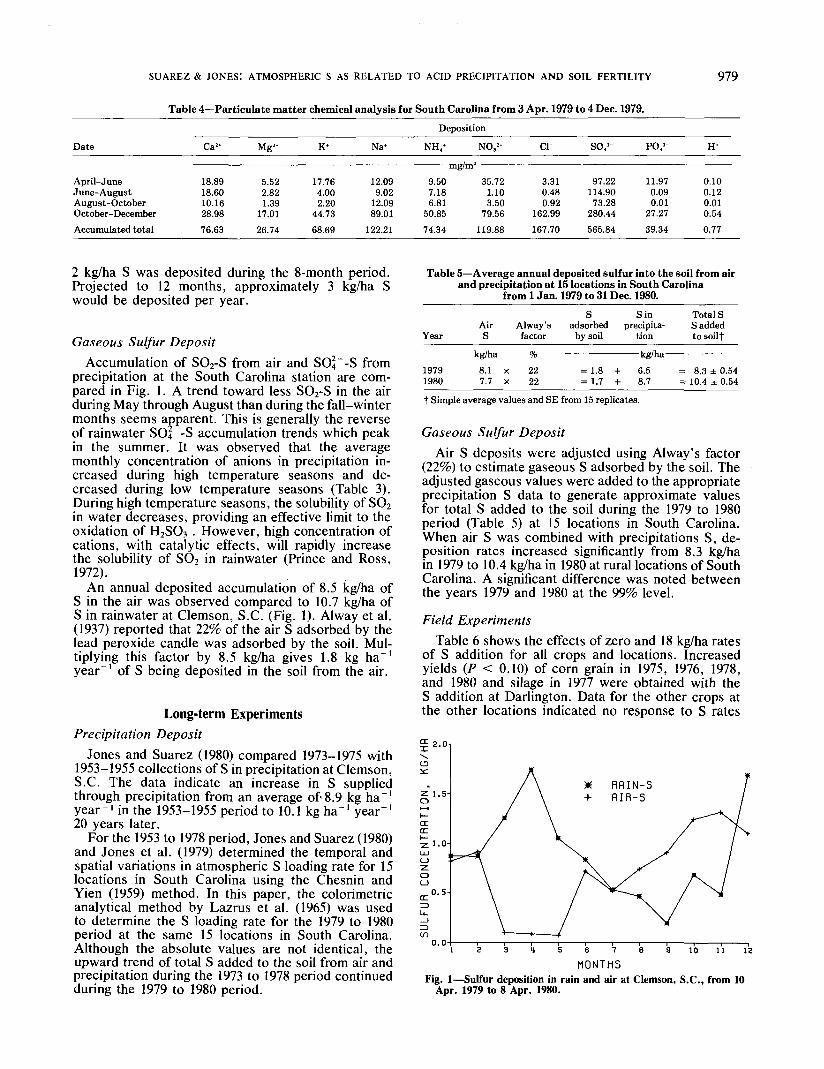
2 kg/ha S was deposited during the 8-month period.Projected to 12 months, approximately 3 kg/ha Swould be deposited per year.
Gaseous Sulfur DepositAccumulation of SO2-S from air and SC>4~-S from
precipitation at the South Carolina station are com-pared in Fig. 1. A trend toward less SO2-S in the airduring May through August than during the fall-wintermonths seems apparent. This is generally the reverseof rainwater SO4 ~-S accumulation trends which peakin the summer. It was observed that the averagemonthly concentration of anions in precipitation in-creased during high temperature seasons and de-creased during low temperature seasons (Table 3).During high temperature seasons, the solubility of SO2in water decreases ̂ providing an effective limit to theoxidation of H2SO3~. However, high concentration ofcations, with catalytic effects, will rapidly increasethe solubility of SO2 in rainwater (Prince and Ross,1972).
An annual deposited accumulation of 8.5 kg/ha ofS in the air was observed compared to 10.7 kg/ha ofS in rainwater at Clemson, S.C. (Fig. 1). Alway et al.(1937) reported that 22% of the air S adsorbed by thelead peroxide candle was adsorbed by the soil. Mul-tiplying this factor by 8.5 kg/ha gives 1.8 kg ha~'year"1 of S being deposited in the soil from the air.
Long-term ExperimentsPrecipitation Deposit
Jones and Suarez (1980) compared 1973-1975 with1953-1955 collections of S in precipitation at Clemson,S.C. The data indicate an increase in S suppliedthrough precipitation from an average of• 8.9 kg ha ~'year-' in the 1953-1955 period to 10.1 kg ha"1 year'120 years later.
For the 1953 to 1978 period, Jones and Suarez (1980)and Jones et al. (1979) determined the temporal andspatial variations in atmospheric S loading rate for 15locations in South Carolina using the Chesnin andYien (1959) method. In this paper, the colorimetricanalytical method by Lazrus et al. (1965) was usedto determine the S loading rate for the 1979 to 1980period at the same 15 locations in South Carolina.Although the absolute values are not identical, theupward trend of total S added to the soil from air andprecipitation during the 1973 to 1978 period continuedduring the 1979 to 1980 period.
Table 5—Average annual deposited sulfur into the soil from airand precipitation at 15 locations in South Carolina
from 1 Jan. 1979 to 31 Dec. 1980.
Year
19791980
AirS
kg/ha8.1 x7.7 X
Alway'sfactor
%2222
Sadsorbed
by soil
= 1.8= 1.7
Sinprecipita-
tion
+ 6.5+ 8.7
Total SS addedto soilf
= 8.3 ± 0.54= 10.4 ± 0.54
t Simple average values and SE from 15 replicates.
Gaseous Sulfur DepositAir S deposits were adjusted using Alway's factor
(22%) to estimate gaseous S adsorbed by the soil. Theadjusted gaseous values were added to the appropriateprecipitation S data to generate approximate valuesfor total S added to the soil during the 1979 to 1980period (Table 5) at 15 locations in South Carolina.When air S was combined with precipitations S, de-position rates increased significantly from 8.3 kg/hain 1979 to 10.4 kg/ha in 1980 at rural locations of SouthCarolina. A significant difference was noted betweenthe years 1979 and 1980 at the 99% level.
Field ExperimentsTable 6 shows the effects of zero and 18 kg/ha rates
of S addition for all crops and locations. Increasedyields (P < 0.10) of corn grain in 1975, 1976, 1978,and 1980 and silage in 1977 were obtained with theS addition at Darlington. Data for the other crops atthe other locations indicated no response to S rates
£2.01
1.5-
cnDC
• 1 . f l -
eaCJ
.0.5-
1 2 3 U S 6 7 8 9 10 11 12
MONTHSFig. 1—Sulfur deposition in rain and air at Clemson, S.C., from 10
Apr. 1979 to 8 Apr. 1980.
980 SOIL SCI. SOC. AM. J., VOL. 46, 1982
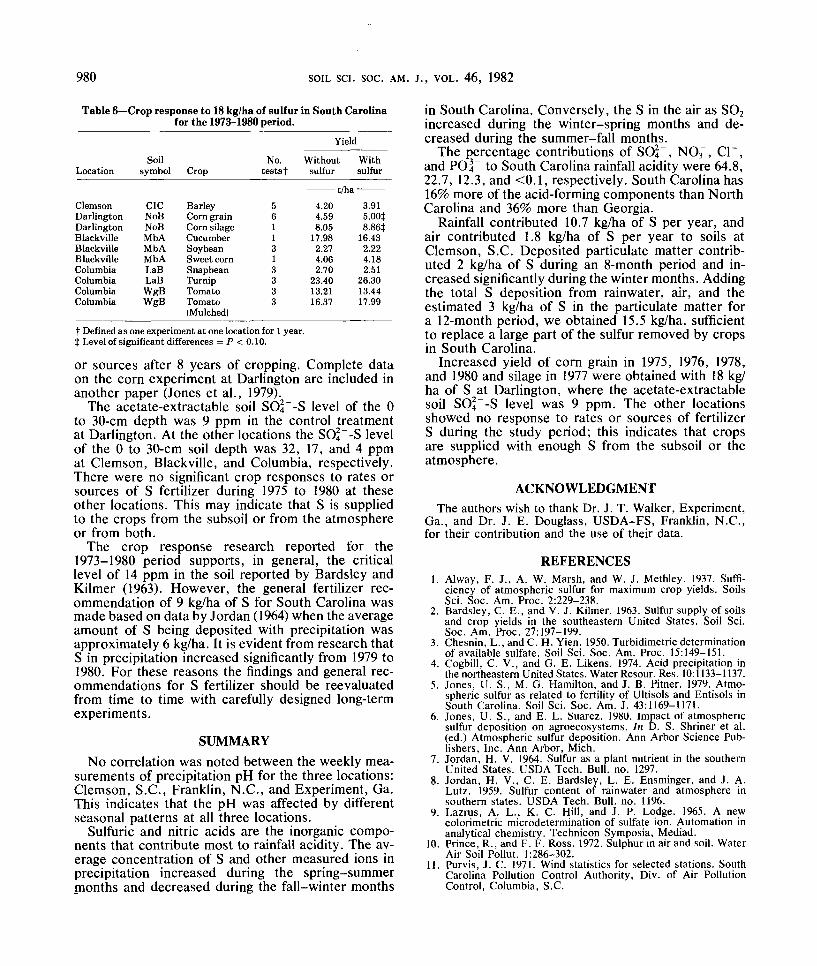
Table 6—Crop response to 18 kg/ha of sulfur in South Carolina____________for the 1973-1980 period.____________
Yield
Location
ClemsonDarlingtonDarlingtonBlackvilleBlackvilleBlackvilleColumbiaColumbiaColumbiaColumbia
Soilsymbol
CICNoBNoBMbAMbAMbALaBLaBWgBWgB
Crop
BarleyCorn grainCorn silageCucumberSoybeanSweet cornSnapbeanTurnipTomatoTomato(Mulched)
No.testsf
5611313333
Withoutsulfur
———— t/ha4.204.598.05
17.982.274.062.70
23.4013.2116.37
Withsulfur
3.915.00J8.86J
16.432.224.182.51
26.3013.4417.99
t Defined as one experiment at one location for 1 year.J Level of significant differences = P < 0.10.
or sources after 8 years of cropping. Complete dataon the corn experiment at Darlington are included inanother paper (Jones et al., 1979).
The acetate-extractable soil SO4~-S level of the 0to 30-cm depth was 9 ppm in the control treatmentat Darlington. At the other locations the 804~-S levelof the 0 to 30-cm soil depth was 32, 17, and 4 ppmat Clemson, Blackville, and Columbia, respectively.There were no significant crop responses to rates orsources of S fertilizer during 1975 to 1980 at theseother locations. This may indicate that S is suppliedto the crops from the subsoil or from the atmosphereor from both.
The crop response research reported for the1973-1980 period supports, in general, the criticallevel of 14 ppm in the soil reported by Bardsley andKilmer (1963). However, the general fertilizer rec-ommendation of 9 kg/ha of S for South Carolina wasmade based on data by Jordan (1964) when the averageamount of S being deposited with precipitation wasapproximately 6 kg/ha. It is evident from research thatS in precipitation increased significantly from 1979 to1980. For these reasons the findings and general rec-ommendations for S fertilizer should be reevaluatedfrom time to time with carefully designed long-termexperiments.
SUMMARYNo correlation was noted between the weekly mea-
surements of precipitation pH for the three locations:Clemson, S.C., Franklin, N.C., and Experiment, Ga.This indicates that the pH was affected by differentseasonal patterns at all three locations.
Sulfuric and nitric acids are the inorganic compo-nents that contribute most to rainfall acidity. The av-erage concentration of S and other measured ions inprecipitation increased during the spring-summermonths and decreased during the fall-winter months
in South Carolina. Conversely, the S in the air as SO2increased during the winter-spring months and de-creased during the summer-fall months.
The percentage contributions of SO^, NO3~, Cl~,and PO4~ to South Carolina rainfall acidity were 64.8,22.7, 12.3, and <0.1, respectively. South Carolina has16% more of the acid-forming components than NorthCarolina and 36% more than Georgia.
Rainfall contributed 10.7 kg/ha of S per year, andair contributed 1.8 kg/ha of S per year to soils atClemson, S.C. Deposited particulate matter contrib-uted 2 kg/ha of S during an 8-month period and in-creased significantly during the winter months. Addingthe total S deposition from rainwater, air, and theestimated 3 kg/ha of S in the particulate matter fora 12-month period, we obtained 15.5 kg/ha, sufficientto replace a large part of the sulfur removed by cropsin South Carolina.
Increased yield of corn grain in 1975, 1976, 1978,and 1980 and silage in 1977 were obtained with 18 kg/ha of S at Darlington, where the acetate-extractablesoil SOi~-S level was 9 ppm. The other locationsshowed no response to rates or sources of fertilizerS during the study period; this indicates that cropsare supplied with enough S from the subsoil or theatmosphere.
ACKNOWLEDGMENTThe authors wish to thank Dr. J. T. Walker, Experiment,
Ga., and Dr. J. E. Douglass, USDA-FS, Franklin, N.C.,for their contribution and the use of their data.