atmospheric deposition and canopy exchange processes in alpine forest ecosystems (northern italy)
TRANSCRIPT
Atmospheric Environment 35 (2001) 6421–6433
Atmospheric deposition and canopy exchange processes inalpine forest ecosystems (northern Italy)
Raffaella Balestrinia,*, Antonio Tagliaferrib
aWater Research Institute (IRSA- CNR), via della Mornera 25, 20047 Brugherio, ItalybRegional Forestry Board, via Ponchielli 2/4, 20129, Italy
Received 21 March 2001; received in revised form 9 June 2001; accepted 22 June 2001
Abstract
Throughfall and bulk precipitation chemistry were studied for five years (June 1994–May 1999) at two high elevationforest sites (Val Gerola and Val Masino) which were known to differ in terms of tree health, as assessed by live crowncondition. The ion concentration of bulk precipitation samples did not differ significantly between sites, except forMg2+, while the throughfall concentrations differed in the measured values of H+, N-NO3
�, Cl�, Na+, K+, DOC and
weak organic acids. The results of the application of the canopy exchange model indicated a higher contribution fromthe dry deposition of N-NO3
�, N-NH4+ and H+ at Val Gerola, where the damage symptoms were more evident. In
addition, the canopy leaching of Ca2+, K+ and weak organic acids were 47%, 21% and 27% higher at Val Gerola than
at Val Masino. Annual SO42� deposition fluxes (21.3 kg ha�1 yr�1 at Val Masino and 23.6 kg ha�1 yr�1 at Val Gerola)
were similar to those reported for moderately polluted European and U.S. sites. Annual N loads were 13.6 and13.1 kg ha�1 yr�1 in the bulk input, and 15.0 and 18.0 kg ha�1 yr�1 in throughfall inputs, at Val Masino and Val Gerola,
respectively. The contribution of the organic fraction to the total N atmospheric deposition load is significant,constituting 17% of the bulk flux and 40% of the throughfall flux. Measured nitrogen loads exceed the critical nutrientloads by several kgNha�1 at both stations. In particular the nitrogen throughfall load at Val Gerola was about 3 times
higher than the critical values. r 2001 Elsevier Science Ltd. All rights reserved.
Keywords: Throughfall; Dry deposition; Leaching; Canopy exchange model; Critical loads
1. Introduction
More than 85% of the forest ecosystems in Lombardy(northern Italy) are located in alpine and subalpineareas. Forest surveys conducted by the Regional
Forestry Board, during 1995–1999, at 122 sites inLombardy, revealed that about 80% of the mostcommon tree species (Fagus sylvatica, Ostrya carpinifo-
lia, Quercus peduncolata, Picea abies, Larix decidua andPinus sylvestris) had damaged crowns, on the basis oftransparency data (Azienda Regionale delle Foreste,
1998). In most cases, the visible injury symptoms cannot
be explained by specific factors (pest infestations, fungiattacks, etc.), but are ascribed to unknown agents and
related to the general phenomenon of ‘‘novel forestdecline’’.
The indirect adverse impact of nitrogen and sulphur
deposition on forest ecosystems is one of the hypothesesproposed to explain forest decline. The mechanisms offorest ecosystem response to these stresses include the
loss of base cations from the soil, the release of toxicaluminium and a decrease in soil pH, which may causenutrient deficiency and aggravate natural stress. Ex-
cessive nitrogen input leads to a state of eutrophicationcausing damage to trees. High N loading favours growthof canopy biomass and, consequently, increases thedemand of water and base cations (Ca, Mg, K) which
cannot be sustained by the system (Aber et al., 1989).*Corresponding author. Fax: +39-3920-04692.
E-mail address: [email protected] (R. Balestrini).
1352-2310/01/$ - see front matter r 2001 Elsevier Science Ltd. All rights reserved.
PII: S 1 3 5 2 - 2 3 1 0 ( 0 1 ) 0 0 3 5 0 - 8
Excess nitrogen can also decrease biodiversity in aquaticand terrestrial ecosystems (Bobbink et al., 1998) and
pollute groundwater (Traaen and Stoddard, 1995).The atmospheric species are transferred to the
terrestrial and aquatic ecosystems by dry deposition,
wet deposition, cloud and fog deposition. Due to thedifficulty in measuring dry deposition inputs, particu-larly in areas with complex orography, throughfallmeasurements are often used to estimate total atmo-
spheric deposition to forest. There are uncertaintiesrelated to this approach, in particular the effects of thecanopy interaction processes, such as leaching and
uptake at leaf surfaces are not easily distinguished fromthe washoff of dry deposition. Methods to separate thecontribution of dry deposition from the leaching
associated with throughfall measurements have beenattempted by several authors (Ulrich and Pankrath,1983; Lakhani and Miller, 1980; Lovett and Lindberg,
1984; Beier et al., 1992); however, for some species suchas nitrate, the mechanisms are still unresolved.
This paper presents data from a five-year study ofthroughfall and bulk precipitation at two alpine sites
located about 100 km from the most highly industria-lised area of the Po Valley. This study is part of amultidisciplinary project aimed at the evaluation of the
interactions between environmental stress and forestdecline in forest ecosystems in Lombardy. The objectivesof the study were: (1) to use precipitation and through-
fall chemistry data to compare two forest stands knownto have different levels of damage, as indicated by crowntransparency and other parameters; (2) to evaluate thecapacity of the canopies for filtering dry deposition and
to assess the foliar leaching entity, (3) to quantify and tocompare the total annual deposition load of N and S tothe Italian critical load map, which provides data at the
50� 50 km2 scale to be used for critical load calculations(Posch et al., 1997).
2. Material and methods
2.1. Study sites
The study areas, Val Masino (4611401900N, 913504000E)
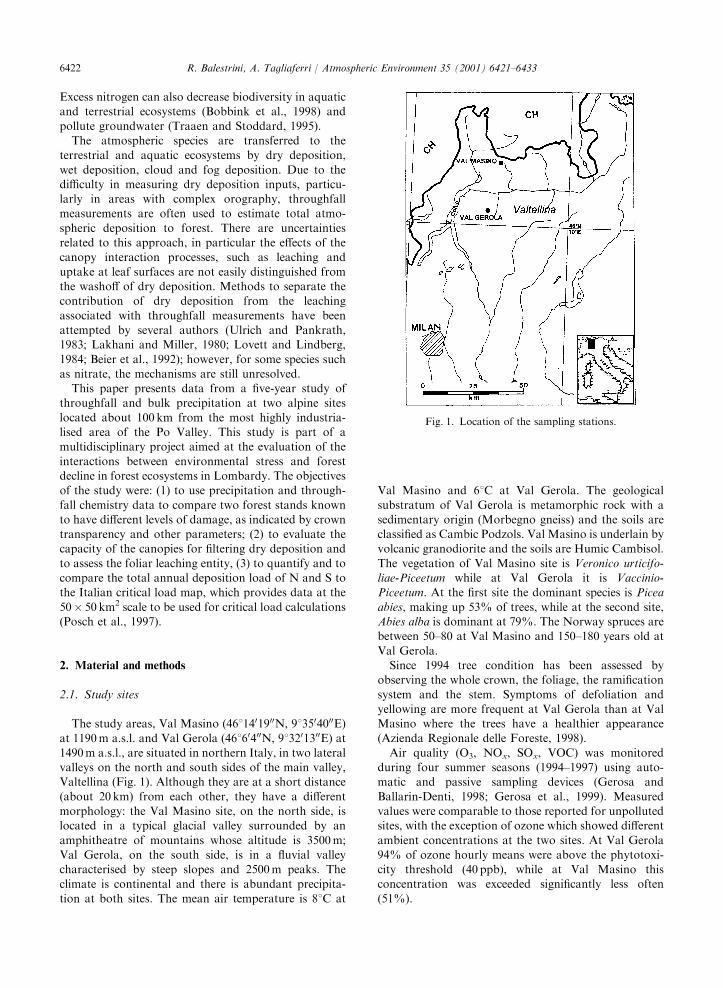
at 1190m a.s.l. and Val Gerola (46160400N, 913201300E) at1490m a.s.l., are situated in northern Italy, in two lateralvalleys on the north and south sides of the main valley,Valtellina (Fig. 1). Although they are at a short distance
(about 20 km) from each other, they have a differentmorphology: the Val Masino site, on the north side, islocated in a typical glacial valley surrounded by an
amphitheatre of mountains whose altitude is 3500m;Val Gerola, on the south side, is in a fluvial valleycharacterised by steep slopes and 2500m peaks. The
climate is continental and there is abundant precipita-tion at both sites. The mean air temperature is 81C at
Val Masino and 61C at Val Gerola. The geological
substratum of Val Gerola is metamorphic rock with asedimentary origin (Morbegno gneiss) and the soils areclassified as Cambic Podzols. Val Masino is underlain byvolcanic granodiorite and the soils are Humic Cambisol.
The vegetation of Val Masino site is Veronico urticifo-liae-Piceetum while at Val Gerola it is Vaccinio-Piceetum. At the first site the dominant species is Picea
abies, making up 53% of trees, while at the second site,Abies alba is dominant at 79%. The Norway spruces arebetween 50–80 at Val Masino and 150–180 years old at
Val Gerola.Since 1994 tree condition has been assessed by
observing the whole crown, the foliage, the ramification
system and the stem. Symptoms of defoliation andyellowing are more frequent at Val Gerola than at ValMasino where the trees have a healthier appearance(Azienda Regionale delle Foreste, 1998).
Air quality (O3, NOx, SOx, VOC) was monitoredduring four summer seasons (1994–1997) using auto-matic and passive sampling devices (Gerosa and
Ballarin-Denti, 1998; Gerosa et al., 1999). Measuredvalues were comparable to those reported for unpollutedsites, with the exception of ozone which showed different
ambient concentrations at the two sites. At Val Gerola94% of ozone hourly means were above the phytotoxi-city threshold (40 ppb), while at Val Masino thisconcentration was exceeded significantly less often
(51%).
Fig. 1. Location of the sampling stations.
R. Balestrini, A. Tagliaferri / Atmospheric Environment 35 (2001) 6421–64336422
2.2. Rainfall and throughfall measurements
From June 1994 to May 1996, each throughfall studyarea consisted of a 50� 50m2 plot. Fifteen throughfallpolyethylene samplers (9 cm diameter) were placed
10–15m from each other, avoiding clearings and tracks.In order to standardise our methods to internationalprocedures (ICP-Forest, 1998), from June 1996 to May1999, we reduced the number of throughfall samplers to
9, and located them systematically, within a 30� 30m2
subplot. Each new collector consisted of an 18 cmpolyethylene funnel fitted onto a 5 l polyethylene bucket.
Bulk precipitation for each site was collected using a33.5 cm polyethylene funnel fitted on a 15 l polyethylenebucket that was in each case installed in a nearby
clearing. Both bulk precipitation and throughfallsamplers were equipped with plastic nets to preventbirds from alighting. During the winter months
(December–March/April) snow samples were collectedby using larger buckets (21 cm diameter for throughfalland 39.4 cm diameter for the bulk).
Weekly bulk and pooled throughfall samples were
combined proportionally into biweekly samples whichwere filtered through 0.40 mm nuclepore membranes.The alkalinity of samples with pH>5.6 was measured
by two-endpoint potentiometric titration with HCl.N-NH4
+ was analysed by molecular absorption spectro-metry using the indophenol-blue method. Conductivity
and pH (at 201C) were measured in the unfilteredsolutions. Samples were then stored at 41C in the darkpending analyses of the anions and other cations,performed usually within a week of collection. N-
NO3�, SO4
2� and Cl� were determined by ion chromato-graphy using a Dionex 2000i equipped with an AS4Acolumn. The eluent was 1.8mM Na2CO3+1.7mM
NaHCO3. Ca2+, Mg2+, Na+ and K+ were measuredby a Dionex 4500i ion chromatograph with a CS12column and 2 mM CH3SO3 H as eluent. Total phos-
phorus (TP) and total nitrogen (TN) were measured inunfiltered samples using molecular absorption spectro-metry, after persulphate digestion in an autoclave at
1201C. The total organic nitrogen (TON) was estimatedfrom the difference between TN and inorganic nitrogen(N-NH4 plus N-NO3). Dissolved organic carbon (DOC)was assayed by high-temperature catalytic oxidation
using a Shimadzu TOC-5000 A analyser. The differencebetween cations and anions was assumed to be anestimation of weak organic acids (w.a.) (Hoffman et al.,
1980).Repeatability was checked by replicated analysis
(n ¼ 5) of rain samples at different concentrations. The
results showed that the repeatability for N-NH4+, Ca2+,
Mg2+, Na+, SO42� was o2%, for N-NO3
� and Cl� itwas 3%, and for K+ it was 6%. The quality of the
analytical data was checked by comparing the measuredconductivity with the conductivity calculated from the
concentration of all measured ions and their specificconductivities, according to the ICP-Forest manual
(1998). If the differences were less than 10% weconsidered that all the major ions had been analysed.The measured conductivities were in excellent agreement
with the calculated conductivities for both wet andthroughfall samples as indicated by high linear correla-tion coefficients, r2; that were 0.956 and 0.978, respec-tively, for bulk precipitation and throughfall. Additional
quality control was undertaken as part of AnalyticalQuality Control and Assessment Studies in the Medi-terranean Basin (AQUACON), an international com-
parison project employing artificial rainwater samples(Mosello et al., 1998). All analyses were in satisfactoryagreement with the quoted values of the artificial
samples.
3. Results and discussion
3.1. Volumes of precipitation
The rainfall amount was relatively variable from yearto year at both sites with a minimum value in 1995–1996and a maximum in 1996–1997 (Table 1). The meanannual rainfall for the study period was considerably
higher than the 50-year (1920–1970) means at both sites,and showed slight differences between the samplingsites: the precipitation at Val Gerola being about 10%
lower than that at Val Masino. The precipitation inputwas snow during the November–April period. Annualsnow made up 22% of the precipitation total, at both
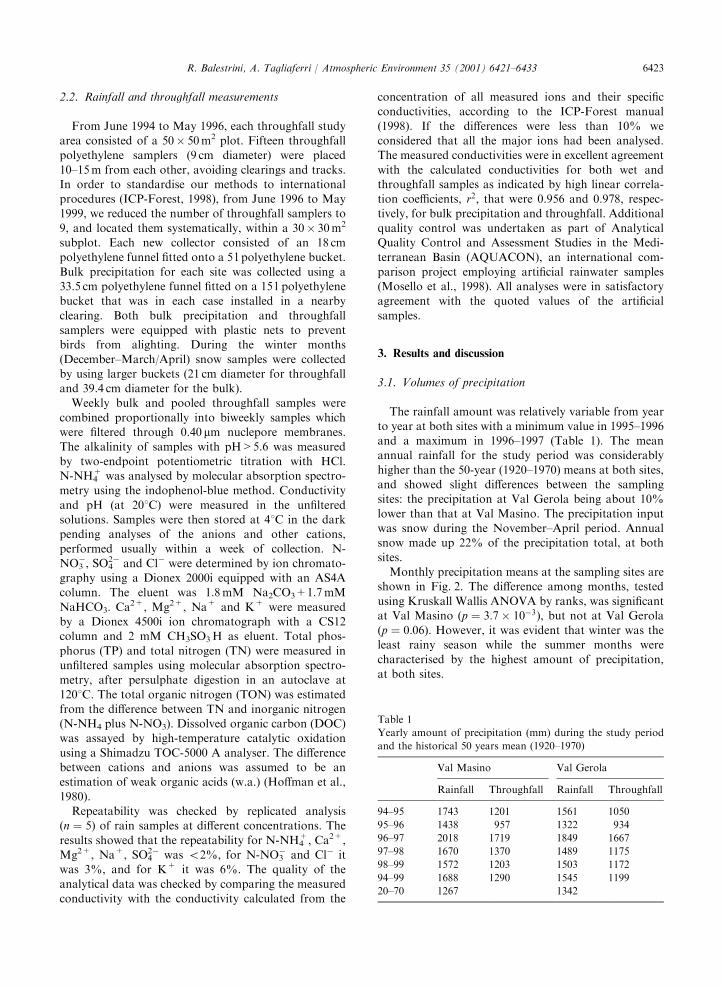
sites.Monthly precipitation means at the sampling sites are
shown in Fig. 2. The difference among months, tested
using Kruskall Wallis ANOVA by ranks, was significantat Val Masino (p ¼ 3:7� 10�3), but not at Val Gerola(p ¼ 0:06). However, it was evident that winter was theleast rainy season while the summer months were
characterised by the highest amount of precipitation,at both sites.
Table 1
Yearly amount of precipitation (mm) during the study period
and the historical 50 years mean (1920–1970)
Val Masino Val Gerola
Rainfall Throughfall Rainfall Throughfall
94–95 1743 1201 1561 1050
95–96 1438 957 1322 934
96–97 2018 1719 1849 1667
97–98 1670 1370 1489 1175
98–99 1572 1203 1503 1172
94–99 1688 1290 1545 1199
20–70 1267 1342
R. Balestrini, A. Tagliaferri / Atmospheric Environment 35 (2001) 6421–6433 6423
The throughfall volumes were 76% and 78% of therainfall volumes, respectively, at Val Masino and Val
Gerola. Only a small number of events (8 of 104 and 4 of110 at Val Gerola and Val Masino, respectively) havethroughfall precipitation higher than bulk precipitation.This suggests that direct input of cloud water by
interception of fog is not an important water sourcefor these forests.
3.2. Chemistry
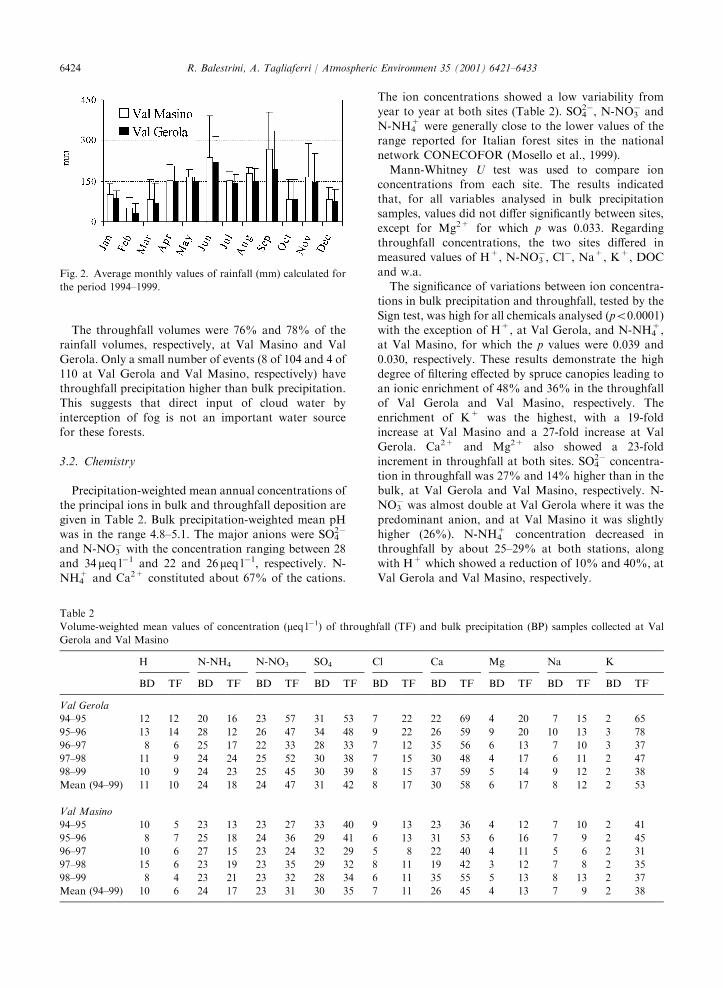
Precipitation-weighted mean annual concentrations ofthe principal ions in bulk and throughfall deposition aregiven in Table 2. Bulk precipitation-weighted mean pH
was in the range 4.8–5.1. The major anions were SO42�
and N-NO3� with the concentration ranging between 28
and 34meq l�1 and 22 and 26meq l�1, respectively. N-NH4
+ and Ca2+ constituted about 67% of the cations.
The ion concentrations showed a low variability fromyear to year at both sites (Table 2). SO4
2�, N-NO3� and
N-NH4+ were generally close to the lower values of the
range reported for Italian forest sites in the nationalnetwork CONECOFOR (Mosello et al., 1999).
Mann-Whitney U test was used to compare ionconcentrations from each site. The results indicatedthat, for all variables analysed in bulk precipitationsamples, values did not differ significantly between sites,
except for Mg2+ for which p was 0.033. Regardingthroughfall concentrations, the two sites differed inmeasured values of H+, N-NO3
�, Cl�, Na+, K+, DOC
and w.a.The significance of variations between ion concentra-
tions in bulk precipitation and throughfall, tested by the
Sign test, was high for all chemicals analysed (po0:0001)with the exception of H+, at Val Gerola, and N-NH4
+,at Val Masino, for which the p values were 0.039 and
0.030, respectively. These results demonstrate the highdegree of filtering effected by spruce canopies leading toan ionic enrichment of 48% and 36% in the throughfallof Val Gerola and Val Masino, respectively. The
enrichment of K+ was the highest, with a 19-foldincrease at Val Masino and a 27-fold increase at ValGerola. Ca2+ and Mg2+ also showed a 23-fold
increment in throughfall at both sites. SO42� concentra-
tion in throughfall was 27% and 14% higher than in thebulk, at Val Gerola and Val Masino, respectively. N-
NO3� was almost double at Val Gerola where it was the
predominant anion, and at Val Masino it was slightlyhigher (26%). N-NH4
+ concentration decreased inthroughfall by about 25–29% at both stations, along
with H+ which showed a reduction of 10% and 40%, atVal Gerola and Val Masino, respectively.
Fig. 2. Average monthly values of rainfall (mm) calculated for
the period 1994–1999.
Table 2
Volume-weighted mean values of concentration (meq l�1) of throughfall (TF) and bulk precipitation (BP) samples collected at Val
Gerola and Val Masino
H N-NH4 N-NO3 SO4 Cl Ca Mg Na K
BD TF BD TF BD TF BD TF BD TF BD TF BD TF BD TF BD TF
Val Gerola
94–95 12 12 20 16 23 57 31 53 7 22 22 69 4 20 7 15 2 65
95–96 13 14 28 12 26 47 34 48 9 22 26 59 9 20 10 13 3 78
96–97 8 6 25 17 22 33 28 33 7 12 35 56 6 13 7 10 3 37
97–98 11 9 24 24 25 52 30 38 7 15 30 48 4 17 6 11 2 47
98–99 10 9 24 23 25 45 30 39 8 15 37 59 5 14 9 12 2 38
Mean (94–99) 11 10 24 18 24 47 31 42 8 17 30 58 6 17 8 12 2 53
Val Masino
94–95 10 5 23 13 23 27 33 40 9 13 23 36 4 12 7 10 2 41
95–96 8 7 25 18 24 36 29 41 6 13 31 53 6 16 7 9 2 45
96–97 10 6 27 15 23 24 32 29 5 8 22 40 4 11 5 6 2 31
97–98 15 6 23 19 23 35 29 32 8 11 19 42 3 12 7 8 2 35
98–99 8 4 23 21 23 32 28 34 6 11 35 55 5 13 8 13 2 37
Mean (94–99) 10 6 24 17 23 31 30 35 7 11 26 45 4 13 7 9 2 38
R. Balestrini, A. Tagliaferri / Atmospheric Environment 35 (2001) 6421–64336424
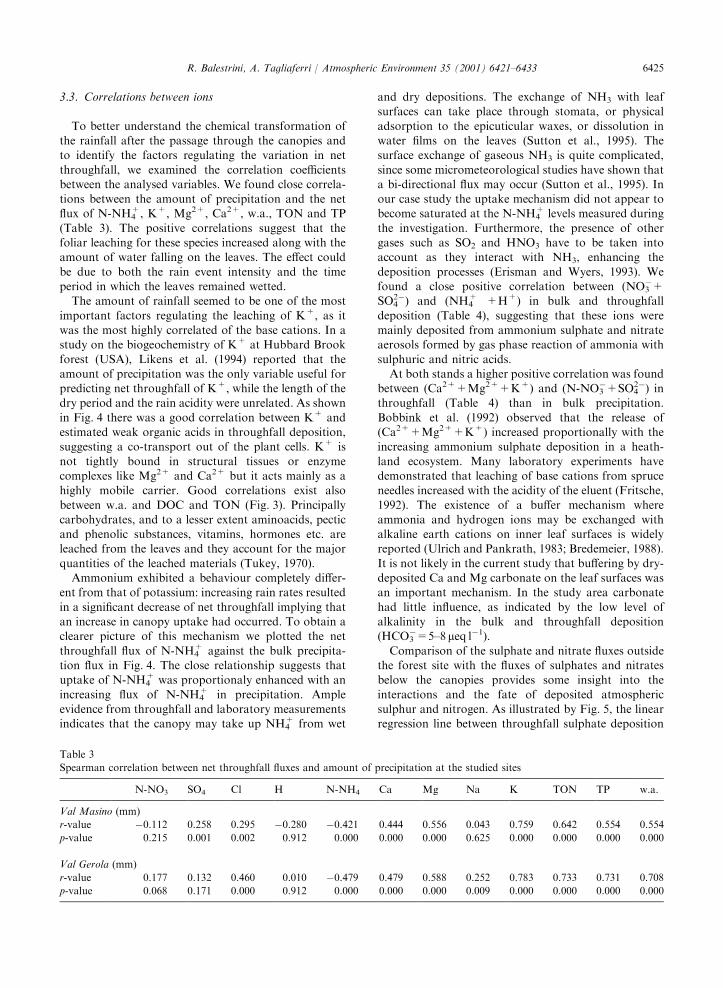
3.3. Correlations between ions
To better understand the chemical transformation ofthe rainfall after the passage through the canopies andto identify the factors regulating the variation in net
throughfall, we examined the correlation coefficientsbetween the analysed variables. We found close correla-tions between the amount of precipitation and the netflux of N-NH4
+, K+, Mg2+, Ca2+, w.a., TON and TP
(Table 3). The positive correlations suggest that thefoliar leaching for these species increased along with theamount of water falling on the leaves. The effect could
be due to both the rain event intensity and the timeperiod in which the leaves remained wetted.
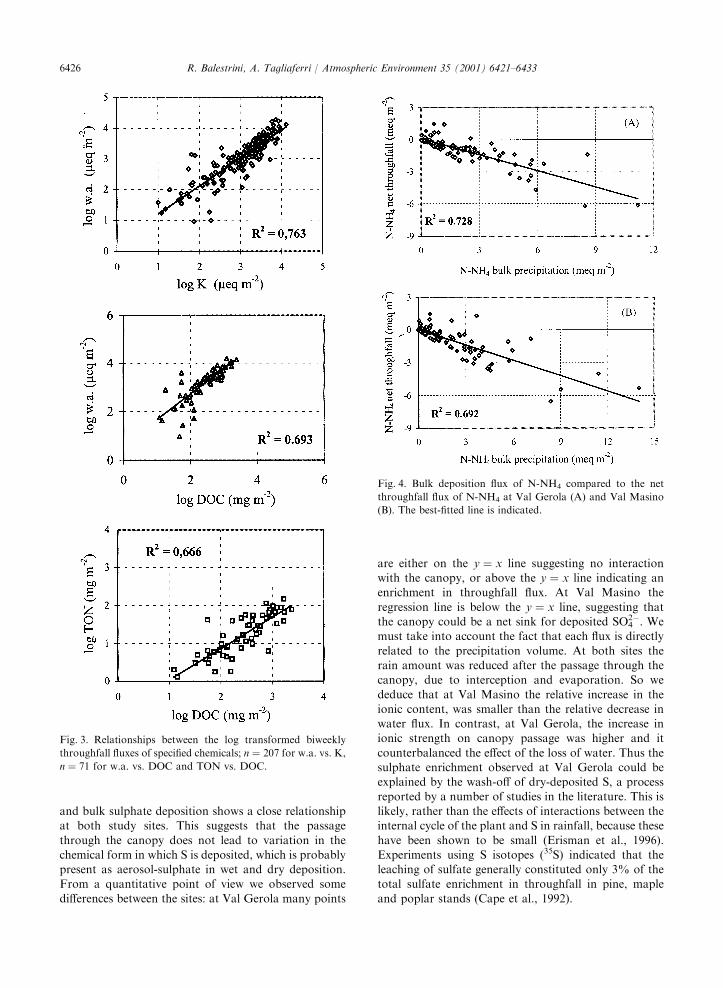
The amount of rainfall seemed to be one of the most
important factors regulating the leaching of K+, as itwas the most highly correlated of the base cations. In astudy on the biogeochemistry of K+ at Hubbard Brook
forest (USA), Likens et al. (1994) reported that theamount of precipitation was the only variable useful forpredicting net throughfall of K+, while the length of thedry period and the rain acidity were unrelated. As shown
in Fig. 4 there was a good correlation between K+ andestimated weak organic acids in throughfall deposition,suggesting a co-transport out of the plant cells. K+ is
not tightly bound in structural tissues or enzymecomplexes like Mg2+ and Ca2+ but it acts mainly as ahighly mobile carrier. Good correlations exist also
between w.a. and DOC and TON (Fig. 3). Principallycarbohydrates, and to a lesser extent aminoacids, pecticand phenolic substances, vitamins, hormones etc. areleached from the leaves and they account for the major
quantities of the leached materials (Tukey, 1970).Ammonium exhibited a behaviour completely differ-
ent from that of potassium: increasing rain rates resulted
in a significant decrease of net throughfall implying thatan increase in canopy uptake had occurred. To obtain aclearer picture of this mechanism we plotted the net
throughfall flux of N-NH4+ against the bulk precipita-
tion flux in Fig. 4. The close relationship suggests thatuptake of N-NH4
+ was proportionaly enhanced with an
increasing flux of N-NH4+ in precipitation. Ample
evidence from throughfall and laboratory measurementsindicates that the canopy may take up NH4
+ from wet
and dry depositions. The exchange of NH3 with leafsurfaces can take place through stomata, or physical
adsorption to the epicuticular waxes, or dissolution inwater films on the leaves (Sutton et al., 1995). Thesurface exchange of gaseous NH3 is quite complicated,
since some micrometeorological studies have shown thata bi-directional flux may occur (Sutton et al., 1995). Inour case study the uptake mechanism did not appear tobecome saturated at the N-NH4
+ levels measured during
the investigation. Furthermore, the presence of othergases such as SO2 and HNO3 have to be taken intoaccount as they interact with NH3, enhancing the
deposition processes (Erisman and Wyers, 1993). Wefound a close positive correlation between (NO3
�+SO4
2�) and (NH4+ +H+) in bulk and throughfall
deposition (Table 4), suggesting that these ions weremainly deposited from ammonium sulphate and nitrateaerosols formed by gas phase reaction of ammonia with
sulphuric and nitric acids.At both stands a higher positive correlation was found
between (Ca2++Mg2++K+) and (N-NO3�+SO4
2�) inthroughfall (Table 4) than in bulk precipitation.
Bobbink et al. (1992) observed that the release of(Ca2++Mg2++K+) increased proportionally with theincreasing ammonium sulphate deposition in a heath-
land ecosystem. Many laboratory experiments havedemonstrated that leaching of base cations from spruceneedles increased with the acidity of the eluent (Fritsche,
1992). The existence of a buffer mechanism whereammonia and hydrogen ions may be exchanged withalkaline earth cations on inner leaf surfaces is widelyreported (Ulrich and Pankrath, 1983; Bredemeier, 1988).
It is not likely in the current study that buffering by dry-deposited Ca and Mg carbonate on the leaf surfaces wasan important mechanism. In the study area carbonate
had little influence, as indicated by the low level ofalkalinity in the bulk and throughfall deposition(HCO3
�=5–8meq l�1).
Comparison of the sulphate and nitrate fluxes outsidethe forest site with the fluxes of sulphates and nitratesbelow the canopies provides some insight into the
interactions and the fate of deposited atmosphericsulphur and nitrogen. As illustrated by Fig. 5, the linearregression line between throughfall sulphate deposition
Table 3
Spearman correlation between net throughfall fluxes and amount of precipitation at the studied sites
N-NO3 SO4 Cl H N-NH4 Ca Mg Na K TON TP w.a.
Val Masino (mm)
r-value �0.112 0.258 0.295 �0.280 �0.421 0.444 0.556 0.043 0.759 0.642 0.554 0.554
p-value 0.215 0.001 0.002 0.912 0.000 0.000 0.000 0.625 0.000 0.000 0.000 0.000
Val Gerola (mm)
r-value 0.177 0.132 0.460 0.010 �0.479 0.479 0.588 0.252 0.783 0.733 0.731 0.708
p-value 0.068 0.171 0.000 0.912 0.000 0.000 0.000 0.009 0.000 0.000 0.000 0.000
R. Balestrini, A. Tagliaferri / Atmospheric Environment 35 (2001) 6421–6433 6425
and bulk sulphate deposition shows a close relationshipat both study sites. This suggests that the passage
through the canopy does not lead to variation in thechemical form in which S is deposited, which is probablypresent as aerosol-sulphate in wet and dry deposition.From a quantitative point of view we observed some
differences between the sites: at Val Gerola many points
are either on the y ¼ x line suggesting no interactionwith the canopy, or above the y ¼ x line indicating anenrichment in throughfall flux. At Val Masino the
regression line is below the y ¼ x line, suggesting thatthe canopy could be a net sink for deposited SO4
2�. Wemust take into account the fact that each flux is directly
related to the precipitation volume. At both sites therain amount was reduced after the passage through thecanopy, due to interception and evaporation. So we
deduce that at Val Masino the relative increase in theionic content, was smaller than the relative decrease inwater flux. In contrast, at Val Gerola, the increase inionic strength on canopy passage was higher and it
counterbalanced the effect of the loss of water. Thus thesulphate enrichment observed at Val Gerola could beexplained by the wash-off of dry-deposited S, a process
reported by a number of studies in the literature. This islikely, rather than the effects of interactions between theinternal cycle of the plant and S in rainfall, because these
have been shown to be small (Erisman et al., 1996).Experiments using S isotopes (35S) indicated that theleaching of sulfate generally constituted only 3% of thetotal sulfate enrichment in throughfall in pine, maple
and poplar stands (Cape et al., 1992).
Fig. 3. Relationships between the log transformed biweekly
throughfall fluxes of specified chemicals; n ¼ 207 for w.a. vs. K,
n ¼ 71 for w.a. vs. DOC and TON vs. DOC.
Fig. 4. Bulk deposition flux of N-NH4 compared to the net
throughfall flux of N-NH4 at Val Gerola (A) and Val Masino
(B). The best-fitted line is indicated.
R. Balestrini, A. Tagliaferri / Atmospheric Environment 35 (2001) 6421–64336426
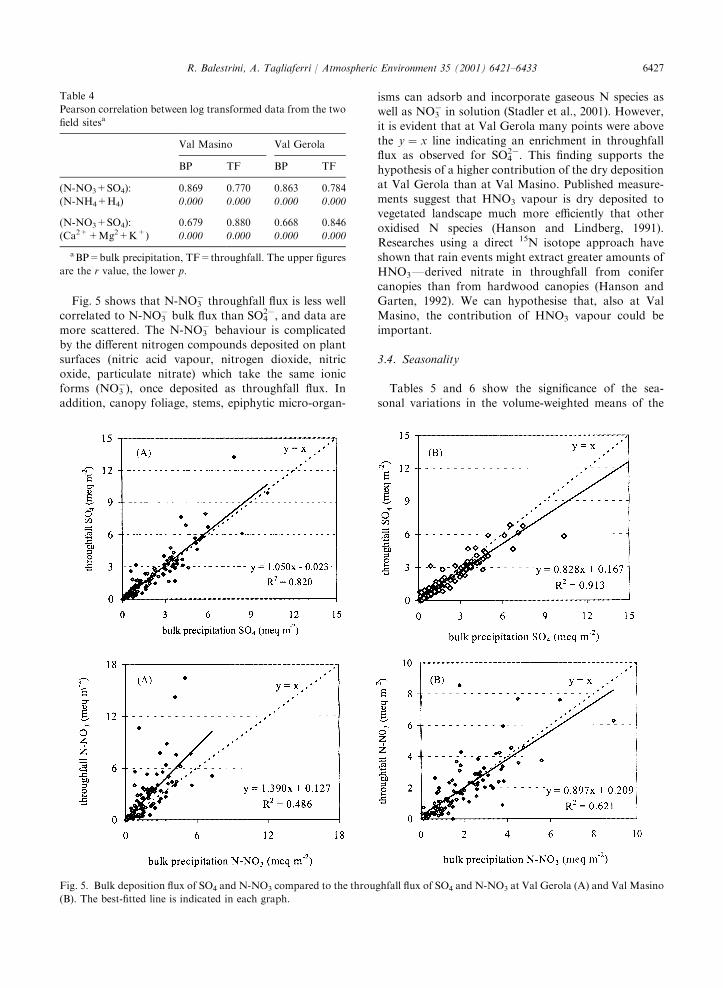
Fig. 5 shows that N-NO3� throughfall flux is less well
correlated to N-NO3� bulk flux than SO4
2�, and data aremore scattered. The N-NO3
� behaviour is complicatedby the different nitrogen compounds deposited on plant
surfaces (nitric acid vapour, nitrogen dioxide, nitricoxide, particulate nitrate) which take the same ionicforms (NO3
�), once deposited as throughfall flux. Inaddition, canopy foliage, stems, epiphytic micro-organ-
isms can adsorb and incorporate gaseous N species aswell as NO3
� in solution (Stadler et al., 2001). However,
it is evident that at Val Gerola many points were abovethe y ¼ x line indicating an enrichment in throughfallflux as observed for SO4
2�. This finding supports the
hypothesis of a higher contribution of the dry depositionat Val Gerola than at Val Masino. Published measure-ments suggest that HNO3 vapour is dry deposited tovegetated landscape much more efficiently that other
oxidised N species (Hanson and Lindberg, 1991).Researches using a direct 15N isotope approach haveshown that rain events might extract greater amounts of
HNO3Fderived nitrate in throughfall from conifercanopies than from hardwood canopies (Hanson andGarten, 1992). We can hypothesise that, also at Val
Masino, the contribution of HNO3 vapour could beimportant.
3.4. Seasonality
Tables 5 and 6 show the significance of the sea-
sonal variations in the volume-weighted means of the
Table 4
Pearson correlation between log transformed data from the two
field sitesa
Val Masino Val Gerola
BP TF BP TF
(N-NO3+SO4): 0.869 0.770 0.863 0.784
(N-NH4+H4) 0.000 0.000 0.000 0.000
(N-NO3+SO4): 0.679 0.880 0.668 0.846
(Ca2++Mg2+K+) 0.000 0.000 0.000 0.000
aBP=bulk precipitation, TF=throughfall. The upper figures
are the r value, the lower p.
Fig. 5. Bulk deposition flux of SO4 and N-NO3 compared to the throughfall flux of SO4 and N-NO3 at Val Gerola (A) and Val Masino
(B). The best-fitted line is indicated in each graph.
R. Balestrini, A. Tagliaferri / Atmospheric Environment 35 (2001) 6421–6433 6427

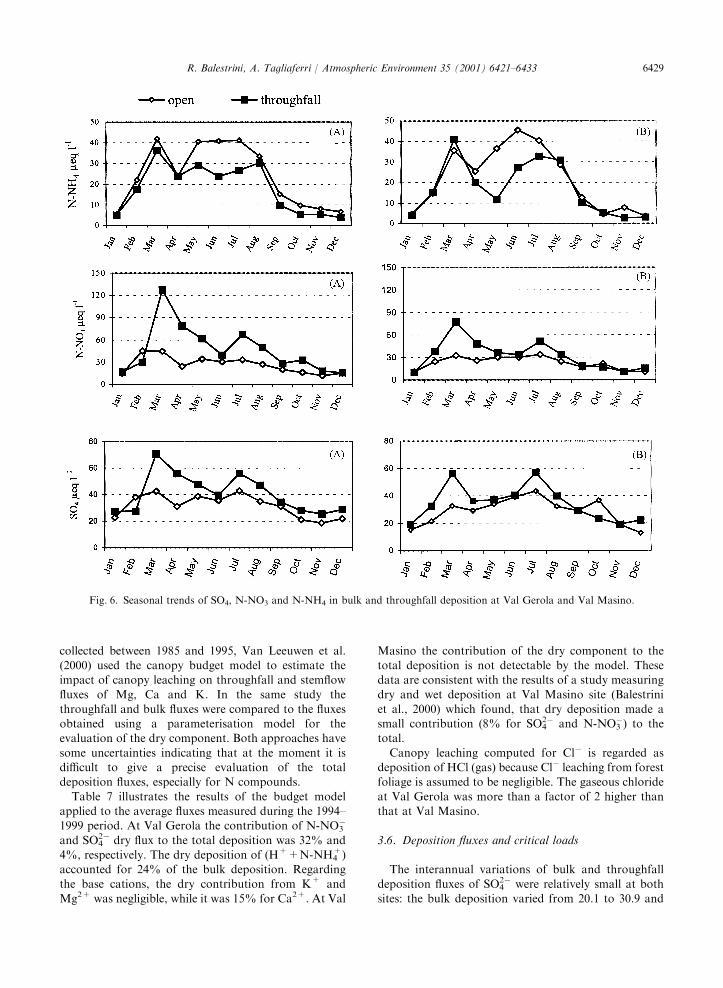
concentration of the chemical fluxes measured in the
bulk and throughfall deposition at each site. Themonthly concentrations of acidifying compounds,SO4
2�, N-NO3� and N-NH4
+, show their maximum from
March to the end of summer and minimum values inautumn and winter (Fig. 6). These findings are likely tobe related to seasonal changes in the photochemical
activity (Brimblecombe, 1986) and in the atmosphericstability. During summer the mixing layer is very highand most pollutants in precipitation derive from therainout of hygroscopic cloud condensation nuclei,
probably transported into the region from long dis-
tances. During winter, the much reduced mixing layerimplies that atmospheric deposition tends to contain
ions of local origin. The differences between bulk andthroughfall nitrate and sulphate concentrations arelarger in early spring; in particular, N-NO3
� values for
the throughfall deposition were 2.5 and 3 times higherthan bulk values at Val Masino and Val Gerola,respectively. These differences could be explained by amajor contribution from dry-deposited particles, washed
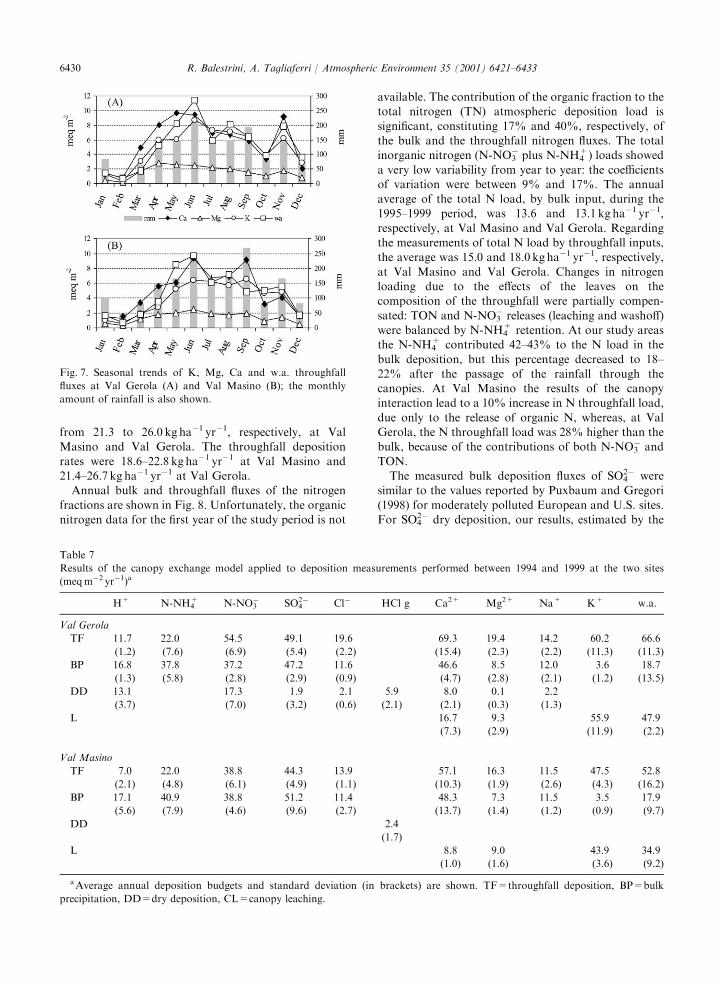
out in March after the driest period of the year.The seasonal variation in the flux of ions from
atmosphere to the soil was strongly influenced by the
volume of the precipitation. The highest pollutant fluxesoccurred from June to September, and this coincidedwith high precipitation events. Highly significant seaso-
nal variations were observed for K+, Mg2+, Ca2+ andw.a. in throughfall deposition. As shown in Fig. 7, thefluxes increased from April and remained high during
the growing season, tracking the variation of rainfallamount. The minimum values measured occurredbetween December and March, when the trees wereexpected to be dormant and when snow, covering the
crowns, reduced the leaching action.
3.5. Canopy exchange model
Continuous monitoring of throughfall and bulkdeposition fluxes at our forest sites allowed the
application of the canopy budget model, developed byUlrich and Pankratn (1983), with the aim of estimatingthe leaching and the contribution of dry deposition in
throughfall. In the model, Na is assumed not to beinfluenced by canopy exchange processes and it is usedas a tracer of dry deposition of particles such as Ca2+,Mg2+, K+ and Cl�. Dry deposition amounts can be
calculated according to (TFNa – BPNa)/BPNa (=drydeposition factor) multiplied by BP of the ions ofinterest. The following abbreviations are used:
TF=throughfall flux, BP=bulk precipitation flux. Asecond assumption by the model is that the total canopyuptake (CU) of NH4
+ and H+ equals the total canopy
leaching of Ca2+, Mg2+ and K+ minus the canopyleaching of Ca2+, Mg2+ and K+ associated with theexcretion of weak acids. Thus, knowing the NH4
+ and
the H+ canopy uptake, the dry deposition flux of(NH4
++H+) can be computed from TF+CU – BP.Finally, it is assumed that canopy leaching of NO3
� andSO4
2� is negligible and, therefore, the dry contribution of
NO3� and SO4
2� equals the net throughfall.Although some assumptions of the model are argu-
able, some comparison studies have shown good
agreement between the results of this model and thoseobtained by other approaches such as inferentialtechniques or artificial surfaces (Butler and Likens,
1995; Draaijers et al., 1997; Puxbaum and Gregori,1998). In a wide recent study based on European data
Table 5
Significance of the seasonal variations (between months) of
concentrations in bulk precipitation (BP) and throughfall (TF),
tested by Kruskall-Wallisa
Val Masino Val Gerola
BP TF BP TF
TP n.s. n.s. n.s. n.s.
TON n.s. * n.s. *
H n.s. *** n.s. *
N-HO3 *** *** *** ***
N-NH4 *** *** *** ***
SO4 *** * *** n.s.
Cl n.s. n.s. n.s. n.s.
Ca n.s. n.s. n.s. n.s.
Mg n.s. n.s. n.s. n.s.
Na n.s. n.s. n.s. n.s.
K n.s. *** n.s. n.s.
w.a. n.s. * n.s. n.s.
a***=pp0:001; **=pp0:01; *=pp0:05; n.s.=not signifi-
cant.
Table 6
Significance of the seasonal variations (between months) of bulk
precipitation (BP) and throughfall (TF) fluxes, tested by
Kruskall-Wallisa
Val Masino Val Gerola
BP TF BP TF
TP * ** n.s. n.s.
TON n.s. ** n.s. n.s.
H n.s. n.s. n.s. *
N-HO3 *** *** *** ***
N-NH4 *** *** *** ***
SO4 *** *** *** ***
Cl ** *** * **
Ca ** *** * **
Mg * *** * **
Na * *** n.s. **
K n.s. *** * **
w.a. * *** n.s. **
a***p ¼ p0:001; **p ¼ p0:01; *=pp0:05; n.s.=not signifi-
cant.
R. Balestrini, A. Tagliaferri / Atmospheric Environment 35 (2001) 6421–64336428
collected between 1985 and 1995, Van Leeuwen et al.(2000) used the canopy budget model to estimate theimpact of canopy leaching on throughfall and stemflow
fluxes of Mg, Ca and K. In the same study thethroughfall and bulk fluxes were compared to the fluxesobtained using a parameterisation model for theevaluation of the dry component. Both approaches have
some uncertainties indicating that at the moment it isdifficult to give a precise evaluation of the totaldeposition fluxes, especially for N compounds.
Table 7 illustrates the results of the budget modelapplied to the average fluxes measured during the 1994–1999 period. At Val Gerola the contribution of N-NO3
�
and SO42� dry flux to the total deposition was 32% and
4%, respectively. The dry deposition of (H++N-NH4+)
accounted for 24% of the bulk deposition. Regardingthe base cations, the dry contribution from K+ and
Mg2+ was negligible, while it was 15% for Ca2+. At Val
Masino the contribution of the dry component to thetotal deposition is not detectable by the model. Thesedata are consistent with the results of a study measuring
dry and wet deposition at Val Masino site (Balestriniet al., 2000) which found, that dry deposition made asmall contribution (8% for SO4
2� and N-NO3�) to the
total.
Canopy leaching computed for Cl� is regarded asdeposition of HCl (gas) because Cl� leaching from forestfoliage is assumed to be negligible. The gaseous chloride
at Val Gerola was more than a factor of 2 higher thanthat at Val Masino.
3.6. Deposition fluxes and critical loads
The interannual variations of bulk and throughfall
deposition fluxes of SO42� were relatively small at both
sites: the bulk deposition varied from 20.1 to 30.9 and
Fig. 6. Seasonal trends of SO4, N-NO3 and N-NH4 in bulk and throughfall deposition at Val Gerola and Val Masino.
R. Balestrini, A. Tagliaferri / Atmospheric Environment 35 (2001) 6421–6433 6429
from 21.3 to 26.0 kg ha�1 yr�1, respectively, at ValMasino and Val Gerola. The throughfall deposition
rates were 18.6–22.8 kg ha�1 yr�1 at Val Masino and21.4–26.7 kg ha�1 yr�1 at Val Gerola.
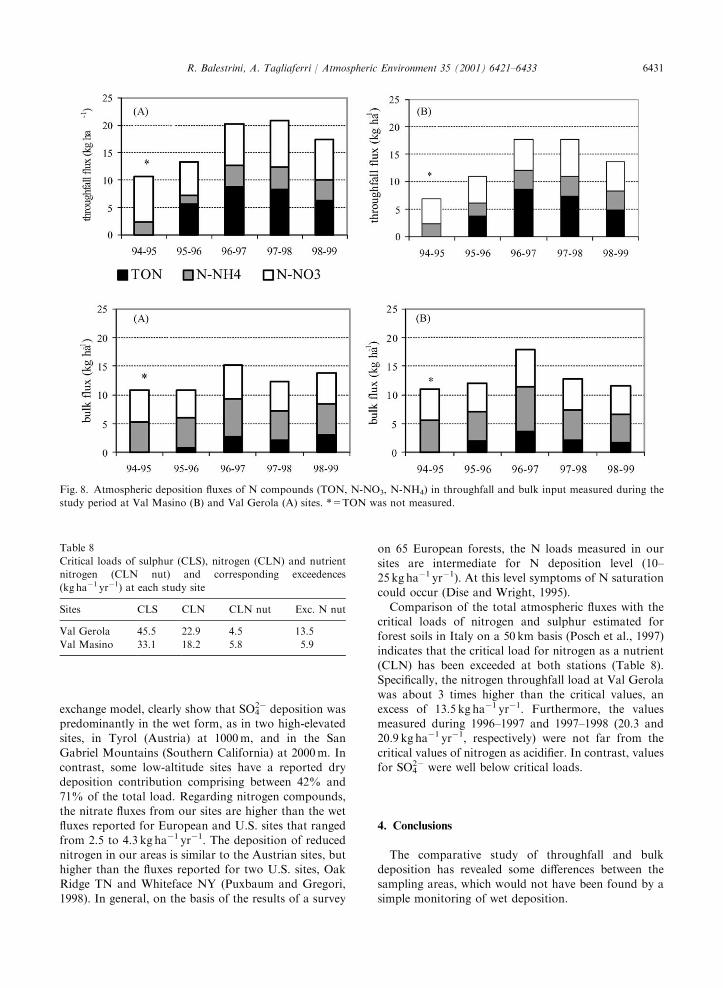
Annual bulk and throughfall fluxes of the nitrogen
fractions are shown in Fig. 8. Unfortunately, the organicnitrogen data for the first year of the study period is not
available. The contribution of the organic fraction to thetotal nitrogen (TN) atmospheric deposition load is
significant, constituting 17% and 40%, respectively, ofthe bulk and the throughfall nitrogen fluxes. The totalinorganic nitrogen (N-NO3
� plus N-NH4+) loads showed
a very low variability from year to year: the coefficientsof variation were between 9% and 17%. The annualaverage of the total N load, by bulk input, during the1995–1999 period, was 13.6 and 13.1 kg ha�1 yr�1,
respectively, at Val Masino and Val Gerola. Regardingthe measurements of total N load by throughfall inputs,the average was 15.0 and 18.0 kg ha�1 yr�1, respectively,
at Val Masino and Val Gerola. Changes in nitrogenloading due to the effects of the leaves on thecomposition of the throughfall were partially compen-
sated: TON and N-NO3� releases (leaching and washoff)
were balanced by N-NH4+ retention. At our study areas
the N-NH4+ contributed 42–43% to the N load in the
bulk deposition, but this percentage decreased to 18–22% after the passage of the rainfall through thecanopies. At Val Masino the results of the canopyinteraction lead to a 10% increase in N throughfall load,
due only to the release of organic N, whereas, at ValGerola, the N throughfall load was 28% higher than thebulk, because of the contributions of both N-NO3
� and
TON.The measured bulk deposition fluxes of SO4
2� weresimilar to the values reported by Puxbaum and Gregori
(1998) for moderately polluted European and U.S. sites.For SO4
2� dry deposition, our results, estimated by the
Fig. 7. Seasonal trends of K, Mg, Ca and w.a. throughfall
fluxes at Val Gerola (A) and Val Masino (B); the monthly
amount of rainfall is also shown.
Table 7
Results of the canopy exchange model applied to deposition measurements performed between 1994 and 1999 at the two sites
(meqm�2 yr�1)a
H+ N-NH4+ N-NO3
� SO42� Cl� HCl g Ca2+ Mg2+ Na+ K+ w.a.
Val Gerola
TF 11.7 22.0 54.5 49.1 19.6 69.3 19.4 14.2 60.2 66.6
(1.2) (7.6) (6.9) (5.4) (2.2) (15.4) (2.3) (2.2) (11.3) (11.3)
BP 16.8 37.8 37.2 47.2 11.6 46.6 8.5 12.0 3.6 18.7
(1.3) (5.8) (2.8) (2.9) (0.9) (4.7) (2.8) (2.1) (1.2) (13.5)
DD 13.1 17.3 1.9 2.1 5.9 8.0 0.1 2.2
(3.7) (7.0) (3.2) (0.6) (2.1) (2.1) (0.3) (1.3)
L 16.7 9.3 55.9 47.9
(7.3) (2.9) (11.9) (2.2)
Val Masino
TF 7.0 22.0 38.8 44.3 13.9 57.1 16.3 11.5 47.5 52.8
(2.1) (4.8) (6.1) (4.9) (1.1) (10.3) (1.9) (2.6) (4.3) (16.2)
BP 17.1 40.9 38.8 51.2 11.4 48.3 7.3 11.5 3.5 17.9
(5.6) (7.9) (4.6) (9.6) (2.7) (13.7) (1.4) (1.2) (0.9) (9.7)
DD 2.4
(1.7)
L 8.8 9.0 43.9 34.9
(1.0) (1.6) (3.6) (9.2)
aAverage annual deposition budgets and standard deviation (in brackets) are shown. TF=throughfall deposition, BP=bulk
precipitation, DD=dry deposition, CL=canopy leaching.
R. Balestrini, A. Tagliaferri / Atmospheric Environment 35 (2001) 6421–64336430
exchange model, clearly show that SO42� deposition was
predominantly in the wet form, as in two high-elevatedsites, in Tyrol (Austria) at 1000m, and in the San
Gabriel Mountains (Southern California) at 2000m. Incontrast, some low-altitude sites have a reported drydeposition contribution comprising between 42% and
71% of the total load. Regarding nitrogen compounds,the nitrate fluxes from our sites are higher than the wetfluxes reported for European and U.S. sites that ranged
from 2.5 to 4.3 kg ha�1 yr�1. The deposition of reducednitrogen in our areas is similar to the Austrian sites, buthigher than the fluxes reported for two U.S. sites, OakRidge TN and Whiteface NY (Puxbaum and Gregori,
1998). In general, on the basis of the results of a survey
on 65 European forests, the N loads measured in our
sites are intermediate for N deposition level (10–25 kg ha�1 yr�1). At this level symptoms of N saturationcould occur (Dise and Wright, 1995).
Comparison of the total atmospheric fluxes with thecritical loads of nitrogen and sulphur estimated forforest soils in Italy on a 50 km basis (Posch et al., 1997)
indicates that the critical load for nitrogen as a nutrient(CLN) has been exceeded at both stations (Table 8).Specifically, the nitrogen throughfall load at Val Gerola
was about 3 times higher than the critical values, anexcess of 13.5 kg ha�1 yr�1. Furthermore, the valuesmeasured during 1996–1997 and 1997–1998 (20.3 and20.9 kg ha�1 yr�1, respectively) were not far from the
critical values of nitrogen as acidifier. In contrast, valuesfor SO4
2� were well below critical loads.
4. Conclusions
The comparative study of throughfall and bulkdeposition has revealed some differences between the
sampling areas, which would not have been found by asimple monitoring of wet deposition.
Fig. 8. Atmospheric deposition fluxes of N compounds (TON, N-NO3, N-NH4) in throughfall and bulk input measured during the
study period at Val Masino (B) and Val Gerola (A) sites. *=TON was not measured.
Table 8
Critical loads of sulphur (CLS), nitrogen (CLN) and nutrient
nitrogen (CLN nut) and corresponding exceedences
(kg ha�1 yr�1) at each study site
Sites CLS CLN CLN nut Exc. N nut
Val Gerola 45.5 22.9 4.5 13.5
Val Masino 33.1 18.2 5.8 5.9
R. Balestrini, A. Tagliaferri / Atmospheric Environment 35 (2001) 6421–6433 6431
The Val Gerola forest, where the damage symptomsare more evident, shows higher levels of nitrate and
chloride, mainly during the growing period. Thispresumably comes from the washout of accumulateddeposits of aerosols and gases. Since the dry deposition
depends on meteorological parameters and on thefeatures of the receiving surface, the observed differencescould be ascribed to the morphological and meteocli-matic characteristics of the two studied areas. A detailed
analysis of meteorological parameters carried out at thetwo valleys shows differences in wind speed andprevailing wind direction (Azienda Regionale delle
Foreste, 1998). The Val Gerola site, which is higherand has a more open valley, seemed to be more exposedto the air masses coming from the plain and the pre-
alpine belt where urbanisation is the greatest, wherasVal Masino is crossed only by breezes of local origin orderived from the Valtellina valley bottom. A study on
air quality in the same areas supports this hypothesis,with higher ozone levels measured at Val Gerola than atVal Masino. This was ascribed to the different oro-graphic profiles, to the different atmospheric circulation
and to the presence of ozone transferred from outsideand not only of local origin (Gerosa et al., 1999). Thedifferent features of the plant community of the two
forests could also affect the dry deposition, but it is noteasy to find systems perfectly comparable in fieldexperiments. Although in our opinion the meteoclimatic
and ozone researches support our hypothesis, furtherinvestigations are necessary to discriminate better therole of different factors.
The foliar release of base cations and organic
compounds is higher at Val Gerola than at Val Masinoforest and this indirectly suggests plant tissue damage.Natural factors such as plant age as well as anthro-
pogenic stress factors, such as air pollution, can lead to amodification of the epicuticular wax structure of coniferneedles and increase the leaching of nutrients. A study of
the leaf alterations of one year-old Norway spruceneedles from Val Gerola revealed injury symptoms,including pigmentation on the adaxial leaf surface.
Optical and electron microscopy showed that the injurywas associated with a chlorophyll loss and deposits ofcalcium oxalate (Violini, 1998). Some of the observedsymptoms were similar to those described in literature
for forest species exposed to high levels of ozone (Skellyet al., 1999).
The exceeding of the critical values of nitrogen as a
nutrient, observed at both forest sites, suggests the riskof an evolution of the ecosystems toward a condition ofnitrogen saturation. Furthermore, nitrogen deposition
and ozone could act synergistically to induce nitrogensaturation and perhaps forest decline (Aber et al., 1989).However, it is very difficult to assess the nitrogen storage
capacity of individual and possibly unique areas.Additional research is essential to understand more
about the internal processes and mechanisms fornitrogen not only in stressed ecosystems but also in
healthy sites such as Val Masino.
Acknowledgements
The authors would like to thank F. Bacciu for DOCanalysis and Dr J.L. Kemp for help with the English.
Funding was provided by the Regional Forestry Board.
References
Aber, J.D., Nadelhoffer, K.J., Steudler, P., Melillo, J.M., 1989.
Nitrogen saturation in northern forest ecosystems: Excess
nitrogen from fossil fuel combustion may stress the
biosphere. BioScience 39 (6), 378–386.
Azienda Regionale delle Foreste, 1998. Esperimenti sul terreno
per migliorare le conoscenze sull’inquinamento atmosferico
(Soil experiments to improve the knowledge of the atmo-
spheric pollution). Report CE 94.60 IT.00.90 (Reg.CEE
2157/92).
Balestrini, R., Galli, L., Tartari, G., 2000. Wet and dry
atmospheric deposition at prealpine sites in northern Italy.
Atmospheric Environment 34, 1455–1470.
Beier, C., Gundersen, P., Rasmussen, L., 1992. A new method
for estimation of dry deposition of particles based on
throughfall measurements in a forest edge. Atmospheric
Environment 26A (9), 1553–1559.
Bobbink, R., Heil, G.W., Raessen, M.B., 1992. Atmodpheric
deposition and canopy exchange processes in heatland
ecosystems. Environmental pollution 75, 29–37.
Bobbink, R., Hornung, M., Roelofs, J.G.M., 1998. The effects
of air-borne nitrogen pollutants on species diversity in
natural and semi-natural european vegetation. Journal of
Ecology 86 (5), 717–738.
Bredemeier, M., 1988. Forest canopy transformation of atmo-
spheric deposition. Water, Air and Soil Pollution 40, 121–
138.
Brimblecombe, P., 1986. Air: composition and chemistry.
Cambridge University Press, Cambridge.
Butler, T.J., Likens, G.E., 1995. A direct comparison of
throughfall plus stemflow to estimates of dry and total
deposition for S and N. Atmospheric Environment 29,
1253–1265.
Cape, J.N., Sheppard, L.J., Fowler, D., Harrison, A.F.,
Parkinson, J.A., Dao, P., Paterson, I.S., 1992. Contribution
of canopy leaching to sulphate deposition ina Scots pine
forest. Environmental Pollution 75, 229–236.
Dise, N.B., Wright, R.F., 1995. Nitrogen leaching from
European forests in relation to nitrogen deposition. Forest
Ecology and Management 71, 153–161.
Erisman, J.W., Wyers, G.P., 1993. Continuous measurements
of surface exchange of SO2 and NH3; implications for their
possible interaction in the deposition processes. Atmo-
spheric Environment 27A, 1937–1949.
Erisman, J.W., Draijers, G.P.J., Duyzer, J.H., Hofschreuder,
P., Van Leeuwen, N., Romer, F.G., Ruijgrok, W., Wyers,
G.P., Gallagher, M., 1996. Particle deposition to forest:
R. Balestrini, A. Tagliaferri / Atmospheric Environment 35 (2001) 6421–64336432
summary of results and application. Atmospheric Environ-
ment 31, 333–344.
Fritsche, U., 1992. Studies on leaching from spruce twigs and
beech leaves. Environmental Pollution 75, 251–257.
Gerosa, G., Ballarin-Denti, A., 1998. Inquinanti atmosferici
inorganici. In: Fondazione Lombardia per l’Ambiente (Ed.),
Monitoraggio delle foreste sotto stress ambientale. Milano,
pp. 362–369.
Gerosa, G., Spinazzi, F., Ballarin Denti, A., 1999. Tropospheric
ozone in alpine forest sites: air quality monitoring and
statistical data analysis. Water, Air and Soil Pollution 116,
345–350.
Hanson, P.J., Garten, C.T., 1992. Deposition of H15NO3
vapour to white oak, red maple and loblolly pine foliage:
experimental observations and a generalised model. New
Phytologist 122, 329–337.
Hanson, P.J., Lindberg, S.E., 1991. Dry deposition of reactive
nitrogen compounds: a review of leaf, canopy and non-
foliar measurements. Atmospheric Environment 25A (8),
1615–1634.
Hoffman, W.A., Lindberg, S.E., Turnewr, R.R., 1980. Some
observations of organic constituents in rain above and
below a forest canopy. Environmental Science and Tech-
nology 14, 999–1002.
ICP-Forest, 1998. Manual on methods and criteria for
harminised sampling, assessment, monitoring and analysis
of the effects of air polltion on forests. Programme
Coordinating Centre Federal research Centre for Forestry
and Forest Product (Ed.), Hamburg.
Lakhani, K.H., Miller, H.G., 1980. Assessing the contribution
of crown leaching to the element content of rainwater
beneath the trees. In: Hutchinson, T.C., Havas, M. (Eds.),
Effect of acid precipitation on terrestrial ecosytems. Plenum
Press, New York, pp. 161–172.
Likens, G.E., Driscoll, C.T., Buso, D.C., Siccama, T.G.,
Johnson, C.E., Lovett, G.M., Ryan, D.F., Fahey, T.,
Reiners, W.A., 1994. The biogeochemistry of potassium at
Hubbard Brook. Biogeochemistry 25 (2), 61–125.
Lovett, G.M., Lindberg, S.E., 1984. Dry deposition and canopy
exchange in a mixed oak forest as determined by analysis of
throughfall. Journal of Applied Ecology 21, 1013–1027.
Mosello, R., Bianchi, M., Brizzio, M.C., Geiss, H., Leyendeker,
W., Marchetto, A., Serrini, G., Serrini Lanza, G., Tartari,
G.A., Muntau, H., 1998. AQUACON-M edBas Subproject
6: Acid rain analysis. Intercomparison 1/97. Environment
Institute, JRC Report, Commission of the European
Communities, Ispra.
Mosello, R., Marchetto, A., Brizzio, M.C., Leyendecker, W.,
Rembges, D., Abruzzese, D., Tartari, G.A., Piazza, S., 1999.
La chimica delle deposizioni atmosferiche nelle aree del
programma CON.ECO.FOR nellanno 1998. (Atmospheric
deposition chemistry in CON.ECO.FOR programme,
1998). Report CNR–III, pp. 1–21.
Posch, M., Hettelingh, J.-P., de Smet, P.A.M., Downing, R.J.
(Eds.), 1997. Calculation and Mapping of Critical Thresh-
olds in Europe. CCE Status Report RIVM Bilthoven,
Netherlands. Report No. 259101007, pp. 97–102.
Puxbaum, H., Gregori, M., 1998. Seasonal and annual
deposition rates of sulphur, nitrogen and chloride species
to an oak forest in North-Eastern Austria (Wolkersdorf,
240m, a. s. l.). Atmospheric Environment 32 (20), 3557–
3568.
Skelly, J.M., Innes, J.L., Savage, J.E., Snyder, K.R., Vander-
heyden, D., Zhang, J., Sanz, M.J., 1999. Observation and
confirmation of foliar ozone symptoms of native plant
species of Switzerland and southern Spain. Water, Air and
Soil Pollution 116, 227–234.
Stadler, B., Solinger, S., Michalzik, B., 2001. Insect herbivores
and the nutrient flow from the canopy to the soil in
coniferous and deciduous forests. Oecologia 126, 104–113.
Sutton, M.A., Fowler, D., Burkhardt, J.K., Milford, C., 1995.
Vegetation atmosphere exchange of ammonia: canopy
cycling and the impacts of elevated nitrogen inputs. Water,
Air and Soil Pollution 85, 2057–2063.
Traaen, T.S., Stoddard, J.L. 1995. An assessment of nitrogen
leaching from watersheds included in ICP on waters. NIVA
Report No. 86001.
Tukey, H.B., 1970. The leaching of substances from plants.
Annual Review of Plant Phisiology 21, 305–324.
Ulrich, B., Pankrath, J., 1983. Interaction of forest canopies
with atmospheric constituents: SO2, alkali cations and
chloride. In: Reidel Publ. Co. (Eds.) Effects of Accumula-
tion of Air Pollutants in Forest Ecosystems. Dordrecht,
Netherlands, pp. 33–55.
Van Leeuwen, E.P., Hendriks, K.C.M., Klap, J.M, De Vries,
W., De Jong, E., Erisman, J.W., 2000. Effects on environ-
mental stress on forest crown condition in Europe. Part II:
estimation of stress induced by meteorology and air
pollutants. Water, Air and Soil Pollution 119 (1–4), 335–
362.
Violini, G. 1998. Il danno rilevato a livello istologico e
ultrastrutturale. In: Fondazione Lombardia per l’Ambiente
Ambiente (Ed.), Monitoraggio delle foreste sotto stress
ambientale. Milano, pp. 312–315.
R. Balestrini, A. Tagliaferri / Atmospheric Environment 35 (2001) 6421–6433 6433