atmospheric controls on soil moisture-boundary layer ... · atmospheric controls on soil...
TRANSCRIPT

Atmospheric controls on soil moisture-boundary layer
interactions: Three-dimensional wind effects
Kirsten L. FindellProgram in Atmospheric and Oceanic Sciences, Princeton University, Princeton, New Jersey, USA
Elfatih A. B. EltahirParsons Lab, Department of Civil and Environmental Engineering, Massachusetts Institute of Technology, Cambridge,Massachusetts, USA
Received 14 November 2001; revised 9 April 2002; accepted 7 June 2002; published 3 April 2003.
[1] This paper expands the one-dimensionally based CTP-HIlow framework for describingatmospheric controls on soil moisture-boundary layer interactions [Findell and Eltahir,2003] to three dimensions by including low-level wind effects in the analysis. Theframework is based on two measures of atmospheric thermodynamic properties: theconvective triggering potential (CTP), a measure of the temperature lapse rate betweenapproximately 1 and 3 km above the ground surface, and a low-level humidity index,HIlow. These two measures are used to distinguish between three types of early morningsoundings: those favoring rainfall over dry soils, those favoring rainfall over wet soils, andthose whose convective potential is unaffected by the partitioning of fluxes at the surface.The focus of this paper is the additional information gained by incorporating informationabout low-level winds into the CTP-HIlow framework. Three-dimensional simulationsusing MM5 and an analysis of observations from the FIFE experiment within thisframework highlight the importance of the winds in determining the sensitivity ofconvection to fluxes from the land surface. A very important impact of the 3D winds is thepotential for low-level backing or unidirectional winds with great shear to suppressconvective potential. Because of this suppression of convection in certain wind conditions,far fewer simulations produced rain than would be anticipated based solely on the 1Dframework of understanding. However, when the winds allowed, convection occurred in amanner consistent with the 1D-based expectations. Generally speaking, in the regimewhere dry soils were expected to have an advantage, convection was triggered over drysoils more often than over wet; in the regime where wet soils were expected to have anadvantage, convection was more frequently triggered over wet soils than over dry.Additionally, when rainfall occurred in both simulations with wet soils and simulationswith dry soils for a given day, rainfall depths were typically greater in the simulations withwet soils. Similarly, the FIFE data showed numerous days with convective potential but norainfall: each of these days had low-level backing or strongly shearing winds. Four dayswith high humidity deficits and veering winds in the lowest 300 mbar did have rain,highlighting the enhanced buoyancy effects of low-level veering winds. INDEX TERMS:
1833 Hydrology: Hydroclimatology; 1854 Hydrology: Precipitation (3354); 1866 Hydrology: Soil moisture;
3307 Meteorology and Atmospheric Dynamics: Boundary layer processes; 3322 Meteorology and
Atmospheric Dynamics: Land/atmosphere interactions; KEYWORDS: Land/atmosphere interactions, boundary
layer processes, hydroclimatology, soil moisture, precipitation, convective processes
Citation: Findell, K. L., and E. A. B. Eltahir, Atmospheric controls on soil moisture-boundary layer interactions: Three-dimensional
wind effects, J. Geophys. Res., 108(D8), 8385, doi:10.1029/2001JD001515, 2003.
1. Introduction
[2] Many recent studies have addressed the question ofhow the fluxes of heat and moisture from the land surfaceinfluence the development of convective rainfall, but con-
sensus about the physical mechanisms and the dominanteffects has not yet emerged. At issue are the strengths of thecompeting influences of the sensible heat flux, which leadsto deep, turbulent mixing, and the latent heat flux, whichincreases the moisture and the moist static energy of theboundary layer (BL). Both of these factors are importantcontributors to BL growth and development, but at theextremes they suggest opposite modes of feedback from the
JOURNAL OF GEOPHYSICAL RESEARCH, VOL. 108, NO. D8, 8385, doi:10.1029/2001JD001515, 2003
Copyright 2003 by the American Geophysical Union.0148-0227/03/2001JD001515$09.00
CIP 10 - 1
land surface to the atmosphere. If the sensible heat flux isthe more important factor in the initiation of rainfall, thendry, arid surfaces would be more likely to trigger rain,suggesting a negative feedback between soil moisture andrainfall. If, on the other hand, the latent heat flux is the moreimportant factor, then a positive feedback is suggested. Thework presented here builds on that of Findell and Eltahir[2003] (hereinafter referred to as FE2003): it is based on thehypothesis that the structure of the atmosphere in the earlymorning largely determines which method of triggering ismore effective on that day.[3] Both types of feedback show up in various modeling
and observational studies. Many studies of the midwesternUS drought of 1988 and flood of 1993, for example, suggestthat the soil moisture condition in these cases helped tosustain the extreme circumstances throughout the summer[Trenberth and Guillemont, 1996; Trenberth et al., 1988;Atlas et al., 1993]. Others suggest that there is actually anegative feedback between soil moisture and drought/floodconditions [Giorgi et al., 1996]. In other studies, Avissarand Liu [1996] found a negative feedback when landscapecontrasts are extreme and can help initiate a sea breeze-likemesoscale circulation. However, when they ran their simu-lations without these landscape contrasts, rainfall occurredover wet soils but not over dry soils. Emori [1998] found anegative feedback in two-dimensional simulations of inter-actions between soil moisture and cumulus convection,while Clark and Arritt [1995] report finding deeper rainfallover wet soils than over dry soils.[4] Ek and Mahrt [1994] caution against extending the
results of individual studies to all locations and synopticsettings. They show that the influence of the land surface onthe development of boundary layer (BL) clouds is highlydependent on the initial (early morning) condition of theatmosphere. Baker et al. [2001] also note the importance ofexisting atmospheric conditions in soil moisture-rainfallfeedback studies: they found a positive feedback betweensoil moisture and rainfall over the Florida peninsula, butthey noted that an already moist atmosphere was a neces-sary prerequisite for this positive feedback.[5] Crook [1996] performed a detailed analysis of the
sensitivity of convection to a number of near-surfacethermodynamic parameters. The most important of theseparameters were the temperature and moisture dropoffsbetween the ground and the boundary layer. These valueswill be strongly influenced by surface fluxes. Crookexplains these sensitivities through their influence on theconvective inhibition (CIN) and the convective availablepotential energy (CAPE). Most importantly for the workpresented here, Crook [1996] discusses that the relativesensitivity of CIN to temperature variations compared tomoisture variations depends on the ratio of the environ-mental stratification to the moist potential lapse rate. In thiswork, we make use of the convective triggering potential(CTP; see FE2003 or definition in Appendix A) which is, inessence, a measure of this ratio.[6] With the one-dimensional boundary layer modeling
detailed in FE2003 we established a framework for under-standing the nature of land-atmosphere interactions basedon the early morning conditions of the atmosphere. Thisframework (Figure 1) makes use of two measures ofatmospheric thermodynamic properties: the convective trig-
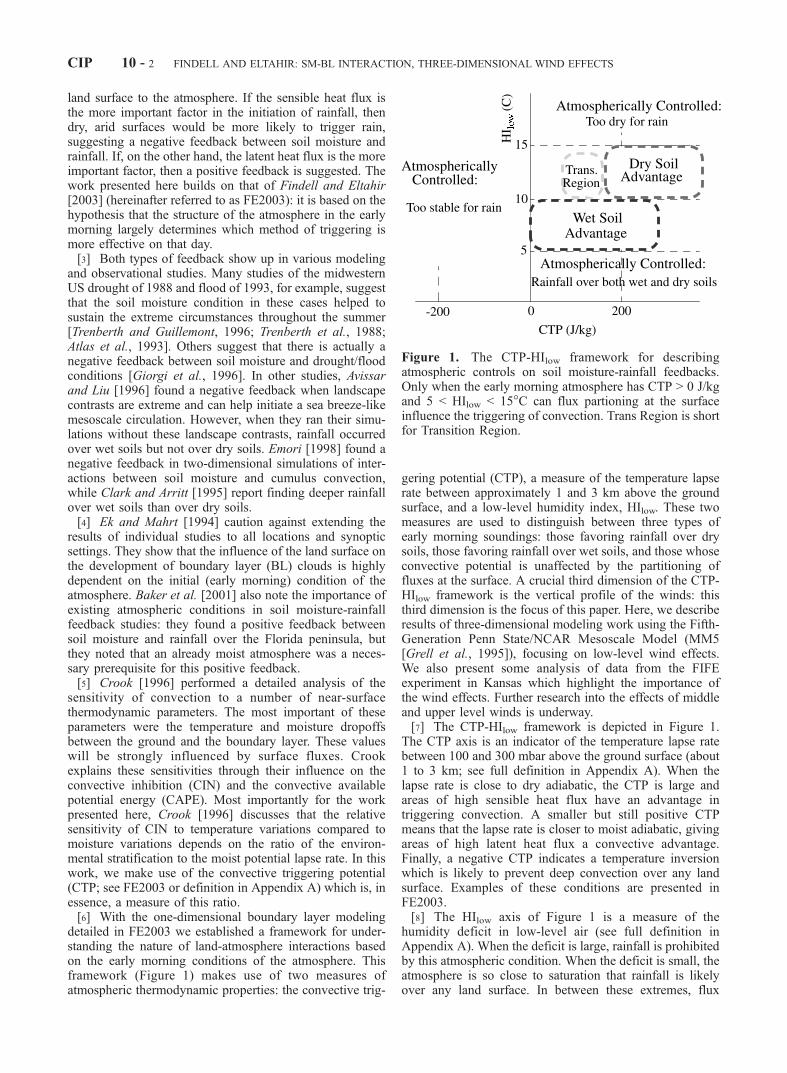
gering potential (CTP), a measure of the temperature lapserate between approximately 1 and 3 km above the groundsurface, and a low-level humidity index, HIlow. These twomeasures are used to distinguish between three types ofearly morning soundings: those favoring rainfall over drysoils, those favoring rainfall over wet soils, and those whoseconvective potential is unaffected by the partitioning offluxes at the surface. A crucial third dimension of the CTP-HIlow framework is the vertical profile of the winds: thisthird dimension is the focus of this paper. Here, we describeresults of three-dimensional modeling work using the Fifth-Generation Penn State/NCAR Mesoscale Model (MM5[Grell et al., 1995]), focusing on low-level wind effects.We also present some analysis of data from the FIFEexperiment in Kansas which highlight the importance ofthe wind effects. Further research into the effects of middleand upper level winds is underway.[7] The CTP-HIlow framework is depicted in Figure 1.
The CTP axis is an indicator of the temperature lapse ratebetween 100 and 300 mbar above the ground surface (about1 to 3 km; see full definition in Appendix A). When thelapse rate is close to dry adiabatic, the CTP is large andareas of high sensible heat flux have an advantage intriggering convection. A smaller but still positive CTPmeans that the lapse rate is closer to moist adiabatic, givingareas of high latent heat flux a convective advantage.Finally, a negative CTP indicates a temperature inversionwhich is likely to prevent deep convection over any landsurface. Examples of these conditions are presented inFE2003.[8] The HIlow axis of Figure 1 is a measure of the
humidity deficit in low-level air (see full definition inAppendix A). When the deficit is large, rainfall is prohibitedby this atmospheric condition. When the deficit is small, theatmosphere is so close to saturation that rainfall is likelyover any land surface. In between these extremes, flux
Figure 1. The CTP-HIlow framework for describingatmospheric controls on soil moisture-rainfall feedbacks.Only when the early morning atmosphere has CTP > 0 J/kgand 5 < HIlow < 15�C can flux partioning at the surfaceinfluence the triggering of convection. Trans Region is shortfor Transition Region.
CIP 10 - 2 FINDELL AND ELTAHIR: SM-BL INTERACTION, THREE-DIMENSIONAL WIND EFFECTS

partitioning at the land surface can greatly influence thedevelopment of convection. In moderately dry atmosphereshigh sensible heat flux is the best trigger of convection,while in moderately humid atmospheres large contributionsof humidity from the land surface can more effectivelytrigger convection. (See FE2003 for a more thoroughdescription.)[9] As briefly stated above, these descriptions of the
temperature and humidity controls on land-atmosphereinteractions were based on one-dimensional boundary layermodeling using individual soundings as the initial atmos-pheric profile. Nature, however, is three-dimensional, andthe most important 3D effects are captured by the winds: thewinds can also prohibit or enhance the likelihood of con-vection. This topic is the focus of the work presented here.In section 2 we will give a brief description of the MM5configuration used for 3D simulations. In section 3 we willpresent MM5 results for the atmospherically controlledregimes of CTP-HIlow space, highlighting how strong windshear can suppress convective development, while veeringwinds in the lowest 300 mbar can enhance it. In section 4we focus on the Wet Soil Advantage Regime and discusshow low-level backing winds can suppress convection. Insection 5 we focus on the Dry Soil Advantage Regime.Section 6 is a brief presentation of FIFE data in the contextof the CTP-HIlow framework. Finally, a brief discussion isgiven in section 7, followed by the conclusions of section 8.
2. Model Configuration
[10] Three-dimensional simulations were performedusing MM5, version 2.12 [Grell et al., 1995]. The model
runs detailed here were all run with a single-nested domaincentered over Illinois (Figure 2), near the Flatland site at40.0�N, 88.3�W [Angevine et al., 1998]. The simulationswere run on a 200 km by 200 km domain with a 2 kmhorizontal grid interval. Detailed analysis and comparisonswith observations were performed on the central 64 km by64 km portion, in order to be sufficiently far from anypotential boundary effects. Boundary effects may still reachthe interior of the domain, particularly at upper levels. Atlower levels, however, the land surface has significantinfluence on BL growth and development, and it is theseland surface influences that we are most interested in. Initialand boundary conditions were provided by Eta ModelAssimilated Data with a horizontal grid spacing of 40 km,a temporal resolution of three hours, and 25 vertical levels.The 25 vertical levels were on constant pressure surfacesbetween 1000 and 25 mbar, with 25 mbar intervals in thelowest 2.0 km and at the tropopause jet level, and 50 mbarintervals in the rest of the vertical domain [Rogers et al.,1995; Black, 1994]. Single-day simulations were initializedat 6 am using Eta Data for 98 days during the summers of1996–1999 and run through 9 pm. The questions addressedby these simulations concerned the interactions between theearly morning atmosphere and fluxes from the land surfaceand how these conditions impact the triggering and theamount of rainfall on a given day.[11] The choice of 2 km as the horizontal grid interval in
this study is a compromise between the desire for detailedsimulations and the constraints of computational efficiency.This length is smaller than the typical scale of individualconvective clouds (�5 km); hence, we resolve the scale ofsuch basic cloud entities. Initial multi-nested runs with
Figure 2. Model domain. Thick black line encloses full model domain (200 � 200 km); solid squarecovers focus region (64 � 64 km), which is entirely within the state of Illinois.
FINDELL AND ELTAHIR: SM-BL INTERACTION, THREE-DIMENSIONAL WIND EFFECTS CIP 10 - 3
outer nest grid interval ranging from 6 to 18 km on a sideindicated that results were dependent on the convectionscheme used. This is consistent with the work of Pal[1997] and Pan et al. [1996]. The current model config-uration was designed to remove the dependence on con-vection schemes and explicitly resolve vertical velocitiesand convective motion. A few initial experiments with a1 km grid interval in a single domain were far toocomputationally expensive, and did not produce signifi-cantly different results from experiments on the same dayswith a 2 km grid interval.[12] MM5 was configured with twenty-three vertical
levels between the 100 mbar top and the surface, includingten half-sigma levels below 0.67, which is near the top ofthe critical CTP region. The simulations run for this studyall used the mixed phase explicit moisture scheme, which isbuilt on Dudhia’s [1989] simple ice scheme, and alsoallows for snow and ice to exist at temperatures abovezero. A modified version of the CCM2 radiation scheme[Hack et al., 1993] was used. Both Kiehl et al. [1994] andHack [1998] found the need for improvements in thetreatment of clouds and their radiative properties in theCCM2 parameterization. Hack [1998] showed that smallimprovements in the cloud liquid water path and the clouddrop effective radius lead to substantial improvements inCCM2 performance. These two changes were also made inthe radiation code used in this work (see Findell [2001] fordetails).[13] The sensible and latent heat fluxes from the surface
are determined by the boundary layer parameterization. TheBlackadar planetary boundary layer (PBL) scheme used inMM5 is well documented by Zhang and Anthes [1982].Blackadar [1979] made a strong argument for the need for aPBL scheme with high vertical resolution in order toadequately model the transition from well-mixed daytimeconditions to stratified nighttime conditions, which are oftencharacterized by strong gradients of temperature, wind andmoisture. The MRF scheme (originally used in NCAR’sMedium-Range Forecast model [Hong and Pan, 1996;Troen and Mahrt, 1986]) is quite similar to the Blackadarscheme, except in its treatment of countergradient fluxesduring free convection. Early sensitivity studies showed thatthese MM5 experiments were not sensitive to changesbetween these two schemes. The results presented in thispaper are for simulations with the MRF BL scheme.[14] The version 2.x series of MM5 releases all treat soil
moisture with a moisture availability term that is dependenton vegetation type and season. The moisture availabilitydoes not change with evaporation or precipitation: it isconstant for the vegetation type throughout the course of asimulation. The land use type over the entire experimentaldomain is agriculture. The default moisture availability forthis vegetation class is 30%. Results presented here showmodel runs with wet conditions simulated using a moistureavailability of 80%, and dry conditions simulated using avalue of 10%. Though this treatment is crude, it is suitableto the task at hand for a number of reasons. First, ourprimary concern is the response of the growing boundarylayer to different fluxes from the land surface. A moreintricate land surface scheme would add many unnecessary(for the purposes of this study) layers of complexity to thecalculation of evapotranspiration. Second, on the time scale
of 15 hours it is not unreasonable to assume that the soilmoisture changes little, except in the event of rainfall overdry soils. (Clearly some drying will occur over the course ofa day, but the change from the very wet to the very dryconditions that we are considering typically takes on theorder of a week, if not longer.)[15] The distribution of domain averages of initial CTP
and HIlow from the 98 days simulated at both 10% and 80%moisture availability is not the same as the generallyobserved early morning CTP-HIlow distribution from Illi-nois. Sixty-eight cases were from the summer of 1996, ninewere from 1997, 14 were from 1998, and seven were from1999. Almost all days with data available from the summerof 1996 were simulated, both to cover the range ofobserved CTP-HIlow combinations and to provide ampledata for the comparisons with observed rainfall. Days fromother summers were specifically selected for their CTP-HIlow characteristics in order to better understand thebehavior in each of the regimes. This led to a greaterfrequency of days in the dry soil advantage regime in themodel runs than would typically be observed in a givensummer in Illinois.[16] The results from the simulations of these 98 days
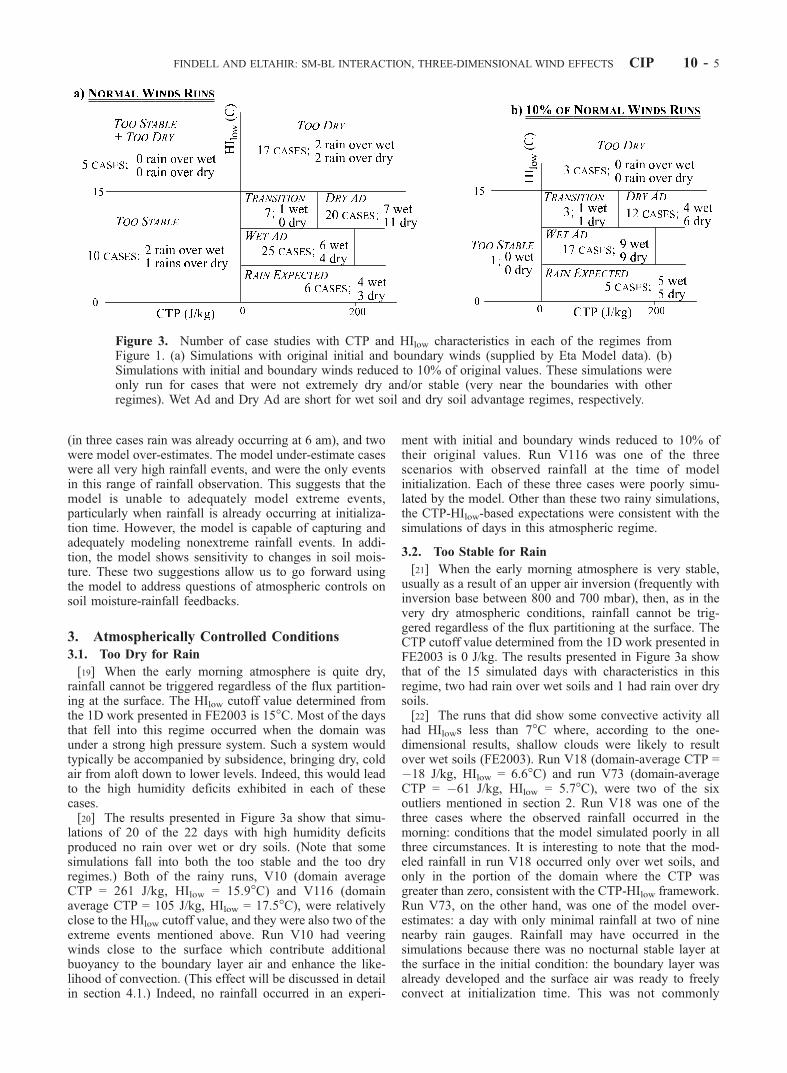
(196 simulations) are presented in the rest of this paper.Additional reduced-winds simulations were also performedover both wet and dry soils for 34 of these 98 days. In theseruns, the boundary and initial winds were set to 10% of theirobserved values, though calculated winds in the interior ofthe domain were not altered. This allowed us to isolate theeffects of strong winds and determine if rainfall occurrenceand depth changed in a systematic and understandablemanner when the influence of the winds was largelyremoved. Figure 3 shows the number of simulated dayswith initial conditions falling in each of the regimes of CTP-HIlow space for both the normal-wind runs and the reduced-wind runs. Figure 3 also shows how many of these cases ledto rain over wet soils and how many led to rain over drysoils.[17] Simple comparisons between atmospheric sounding
data from the Flatland Boundary Layer Experiments [Ange-vine et al., 1998] and profiles at the model grid point closestto the Flatland site showed that the observations of temper-ature and humidity in the boundary layer tended to fall on orbetween the values simulated by the wet soil and the drysoil simulations. Potential temperature was consistently wellsimulated, but on some days the humidity was well-mixedin the simulated boundary layers but decreased between thesurface and the top of the BL in the observations. Since thisbehavior was not always observed in the Flatland data, andsince we were not trying to re-create individual stormevents, we did not tune the model to improve our simu-lations on these days. These comparisons suggest that themodeled BL is sensitive to changes in surface properties,and that the range of sensitivity demonstrated by the modelis consistent with the range observed in Illinois.[18] A comparison of modeled and observed rainfall for
the 68 cases from 1996 is given by Findell [2001]. Of these68 cases, the rainfall in 62 cases was simulated reasonablywell by at least one of the two simulations for the day ofinterest: the r2 between modeled-to-observed rainfall was72.8% for the wet soil runs and 41.4% for the dry soil runs.Four of the six poor-performers were model under-estimates
CIP 10 - 4 FINDELL AND ELTAHIR: SM-BL INTERACTION, THREE-DIMENSIONAL WIND EFFECTS
(in three cases rain was already occurring at 6 am), and twowere model over-estimates. The model under-estimate caseswere all very high rainfall events, and were the only eventsin this range of rainfall observation. This suggests that themodel is unable to adequately model extreme events,particularly when rainfall is already occurring at initializa-tion time. However, the model is capable of capturing andadequately modeling nonextreme rainfall events. In addi-tion, the model shows sensitivity to changes in soil mois-ture. These two suggestions allow us to go forward usingthe model to address questions of atmospheric controls onsoil moisture-rainfall feedbacks.
3. Atmospherically Controlled Conditions
3.1. Too Dry for Rain
[19] When the early morning atmosphere is quite dry,rainfall cannot be triggered regardless of the flux partition-ing at the surface. The HIlow cutoff value determined fromthe 1D work presented in FE2003 is 15�C. Most of the daysthat fell into this regime occurred when the domain wasunder a strong high pressure system. Such a system wouldtypically be accompanied by subsidence, bringing dry, coldair from aloft down to lower levels. Indeed, this would leadto the high humidity deficits exhibited in each of thesecases.[20] The results presented in Figure 3a show that simu-
lations of 20 of the 22 days with high humidity deficitsproduced no rain over wet or dry soils. (Note that somesimulations fall into both the too stable and the too dryregimes.) Both of the rainy runs, V10 (domain averageCTP = 261 J/kg, HIlow = 15.9�C) and V116 (domainaverage CTP = 105 J/kg, HIlow = 17.5�C), were relativelyclose to the HIlow cutoff value, and they were also two of theextreme events mentioned above. Run V10 had veeringwinds close to the surface which contribute additionalbuoyancy to the boundary layer air and enhance the like-lihood of convection. (This effect will be discussed in detailin section 4.1.) Indeed, no rainfall occurred in an experi-
ment with initial and boundary winds reduced to 10% oftheir original values. Run V116 was one of the threescenarios with observed rainfall at the time of modelinitialization. Each of these three cases were poorly simu-lated by the model. Other than these two rainy simulations,the CTP-HIlow-based expectations were consistent with thesimulations of days in this atmospheric regime.
3.2. Too Stable for Rain
[21] When the early morning atmosphere is very stable,usually as a result of an upper air inversion (frequently withinversion base between 800 and 700 mbar), then, as in thevery dry atmospheric conditions, rainfall cannot be trig-gered regardless of the flux partitioning at the surface. TheCTP cutoff value determined from the 1D work presented inFE2003 is 0 J/kg. The results presented in Figure 3a showthat of the 15 simulated days with characteristics in thisregime, two had rain over wet soils and 1 had rain over drysoils.[22] The runs that did show some convective activity all
had HIlows less than 7�C where, according to the one-dimensional results, shallow clouds were likely to resultover wet soils (FE2003). Run V18 (domain-average CTP =�18 J/kg, HIlow = 6.6�C) and run V73 (domain-averageCTP = �61 J/kg, HIlow = 5.7�C), were two of the sixoutliers mentioned in section 2. Run V18 was one of thethree cases where the observed rainfall occurred in themorning: conditions that the model simulated poorly in allthree circumstances. It is interesting to note that the mod-eled rainfall in run V18 occurred only over wet soils, andonly in the portion of the domain where the CTP wasgreater than zero, consistent with the CTP-HIlow framework.Run V73, on the other hand, was one of the model over-estimates: a day with only minimal rainfall at two of ninenearby rain gauges. Rainfall may have occurred in thesimulations because there was no nocturnal stable layer atthe surface in the initial condition: the boundary layer wasalready developed and the surface air was ready to freelyconvect at initialization time. This was not commonly
Figure 3. Number of case studies with CTP and HIlow characteristics in each of the regimes fromFigure 1. (a) Simulations with original initial and boundary winds (supplied by Eta Model data). (b)Simulations with initial and boundary winds reduced to 10% of original values. These simulations wereonly run for cases that were not extremely dry and/or stable (very near the boundaries with otherregimes). Wet Ad and Dry Ad are short for wet soil and dry soil advantage regimes, respectively.
FINDELL AND ELTAHIR: SM-BL INTERACTION, THREE-DIMENSIONAL WIND EFFECTS CIP 10 - 5

observed in the initial conditions for these MM5 runs, andthe model did not deal well with these conditions.
3.3. Rainfall Expected Regime
[23] Rainfall is expected over both wet and dry soilswhen the early morning atmosphere is close to saturation(HIlow < 5�C) and exhibits some degree of instability (CTP >
0 J/kg). Figures 3a and 4 show that the MM5 results do notfit the 1D-based expectations for this regime as closely asanticipated. Despite domain-average instability and verylow humidity deficits, two of six cases show no rain overeither wet or dry soils, and one rains only over wet soils.Note that the total rainfall depth was greater over wet soilsthan over dry soils in three of the four cases with rain. On
Figure 4. Outcome of the MM5 simulations with initial conditions falling in the rainfall expectedregion (HIlow < 5�C, CTP > 0 J/kg). Symbols in top plot represent rain (stars), shallow clouds (triangles),or no convection (crosses). When the symbol is surrounded by a circle, this outcome occurred over wetsoils only; when surrounded by a square, this outcome occurred over dry soils only; when the symbol isnot enclosed by either a circle or a square, this outcome occurred over both wet and dry soils. Bottom plotshows rainfall depths in runs with wet soils (dark bars) and in runs with dry soils (light bars).
CIP 10 - 6 FINDELL AND ELTAHIR: SM-BL INTERACTION, THREE-DIMENSIONAL WIND EFFECTS
average, the domain-average rainfall was 0.65 cm over wetsoils, but only 0.48 cm over dry soils. In the cases whererainfall occurred in at least one of the soil moisture cases,rain over the wet soils was 0.98 cm, but only 0.71 cm overthe dry soils. This is consistent with the results from the 1Dwork showing higher CAPEs over wet soils (FE2003), sincehigher CAPEs are typically associated with higher rainfalldepths [Eltahir and Pal, 1996].[24] In the six scenarios that fall in this rainfall expected
regime, the main differences between the runs with rain andthose without is in the vertical profile of the winds. Thenext section highlights two cases to show that stronglysheared winds can suppress convection, and that veeringwinds can enhance convection. These two cases have similarCTP and HIlow values, but markedly different wind profiles.The discussion of the wet soil advantage regime results(section 4) includes specifics of cases which demonstratethat strongly backing winds can also suppress convection.[25] Both runs V42 and V22 fall well within the interior of
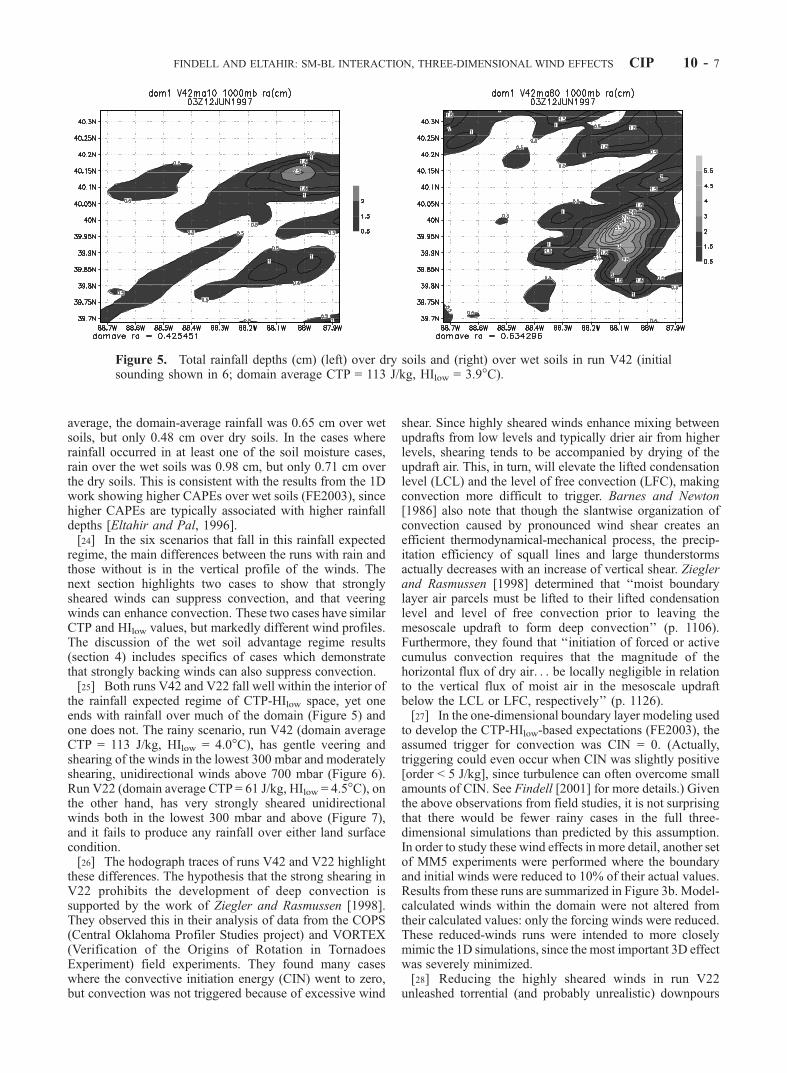
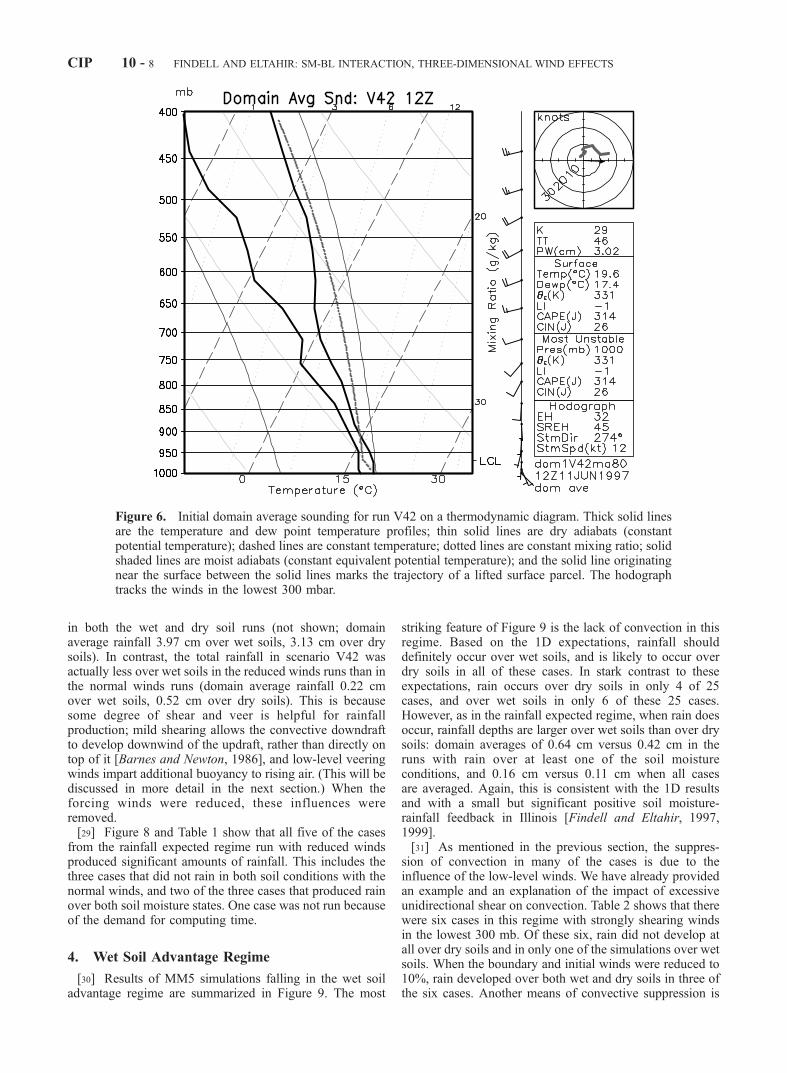
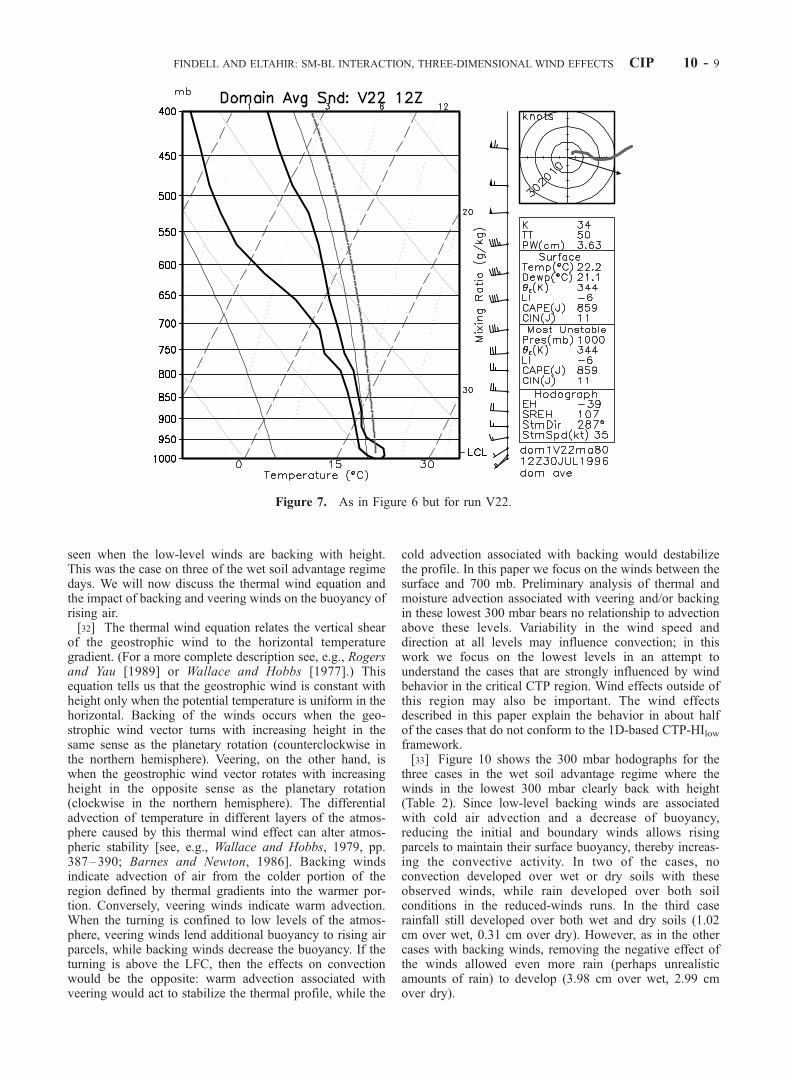
the rainfall expected regime of CTP-HIlow space, yet oneends with rainfall over much of the domain (Figure 5) andone does not. The rainy scenario, run V42 (domain averageCTP = 113 J/kg, HIlow = 4.0�C), has gentle veering andshearing of the winds in the lowest 300 mbar and moderatelyshearing, unidirectional winds above 700 mbar (Figure 6).Run V22 (domain average CTP = 61 J/kg, HIlow = 4.5�C), onthe other hand, has very strongly sheared unidirectionalwinds both in the lowest 300 mbar and above (Figure 7),and it fails to produce any rainfall over either land surfacecondition.[26] The hodograph traces of runs V42 and V22 highlight
these differences. The hypothesis that the strong shearing inV22 prohibits the development of deep convection issupported by the work of Ziegler and Rasmussen [1998].They observed this in their analysis of data from the COPS(Central Oklahoma Profiler Studies project) and VORTEX(Verification of the Origins of Rotation in TornadoesExperiment) field experiments. They found many caseswhere the convective initiation energy (CIN) went to zero,but convection was not triggered because of excessive wind
shear. Since highly sheared winds enhance mixing betweenupdrafts from low levels and typically drier air from higherlevels, shearing tends to be accompanied by drying of theupdraft air. This, in turn, will elevate the lifted condensationlevel (LCL) and the level of free convection (LFC), makingconvection more difficult to trigger. Barnes and Newton[1986] also note that though the slantwise organization ofconvection caused by pronounced wind shear creates anefficient thermodynamical-mechanical process, the precip-itation efficiency of squall lines and large thunderstormsactually decreases with an increase of vertical shear. Zieglerand Rasmussen [1998] determined that ‘‘moist boundarylayer air parcels must be lifted to their lifted condensationlevel and level of free convection prior to leaving themesoscale updraft to form deep convection’’ (p. 1106).Furthermore, they found that ‘‘initiation of forced or activecumulus convection requires that the magnitude of thehorizontal flux of dry air. . . be locally negligible in relationto the vertical flux of moist air in the mesoscale updraftbelow the LCL or LFC, respectively’’ (p. 1126).[27] In the one-dimensional boundary layer modeling used
to develop the CTP-HIlow-based expectations (FE2003), theassumed trigger for convection was CIN = 0. (Actually,triggering could even occur when CIN was slightly positive[order < 5 J/kg], since turbulence can often overcome smallamounts of CIN. See Findell [2001] for more details.) Giventhe above observations from field studies, it is not surprisingthat there would be fewer rainy cases in the full three-dimensional simulations than predicted by this assumption.In order to study these wind effects in more detail, another setof MM5 experiments were performed where the boundaryand initial winds were reduced to 10% of their actual values.Results from these runs are summarized in Figure 3b. Model-calculated winds within the domain were not altered fromtheir calculated values: only the forcing winds were reduced.These reduced-winds runs were intended to more closelymimic the 1D simulations, since the most important 3D effectwas severely minimized.[28] Reducing the highly sheared winds in run V22
unleashed torrential (and probably unrealistic) downpours
Figure 5. Total rainfall depths (cm) (left) over dry soils and (right) over wet soils in run V42 (initialsounding shown in 6; domain average CTP = 113 J/kg, HIlow = 3.9�C).
FINDELL AND ELTAHIR: SM-BL INTERACTION, THREE-DIMENSIONAL WIND EFFECTS CIP 10 - 7
in both the wet and dry soil runs (not shown; domainaverage rainfall 3.97 cm over wet soils, 3.13 cm over drysoils). In contrast, the total rainfall in scenario V42 wasactually less over wet soils in the reduced winds runs than inthe normal winds runs (domain average rainfall 0.22 cmover wet soils, 0.52 cm over dry soils). This is becausesome degree of shear and veer is helpful for rainfallproduction; mild shearing allows the convective downdraftto develop downwind of the updraft, rather than directly ontop of it [Barnes and Newton, 1986], and low-level veeringwinds impart additional buoyancy to rising air. (This will bediscussed in more detail in the next section.) When theforcing winds were reduced, these influences wereremoved.[29] Figure 8 and Table 1 show that all five of the cases
from the rainfall expected regime run with reduced windsproduced significant amounts of rainfall. This includes thethree cases that did not rain in both soil conditions with thenormal winds, and two of the three cases that produced rainover both soil moisture states. One case was not run becauseof the demand for computing time.
4. Wet Soil Advantage Regime
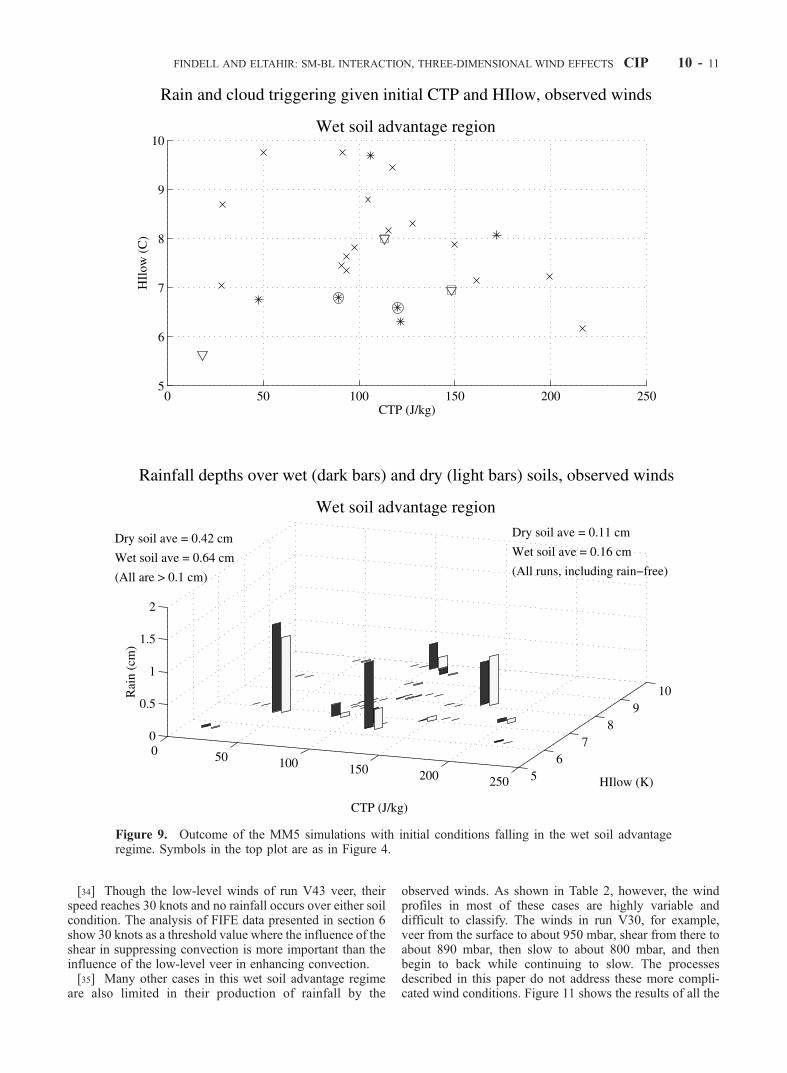
[30] Results of MM5 simulations falling in the wet soiladvantage regime are summarized in Figure 9. The most
striking feature of Figure 9 is the lack of convection in thisregime. Based on the 1D expectations, rainfall shoulddefinitely occur over wet soils, and is likely to occur overdry soils in all of these cases. In stark contrast to theseexpectations, rain occurs over dry soils in only 4 of 25cases, and over wet soils in only 6 of these 25 cases.However, as in the rainfall expected regime, when rain doesoccur, rainfall depths are larger over wet soils than over drysoils: domain averages of 0.64 cm versus 0.42 cm in theruns with rain over at least one of the soil moistureconditions, and 0.16 cm versus 0.11 cm when all casesare averaged. Again, this is consistent with the 1D resultsand with a small but significant positive soil moisture-rainfall feedback in Illinois [Findell and Eltahir, 1997,1999].[31] As mentioned in the previous section, the suppres-
sion of convection in many of the cases is due to theinfluence of the low-level winds. We have already providedan example and an explanation of the impact of excessiveunidirectional shear on convection. Table 2 shows that therewere six cases in this regime with strongly shearing windsin the lowest 300 mb. Of these six, rain did not develop atall over dry soils and in only one of the simulations over wetsoils. When the boundary and initial winds were reduced to10%, rain developed over both wet and dry soils in three ofthe six cases. Another means of convective suppression is
Figure 6. Initial domain average sounding for run V42 on a thermodynamic diagram. Thick solid linesare the temperature and dew point temperature profiles; thin solid lines are dry adiabats (constantpotential temperature); dashed lines are constant temperature; dotted lines are constant mixing ratio; solidshaded lines are moist adiabats (constant equivalent potential temperature); and the solid line originatingnear the surface between the solid lines marks the trajectory of a lifted surface parcel. The hodographtracks the winds in the lowest 300 mbar.
CIP 10 - 8 FINDELL AND ELTAHIR: SM-BL INTERACTION, THREE-DIMENSIONAL WIND EFFECTS
seen when the low-level winds are backing with height.This was the case on three of the wet soil advantage regimedays. We will now discuss the thermal wind equation andthe impact of backing and veering winds on the buoyancy ofrising air.[32] The thermal wind equation relates the vertical shear
of the geostrophic wind to the horizontal temperaturegradient. (For a more complete description see, e.g., Rogersand Yau [1989] or Wallace and Hobbs [1977].) Thisequation tells us that the geostrophic wind is constant withheight only when the potential temperature is uniform in thehorizontal. Backing of the winds occurs when the geo-strophic wind vector turns with increasing height in thesame sense as the planetary rotation (counterclockwise inthe northern hemisphere). Veering, on the other hand, iswhen the geostrophic wind vector rotates with increasingheight in the opposite sense as the planetary rotation(clockwise in the northern hemisphere). The differentialadvection of temperature in different layers of the atmos-phere caused by this thermal wind effect can alter atmos-pheric stability [see, e.g., Wallace and Hobbs, 1979, pp.387–390; Barnes and Newton, 1986]. Backing windsindicate advection of air from the colder portion of theregion defined by thermal gradients into the warmer por-tion. Conversely, veering winds indicate warm advection.When the turning is confined to low levels of the atmos-phere, veering winds lend additional buoyancy to rising airparcels, while backing winds decrease the buoyancy. If theturning is above the LFC, then the effects on convectionwould be the opposite: warm advection associated withveering would act to stabilize the thermal profile, while the
cold advection associated with backing would destabilizethe profile. In this paper we focus on the winds between thesurface and 700 mb. Preliminary analysis of thermal andmoisture advection associated with veering and/or backingin these lowest 300 mbar bears no relationship to advectionabove these levels. Variability in the wind speed anddirection at all levels may influence convection; in thiswork we focus on the lowest levels in an attempt tounderstand the cases that are strongly influenced by windbehavior in the critical CTP region. Wind effects outside ofthis region may also be important. The wind effectsdescribed in this paper explain the behavior in about halfof the cases that do not conform to the 1D-based CTP-HIlowframework.[33] Figure 10 shows the 300 mbar hodographs for the
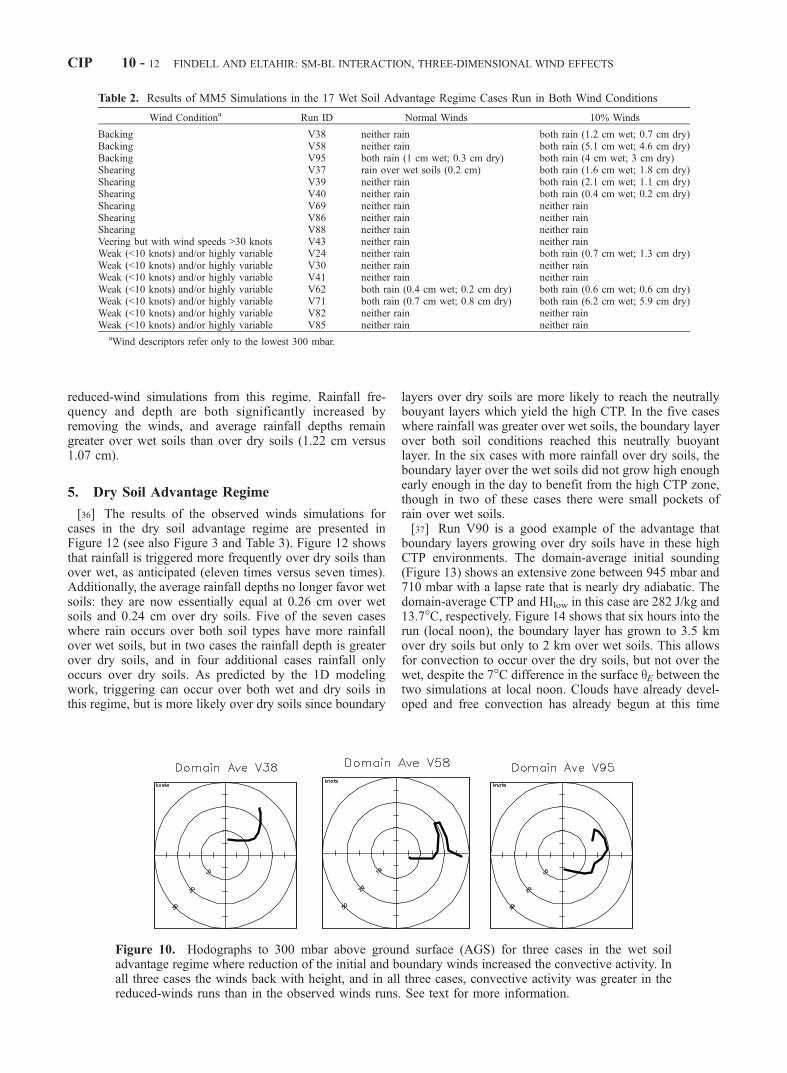
three cases in the wet soil advantage regime where thewinds in the lowest 300 mbar clearly back with height(Table 2). Since low-level backing winds are associatedwith cold air advection and a decrease of buoyancy,reducing the initial and boundary winds allows risingparcels to maintain their surface buoyancy, thereby increas-ing the convective activity. In two of the cases, noconvection developed over wet or dry soils with theseobserved winds, while rain developed over both soilconditions in the reduced-winds runs. In the third caserainfall still developed over both wet and dry soils (1.02cm over wet, 0.31 cm over dry). However, as in the othercases with backing winds, removing the negative effect ofthe winds allowed even more rain (perhaps unrealisticamounts of rain) to develop (3.98 cm over wet, 2.99 cmover dry).
Figure 7. As in Figure 6 but for run V22.
FINDELL AND ELTAHIR: SM-BL INTERACTION, THREE-DIMENSIONAL WIND EFFECTS CIP 10 - 9
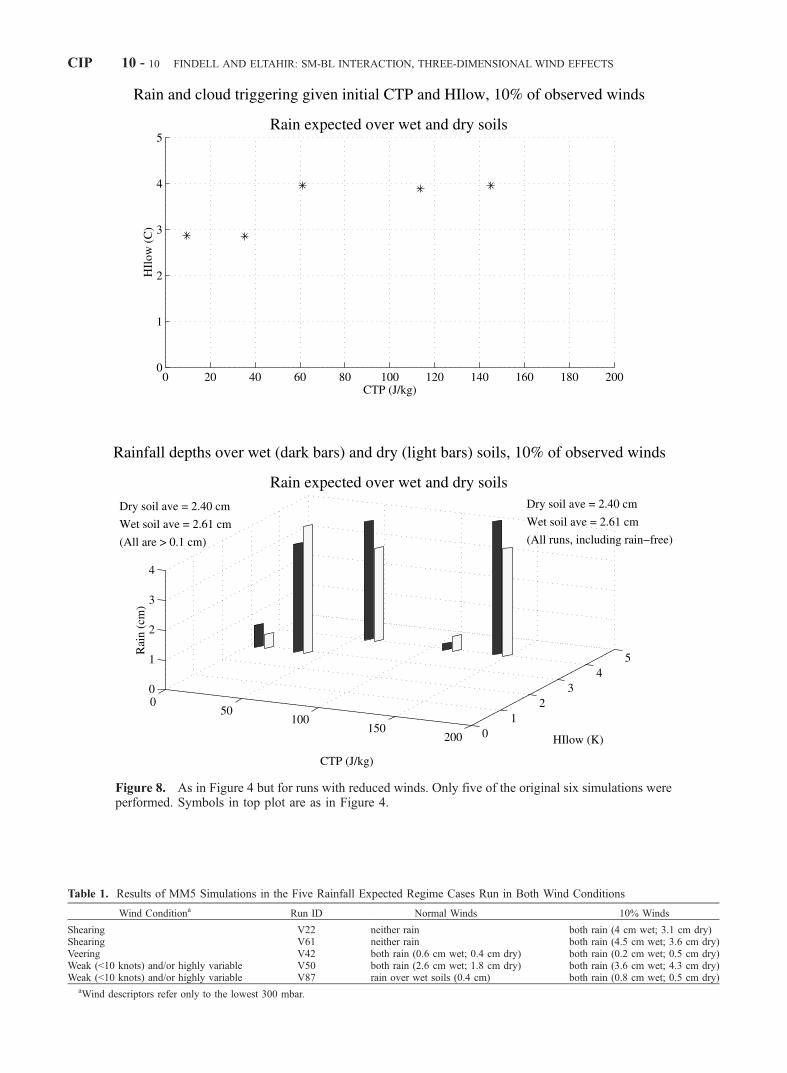
Figure 8. As in Figure 4 but for runs with reduced winds. Only five of the original six simulations wereperformed. Symbols in top plot are as in Figure 4.
Table 1. Results of MM5 Simulations in the Five Rainfall Expected Regime Cases Run in Both Wind Conditions
Wind Conditiona Run ID Normal Winds 10% Winds
Shearing V22 neither rain both rain (4 cm wet; 3.1 cm dry)Shearing V61 neither rain both rain (4.5 cm wet; 3.6 cm dry)Veering V42 both rain (0.6 cm wet; 0.4 cm dry) both rain (0.2 cm wet; 0.5 cm dry)Weak (<10 knots) and/or highly variable V50 both rain (2.6 cm wet; 1.8 cm dry) both rain (3.6 cm wet; 4.3 cm dry)Weak (<10 knots) and/or highly variable V87 rain over wet soils (0.4 cm) both rain (0.8 cm wet; 0.5 cm dry)
aWind descriptors refer only to the lowest 300 mbar.
CIP 10 - 10 FINDELL AND ELTAHIR: SM-BL INTERACTION, THREE-DIMENSIONAL WIND EFFECTS
[34] Though the low-level winds of run V43 veer, theirspeed reaches 30 knots and no rainfall occurs over either soilcondition. The analysis of FIFE data presented in section 6show 30 knots as a threshold value where the influence of theshear in suppressing convection is more important than theinfluence of the low-level veer in enhancing convection.[35] Many other cases in this wet soil advantage regime
are also limited in their production of rainfall by the
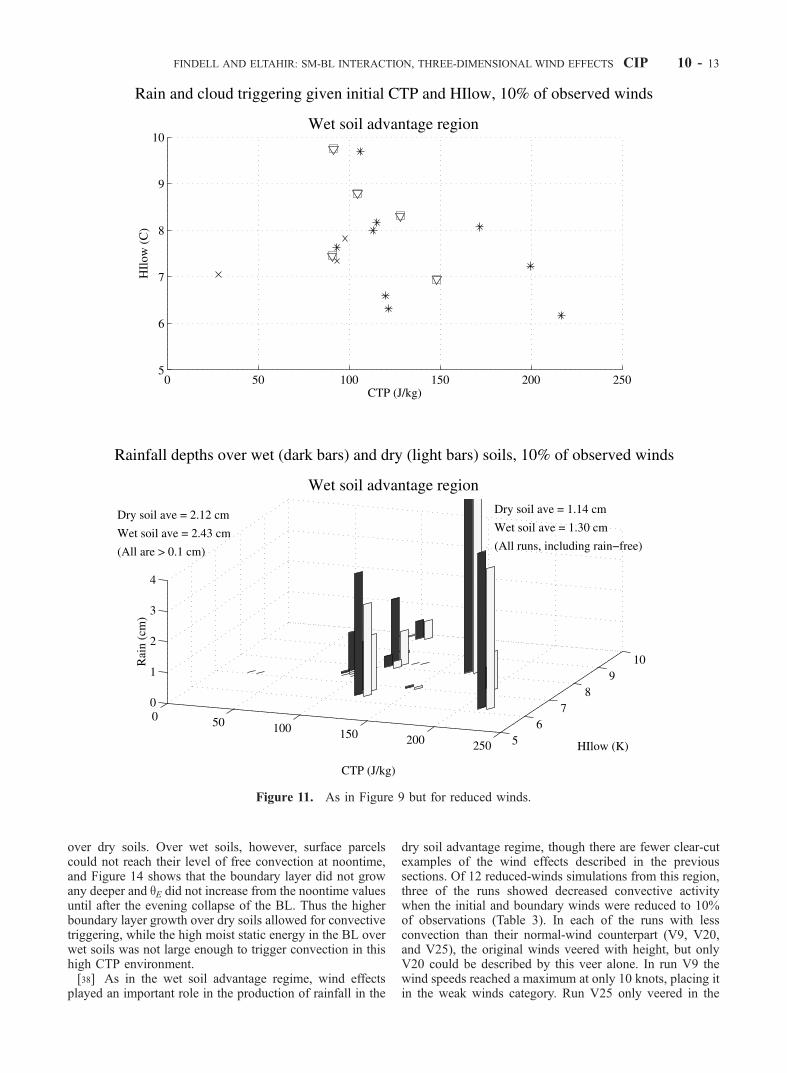
observed winds. As shown in Table 2, however, the windprofiles in most of these cases are highly variable anddifficult to classify. The winds in run V30, for example,veer from the surface to about 950 mbar, shear from there toabout 890 mbar, then slow to about 800 mbar, and thenbegin to back while continuing to slow. The processesdescribed in this paper do not address these more compli-cated wind conditions. Figure 11 shows the results of all the
Figure 9. Outcome of the MM5 simulations with initial conditions falling in the wet soil advantageregime. Symbols in the top plot are as in Figure 4.
FINDELL AND ELTAHIR: SM-BL INTERACTION, THREE-DIMENSIONAL WIND EFFECTS CIP 10 - 11
reduced-wind simulations from this regime. Rainfall fre-quency and depth are both significantly increased byremoving the winds, and average rainfall depths remaingreater over wet soils than over dry soils (1.22 cm versus1.07 cm).
5. Dry Soil Advantage Regime
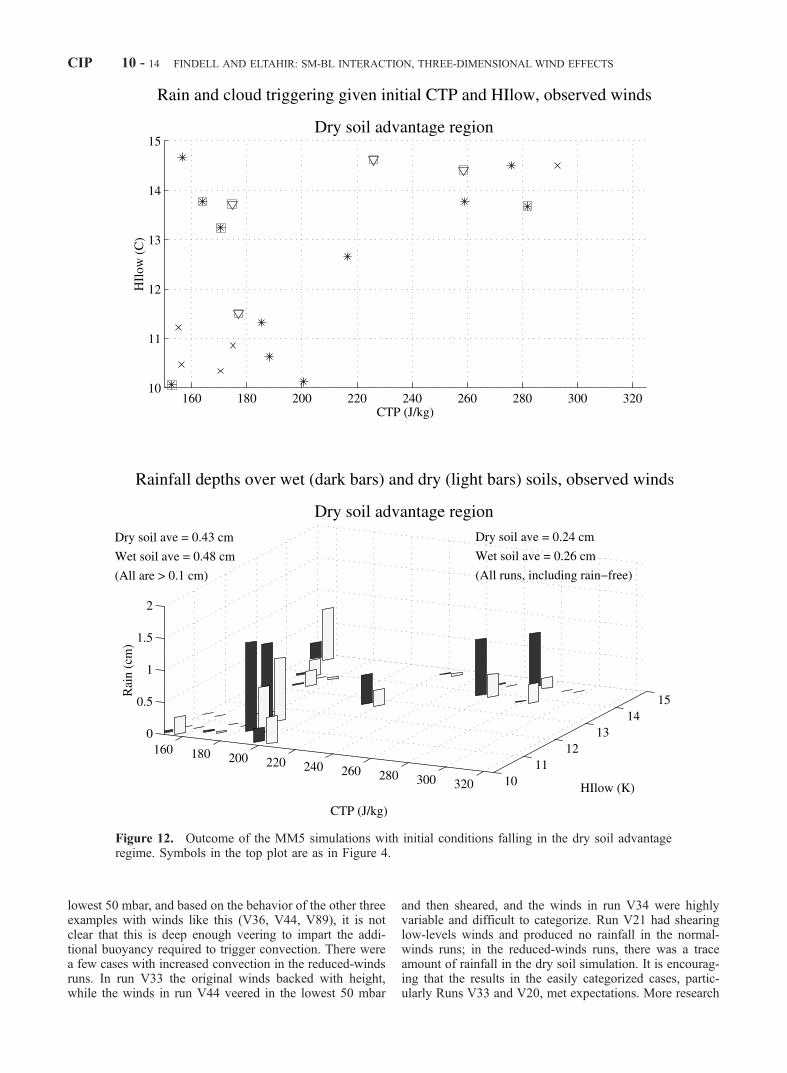
[36] The results of the observed winds simulations forcases in the dry soil advantage regime are presented inFigure 12 (see also Figure 3 and Table 3). Figure 12 showsthat rainfall is triggered more frequently over dry soils thanover wet, as anticipated (eleven times versus seven times).Additionally, the average rainfall depths no longer favor wetsoils: they are now essentially equal at 0.26 cm over wetsoils and 0.24 cm over dry soils. Five of the seven caseswhere rain occurs over both soil types have more rainfallover wet soils, but in two cases the rainfall depth is greaterover dry soils, and in four additional cases rainfall onlyoccurs over dry soils. As predicted by the 1D modelingwork, triggering can occur over both wet and dry soils inthis regime, but is more likely over dry soils since boundary
layers over dry soils are more likely to reach the neutrallybouyant layers which yield the high CTP. In the five caseswhere rainfall was greater over wet soils, the boundary layerover both soil conditions reached this neutrally buoyantlayer. In the six cases with more rainfall over dry soils, theboundary layer over the wet soils did not grow high enoughearly enough in the day to benefit from the high CTP zone,though in two of these cases there were small pockets ofrain over wet soils.[37] Run V90 is a good example of the advantage that
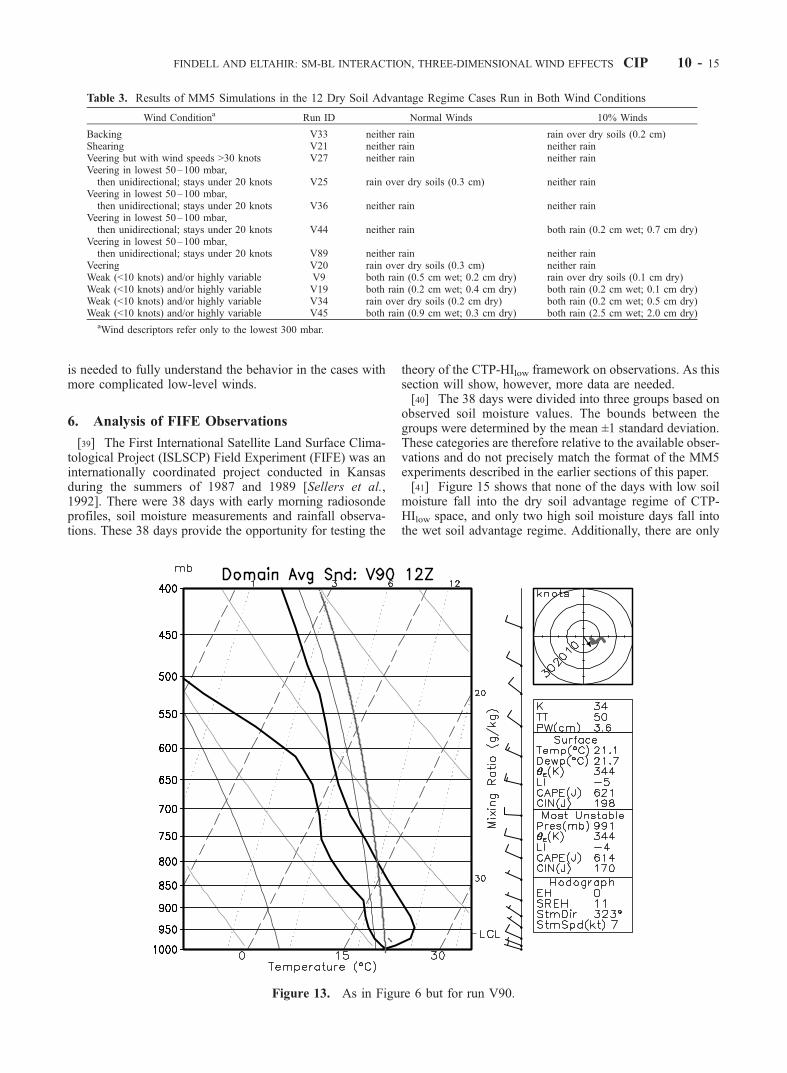
boundary layers growing over dry soils have in these highCTP environments. The domain-average initial sounding(Figure 13) shows an extensive zone between 945 mbar and710 mbar with a lapse rate that is nearly dry adiabatic. Thedomain-average CTP and HIlow in this case are 282 J/kg and13.7�C, respectively. Figure 14 shows that six hours into therun (local noon), the boundary layer has grown to 3.5 kmover dry soils but only to 2 km over wet soils. This allowsfor convection to occur over the dry soils, but not over thewet, despite the 7�C difference in the surface qE between thetwo simulations at local noon. Clouds have already devel-oped and free convection has already begun at this time
Table 2. Results of MM5 Simulations in the 17 Wet Soil Advantage Regime Cases Run in Both Wind Conditions
Wind Conditiona Run ID Normal Winds 10% Winds
Backing V38 neither rain both rain (1.2 cm wet; 0.7 cm dry)Backing V58 neither rain both rain (5.1 cm wet; 4.6 cm dry)Backing V95 both rain (1 cm wet; 0.3 cm dry) both rain (4 cm wet; 3 cm dry)Shearing V37 rain over wet soils (0.2 cm) both rain (1.6 cm wet; 1.8 cm dry)Shearing V39 neither rain both rain (2.1 cm wet; 1.1 cm dry)Shearing V40 neither rain both rain (0.4 cm wet; 0.2 cm dry)Shearing V69 neither rain neither rainShearing V86 neither rain neither rainShearing V88 neither rain neither rainVeering but with wind speeds >30 knots V43 neither rain neither rainWeak (<10 knots) and/or highly variable V24 neither rain both rain (0.7 cm wet; 1.3 cm dry)Weak (<10 knots) and/or highly variable V30 neither rain neither rainWeak (<10 knots) and/or highly variable V41 neither rain neither rainWeak (<10 knots) and/or highly variable V62 both rain (0.4 cm wet; 0.2 cm dry) both rain (0.6 cm wet; 0.6 cm dry)Weak (<10 knots) and/or highly variable V71 both rain (0.7 cm wet; 0.8 cm dry) both rain (6.2 cm wet; 5.9 cm dry)Weak (<10 knots) and/or highly variable V82 neither rain neither rainWeak (<10 knots) and/or highly variable V85 neither rain neither rain
aWind descriptors refer only to the lowest 300 mbar.
Figure 10. Hodographs to 300 mbar above ground surface (AGS) for three cases in the wet soiladvantage regime where reduction of the initial and boundary winds increased the convective activity. Inall three cases the winds back with height, and in all three cases, convective activity was greater in thereduced-winds runs than in the observed winds runs. See text for more information.
CIP 10 - 12 FINDELL AND ELTAHIR: SM-BL INTERACTION, THREE-DIMENSIONAL WIND EFFECTS
over dry soils. Over wet soils, however, surface parcelscould not reach their level of free convection at noontime,and Figure 14 shows that the boundary layer did not growany deeper and qE did not increase from the noontime valuesuntil after the evening collapse of the BL. Thus the higherboundary layer growth over dry soils allowed for convectivetriggering, while the high moist static energy in the BL overwet soils was not large enough to trigger convection in thishigh CTP environment.[38] As in the wet soil advantage regime, wind effects
played an important role in the production of rainfall in the
dry soil advantage regime, though there are fewer clear-cutexamples of the wind effects described in the previoussections. Of 12 reduced-winds simulations from this region,three of the runs showed decreased convective activitywhen the initial and boundary winds were reduced to 10%of observations (Table 3). In each of the runs with lessconvection than their normal-wind counterpart (V9, V20,and V25), the original winds veered with height, but onlyV20 could be described by this veer alone. In run V9 thewind speeds reached a maximum at only 10 knots, placing itin the weak winds category. Run V25 only veered in the
Figure 11. As in Figure 9 but for reduced winds.
FINDELL AND ELTAHIR: SM-BL INTERACTION, THREE-DIMENSIONAL WIND EFFECTS CIP 10 - 13
lowest 50 mbar, and based on the behavior of the other threeexamples with winds like this (V36, V44, V89), it is notclear that this is deep enough veering to impart the addi-tional buoyancy required to trigger convection. There werea few cases with increased convection in the reduced-windsruns. In run V33 the original winds backed with height,while the winds in run V44 veered in the lowest 50 mbar
and then sheared, and the winds in run V34 were highlyvariable and difficult to categorize. Run V21 had shearinglow-levels winds and produced no rainfall in the normal-winds runs; in the reduced-winds runs, there was a traceamount of rainfall in the dry soil simulation. It is encourag-ing that the results in the easily categorized cases, partic-ularly Runs V33 and V20, met expectations. More research
Figure 12. Outcome of the MM5 simulations with initial conditions falling in the dry soil advantageregime. Symbols in the top plot are as in Figure 4.
CIP 10 - 14 FINDELL AND ELTAHIR: SM-BL INTERACTION, THREE-DIMENSIONAL WIND EFFECTS
is needed to fully understand the behavior in the cases withmore complicated low-level winds.
6. Analysis of FIFE Observations
[39] The First International Satellite Land Surface Clima-tological Project (ISLSCP) Field Experiment (FIFE) was aninternationally coordinated project conducted in Kansasduring the summers of 1987 and 1989 [Sellers et al.,1992]. There were 38 days with early morning radiosondeprofiles, soil moisture measurements and rainfall observa-tions. These 38 days provide the opportunity for testing the
theory of the CTP-HIlow framework on observations. As thissection will show, however, more data are needed.[40] The 38 days were divided into three groups based on
observed soil moisture values. The bounds between thegroups were determined by the mean ±1 standard deviation.These categories are therefore relative to the available obser-vations and do not precisely match the format of the MM5experiments described in the earlier sections of this paper.[41] Figure 15 shows that none of the days with low soil
moisture fall into the dry soil advantage regime of CTP-HIlow space, and only two high soil moisture days fall intothe wet soil advantage regime. Additionally, there are only
Table 3. Results of MM5 Simulations in the 12 Dry Soil Advantage Regime Cases Run in Both Wind Conditions
Wind Conditiona Run ID Normal Winds 10% Winds
Backing V33 neither rain rain over dry soils (0.2 cm)Shearing V21 neither rain neither rainVeering but with wind speeds >30 knots V27 neither rain neither rainVeering in lowest 50–100 mbar,then unidirectional; stays under 20 knots V25 rain over dry soils (0.3 cm) neither rain
Veering in lowest 50–100 mbar,then unidirectional; stays under 20 knots V36 neither rain neither rain
Veering in lowest 50–100 mbar,then unidirectional; stays under 20 knots V44 neither rain both rain (0.2 cm wet; 0.7 cm dry)
Veering in lowest 50–100 mbar,then unidirectional; stays under 20 knots V89 neither rain neither rain
Veering V20 rain over dry soils (0.3 cm) neither rainWeak (<10 knots) and/or highly variable V9 both rain (0.5 cm wet; 0.2 cm dry) rain over dry soils (0.1 cm dry)Weak (<10 knots) and/or highly variable V19 both rain (0.2 cm wet; 0.4 cm dry) both rain (0.2 cm wet; 0.1 cm dry)Weak (<10 knots) and/or highly variable V34 rain over dry soils (0.2 cm dry) both rain (0.2 cm wet; 0.5 cm dry)Weak (<10 knots) and/or highly variable V45 both rain (0.9 cm wet; 0.3 cm dry) both rain (2.5 cm wet; 2.0 cm dry)
aWind descriptors refer only to the lowest 300 mbar.
Figure 13. As in Figure 6 but for run V90.
FINDELL AND ELTAHIR: SM-BL INTERACTION, THREE-DIMENSIONAL WIND EFFECTS CIP 10 - 15

six days with rainfall greater than 5 mm (averaged over asmany as 42 rain gauges), and four of these six have anHIlow significantly larger than 15�C. However, each ofthese four days had low-level veering winds. As explained
in section 4.1, this should enhance buoyancy and helpovercome the high humidity deficit. Indeed, five days hadwinds that veered in the lowest 300 mbar at speeds under 30knots, and rainfall occurred on all of these days, though on
Figure 14. Time series of (top left) fractional coverage of rainfall, (top right) cumulative rainfall depth(in cm), (bottom left) planetary boundary layer height (in m), and (bottom right) surface qE (in K) in thewet soil (solid lines) and dry soil (dashed light lines) simulations for case V90.
Figure 15. CTP, HIlow, and area-average rainfall for days with (left) low, (middle) intermediate, and(right) high soil moisture. Crosses indicate no rain, triangles indicate rain <5 mm, and stars indicate rain>5 mm.
CIP 10 - 16 FINDELL AND ELTAHIR: SM-BL INTERACTION, THREE-DIMENSIONAL WIND EFFECTS
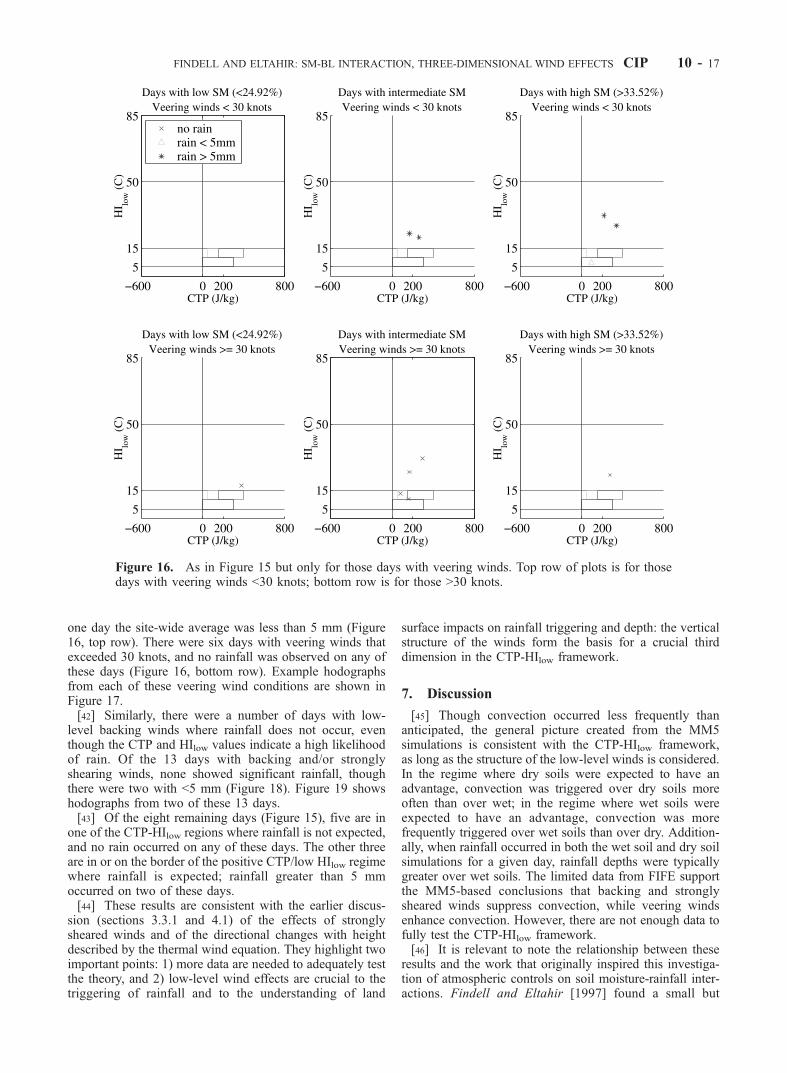
one day the site-wide average was less than 5 mm (Figure16, top row). There were six days with veering winds thatexceeded 30 knots, and no rainfall was observed on any ofthese days (Figure 16, bottom row). Example hodographsfrom each of these veering wind conditions are shown inFigure 17.[42] Similarly, there were a number of days with low-
level backing winds where rainfall does not occur, eventhough the CTP and HIlow values indicate a high likelihoodof rain. Of the 13 days with backing and/or stronglyshearing winds, none showed significant rainfall, thoughthere were two with <5 mm (Figure 18). Figure 19 showshodographs from two of these 13 days.[43] Of the eight remaining days (Figure 15), five are in
one of the CTP-HIlow regions where rainfall is not expected,and no rain occurred on any of these days. The other threeare in or on the border of the positive CTP/low HIlow regimewhere rainfall is expected; rainfall greater than 5 mmoccurred on two of these days.[44] These results are consistent with the earlier discus-
sion (sections 3.3.1 and 4.1) of the effects of stronglysheared winds and of the directional changes with heightdescribed by the thermal wind equation. They highlight twoimportant points: 1) more data are needed to adequately testthe theory, and 2) low-level wind effects are crucial to thetriggering of rainfall and to the understanding of land
surface impacts on rainfall triggering and depth: the verticalstructure of the winds form the basis for a crucial thirddimension in the CTP-HIlow framework.
7. Discussion
[45] Though convection occurred less frequently thananticipated, the general picture created from the MM5simulations is consistent with the CTP-HIlow framework,as long as the structure of the low-level winds is considered.In the regime where dry soils were expected to have anadvantage, convection was triggered over dry soils moreoften than over wet; in the regime where wet soils wereexpected to have an advantage, convection was morefrequently triggered over wet soils than over dry. Addition-ally, when rainfall occurred in both the wet soil and dry soilsimulations for a given day, rainfall depths were typicallygreater over wet soils. The limited data from FIFE supportthe MM5-based conclusions that backing and stronglysheared winds suppress convection, while veering windsenhance convection. However, there are not enough data tofully test the CTP-HIlow framework.[46] It is relevant to note the relationship between these
results and the work that originally inspired this investiga-tion of atmospheric controls on soil moisture-rainfall inter-actions. Findell and Eltahir [1997] found a small but
Figure 16. As in Figure 15 but only for those days with veering winds. Top row of plots is for thosedays with veering winds <30 knots; bottom row is for those >30 knots.
FINDELL AND ELTAHIR: SM-BL INTERACTION, THREE-DIMENSIONAL WIND EFFECTS CIP 10 - 17

significant positive feedback between soil moistureand rainfall in Illinois. Expanding on this work, Findelland Eltahir [1999] used near-surface atmospheric data andfound a significant correlation between soil moisture andwet-bulb depression, Tdpr, and then between Tdpr and sub-
sequent rainfall. They did not, however, find a significantcorrelation between soil moisture and wet-bulb temperature,Tw, or between Tw and subsequent rainfall.[47] The current results seem to be consistent with these
findings. HIlow should be closely correlated with Tdpr, since
Figure 17. Hodographs (bottom 300 mbar) for 18 August 1987 (winds veer but stay under 30 knots;CTP = 217 J/kg; HIlow = 32�C; soil moisture = 37%; rain = 6.3 mm) and for 21 August 1987 (winds veerat speeds greater than 30 knots; CTP = 292 J/kg; HIlow = 32�C; soil moisture = 27%; rain = 0.0 mm).
Figure 18. As in Figure 15 but only for those days with (top) backing or (bottom) strongly shearingunidirectional winds.
CIP 10 - 18 FINDELL AND ELTAHIR: SM-BL INTERACTION, THREE-DIMENSIONAL WIND EFFECTS
it considers the dew point depression at relatively low levels(specifically 950 mbar and 850 mbar). Given the importanceof HIlow in the current results, it is not surprising that thesurface wet-bulb depression is also a helpful indicator of thelink between the land and the atmosphere. The wet-bulbtemperature, on the other hand, is a measure of the surfaceenergy, much like qE. The current work shows that thesurface energy alone is not enough to determine either thepotential for rainfall or the impact of the surface moisture onthis potential. The CTP is helpful in both of these determi-nations because it considers the temperature profile wellabove the surface, and because it focuses on the portion ofthe atmosphere that is between the region that is almostalways incorporated into the growing boundary layer andthe portion of the free atmosphere that is almost neverincorporated into the growing BL.
8. Conclusions
[48] General conclusions about the CTP-HIlow frameworkare threefold: (1) The convective triggering potential (CTP)offers significant information regarding the likely impact ofthe land surface condition on the potential for rainfall,particularly when coupled with a measure of the humidityin the lowest levels of the atmosphere (e.g., HIlow). (2) Theland surface condition can impact the potential for convec-tion only when the atmosphere is not already predisposed toconvect or not to convect. This atmospheric predispositioncan be determined by analyzing the CTP, the HIlow, and thevertical profile of the winds. (3) Areas such as Illinoisexhibit a small but significant positive feedback betweensoil moisture and rainfall because the frequency of daysfalling in the wet soil advantage regime of CTP-HIlow spaceexceeds the frequency of days falling in the dry soiladvantage regime.[49] Additional insight is gained by adding an analysis of
low-level winds: (1) Wind effects play a crucial role in thedevelopment of convection. Winds that are backing orstrongly shearing in the lowest 300 mbar can suppressconvective potential. Due to this suppression of convectionin certain wind conditions, rain occurred in far fewer MM5
simulations and on far fewer days at the FIFE site thanwould be anticipated based solely on the 1D framework ofunderstanding. (2) In contrast, winds that veer in the lowest300 mbar without too much shear (wind speeds remain <30knots) enhance the buoyancy of rising air and increase thelikelihood of rainfall. This effect was particularly notice-able in the FIFE data, where rainfall occurred on all fivedays with low-level veering winds under 30 knots, evenwith high humidity deficits in four of the cases. (3)Variability in the wind speed and direction at all levelsmay influence convection; in this work we focused on thelowest levels in an attempt to understand the cases that arestrongly influenced by wind behavior in the critical CTPregion. Wind effects outside of this region may also beimportant. The wind effects described here explain thebehavior in about half of the cases that do not conformto the 1D-based CTP-HIlow framework. More research isneeded to fully understand the behavior in the cases withmore complicated low-level winds. Further research intothe effects of middle and upper level winds is underway.[50] These conclusions are based on MM5 simulations
with homogeneous soil moisture throughout the domain.Therefore they do not address mesoscale circulationsinduced by abrupt land use and land surface contrasts.The scale of these processes therefore may be at leastpartially determined by the scale of relative homogeneityat the ground. When large regions of the continent experi-ence flood or drought conditions, the processes described bythe CTP-HIlow-wind effects framework are expected todominate land-atmosphere interactions. When soil moistureconditions are less extreme, these processes are expected tobe an instrumental tool to help understand the interactionsbetween the land surface soil moisture and/or vegetativecondition and the development of rainfall.[51] The nature of the atmospheric structure in the critical
region of the troposphere assessed by the CTP, about 1 to3 km above the ground surface, determines the manner inwhich soil moisture can impact rainfall. A positive feedbackis likely when the temperature profile in this region is closeto moist adiabatic. In these circumstances, convection ismost easily triggered by increasing boundary layer moist
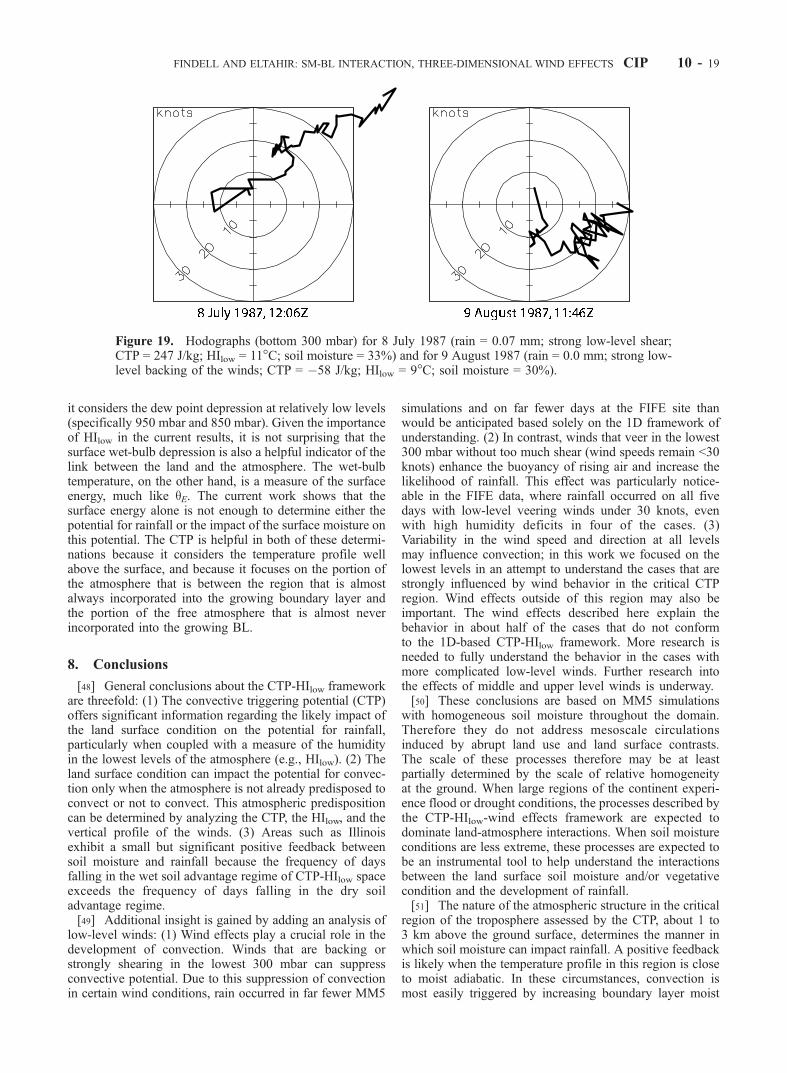
Figure 19. Hodographs (bottom 300 mbar) for 8 July 1987 (rain = 0.07 mm; strong low-level shear;CTP = 247 J/kg; HIlow = 11�C; soil moisture = 33%) and for 9 August 1987 (rain = 0.0 mm; strong low-level backing of the winds; CTP = �58 J/kg; HIlow = 9�C; soil moisture = 30%).
FINDELL AND ELTAHIR: SM-BL INTERACTION, THREE-DIMENSIONAL WIND EFFECTS CIP 10 - 19
static energy (MSE) because this greatly reduces the levelof free convection. The high latent heat flux over wet soilsincreases the BL MSE more than the smaller latent heatflux over dry soils. A negative feedback is likely when thisregion has a temperature profile close to dry adiabatic. Inthese circumstances, convection is most easily triggered byincreasing the height of the BL: a process requiring a highsensible heat flux like that seen over dry soils. Additionally,the structure of the winds below this 3 km level has a stronginfluence on the likelihood of convection. Low level veer-ing can enhance buoyancy, as long as the shear is not toogreat, and improve the chances of rainfall occurring.Similarly, low-level backing or strong shearing can cutoff convective development. These effects should be con-sidered when analyzing field data or modeling resultsinvestigating the role of the land surface on atmosphericprocesses.
Appendix A: Definitions of CTP and HIlowA1. Convective Triggering Potential
[52] The CTP is determined by integrating the areabetween the observed temperature sounding and a moistadiabat originating at the observed temperature 100 mbarabove the surface. The top of the area of integration isbounded by a constant pressure line 300 mbar above thesurface. Note that the CTP can be negative if the temper-ature of the moist adiabat originating from the Psurf � 100mbar level is less than the observed temperatures. Also, theCTP will be zero if the observed profile is moist adiabaticabove the point of origin. A diagram of this definition isprovided in FE2003.
A2. Humidity Index
[53] Lytinska et al.’s [1976] original definition of thehumidity index is the sum of the dew point depressions at850 mbar, 700 mbar, and 500 mb:
HI ¼ T850 � Td;850� �
þ T700 � Td;700� �
þ T500 � Td;500� �
; ðA1Þ
where Tp is the temperature at pressure level p and Td,p isthe dew point temperature at pressure level p. A more usefulparameter for assessing this group of soundings fromIllinois is the sum of the dew point depressions at 950 mbarand 850 mb:
HIlow ¼ T950 � Td;950� �
þ T850 � Td;850� �
: ðA2Þ
Lytinska et al. [1976] suggested as threshold for rain HI �30�C. The threshold for HIlow is 15�C (see text).
[54] Acknowledgments. This research has been supported by NASAunder agreement NAG5-7525 and NAG5-8617. The views, opinios, and/orfindings contained in this paper are those of the authors and should not beconstructed as an official NASA position, policy or decision unless sodesignated by other documentation. The authors would like to thank WayneAngevine, Alison Grimsdell, and Tony Delany for sharing their data fromthe Flatland experiment. We would also like to thank Chris Weaver and twoanonymous reviewers for their helpful comments and suggestions.
ReferencesAngevine, W. M., A. W. Grimsdell, L. M. Hartten, and A. C. Delany, TheFlatland boundary layer experiments, Bull. Am. Meteorol. Soc., 79, 419–431, 1998.
Atlas, R., N. Wolfson, and J. Terry, The effect of SST and soil moistureanomalies on the GLA model simulations of the 1988 U.S. summerdrought, J. Clim., 6, 2034–2048, 1993.
Avissar, R., and Y. Liu, Three-dimensional numerical study of shallowconvective clouds and precipitation induced by land surface forcing,J. Geophys. Res., 101, 7499–7518, 1996.
Baker, R. D., B. H. Lynn, A. Boone, W.-K. Tao, and J. Simpson, Theinfluence of soil moisture, coastline curvature, and land-breeze circula-tions on sea-breeze-initiated precipitation, J. Hydrometeorol., 2, 193–211, 2001.
Barnes, S. L., and C. W. Newton, Thunderstorms in the synoptic setting, inThunderstorm Morphology and Dynamics, edited by E. Kessler, pp. 75–112, Univ. of Okla. Press, Norman, 1986.
Black, T. L., The new NMCMesoscale Eta Model: Description and forecastexamples, Weather Forecasting, 9, 265–278, 1994.
Blackadar, A. K., High-resolution models of the planetary boundary layer,Adv. Environ. Sci. Eng., 1, 50–85, 1979.
Clark, C. A., and R. W. Arritt, Numerical simulations of the effect of soilmoisture and vegetation cover on the development of deep convection,J. Appl. Meteorol., 34, 2029–2045, 1995.
Crook, N. A., Sensitivity of moist convection forced by boundary layerprocesses to low-level thermodynamic fields, Mon. Weather Rev., 124,1767–1785, 1996.
Dudhia, J., Numerical study of convection observed during the WinterMonsoon Experiment using a mesoscale two-dimensional model, J. At-mos. Sci., 46, 3077–3107, 1989.
Ek, M., and L. Mahrt, Daytime evolution of relative humidity at the bound-ary layer top, Mon. Weather Rev., 122, 2710–2721, 1994.
Eltahir, E. A., and J. S. Pal, Relationship between surface conditions andsubsequent rainfall in convective storms, J. Geophys. Res., 101, 26,237–26,245, 1996.
Emori, S., The interaction of cumulus convection with soil moisture dis-tribution: Anidealized simulation, J. Geophys. Res., 103, 8873–8884,1998.
Findell, K. L., Atmospheric controls on soil moisture-boundary layer inter-actions, Ph.D. thesis, Mass. Inst. of Technol., Cambridge, 2001.
Findell, K. L., and E. A. Eltahir, An analysis of the soil moisture-rainfallfeedback, based on direct observations from Illinois, Water Resour. Res.,33, 725–735, 1997.
Findell, K. L., and E. A. Eltahir, Analysis of the pathways relating soilmoisture and subsequent rainfall in Illinois, J. Geophys. Res., 104,31,565–31,574, 1999.
Findell, K. L., and E. A. B. Eltahir, Atmospheric controls on soil moisture-boundary layer interactions, part I, Framework development, J. Hydro-meteorol., in press, 2003.
Giorgi, F., L. O. Mearns, C. Shields, and L. Mayer, A regional model studyof the importance of local versus remote controls of the 1988 droughtand 1993 flood over the central United States, J. Clim., 9, 1150–1162,1996.
Grell, G. A., J. Dudhia, and D. R. Stauffer, A description of the Fifth-Generation Penn State/NCAR Mesoscale Model (MM5), NCAR Tech.Note 398, Natl. Cent. for Atmos. Res., Boulder, Colo., 1995.
Hack, J. J., Sensitivity of the simulated climate to a diagnostic formulationfor cloud liquid water, J. Clim., 11, 1497–1515, 1998.
Hack, J. J., B. A. Boville, B. P. Briegleb, J. T. Kiehl, P. J. Rasch, and D. L.Williamson, Description of the NCAR Community Climate Model(CCM2), NCAR Tech. Note 382, Natl. Cent. for Atmos. Res., Boulder,Colo., 1993.
Hong, S.-Y., and H.-L. Pan, Nonlocal boundary layer vertical diffusion in amedium-range forecast model, Mon. Weather Rev., 124, 2322–2339,1996.
Kiehl, J., J. Hack, and B. Briegleb, The simulated Earth radiationbudgest of the National Center for Atmospheric Research communityclimate model CCM2 and comparisons with the Earth RadiationBudget Experiment (ERBE), J. Geophys. Res., 99, 20,815–20,827,1994.
Lytinska, Z., J. Parfiniewicz, and H. Pinkowski, The prediction of air massthunderstorms and hails, WMO Bull., 450, 128–130, 1976.
Pal, J. S., On the role of soil moisture in floods and droughts insummer over the Mississippi basin, MS. thesis, Mass. Inst. of Technol.,1997.
Pan, Z., E. Takle, M. Segal, and R. Turner, Influences of modelparameterization schemes on the response of rainfall to soil moisturein the central United States, Mon. Weather Rev., 124, 1786–1802,1996.
Rogers, E., D. G. Deaven, and G. J. DiMego, The regional analysis systemfor the operational ‘‘early’’ eta model: Original 80-km configuration andrecent changes, Weather Forecasting, 10, 810–825, 1995.
Rogers, R., and M. Yau, A Short Course in Cloud Physics, 3rd ed., Perga-mon, Tarrytown, N. Y., 1989.
CIP 10 - 20 FINDELL AND ELTAHIR: SM-BL INTERACTION, THREE-DIMENSIONAL WIND EFFECTS

Sellers, P., F. Hall, G. Asrar, D. Strebel, and R. Murphy, An overview ofthe First International Satellite Land Surface Climatology Project(ISLSCP) Field Experiment (FIFE), J. Geophys. Res., 97, 18,345–18,371, 1992.
Trenberth, K. E., and C. J. Guillemont, Physical processes involved in the1988 drought and 1993 floods in North America, J. Clim., 9, 1288–1298,1996.
Trenberth, K. E., G. W. Branstator, and P. A. Arkin, Origins of the 1988North American drought, Science, 24, 1640–1645, 1988.
Troen, I., and L. Mahrt, A simple model of the atmospheric boundary layer;sensitivity to surface evaporation, Boundary Layer Meteorol., 37, 129–148, 1986.
Wallace, J. M., and P. V. Hobbs, Atmospheric Science: An IntroductorySurvey, Academic, San Diego, Calif., 1977.
Zhang, D., and R. A. Anthes, A high-resolution model of the planetaryboundary layer: Sensitivity tests and comparisons with SESAME-79 data,J. Appl. Meteorol., 21, 1594–1609, 1982.
Ziegler, C. L., and E. N. Rasmussen, The initiation of moist convection atthe dryline: Forecasting issues from a case study perspective, WeatherForecasting, 13, 1106–1131, 1998.
�����������������������E. A. B. Eltahir, Parsons Lab, 48-207, Department of Civil and
Environmental Engineering, Massachusetts Institute of Technology, Cam-bridge, MA 02139, USA. ([email protected])K. L. Findell, Program in Atmospheric and Oceanic Sciences, Princeton
University, Princeton, NJ 08542, USA. ([email protected])
FINDELL AND ELTAHIR: SM-BL INTERACTION, THREE-DIMENSIONAL WIND EFFECTS CIP 10 - 21