atherosclerosis and liver inflammation induced by ... biology... · genome biology 2007, volume 8,...
TRANSCRIPT

com
ment
reviews
reports
deposited research
refereed researchinteractio
nsinfo
rmatio
n
Open Access2007Kleemannet al.Volume 8, Issue 9, Article R200ResearchAtherosclerosis and liver inflammation induced by increased dietary cholesterol intake: a combined transcriptomics and metabolomics analysisRobert Kleemann¤*†, Lars Verschuren¤*†, Marjan J van Erk‡, Yuri Nikolsky§, Nicole HP Cnubben‡, Elwin R Verheij‡, Age K Smilde¶, Henk FJ Hendriks‡, Susanne Zadelaar*, Graham J Smith¥, Valery Kaznacheev§#, Tatiana Nikolskaya§#, Anton Melnikov§#, Eva Hurt-Camejo**, Jan van der Greef†‡, Ben van Ommen‡ and Teake Kooistra*
Addresses: *Department of Vascular and Metabolic Diseases, TNO-Quality of Life, BioSciences, Gaubius Laboratory, Zernikedreef 9, 2333 CK Leiden, The Netherlands. †Department of Vascular Surgery, Leiden University Medical Center, Albinusdreef 2, 2300 RC Leiden, The Netherlands. ‡Department of Physiological Genomics, TNO-Quality of Life, BioSciences, Utrechtseweg 48, 3704 HE Zeist, The Netherlands. §GeneGo Inc., Renaissance Drive, St Joseph, MI 49085, USA. ¶Department of Analytical Research, TNO-Quality of Life, Quality and Safety, Utrechtseweg 48, 3704 HE Zeist, The Netherlands. ¥AstraZeneca, CV&GI Research, Silk Road Business Park, Macclesfield, Cheshire SK10 2NA, UK. #Vavilov Institute for General Genetics, Russian Academy of Science, Gubkin Street 3, 117809 Moscow, Russia. **AstraZeneca CV&GI Research, 43183 Mölndal, Sweden.
¤ These authors contributed equally to this work.
Correspondence: Robert Kleemann. Email: [email protected]
© 2007 Kleemann et al.; licensee BioMed Central Ltd. This is an open access article distributed under the terms of the Creative Commons Attribution License (http://creativecommons.org/licenses/by/2.0), which permits unrestricted use, distribution, and reproduction in any medium, provided the original work is properly cited.Atherosclerosis and liver inflammation<p>With increasing dietary cholesterol intake the liver switches from a mainly resilient to a predominantly inflammatory state, which is associated with early lesion formation.</p>
Abstract
Background: Increased dietary cholesterol intake is associated with atherosclerosis.Atherosclerosis development requires a lipid and an inflammatory component. It is unclear whereand how the inflammatory component develops. To assess the role of the liver in the evolution ofinflammation, we treated ApoE*3Leiden mice with cholesterol-free (Con), low (LC; 0.25%) andhigh (HC; 1%) cholesterol diets, scored early atherosclerosis and profiled the (patho)physiologicalstate of the liver using novel whole-genome and metabolome technologies.
Results: Whereas the Con diet did not induce early atherosclerosis, the LC diet did so but onlymildly, and the HC diet induced it very strongly. With increasing dietary cholesterol intake, the liverswitches from a resilient, adaptive state to an inflammatory, pro-atherosclerotic state. The liverabsorbs moderate cholesterol stress (LC) mainly by adjusting metabolic and transport processes.This hepatic resilience is predominantly controlled by SREBP-1/-2, SP-1, RXR and PPARα. A furtherincrease of dietary cholesterol stress (HC) additionally induces pro-inflammatory gene expression,including pro-atherosclerotic candidate genes. These HC-evoked changes occur via specific pro-inflammatory pathways involving specific transcriptional master regulators, some of which areestablished, others newly identified. Notably, several of these regulators control both lipidmetabolism and inflammation, and thereby link the two processes.
Published: 24 September 2007
Genome Biology 2007, 8:R200 (doi:10.1186/gb-2007-8-9-r200)
Received: 10 April 2007Revised: 13 July 2007Accepted: 24 September 2007
The electronic version of this article is the complete one and can be found online at http://genomebiology.com/2007/8/9/R200
Genome Biology 2007, 8:R200

R200.2 Genome Biology 2007, Volume 8, Issue 9, Article R200 Kleemann et al. http://genomebiology.com/2007/8/9/R200
Conclusion: With increasing dietary cholesterol intake the liver switches from a mainly resilient(LC) to a predominantly inflammatory (HC) state, which is associated with early lesion formation.Newly developed, functional systems biology tools allowed the identification of novel regulatorypathways and transcriptional regulators controlling both lipid metabolism and inflammatoryresponses, thereby providing a rationale for an interrelationship between the two processes.
BackgroundAtherosclerosis is a multifactorial disease of the large arteriesand the leading cause of morbidity and mortality in industri-alized countries [1]. There is ample evidence that hypercho-lesterolemia (that is, elevated plasma levels of low-densitylipoprotein (LDL) and very low-density lipoprotein (VLDL))induced by genetic modification or enhanced intake of dietarylipids is a major causative factor in atherogenesis [2,3]. It isequally clear that from the very beginning of lesion formation,atherogenesis requires an inflammatory component, which isthought to drive the progression of the disease [4,5]. Indeed,some of the variation in the rate of lesion progression in dif-ferent individuals may relate to variations in their basalinflammatory state [6,7]. However, while the inflammatoryprocesses in the complex evolution of the lesion from theearly fatty streak to a fibrous plaque are considered self-per-petuating phenomena, the initial trigger and origin of theinflammatory component in hypercholesterolemia remainsenigmatic [6,8].
Recent observations by us and others suggest that the liverplays a key role in the inflammatory response evoked by die-tary constituents (reviewed in [8,9]). For example, liver-derived inflammation markers such as C-reactive protein(CRP) and serum amyloid A (SAA) increase rapidly (withindays) after consumption of an excess amount of dietary lipids[8,10], and thus by far precede the onset of early aortic lesionformation [8]. These findings suggest that nutritional choles-terol itself may contribute to the evolution of the inflamma-tory component of atherogenesis. We postulate that pro-atherogenic inflammatory factors originate at least partlyfrom the liver. We also hypothesize that these factors comeinto play at high dietary cholesterol doses because of theexponential rather than linear nature of the relationshipbetween cholesterol intake (measured as cholesterol plasmalevels) and atherosclerotic lesion size [11,12] as specified inmore detail in Additional data file 1.
In this study we sought evidence for the hypothesis thatinflammation and hypercholesterolemia are not separate fac-tors, but closely related features of the same trigger, dietarycholesterol. In particular, using a variety of newly developedfunctional bioinformatics tools, we addressed the question ofhow the liver responds to increasing dietary cholesterol loadsat the gene transcription level and analyzed how hepatic cho-lesterol metabolism is linked to the hepatic inflammatoryresponse, including underlying regulatory mechanisms.Notably, all analyses were performed at a very early stage of
the atherogenic process (that is, after 10 weeks of cholesterolfeeding) to limit potential feedback reactions from the vesselwall.
An established model for cholesterol-induced atherosclero-sis, ApoE*3Leiden transgenic (E3L) mice, allowed the appli-cation of experimental conditions that mimic the humansituation: E3L mice display a lipoprotein profile similar tothat of humans suffering from dysbetalipoproteinemia anddevelop atherosclerotic lesions that resemble human lesionswith regard to morphology and cellular composition [13,14].E3L mice were exposed to increasing doses of dietary choles-terol (as the only dietary variable modulated), and livergenome and metabolome datasets were analyzed in a uniquecontext, that is, at the time point of first lesion development.Advanced (functional) bioinformatical analysis allowed us tomerge metabolome and transcriptome datasets and to ana-lyze pathways and biochemical processes comprehensively.Recent advances in systems biology (for example, new biolog-ical process software for network building and data mining)have enabled us to discover significant relationships and toidentify transcriptional master regulators that control genealteration and are ultimately responsible for effects at theprocess level.
ResultsEffect of dietary cholesterol load on plasma lipids and early atherosclerosisTreatment of female E3L mice with a cholesterol-free (Con),a low-cholesterol (LC) or a high-cholesterol (HC) dietresulted in total plasma cholesterol concentrations that stabi-lized at 5.9 ± 0.3 mM, 13.3 ± 1.9 mM and 17.9 ± 2.4 mM,respectively. The increase in plasma cholesterol in the LC andHC groups was confined to the pro-atherogenic lipoproteinparticles VLDL and LDL (Figure 1a). High-density lipopro-tein (HDL) levels and plasma triglyceride levels were compa-rable between the groups (Figure 1a and Table 1). The plasmalevels of alanine aminotransferase (ALAT) and aspartate ami-notransferase (ASAT), two markers of liver function, werecomparable in the Con and LC groups and slightly elevated inthe HC group.
After 10 weeks of dietary treatment, the animals were eutha-nized to score early atherosclerosis. Longitudinally openedaortas of the Con and LC groups were essentially lesion-free(en face oil red O-staining), while aortas of the HC groupalready contained lesions (not shown). Consistent with the
Genome Biology 2007, 8:R200

http://genomebiology.com/2007/8/9/R200 Genome Biology 2007, Volume 8, Issue 9, Article R200 Kleemann et al. R200.3
com
ment
reviews
reports
refereed researchdepo
sited researchinteractio
nsinfo
rmatio
n
presence of atherosclerosis in the HC group, the vascularinflammation marker E-selectin was elevated only in thisgroup (Table 1). Early onset of atherosclerosis was analyzed inmore detail in the valve area of the aortic root (Figure 1b), aregion in which lesions develop first [15]. The total cross-sec-tional lesion area under basal conditions was 1,900 ± 900μm2 (Con group; Figure 1c). Compared to the Con group, thelesion area was relatively moderately increased in the LCgroup (4.2-fold; P < 0.05) and strongly increased in HC (19.5-fold; P < 0.05), confirming the exponential rather than linearrelationship between total plasma cholesterol levels and thelesion area.
Next, lesions in the aortic root were graded according to theclassification of the American Heart Association. Under con-trol conditions (Con); only about 10% of the aortic segmentscontained lesions, all of which were very mild type I lesionsnot identified by en face staining (Figure 1d). In the LC group,more (40%) aortic segments showed lesions, of which 38%were mild type I-III lesions and 2% were severe type IVlesions. In the HC group, 81% of the aortic segments dis-played lesions, most of which were mild lesions (76% type I-III lesions; 5% type IV). The predominance of mild-typelesions confirms an early stage of atherosclerotic disease in allgroups. Notably, a positive association was observed betweenthe cross-sectional lesion area and the plasma levels of SAA,an inflammation marker formed in liver. SAA was signifi-cantly elevated in the HC group, pointing to a hepatic inflam-matory response to cholesterol feeding (Table 1) that isassociated with early atherosclerotic lesion formation.
Analysis of the hepatic gene response to increasing doses of dietary cholesterolTo get insight into the complex traits underlying the(patho)physiological response of the liver to dietary choles-terol, whole-genome and metabolome measurements were
made. Compared to the Con group, a relatively small numberof genes (551) significantly changed with LC treatment (Fig-ure 2). HC treatment modulated most (440 out of 551) ofthese genes and, additionally, affected 1,896 other genes. Theindividual gene expression profiles within a treatment groupwere very similar and formed clusters as confirmed by hierar-chical clustering analysis (not shown). Differences in geneexpression between the treatment groups were validated andconfirmed for a selected group of genes by RT-PCR (Addi-tional data file 2).
Standard Gene Ontology (GO) biological process annotationallowed categorization of 52% of the differentially expressedgenes based on their biological function (Table 2). LC treat-ment predominantly affected genes belonging to lipid andlipoprotein metabolism, protein metabolism, carbohydratemetabolism, energy metabolism and transport. HC treatmentaffected the same GO groups but, additionally, also genes rel-evant to immune and inflammatory responses, cell prolifera-tion, apoptosis, cell adhesion and cytoskeleton integrity(Table 2 and Additional data file 3).
To refine the liver transcriptome data analysis and to definewhich biological processes are switched on/off with increas-ing dietary cholesterol loads, we performed gene enrichmentanalysis in four different functional ontologies: biologicalprocesses, canonical pathway maps, cellular processes anddisease categories using MetaCore™. This allowed us to ana-lyze functionally related genes (for example, genes belongingto a specific biochemical process) as a whole. Table 3 summa-rizes the significantly changed biological processes for the LCand HC groups. Four key ('master') process categories wereaffected by cholesterol feeding: lipid metabolism; carbohy-drate and amino acid metabolism; transport; immune andinflammatory responses.
Table 1
Effects of dietary cholesterol on plasma lipids and inflammation markers
Con LC HC
Body weight (start) (g) 20.3 ± 1.5 20.8 ± 1.5 20.6 ± 0.9
Body weight gain (g) 0.4 ± 0.7 0.7 ± 0.8 0.6 ± 0.5
Food intake (g/day) 2.6 ± 0.2 2.9 ± 0.3* 2.5 ± 0.2†
Plasma cholesterol (mM) 5.9 ± 0.3 13.3 ± 1.9* 17.9 ± 2.4*†
Plasma triglyceride (mM) 1.7 ± 0.4 2.3 ± 0.3 2.1 ± 0.7
Plasma E-selectin (μg/ml) 44.3 ± 2.3 44.3 ± 6.3 55.1 ± 8.5*†
Plasma SAA (μg/ml) 2.8 ± 0.6 4.7 ± 1.7 8.3 ± 2.7*†
Plasma ALAT (U/mL) 48 ± 44 45 ± 22 75 ± 23
Plasma ASAT (U/mL) 260 ± 123 237 ± 57 569 ± 221*†
Three groups of female E3L mice were fed either a cholesterol-free (Con) diet or the same diet supplemented with 0.25% (LC) or 1.0% (HC) w/w cholesterol. Listed are the average body weight at the start (t = 0) of the experimental period together with the body weight gain, the average daily food intake and the average plasma levels of cholesterol, triglycerides, E-selectin, serum amyloid A (SAA), alanine aminotransferase (ALAT) and aspartate aminotransferase (ASAT). All data are mean ± standard deviation. *P < 0.05 versus Con; †P < 0.05 versus LC (ANOVA, least significant difference post hoc test).
Genome Biology 2007, 8:R200

R200.4 Genome Biology 2007, Volume 8, Issue 9, Article R200 Kleemann et al. http://genomebiology.com/2007/8/9/R200
Figure 1 (see legend on next page)
No I II III IVV VI No I II III IVV VI No I II III IVV VI0
20
40
60
80
100
Per
cent
age
of s
ectio
ns (
%)
0 5 10 15 20 25
0
1
2
3
4
Con LC HC
Cho
lest
erol
(m
M)
VLDL
IDL/LDL
HDL
(a)
(b)
(c)
Con LC HC
Tot
al c
ross
-sec
tiona
lle
sion
are
a [µ
m2 ]
0
10,000
20,000
30,000
40,000
50,000
*
* #
(d)
Con LC HCCon LC HC
Fraction
Genome Biology 2007, 8:R200

http://genomebiology.com/2007/8/9/R200 Genome Biology 2007, Volume 8, Issue 9, Article R200 Kleemann et al. R200.5
com
ment
reviews
reports
refereed researchdepo
sited researchinteractio
nsinfo
rmatio
n
In the LC group, most significant effects occurred within themaster process of lipid metabolism. Important subprocesses(that is, processes in which more than 10% of process-relatedgenes changed significantly) were lipid biosynthesis, lipopro-tein metabolism, cholesterol metabolism and cholesterol bio-synthesis (Table 3). The overall functional effect of LCtreatment can be summarized as a substantial down-regula-tion of cholesterol and lipid metabolism. This adaptiveresponse of the liver indicates metabolic liver resilience up todoses of 0.25% (w/w) cholesterol.
A further increase of dietary cholesterol (1% w/w; HC group)intensified the changes in gene expression seen with LCtreatment, indicating further metabolic adaptation. Forexample, all individual genes of the cholesterol biosynthesispathway were down-regulated to a greater extent by HC thanby LC treatment (see pathway map in Additional data file 4a):the gene of the rate-limiting enzyme of this pathway, HMGCoA reductase (HDMH), was down-regulated 2.8-fold and10.6-fold by LC and HC treatments, respectively. Similarly,genes relevant for lipid and lipoprotein metabolism, LDLreceptor (LC group, 1.3-fold down-regulated; HC group, 1.9-fold down-regulated) and lipoprotein lipase (LC group, 1.8-fold up-regulated; HC group, 5.5-fold up-regulated), weredose-dependently modulated.
Besides marked effects on 'lipid metabolism', HC treatmentinduced significant changes in the master processes: 'generalmetabolism', 'transport' and 'immune and inflammatoryresponse' (Table 3). In particular, HC treatment enhanced thesubprocesses involved in translational initiation, Golgi vesicletransport, mitochondrial transport, antigen presentation,antigen processing and acute phase response by affecting theexpression of more than 35% of the genes in thesesubprocesses.
Significantly, HC but not LC dietary stress activated specificinflammatory pathways (that is, the platelet-derived growthfactor (PDGF), interferon-γ (IFNγ), interleukin-1 (IL-1) andtumor necrosis factor-α (TNFα) signaling pathways; Figure3). Activation of these inflammatory pathways with HC treat-ment leads to a significant up-regulation of MAP kinases,complement factors and acute phase proteins such as SAA.HC treatment significantly up-regulates, for example, all fourSAA isotype genes (Figure 4a), which is consistent with theobserved changes in SAA protein concentrations in plasma(compare Table 1).
More generally, HC treatment induced many genes, the geneproducts of which reportedly or putatively initiate or mediateinflammatory events (Additional data file 3), including genesencoding proteases, complement components, chemokinesand their receptors, heat shock proteins, adhesion moleculesand integrins, acute phase proteins, and inflammatory tran-scription factors, altogether indicating a profoundreprogramming of the liver towards an inflammatory statenot observed with LC treatment.
In separate experiments using female E3L mice, the hepaticinflammatory response to cholesterol-feeding was analyzedin more detail, including dose-dependency and time course.Plasma SAA served as a marker and readout of liver inflam-mation. Feeding of cholesterol at doses up to 0.50% w/w didnot alter plasma SAA levels (Figure 4b). At higher cholesteroldoses (≥0.75% w/w), plasma SAA levels increased markedly.A time course study with 1% w/w cholesterol (HC diet)showed that plasma SAA levels started to increase after 2weeks and that plasma SAA levels continued to increase overtime (Figure 4c). Together, these refined analyses indicatethat the liver is resilient up to a cholesterol dose of about0.50% w/w (adaptive response) and that the inflammatoryresponse evoked with higher cholesterol concentrationsstarts within two weeks of starting the HC diet.
Enrichment analysis with disease categories confirmed theactivation of many signaling and effector pathways relevant
Analysis of plasma lipids and atherosclerosisFigure 1 (see previous page)Analysis of plasma lipids and atherosclerosis. (a) Lipoprotein profiles of the Con, LC and HC groups at ten weeks. (b) Representative photomicrographs of cross-sections of the aortic root area. (c) Total cross-sectional lesion area in the aortic root. (d) Lesion severity of the treatment groups determined according to the lesion classification of the American Heart Association (I-VI). Data are presented as means ± standard deviation. *P < 0.05 versus Con; #P < 0.05 versus LC.
Venn diagram of significantly differentially expressed genes in the LC and HC groups compared to the Con groupFigure 2Venn diagram of significantly differentially expressed genes in the LC and HC groups compared to the Con group. ANOVA P < 0.01 and FDR (predicted) <0.05 resulted in 2,846 probesets, and subsequent t-tests with P < 0.01 for HC versus Con and/or LC versus Con resulted in the 2,447 probesets shown.
111 440 1,896LC
HC
Genome Biology 2007, 8:R200

R200.6 Genome Biology 2007, Volume 8, Issue 9, Article R200 Kleemann et al. http://genomebiology.com/2007/8/9/R200
for inflammation and immunity by HC, but not by LC, treat-ment. The most affected (that is, activated at the geneexpression level) disease categories with HC treatment wereinterrelated cardiovascular disorders and (auto) immunediseases, including cerebral and intracranial arterial diseases,cerebral amyloid angiopathy, hepatocellular carcinoma, andhepatitis (Additional data file 4b).
Altogether, this global analysis shows that the liver respondsto a low load of dietary cholesterol mainly by adapting its met-abolic program, whereas at a high cholesterol load the liver ismuch more extensively reprogrammed, and, in addition tometabolic adaptations, expresses genes involved in inflam-matory stress.
Analysis of diet-dependent metabolic changes in liver and plasmaTo verify whether the switch from metabolic adaptation (withLC treatment) to hepatic inflammatory stress (with HC treat-ment) is also reflected at the metabolite level, we performed acomprehensive HPLC/MS-based lipidome analysis (meas-urement in total of about 300 identified di- and triglycerides,phosphatidylcholines, lysophosphatidylcholines, cholesterolesters) on liver homogenates of Con, LC and HC groups, andcorresponding plasma samples.
The individual metabolite fingerprints within a treatmentgroup were similar and formed clusters as assessed by princi-pal component analysis (PCA; Figure 5). The clusters of theCon and LC groups overlapped partly, demonstrating that theCon and LC groups have a similar intrahepatic lipid pattern.This indicates that the metabolic adjustments on the genelevel in the LC group were efficacious and enabled the liver tocope with moderate dietary stress. The HC cluster did notoverlap with the clusters of the Con group, demonstratingthat the switch to a proinflammatory liver gene expressionprofile is accompanied by development of a new metabolic
hepatic state, which differs significantly from the metabolicstate at baseline (Con group).
Identification of transcriptional regulators that control the hepatic response to cholesterolTo identify the transcription factors and underlying regula-tory mechanisms that govern the hepatic response to LC andHC stress, we performed a combined analysis of the livertranscriptome and metabolome dataset. Functional networksallowed the identification of transcriptional key ('master')regulators relevant for liver resilience and liver inflammation.
The adaptation of hepatic lipid metabolism to LC stress wasmainly controlled by retinoid X receptor (RXR), SP-1, perox-isome proliferator activated receptor-α (PPARα), sterol regu-latory element binding protein (SREBP)1 and SREBP2(networks not shown), which are established positive regula-tors of genes involved in cholesterol biosynthesis [16].Combined analysis of genome and metabolite datasetsrevealed that the intrahepatic level of eicosapentaenoic acid,a suppressor of SREBP1 [17], was increased, providing amolecular explanation for the observed down-regulation ofgenes involved in cholesterol biosynthesis (Additional datafile 5).
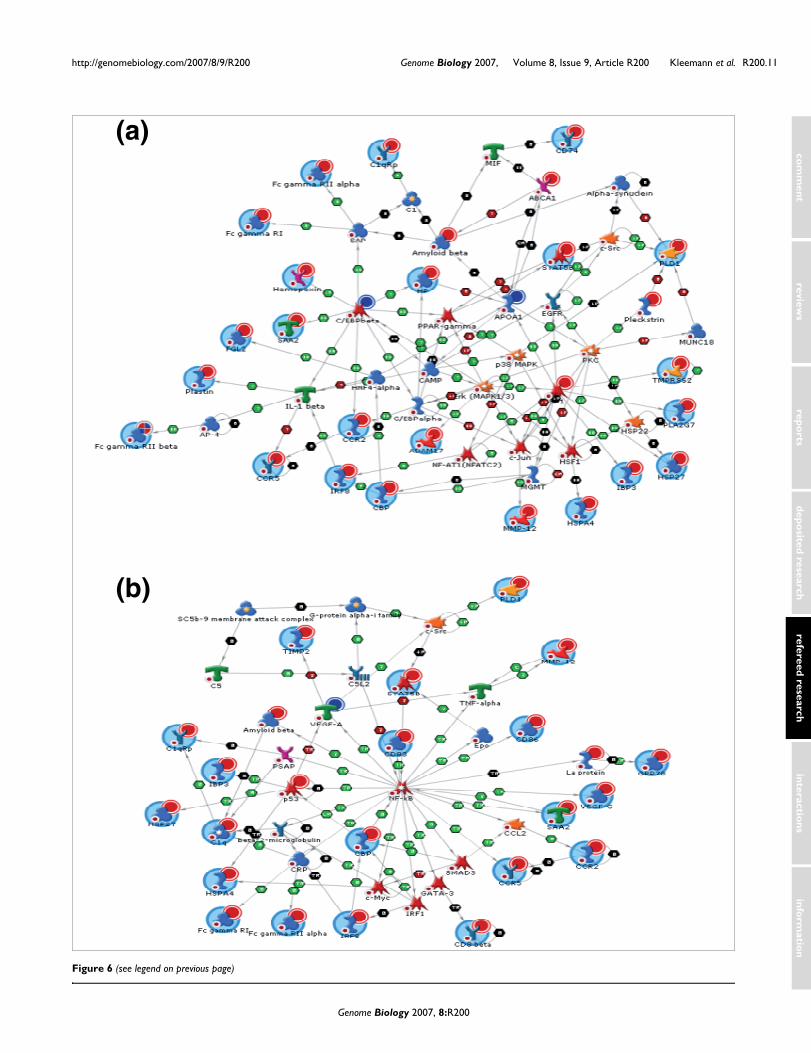
A subsequent network analysis of HC-modulated genesallowed the identification of transcription factors that medi-ate the evolution of hepatic inflammation and are ultimatelyresponsible for the effects on the process level. HC-evokedchanges require specific transcriptional master regulators,some of which are established in this context (nuclear factorkappa B (NF-κB), activator protein-1 (AP-1), CAAT/enhancer-binding protein (C/EBP)β, p53), and others thatare new (CREB-binding protein (CBP), hepatocyte nuclearfactor-4α(HNF4α), SP-1, signal transducer and activator oftranscription-3/-5 (STAT-3/-5), Yin Yang-1 (YY1); Figure 6and Additional data file 6).
Table 2
Overview of genes that are differentially expressed in response to cholesterol
LC HC
GO category Up Down Total Up Down Total
Lipid and lipoprotein metabolism (includes cholesterol and steroid metabolism) 8 50 58 37 114 151
Protein metabolism (includes protein folding and breakdown) 34 14 48 143 98 241
Other metabolism (includes carbohydrate metabolism) 32 19 51 122 130 252
Generation of precursor metabolites and energy 10 15 25 24 47 71
Transport 31 15 46 125 77 202
Immune and stress response/inflammation 19 7 26 99 49 148
Cell proliferation/apoptosis 9 3 12 37 18 55
Cell adhesion/cytoskeleton 10 1 11 76 8 84
Differentially expressed genes of LC and HC groups (ANOVA FDR < 0.05 and t-test compared to Con group P < 0.01) were analyzed according to standard GO biological process annotation and grouped into functional categories.
Genome Biology 2007, 8:R200

http://genomebiology.com/2007/8/9/R200 Genome Biology 2007, Volume 8, Issue 9, Article R200 Kleemann et al. R200.7
com
ment
reviews
reports
refereed researchdepo
sited researchinteractio
nsinfo
rmatio
n
Consistent with this, the identified transcription factors con-trol the expression of genes encoding acute phase responseproteins, complement factors, growth factors, proteases,chemokine receptors and factors stimulating cell adhesion, asconfirmed by data mining. Most importantly, HC treatmentinduced genes whose products can act extracellularly (Addi-tional data file 7) and possess reportedly pro-atherogenicproperties. Examples include complement components(C1qb, C1qR, C3aR1, C9), chemoattractant factors (ccl6,ccl12, ccl19), chemoattractant receptors (CCR2, CCR5),cytokines inducing impaired endothelial barrier function(IFN-γ), adhesion regulators (integrin β2, integrin β5, CD164antigen/sialomucin, junction adhesion molecule-2), growthfactors (PDGF, vascular endothelial growth factor (VEGF)-C,transforming growth factor (TGF)-β), proteases involved inmatrix remodeling during atherogenesis (cathepsins B, L, Sand Z; matrix metalloprotease-12), and cardiovascular riskfactors/inflammation markers (haptoglobin, orosomucoid 2,fibrinogen-like protein 2, α1-microglobulin). This upregula-tion of pro-atherogenic candidate genes in the HC group isconsistent with the observed enhanced early atherosclerosisfound in this group.
Expansion of the lipid and inflammatory networks revealedthat hepatic lipid metabolism is linked to the hepaticinflammatory response via specific transcriptional regulatorsthat control both processes. Among these dual regulatorswere CBP, C/EBPs, PPARα and SP-1 (Table 4). The presenceof molecular links between lipid metabolism and inflamma-tion raises the possibility that specific intervention with ananti-inflammatory compound may, in turn, affect plasmacholesterol levels. In a first attempt to test this possibility,female E3L mice were fed a HC diet to increase plasma cho-lesterol levels (from 5.3 mM to 19.3 mM) and systemicinflammation (SAA from 1.7 μg/ml to 9.2 μg/ml). Then, ani-mals were treated with the same HC diet supplemented withsalicylate, an inhibitor of NF-κB signaling, or vehicle. Whileplasma cholesterol and SAA levels remained elevated in thevehicle-treated group, the salicylate-treated group displayedsignificantly lower plasma SAA levels (7.7 μg/ml; P < 0.05)and significantly reduced cholesterol levels (9.9 mM; P <0.05) demonstrating that specific intervention into theinflammatory component does indeed affect plasmacholesterol.
Table 3
Analysis of processes that are changed significantly upon treatment with dietary cholesterol
Differentially expressed (%)
Master process Subprocess (child terms) Number of genes measured LC HC
Lipid metabolism 264 8.7* 24.2*
Fatty acid metabolism, fatty acid beta-oxidation 8 0.0 50.0*
Triacylglycerol metabolism 7 0.0 57.1*
Cholesterol metabolism 27 33.3* 33.3*
Cholesterol biosynthesis 7 71.4* 57.1*
Lipoprotein metabolism 18 16.7* 44.4*
Lipid biosynthesis 105 11.4* 23.8*
Immune response 297 3.0 12.1*
Antigen presentation, exogenous antigen 10 10.0 70.0*
Antigen processing 17 5.9 35.3*
Acute-phase response 11 9.1 36.4*
General metabolism 3,600 3.3 13.1*
Cellular polysaccharide metabolism 19 5.3 26.3*
Polysaccharide biosynthesis 9 0.0 33.3*
Cofactor metabolism 116 5.2 21.6*
Regulation of translational initiation 9 0.0 44.4*
Amino acid metabolism 103 2.9 20.4*
Transport 1,119 2.9 14.3*
Intracellular protein transport 161 3.7 19.9*
Golgi vesicle transport 16 6.3 37.5*
Mitochondrial transport 11 18.2* 54.5*
Master processes and their subprocesses (child terms) are listed together with the number of genes measured (third column). Percentages reflect the fraction of genes differentially expressed (within a specific process or pathway) in the LC and HC groups compared to the Con group. Relevant biological processes were identified in GenMAPP by comparison of the set of differentially expressed genes (ANOVA; P < 0.01 and FDR < 0.05) with all genes present on the array. *Biological processes with a Z-score >2 and a PermuteP < 0.05.
Genome Biology 2007, 8:R200

R200.8 Genome Biology 2007, Volume 8, Issue 9, Article R200 Kleemann et al. http://genomebiology.com/2007/8/9/R200
Figure 3 (see legend on next page)
LC
HC
(a)
(b)
Genome Biology 2007, 8:R200

http://genomebiology.com/2007/8/9/R200 Genome Biology 2007, Volume 8, Issue 9, Article R200 Kleemann et al. R200.9
com
ment
reviews
reports
refereed researchdepo
sited researchinteractio
nsinfo
rmatio
n
DiscussionDevelopment of atherosclerotic lesions requires a lipid com-ponent (hypercholesterolemia) and an inflammatory compo-nent. In the present study, we demonstrate that high dosedietary cholesterol (HC diet) strongly induces early athero-sclerotic lesion formation in a humanized model foratherosclerosis, E3L mice. This is not, or is only slightly, thecase with a cholesterol-free (Con) or low dose cholesterol (LC)diet. Importantly, Con, LC, and HC diets dose-dependentlyincrease plasma cholesterol levels, but only HC treatmentinduces a marked systemic inflammatory response, whichprecedes lesion formation and is related to liver inflamma-tion. We employed newly developed (functional) systemsbiology technologies to unravel how increasing the dose ofdietary cholesterol affects liver homeostasis and evokeshepatic inflammation. The following important findings weremade. The liver absorbs escalating doses of dietarycholesterol primarily by adjusting the expression level ofgenes involved in lipid metabolism, as revealed by advancedgene expression analysis. This metabolic resilience is con-firmed by analysis of metabolites in liver. At high doses of die-tary cholesterol, the liver also develops an inflammatorystress response, which is characterized by up-regulation ofpro-atherogenic candidate genes and activation of (at leastfour distinct) inflammatory pathways. The evolution ofhepatic inflammation involves specific transcriptional regula-tors, several of which have been newly identified in this study.Interestingly, some of these transcription factors have a dualrole and control both hepatic lipid metabolism and hepaticinflammation, indicating that the same regulatory mecha-nisms underlie these processes and thereby link the twoprocesses.
The present study delineates, to our knowledge for the firsttime, the genome-wide response of the liver to increasingdoses of dietary cholesterol, with specific attention to inflam-matory processes, and in relation to early atheroscleroticlesion formation. The liver responds to moderate elevationsin dietary cholesterol (LC diet) by adjusting major metabolicprocesses related to lipid metabolism. For example, theexpression of genes involved in endogenous cholesterol syn-thesis (for example, HMG-CoA reductase) and cholesteroluptake from plasma (for example, LDLR) is diminished. Athigh loads of dietary cholesterol (HC diet), the liver strives forhomeostasis by intensifying the changes in gene expressionobserved with the LC diet. Similar dose-dependent effects ofdietary cholesterol have been reported by others [18] but the
number of studies that assess dose-dependent effects of die-tary cholesterol is relatively small and analyses are restrictedto a limited number of genes. Our genome-wide approach iscomprehensive and demonstrates that metabolic processes asa whole are adjusted at the level of gene expression.
Importantly, the adjustment at the gene level is efficaciousonly up to a certain degree of cholesterol stress: while lowloads of cholesterol are fully absorbed (consider the compara-ble intrahepatic lipidome fingerprints for the LC and Congroups), exposure to high loads of dietary cholesterol in theHC group significantly altered the liver lipidome, despitefurther intensified adjustment of gene expression. Our com-bined analysis of genes and functional readouts (lipid metab-olites) clearly demonstrates that a dose of 1% w/w ofcholesterol, which is typically used to induce experimentaldyslipidemia and atherosclerosis in mice [13,19,20], is anextreme condition because the metabolic resilience of theliver is already overstretched.
Concomitant with the adjustment of metabolic genes to HCdietary stress, HC treatment also evokes a hepatic inflamma-tory response. The development of an inflammatory geneexpression profile upon feeding of a diet containing choles-terol has also been reported by others. For example, Tous etal. [21] showed that atherosclerosis-prone apoE-/- micereceiving a high fat/high cholesterol diet develop an impair-ment of liver histology consisting of fat accumulation, macro-phage proliferation, and inflammation, and that there is achronological and quantitative relationship between liverimpairment and the formation of atheromatous lesions.Vergnes et al. [22] showed that cholesterol and cholate com-ponents of the atherogenic diet have distinct pro-atherogeniceffects on gene expression and particularly that cholesterol isrequired for induction of genes involved in acute inflamma-tion in C57BL/6J mice. Recinos et al. [23] reported that livergene expression in LDLR-/- mice is associated with diet andlesion development and demonstrated the induction of com-ponents of the alternative component pathway. Zabalawi etal. [24] showed the induction of fatal inflammation in LDLR-/- and ApoAI-/-LDLR-/- mice fed dietary fat and cholesterol.However, the exact molecular inflammatory pathwaysswitched on/off by dietary cholesterol have remainedunknown. While some of the above studies employingmicroarray analysis have examined some of the individualcomponents of the inflammatory response to cholesterol, wehave set out to generate a holistic profile of the complex,
Analysis of the inflammatory pathways activated by the LC and HC dietsFigure 3 (see previous page)Analysis of the inflammatory pathways activated by the LC and HC diets. A master inflammatory network was generated in MetaCore™ by combining relevant inflammatory pathways. Differentially expressed genes in response to (a) LC and (b) HC treatment were mapped into this master network. The activation of the network by LC treatment was minimal, whereas HC treatment resulted in a profound activation of specific proinflammatory pathways (marked with blue arrows). Red circles indicate transcriptional node points and red rectangles highlight representative downstream target genes that were up-regulated.
Genome Biology 2007, 8:R200

R200.10 Genome Biology 2007, Volume 8, Issue 9, Article R200 Kleemann et al. http://genomebiology.com/2007/8/9/R200
interrelated nature of the response of the liver to cholesterol.Advanced pathway analysis combined with functional net-work building enabled us to unravel four key inflammatory
pathways (IFNγ, TNFα, IL-1, and PDGF pathways) that playcentral roles in the evolution of cholesterol-induced inflam-mation in the liver. Further research is necessary to resolvethe sequence of events over time (for example, which pathwayis switched on first). Remarkably, these pathways are alsocritical for lesion development in the vessel wall, suggestingthat the inflammatory response to cholesterol stressdescribed herein for the liver may involve similar routes inother tissues and, as such, has more general significance.
Our results suggest that hepatic inflammatory response maybe causatively related to lesion initiation in the aorta, becausepro-atherogenic candidate genes (that is, genes encoding can-didate inflammatory components reportedly or putativelyinvolved in early lesion formation) were found to be upregu-lated specifically in the HC group but not, or only slightly, inthe LC group. The presence of a 'hepatic source' for inflamma-tory factors in HC stress may also explain the observed expo-nential (rather than linear) increase in lesion formation seenwith increasing dietary cholesterol loads [11,12]. Consistentwith this notion is the view that the inflammatory arm ofatherogenesis is a principle driving force of lesiondevelopment.
An inflammatory reprogramming of the liver has also been
Expression of SAA genesFigure 4Expression of SAA genes. (a) All four isotype genes were dose-dependently increased with increasing dietary cholesterol exposure. *Significant compared to Con, P < 0.01. (b) Plasma SAA levels in response to increasing doses of dietary cholesterol. Female E3L animals (n ≥ 7/condition) were fed the Con diet supplemented with increasing concentrations of cholesterol for 10 weeks. *P < 0.05 versus 0% w/w cholesterol control group. (c) Plasma SAA levels in the HC diet (1% w/w cholesterol) fed female E3L animals (n = 8) over time. *P < 0.05 versus t = 0.
SAA1 SAA2 SAA3 SAA40
100
200
300
400
500R
elat
ive
expr
essi
on (
%)
* **
*ConLCHC
(a)
(b)
(c)
0,00
2,00
4,00
6,00
8,00
10,00
0 2 4 8 10
Time (weeks)
Pla
sma
SA
A, µ
g/m
L **
*
*
0
2
4
6
8
10
0 2 4 8 10
**
*
*
0,00
2,00
4,00
6,00
8,00
10,00
12,00
14,00
16,00
0 0.25 0.35 0.50 0.75 1.0
Dietary cholesterol content (% w/w)
SA
A, µg/m
L
*
*
0
2
4
6
8
10
12
14
16
0 0.25 0.35 0.50 0.75 1.0
*
*
Dietary cholesterol content (% w/w)
SA
A (
µg/m
L)P
lasm
a S
AA
(µg
/mL)
Time (weeks)
Lipidom analysis of liver homogenates (n = 10 per group)Figure 5Lipidom analysis of liver homogenates (n = 10 per group). Score plot was derived from PCA. The two component model explained 36.6% (principle component 1; PC# 1) and 24.4% (PC# 2) of the variation in the data.
-15 -10 -5 0 5 10 15-10
-5
0
5
10
15
20
Scores on PC# 1 (36.6%)
Sco
res
on P
C#
2 (2
4.4%
)
Scores for PC# 1 versus PC# 2
HCLCCon
PCA: Liver HCLCCon
PCA: liver
Representative biological network based on differentially expressed genes of the HC group using MetaCore™ network software and the Analyze Network algorithmFigure 6 (see following page)Representative biological network based on differentially expressed genes of the HC group using MetaCore™ network software and the Analyze Network algorithm. Two representative networks are shown: (a) the C/EBPβ c-jun network and (b) the NF-κB network. A legend for the biological networks is provided in Additional data file 7d. Red dots in the right corner of a gene indicate up-regulation and blue dots down-regulation.
Genome Biology 2007, 8:R200
http://genomebiology.com/2007/8/9/R200 Genome Biology 2007, Volume 8, Issue 9, Article R200 Kleemann et al. R200.11
com
ment
reviews
reports
refereed researchdepo
sited researchinteractio
nsinfo
rmatio
n
Figure 6 (see legend on previous page)
(a)
(b)
Genome Biology 2007, 8:R200

R200.12 Genome Biology 2007, Volume 8, Issue 9, Article R200 Kleemann et al. http://genomebiology.com/2007/8/9/R200
observed in C57BL/6J mice treated with a 1.25% w/w choles-terol diet resulting in total plasma cholesterol concentrationsof 3.6 mM [22], that is, a level comparable to the Con groupin our study. Unlike that in E3L mice, the total plasma choles-terol in C57BL/6J mice is mainly confined to HDL, an anti-atherogenic, anti-inflammatory lipoprotein facilitating trans-port of cholesterol from the periphery back to the liver. Thefact that mice with a strongly different lipoprotein profile(E3L, LDLR-/- and C57BL/6) show a similar hepatic inflam-matory response to cholesterol feeding indicates that theobserved inflammatory effect of dietary cholesterol is a gen-eral phenomenon and not restricted to the model of dysbetal-ipoproteinemia used herein. Also, it suggests that the influx ofdietary cholesterol into the liver (via chylomicrons) ratherthan plasma cholesterol is key to the inflammatory responseof the liver. This supposition would also be in accord with therapidity of the effect: in a time-resolved analysis of plasmaSAA during atherogenesis, we report here a strong elevationof plasma SAA within two weeks of cholesterol-feeding infemale E3L mice. This is also in line with the inflammatoryreprogramming of C57BL6/J mice within three weeks [22]and clearly demonstrates that the hepatic inflammatoryresponse precedes the formation of atherosclerotic lesions,suggesting that dietary cholesterol can be an important trig-ger and a possible source of the inflammatory component ofatherosclerotic disease. In the present study, the liver func-tion markers ALAT and ASAT remained within the normallevels stipulated for the function criteria for donor livers [25],indicating normal liver function under the experimental con-ditions applied in this study. Our results do not exclude the
possibility, however, that sterols may oxidize and becometoxic and that the oxidized sterols contribute, at least partly,to the inflammatory effects observed by us and others.
Inflammation may also arise from established risk factorsother than high plasma cholesterol (for example, hyperten-sion, diabetes/hyperglycemia). Dietary glucose can modulatethe mRNA expression and serum concentrations of immuneparameters but these alterations rapidly normalize in normo-glycemic subjects [26]. In the case of an impaired metabolicstate, however, postprandial hyperglycemia increases themagnitude and duration of systemic inflammatory responses,which probably promotes the development of cardiovasculardisease.
Our results show that the evolution of hepatic inflammationis controlled by specific transcriptional regulators, some ofwhich are well known in the context of cholesterol-inducibleinflammation (SREBPs, NF-κB, AP-1, C/EBPs), while othershave been newly identified in the present study (CBP,HNF4α, SP-1, STAT-3/-5, YY1). Interestingly, some of thesefactors may also represent molecular links between lipid/cho-lesterol metabolism and inflammation. Supportive evidencefor an interrelationship between liver metabolism andinflammation also comes from pharmacological interventionstudies. On the one hand, cholesterol-lowering drugs reducethe general inflammatory status and the expression of liver-derived inflammation markers in E3L mice (compare to thepleiotropic effects of statins) [7,14,27] The anti-inflammatoryIKKβ-inhibiting compound salicylate [28,29] reduces plasma
Table 4
Identified master regulators that control inflammatory reprogramming of the liver
Transcription factor Regulator of/node point for Example of downstream effects
AP-1 (c-jun/c-fos) Inflammation Mmp-12, col1a1, hsp27
CREP binding protein (CBP) Lipid, inflammation, immune response, cell proliferation
Very broadly acting coactivator (can bind to SREBPs)
C/EBPs Lipid, inflammation, energy metabolism Acute phase genes (for SAA, CRP, fibrinogen), hepatic gluconeogenesis and lipid homeostasis, energy metabolism (PEPCK, FAS), TGF-β signaling
Forkhead transcription factor FOXO1 Lipid, inflammation/proliferation Glycolysis, pentose phosphate shunt, and lipogenic and sterol synthetic pathways, LPL (via SHP)
NF-κB Inflammation SAA, CD83, CD86, CCR5, VEGF-C
PPARα/RXRα Lipid, inflammation LPL, ABCA1, macrophage activation, glucose homeostasis
p53 Inflammation HSP27, HSPA4, IFI16, IBP3, RBBP4
SMAD3 Inflammation Proteases and growth factors (via TGF-β signaling)
SP-1 Lipid, inflammation ABCA1, ICAM-1, cellular matrix genes COL1A1, COL1A2
SREBP-1/-2 Lipid, inflammation Sterol biosynthesis genes, LDLR, link to C/EBPαSTAT1/3/5 Inflammation Acute phase genes
YY1 Inflammation/proliferation Inflammatory response genes (SAA, vWF, CCR5), cellular matrix genes
Biological networks were generated using MetaCore™ software and transcriptional master regulators were identified in significant gene networks (P < 0.05).
Genome Biology 2007, 8:R200

http://genomebiology.com/2007/8/9/R200 Genome Biology 2007, Volume 8, Issue 9, Article R200 Kleemann et al. R200.13
com
ment
reviews
reports
refereed researchdepo
sited researchinteractio
nsinfo
rmatio
n
cholesterol in the same mouse model (this paper) indicatingthat modulation of cholesterol levels via inflammation may bepossible as well. A hypocholesterolemic effect of salicylate hasalso been reported in catfish [30] and salicylate was found toinhibit hepatic lipogenesis in isolated rat hepatocytes in vitro[31]. Prigge and Gebhard [32] showed that acetylsalicylate(aspirin), a classical inhibitor of COX1 and COX2 [29],induces biliary cholesterol secretion in the rat, an effect thatmay contribute to the cholesterol-lowering effect seen withcompounds of the salicylate category: in diabetic human sub-jects, very high doses of aspirin (around 7 g/d) were associ-ated with a 15% reduction of total plasma cholesterol and CRP[29].
ConclusionWe demonstrate that dietary cholesterol is not only a lipidrisk factor but also a trigger of hepatic inflammation and, assuch, also involved in the evolution of the inflammatory armof atherosclerotic disease. A certain degree of genetic resil-ience and elasticity allows the liver to cope with moderatecholesterol stress, but high loads of cholesterol result in aninflammatory pro-atherogenic response (involving specificpathways and transcriptional regulators), which enhancesearly lesion formation. Our findings that cholesterol andinflammation are closely linked via specific transcriptionalmaster regulators might lead to new strategies for future ther-apeutic intervention.
Materials and methodsAnimals and dietsFemale E3L mice were used at the age of 12 weeks for allexperiments. Animal experiments were approved by theInstitutional Animal Care and Use Committee of The Nether-lands Organization for Applied Scientific Research (TNO)and were in compliance with European Community specifica-tions regarding the use of laboratory animals.
A group of E3L mice (n = 17) was treated with a cholesterol-free diet (diet T; Hope Farms, Woerden, The Netherlands) for10 weeks (Con group). The major ingredients of diet T (all w/w) were cacao butter (15%), corn oil (1%), sucrose (40.5%),casein (20%), corn starch (10%) and cellulose (6%). Twoother groups (n = 17 each) received the same diet but supple-mented with either 0.25% w/w cholesterol (LC group) or 1.0%w/w cholesterol (HC group). After ten weeks of diet feeding,animals were euthanized under anesthesia to collect livers,hearts and aortas. Tissues were snap-frozen in liquid nitrogenand stored at -80°C until use.
To assess the effect of salicylate on plasma levels of inflamma-tion markers and cholesterol, two groups of female E3L mice(n = 10; 12 weeks old) were treated with the HC diet for 3weeks. Then, HC dietary treatment was either continued(vehicle control group) or animals were fed HC supplemented
with 0.12% w/w salicylate (equaling a dose of 145 mg/kg/day)for 8 weeks. Plasma samples were obtained by tail bleedingwithout fixation of the test animals to minimize stress.
Analyses of plasma lipids and proteinsTotal plasma cholesterol and triglyceride levels were meas-ured after 4 h of fasting, using kits No.1489437 (Roche Diag-nostics, Almere, The Netherlands) and No.337-B (Sigma,Aldrich Chemie BV, Zwijndrecht, The Netherlands) [33]. Forlipoprotein profiles, pooled plasma was fractionated using anKTA FPLC system (Pharmacia, Roosendaal, The Nether-lands) [9]. The plasma levels of SAA were determined byELISA as reported [14]. Plasma ALAT and ASAT levels weredetermined spectrophotometrically using a Reflotron system(Roche Diagnostics) [9].
For lipiodomics analysis of liver homogenates and plasmasamples, electrospray liquid chromatography mass spectros-copy (LC-MS) analysis was applied [34]. Briefly, samples (5μl) were incubated with 200 μl isopropanol and a mixture ofinternal standards (heptadecanoyl-lysophosphatidylcholine,di-lauroyl-phosphatidylcholine, heptadecanoyl-cholesteroland tri-heptadecanoyl-glycerol; Sigma, St Louis, MO, USA)).After vortexing, the lipids were extracted and isolated by cen-trifugation (lipids in isopropanol phase). Electrospray LC-MSlipid analysis was performed on a Thermo LTQ apparatusequipped with a Surveyor HPLC system (Thermo Electron,San Jose, CA, USA). The samples were measured in fully ran-domized sequences. Quality control samples, prepared from asingle pool of E3L mouse reference tissue, were analyzed atregular intervals (bracketing 10 samples). The LC-MS rawdata files were processed using a software developed by TNO(IMPRESS) to generate comprehensive peak tables (m/zvalue, retention time and peak area). Data were then sub-jected to retention time alignment of peaks, internal standardcorrection of peak areas and quality control resulting in afinal lipidomics dataset.
The obtained lipidomics dataset was analyzed and visualizedby PCA essentially as described [35]. Prior to analysis, thedata were mean-centered and auto-scaled to ensure an equalcontribution of all lipid measurements to the PCA-model.
Analyses of atherosclerosisHearts were fixed and embedded in paraffin to prepare serialcross sections (5 μm thick) throughout the entire aortic valvearea for (immuno) histological analysis. Cross sections werestained with hematoxylin-phloxine-saffron, andatherosclerosis was analyzed blindly in four cross-sections ofeach specimen (at intervals of 30 μm) as reported [14,36].QWin-software (Leica) was used for morphometriccomputer-assisted analysis of lesion number, lesion area, andlesion severity as described in detail elsewhere [7]. Signifi-cance of difference was calculated by one-way analysis of var-iance (ANOVA) test followed by a least significant differencepost hoc analysis using SPSS 11.5 for Windows (SPSS, Chi-
Genome Biology 2007, 8:R200
R200.14 Genome Biology 2007, Volume 8, Issue 9, Article R200 Kleemann et al. http://genomebiology.com/2007/8/9/R200
cago, IL, USA). The level of statistical significance was set atα < 0.05.
Nucleic acid extraction and gene expression analysisTotal RNA was extracted from individual livers (n = 5 pergroup) using RNAzol (Campro Scientific, Veenendaal, TheNetherlands) and glass beads according to the manufacturer'sinstructions. The integrity of each RNA sample obtained wasexamined by Agilent Lab-on-a-chip technology using theRNA 6000 Nano LabChip kit and a bioanalyzer 2100 (bothAgilent Technologies, Amstelveen, The Netherlands). Thequality control procedure is described in Additional data file8. The One-Cycle Target Labeling and Control Reagent kit(Affymetrix #900493) and the protocols optimized byAffymetrix were used to prepare biotinylated cRNA (from 5μg of total RNA) for microarray hybridization (n = 5 pergroup). The quality of intermediate products (that is, biotin-labeled cRNA and fragmented cRNA) was again controlledusing the RNA 6000 Nano Lab-on-a-chip and bioanalyzer2100. Microarray analysis was carried out using an Affyme-trix technology platform and Affymetrix GeneChip® mousegenome 430 2.0 arrays (45,037 probe sets; 34,000 well-char-acterized mouse genes). Briefly, fragmented cRNA was mixedwith spiked controls, applied to Affymetrix Test chips, andgood quality samples were then used to hybridize withmurine GeneChip® 430 2.0 arrays. The hybridization, probearray washing and staining, and washing procedures wereexecuted as described in the Affymetrix protocols, and probearrays were scanned with a Hewlett-Packard Gene ArrayScanner (Leiden Genome Technology Center, Leiden, TheNetherlands).
Gene expression data analysisRaw signal intensities were normalized using the GCRMAalgorithm (Affylm package in R). Datasets are freely accessi-ble online through ArrayExpress [37]. Normalized signalintensities below 10 were replaced by 10. Probe sets with anabsent call in all arrays were removed before further analysisof the data. RT-PCR was performed essentially as described[27,38] to validate and confirm differences in gene expressionbetween the treatment groups.
Statistical analysis was performed in BRB ArrayTools (DrRichard Simon and Amy Peng Lam [39]). Con, LC and HCgroups were tested for differentially expressed genes usingclass comparisons with multiple testing corrections by esti-mation of false discovery rate (FDR). Differentially expressedgenes were identified at a threshold for significance of α <0.01 and a FDR < 5%. Within the set of differentiallyexpressed genes, a Student's t-test was carried out to analyzedifferential expression of individual genes between the cho-lesterol-fed groups and the Con group. Differences of P < 0.01versus Con were considered significant.
For biological interpretation of the differentially expressedgenes, software tools GenMAPP and MetaCore™ (GeneGo
Inc., St Joseph, MI, USA) were used. Enrichment of biologicalprocesses (GO annotation) was analyzed in GenMAPP, bio-logical processes in GenMAPP with a Z-score >2 and Per-muteP < 0.05 were considered as significantly changed. InMetaCore™, enrichment analysis [40] of four independentontologies was performed. In addition to biological processgene ontology, data were also analyzed in canonical pathwaymaps, GeneGo-cellular processes and disease categories.
Distribution by canonical pathway maps reveals the most sig-nificant signaling and/or metabolic pathways. Experimentaldata are visualized as red/blue thermometers pointing up/down, and signifying up/down-regulation of the map objects.Distribution by GeneGo processes provides the most signifi-cant functional process categories enriched with experimen-tal data. GeneGo processes represent comprehensive pre-built process-specific networks, in which all objects areinterconnected by experimentally validated interactions. Theup- and down-regulated genes are visualized as red or bluecircles, respectively. The disease categories represent sets ofgenes associated with certain diseases. Gene enrichmentanalysis shows the relative enrichment of the up- and down-regulated genes with the genes from different disease catego-ries. As in the case of process enrichment, this procedure iscarried out by p value distribution.
The biological networks were assembled from manuallycurated protein-protein, protein-DNA and protein-ligand(metabolite) interactions, which are accumulated in the Met-aCore™ database. Each edge or link on the network is basedon small-experiment data referenced in the correspondingliterature. The legend for MetaCore™ Networks from theMetaCore™ guideline is provided in Additional data file 6d.For the generation of functional networks, transcriptome andmetabolome datasets were merged, allowing combined anal-ysis. Networks were generated using the Shortest path (SP)algorithm, which links the nodes from experimental datasetsby the shortest directed graphs, allowing up to two additionalsteps using interactions and nodes from the MetaCore™database. To present most of the relevant network data on thesame figure, we used the add/expand function and the MergeNetworks feature. The resulting networks provide links basedon the known interaction data not only between the nodesfrom the query data set(s), but also between the nodes thatregulate the given genes or metabolites. Network nodes withavailable experimental data are distinguished with red or bluecircles, representing up- or down-regulation, respectively.
AbbreviationsALAT, alanine aminotransferase; AP, activator protein;ASAT, aspartate aminotransferase; CBP, CREB-binding pro-tein; C/EBP, CAAT/enhancer-binding protein; Con, choles-terol-free; CRP, C-reactive protein; E3L, ApoE*3Leidentransgenic; FDR, false discovery rate; GO, Gene Ontology;HC, high-cholesterol; HDL, high-density lipoprotein; HNF,
Genome Biology 2007, 8:R200

http://genomebiology.com/2007/8/9/R200 Genome Biology 2007, Volume 8, Issue 9, Article R200 Kleemann et al. R200.15
com
ment
reviews
reports
refereed researchdepo
sited researchinteractio
nsinfo
rmatio
n
hepatocyte nuclear factor; IFN, interferon; IL, interleukin;LC, low-cholesterol; LC-MS, liquid chromatography massspectroscopy; LDL, low-density lipoprotein; NF-κB, nuclearfactor kappa B; PCA, principal component analysis; PDGF,platelet-derived growth factor; PPAR, peroxisome prolifera-tor activated receptor; RXR, retinoid X receptor; SAA, serumamyloid A; SREBP, sterol regulatory element binding pro-tein; STAT, signal transducer and activator of transcription;TGF, transforming growth factor; TNF, tumor necrosis fac-tor; VLDL, very low-density lipoprotein; YY, Yin Yang.
Authors' contributionsRK provided the conceptual background to the analysis,interpreted the results and wrote the manuscript. LV did thein vivo atherosclerosis studies, performed the assays andinterpreted the data. MvE performed the computational anal-ysis including biological processes and assisted with manu-script writing. YN coordinated the software development andthe multidimensional analysis of biological processes using(pathway) networks. NC supervised the work and coordi-nated the lipidomics and genomics analyses. EV developedthe lipidomics methodology and performed the lipidomicsmeasurements. AS coordinated the multivariate statisticalanalysis and drafted the manuscript. HH helped with datainterpretation and evaluated the manuscript. SZ performedanimal experiments and quantified plasma inflammationmarkers. GS participated in designing the experiment andmanuscript writing. VK developed the tools for multidimen-sional data analyses and performed computations. TNassisted with the preparation of the figures of networks andpathways. AM assisted in data interpretation and bioinfor-matical techniques for gene ontology analyses. EH partici-pated in designing the study and manuscript preparation. JGcoordinated the development of the metabolomics technolo-gies and critically evaluated the manuscript. BO led the bioin-formatical analyses, developed the concepts for integrateddata analysis and drafted the manuscript. TK initiated thestudy, interpreted the data and helped with manuscript writ-ing. All authors read and approved the final manuscript.
Additional data filesThe following additional data are available with the onlineversion of this paper. Additional data file 1 shows the expo-nential positive correlation between atherosclerotic lesionarea and total plasma cholesterol in female E3L mice. Addi-tional data file 2 shows the validation and confirmation ofAffymetrix microarray gene expression data by RT-PCRanalysis. Additional data file 3 is a table of the genes (includ-ing GenBank identification number and the gene symbol)that are differentially expressed with increasing doses of die-tary cholesterol. Additional data file 4 shows the canonicalpathway analysis for cholesterol metabolism and analysis ofthe gene expression data based on GO annotation with dis-ease categories (MetaCore™ software, GeneGO). Additional
data file 5 shows the comprehensive network analysis (func-tional OMICs analysis) by merging gene expression datasetswith the metabolite datasets using MetaCore™ network soft-ware. Additional data file 6 shows the biological networks ofdifferentially expressed genes in the HC group allowing theidentification of transcriptional master regulators. Additionaldata file 7 is a table lisitng cholesterol-induced factors withreported extracellular function. Additional data file 8describes the quality control analysis steps for RNA samplesprior to hybridization on Affymetrix microarrays usig AgilentLab-on-a-chip technology.Additional data file 1Exponential positive correlation between atherosclerotic lesion area and total plasma cholesterol in female E3L miceExponential positive correlation between atherosclerotic lesion area and total plasma cholesterol in female E3L mice.Click here for fileAdditional data file 2Validation and confirmation of Affymetrix microarray gene expres-sion data by RT-PCR analysisValidation and confirmation of Affymetrix microarray gene expres-sion data by RT-PCR analysis.Click here for fileAdditional data file 3Genes (including GenBank identification number and the gene symbol) that are differentially expressed with increasing doses of dietary cholesterolGenes (including GenBank identification number and the gene symbol) that are differentially expressed with increasing doses of dietary cholesterol.Click here for fileAdditional data file 4Canonical pathway analysis for cholesterol metabolism and analy-sis of the gene expression data based on GO annotation with dis-ease categoriesCanonical pathway analysis for cholesterol metabolism and analy-sis of the gene expression data based on GO annotation with dis-ease categories (MetaCore™ software, GeneGO).Click here for fileAdditional data file 5Comprehensive network analysis (functional OMICs analysis) by merging gene expression datasets with the metabolite datasets using MetaCore™ network softwareComprehensive network analysis (functional OMICs analysis) by merging gene expression datasets with the metabolite datasets using MetaCore™ network software.Click here for fileAdditional data file 6Biological networks of differentially expressed genes in the HC group allowing the identification of transcriptional master regulatorsBiological networks of differentially expressed genes in the HC group allowing the identification of transcriptional master regulators.Click here for fileAdditional data file 7Cholesterol-induced factors with reported extracellular functionCholesterol-induced factors with reported extracellular function.Click here for fileAdditional data file 8Quality control analysis steps for RNA samples prior to hybridiza-tion on Affymetrix microarrays usig Agilent Lab-on-a-chip technologyQuality control analysis steps for RNA samples prior to hybridiza-tion on Affymetrix microarrays usig Agilent Lab-on-a-chip technology.Click here for file
AcknowledgementsThis study was supported by the Dutch Organization for Scientific Research(NWO; grant VENI 016. 036.061 to RK), the Dutch Heart Foundation(NHS; grant 2002B102 to LV), and the TNO research program NISB (toRK, ME, NC, EV, AS, JG and TK). We are grateful to Maren White forhelpful discussions and critical reading of the manuscript. We thank Astra-Zeneca for supporting this study. We thank Ally Perlina, Wilbert Heijne,Robert-Jan Lamers, Annie Jie and Karin Toet for excellent bioinformaticaland analytical help. The authors gratefully acknowledge grant support fromThe European Nutrigenomics Organisation (NuGO, CT-2004-505944;Focus Team 'Metabolic Stress and Disease to RK, TK and SZ).
References1. Braunwald E: Shattuck lecture - cardiovascular medicine at
the turn of the millennium: triumphs, concerns, andopportunities. N Engl J Med 1997, 337:1360-1369.
2. Blum CB, Levy RI: Role of dietary intervention in the primaryprevention of coronary heart disease. Individuals with high-normal or elevated serum cholesterol levels should beplaced on cholesterol-lowering diets. Cardiology 1987, 74:2-21.
3. Steinberg D: Hypercholesterolemia and inflammation inatherogenesis: two sides of the same coin. Mol Nutr Food Res2005, 49:995-998.
4. Steinberg D: Atherogenesis in perspective: Hypercholestero-lemia and inflammation as partners in crime. Nat Med 2002,8:1211-1217.
5. Willerson JT, Ridker PM: Inflammation as a cardiovascular riskfactor. Circulation 2004, 109:II2-10.
6. Libby P, Ridker PM, Maseri A: Inflammation and atherosclerosis.Circulation 2002, 105:1135-1143.
7. Verschuren L, Kleemann R, Offerman EH, Szalai AJ, Emeis SJ, PrincenHM, Kooistra T: Effect of low dose atorvastatin versus diet-induced cholesterol lowering on atherosclerotic lesion pro-gression and inflammation in apolipoprotein E*3-Leidentransgenic mice. Arterioscler Thromb Vasc Biol 2005, 25:161-167.
8. Kleemann R, Kooistra T: HMG-CoA reductase inhibitors:effects on chronic subacute inflammation and onset ofatherosclerosis induced by dietary cholesterol. Curr Drug Tar-gets Cardiovasc Haematol Disord 2005, 5:441-453.
9. Rein D, Schijlen E, Kooistra T, Herbers K, Verschuren L, Hall R, Son-newald U, Bovy A, Kleemann R: Transgenic flavonoid tomatointake reduces C-reactive protein in human C-reactive pro-tein transgenic mice more than wild-type tomato. J Nutr2006, 136:2331-2337.
10. Tannock LR, O'Brien KD, Knopp RH, Retzlaff B, Fish B, Wener MH,Kahn SE, Chait A: Cholesterol feeding increases C-reactiveprotein and serum amyloid A levels in lean insulin-sensitivesubjects. Circulation 2005, 111:3058-3062.
11. Groot PH, van Vlijmen BJ, Benson GM, Hofker MH, Schiffelers R,Vidgeon-Hart M, Havekes LM: Quantitative assessment of aorticatherosclerosis in APOE*3 Leiden transgenic mice and itsrelationship to serum cholesterol exposure. Arterioscler ThrombVasc Biol 1996, 16:926-933.
12. Zadelaar S, Kleemann R, Verschuren L, de Vries-van der Weij , vander HJ, Princen HM, Kooistra T: Mouse models for atherosclero-sis and pharmaceutical modifiers. Arterioscler Thromb Vasc Biol2007, 27:1706-1721.
Genome Biology 2007, 8:R200

R200.16 Genome Biology 2007, Volume 8, Issue 9, Article R200 Kleemann et al. http://genomebiology.com/2007/8/9/R200
13. van Vlijmen BJ, van den Maagdenberg AM, Gijbels MJ, Van Der BH,HogenEsch H, Frants RR, Hofker MH, Havekes LM: Diet-inducedhyperlipoproteinemia and atherosclerosis in apolipoproteinE3-Leiden transgenic mice. J Clin Invest 1994, 93:1403-1410.
14. Kleemann R, Princen HM, Emeis JJ, Jukema JW, Fontijn RD, Hor-revoets AJ, Kooistra T, Havekes LM: Rosuvastatin reducesatherosclerosis development beyond and independent of itsplasma cholesterol-lowering effect in APOE*3-Leiden trans-genic mice: evidence for antiinflammatory effects ofrosuvastatin. Circulation 2003, 108:1368-1374.
15. Lutgens E, Daemen M, Kockx M, Doevendans P, Hofker M, HavekesL, Wellens H, de Muinck ED: Atherosclerosis in APOE*3-Leidentransgenic mice: from proliferative to atheromatous stage.Circulation 1999, 99:276-283.
16. Shimano H: Sterol regulatory element-binding protein-1 as adominant transcription factor for gene regulation of lipo-genic enzymes in the liver. Trends Cardiovasc Med 2000,10:275-278.
17. Zaima N, Sugawara T, Goto D, Hirata T: Trans geometric iso-mers of EPA decrease LXRalpha-induced cellular triacylglyc-erol via suppression of SREBP-1c and PGC-1beta. J Lipid Res2006, 47:2712-2717.
18. Tous M, Ferre N, Rull A, Marsillach J, Coll B, onso-Villaverde C,Camps J, Joven J: Dietary cholesterol and differential monocytechemoattractant protein-1 gene expression in aorta andliver of apo E-deficient mice. Biochem Biophys Res Commun 2006,340:1078-1084.
19. Grothusen C, Bley S, Selle T, Luchtefeld M, Grote K, Tietge UJ, Drex-ler H, Schieffer B: Combined effects of HMG-CoA-reductaseinhibition and renin-angiotensin system blockade on experi-mental atherosclerosis. Atherosclerosis 2005, 182:57-69.
20. Kwak BR, Veillard N, Pelli G, Mulhaupt F, James RW, Chanson M,Mach F: Reduced connexin43 expression inhibits atheroscle-rotic lesion formation in low-density lipoprotein receptor-deficient mice. Circulation 2003, 107:1033-1039.
21. Tous M, Ferre N, Camps J, Riu F, Joven J: Feeding apolipoproteinE-knockout mice with cholesterol and fat enriched diets maybe a model of non-alcoholic steatohepatitis. Mol Cell Biochem2005, 268:53-58.
22. Vergnes L, Phan J, Strauss M, Tafuri S, Reue K: Cholesterol andcholate components of an atherogenic diet induce distinctstages of hepatic inflammatory gene expression. J Biol Chem2003, 278:42774-42784.
23. Recinos A III, Carr BK, Bartos DB, Boldogh I, Carmical JR, BelalcazarLM, Brasier AR: Liver gene expression associated with diet andlesion development in atherosclerosis-prone mice: inductionof components of alternative complement pathway. PhysiolGenomics 2004, 19:131-142.
24. Zabalawi M, Bhat S, Loughlin T, Thomas MJ, Alexander E, Cline M,Bullock B, Willingham M, Sorci-Thomas MG: Induction of fatalinflammation in LDL receptor and ApoA-I double-knockoutmice fed dietary fat and cholesterol. Am J Pathol 2003,163:1201-1213.
25. Fischer-Frohlich CL, Lauchart W: Expanded criteria liver donors(ECD): effect of cumulative risks. Ann Transplant 2006, 11:38-42.
26. Kempf K, Rose B, Herder C, Kleophas U, Martin S, Kolb H: Inflam-mation in metabolic syndrome and type 2 diabetes: Impactof dietary glucose. Ann NY Acad Sci 2006, 1084:30-48.
27. Kooistra T, Verschuren L, de Vries-van der Weij , Koenig W, Toet K,Princen HM, Kleemann R: Fenofibrate reduces atherogenesis inApoE*3Leiden mice: evidence for multiple antiatherogeniceffects besides lowering plasma cholesterol. Arterioscler ThrombVasc Biol 2006, 26:2322-2330.
28. Cai D, Yuan M, Frantz DF, Melendez PA, Hansen L, Lee J, ShoelsonSE: Local and systemic insulin resistance resulting fromhepatic activation of IKK-beta and NF-kappaB. Nat Med 2005,11:183-190.
29. Shoelson SE, Lee J, Yuan M: Inflammation and the IKK beta/Ikappa B/NF-kappa B axis in obesity- and diet-induced insulinresistance. Int J Obes Relat Metab Disord 2003, 27(Suppl3):S49-S52.
30. Jaiswal DM, Belsare DK: Effect of salicylate and adrenocortico-tropin on the hepatic and serum cholesterol in catfish, Het-eropneustes fossilis (Bloch). Acta Biol Med Ger 1976, 35:757-761.
31. Beynen AC, Buechler KF, van der Molen AJ, Geelen MJ: Inhibition ofhepatic lipogenesis by salicylate. Toxicology 1982, 24:33-43.
32. Prigge WF, Gebhard RL: Oral acetylsalicylic acid induces biliarycholesterol secretion in the rat. Lipids 1997, 32:753-758.
33. Burger-Kentischer A, Gobel H, Kleemann R, Zernecke A, Bucala R,Leng L, Finkelmeier D, Geiger G, Schaefer HE, Schober A, et al.:Reduction of the aortic inflammatory response in spontane-ous atherosclerosis by blockade of macrophage migrationinhibitory factor (MIF). Atherosclerosis 2006, 184:28-38.
34. van der Greef J, van der Heijden R, Verheij ER: The role of massspectrometry in systems biology: data processing and identi-fication strategies in metabolomics. In Advances in Mass Spec-trometry Volume 16. Edited by: Ashcroft AE, Brenton G, Monaghan JJ.Amsterdam: Elsevier Science; 2004:145-164.
35. Jolliffe IT: Principal Component Analysis 2nd edition. Springer Verlag;2004.
36. Bernhagen J, Krohn R, Lue H, Gregory JL, Zernecke A, Koenen RR,Dewor M, Georgiev I, Schober A, Leng L, et al.: MIF is a noncog-nate ligand of CXC chemokine receptors in inflammatoryand atherogenic cell recruitment. Nat Med 2007, 13:587-596.
37. ArrayExpress Database: accession number of dataset: E-TABM-253 [http://www.ebi.ac.uk/arrayexpress]
38. Verschuren L, Lindeman JH, Bockel JH, Abdul-Hussien H, Kooistra T,Kleemann R: Up-regulation and coexpression of MIF andmatrix metalloproteinases in human abdominal aorticaneurysms. Antioxid Redox Signal 2005, 7:1195-1202.
39. BRB ArrayTools [http://linus.nci.nih.gov/BRB-ArrayTools.html]40. Subramanian A, Tamayo P, Mootha VK, Mukherjee S, Ebert BL, Gil-
lette MA, Paulovich A, Pomeroy SL, Golub TR, Lander ES, et al.: Geneset enrichment analysis: a knowledge-based approach forinterpreting genome-wide expression profiles. Proc Natl AcadSci USA 2005, 102:15545-15550.
Genome Biology 2007, 8:R200