atc-63 fema pfema p--695 quantification of building...
TRANSCRIPT
ATC-63 Quantification of Building System Performance and Response Parameters
ATC-63
FEMA P-695 Quantification of
Building Seismic Performance
Factors
LATBSDC Annual Meeting
May 7, 2010
ATC-63
FEMA PFEMA P--695 Quantification of 695 Quantification of
Building Seismic Performance Building Seismic Performance
FactorsFactors
LATBSDC Annual Meeting
May 7, 2010
Jon A. Heintz
Applied Technology Council
Director of Projects
ATC-63 Quantification of Building System Performance and Response Parameters
• Project Context
• Background/Scope/Basis of Methodology
• Methodology Overview
• Example Application to Concrete Moment
Frame Systems
• General Findings and Observations
OutlineOutlineOutline
ATC-63 Quantification of Building System Performance and Response Parameters
ATC-63 Project ContextATCATC--63 Project Context63 Project Context
ATC-63 Quantification of Building System Performance and Response Parameters
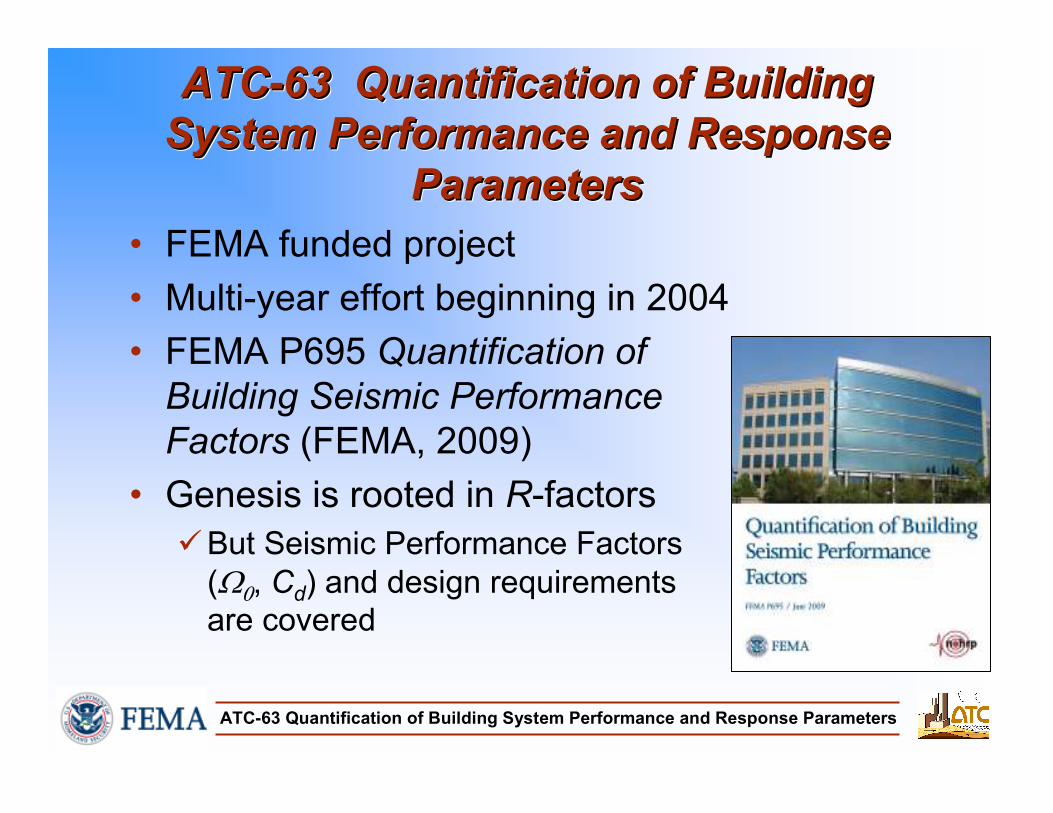
• FEMA funded project
• Multi-year effort beginning in 2004
• FEMA P695 Quantification of
Building Seismic Performance
Factors (FEMA, 2009)
• Genesis is rooted in R-factors
But Seismic Performance Factors
(Ω0, Cd) and design requirements
are covered
ATC-63 Quantification of Building
System Performance and Response
Parameters
ATCATC--63 Quantification of Building 63 Quantification of Building
System Performance and Response System Performance and Response
ParametersParameters
ATC-63 Quantification of Building System Performance and Response Parameters
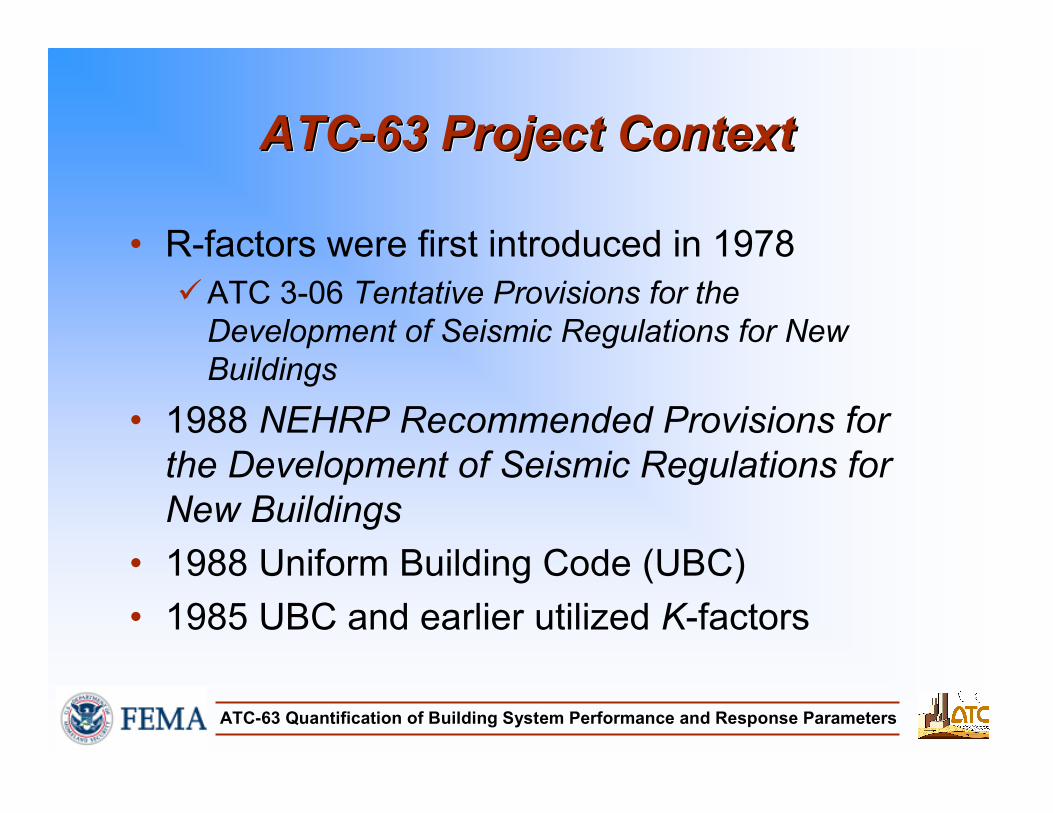
• R-factors were first introduced in 1978
ATC 3-06 Tentative Provisions for the
Development of Seismic Regulations for New
Buildings
• 1988 NEHRP Recommended Provisions for
the Development of Seismic Regulations for
New Buildings
• 1988 Uniform Building Code (UBC)
• 1985 UBC and earlier utilized K-factors
ATC-63 Project ContextATCATC--63 Project Context63 Project Context
ATC-63 Quantification of Building System Performance and Response Parameters
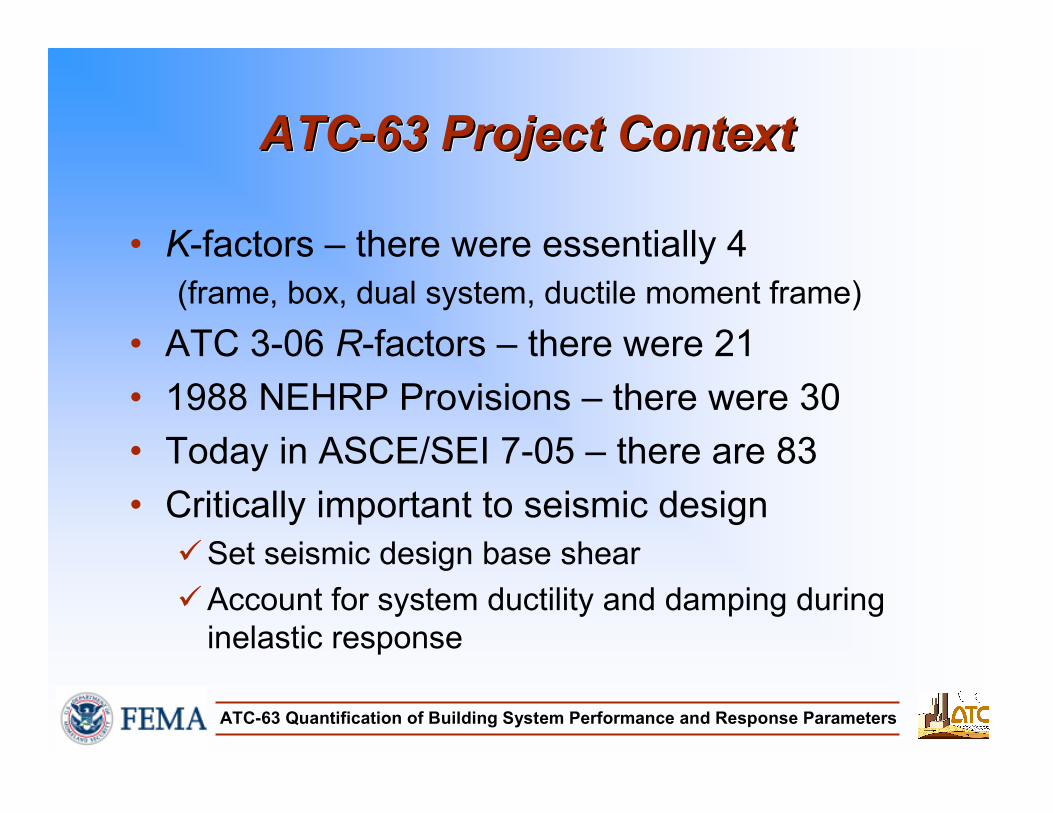
• K-factors – there were essentially 4
(frame, box, dual system, ductile moment frame)
• ATC 3-06 R-factors – there were 21
• 1988 NEHRP Provisions – there were 30
• Today in ASCE/SEI 7-05 – there are 83
• Critically important to seismic design
Set seismic design base shear
Account for system ductility and damping during
inelastic response
ATC-63 Project ContextATCATC--63 Project Context63 Project Context
ATC-63 Quantification of Building System Performance and Response Parameters
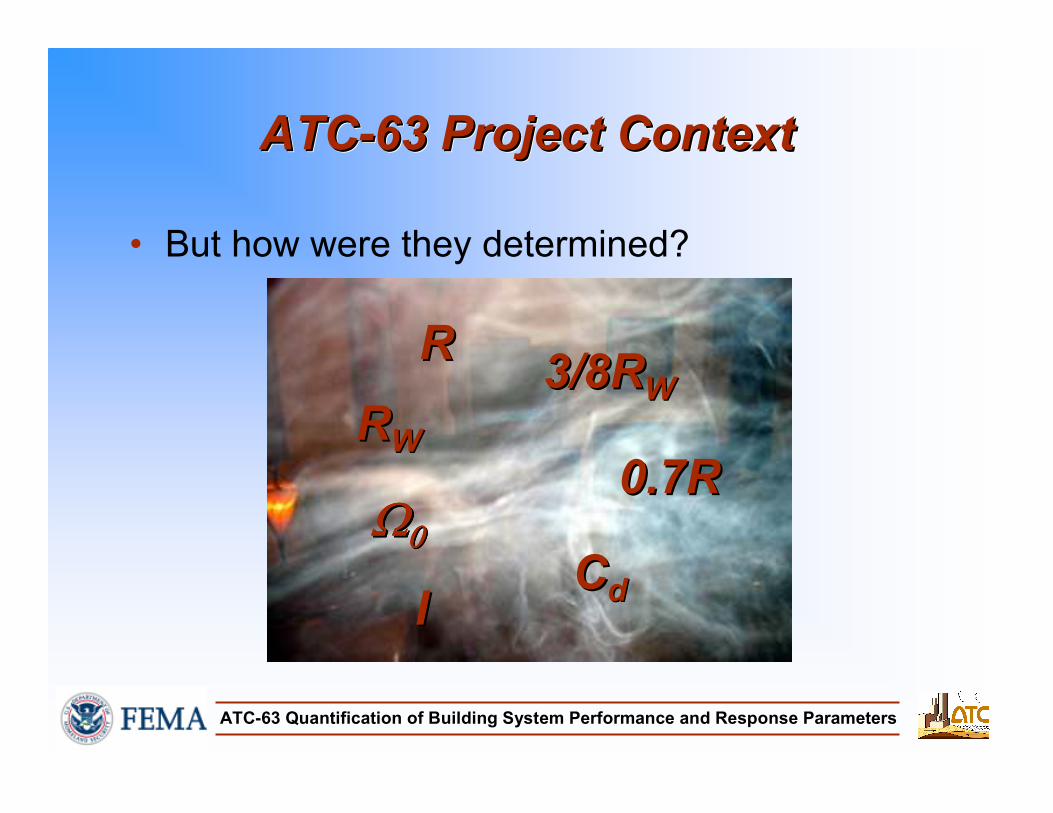
• But how were they determined?
RR
II
ΩΩΩΩΩΩΩΩ00000000
3/8R3/8RWW
RRWW
CCdd
0.7R0.7R
ATC-63 Project ContextATCATC--63 Project Context63 Project Context
ATC-63 Quantification of Building System Performance and Response Parameters
• That was then, this is now
• Advent of Performance Based Seismic DesignSEAOC Vision 2000 (1995)
FEMA 273 NEHRP Guidelines for the Seismic Rehabilitation of Buildings (1997)
• More than a decade of maturation and development of advanced analytical procedures
• We are now attempting to quantify the seismic performance of buildings
ATC-63 Project ContextATCATC--63 Project Context63 Project Context
ATC-63 Quantification of Building System Performance and Response Parameters
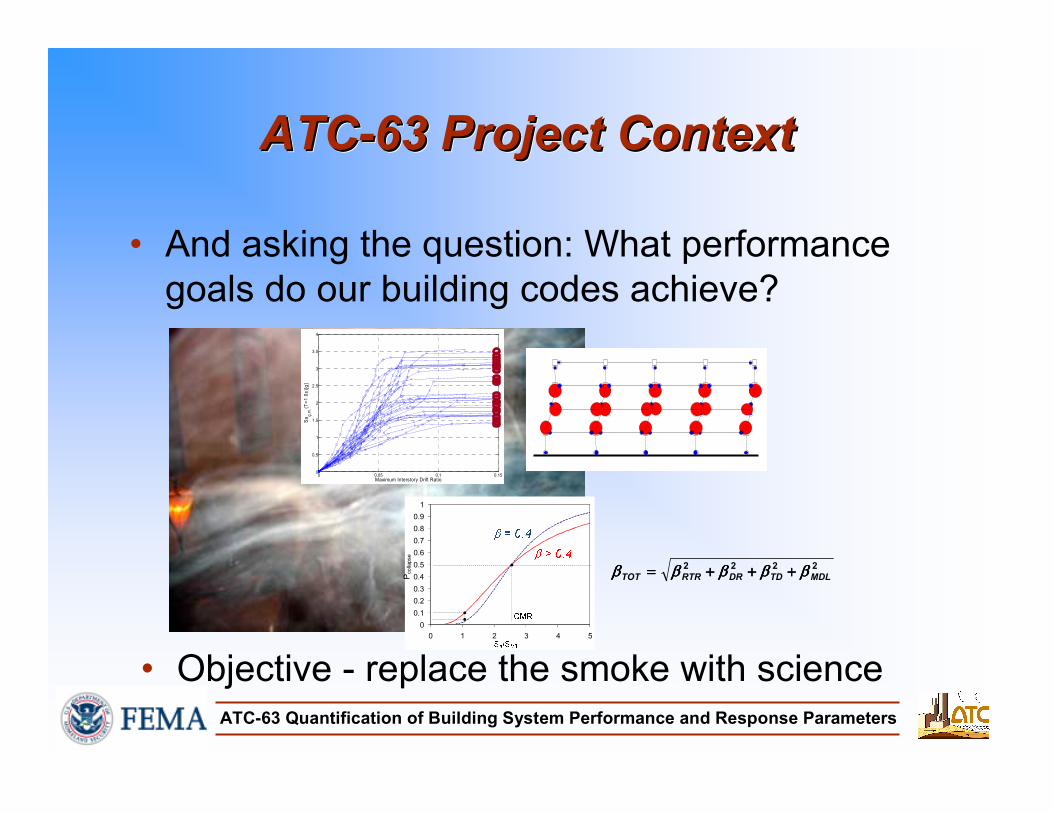
• And asking the question: What performance
goals do our building codes achieve?
0 0.05 0.1 0.150
0.5
1
1.5
2
2.5
3
3.5
4
Sa
g.m
.(T=
1.0
s)[
g]
Maximum Interstory Drift Ratio
0
0.1
0.2
0.3
0.4
0.5
0.6
0.7
0.8
0.9
1
0 1 2 3 4 5
Pco
llap
se
2222
MDLTDDRRTRTOT ββββββββββββββββββββ ++++++++++++====
• Objective - replace the smoke with science
ATC-63 Project ContextATCATC--63 Project Context63 Project Context
ATC-63 Quantification of Building System Performance and Response Parameters
Background, Scope, and BasisBackground, Scope, and BasisBackground, Scope, and Basis
ATC-63 Quantification of Building System Performance and Response Parameters
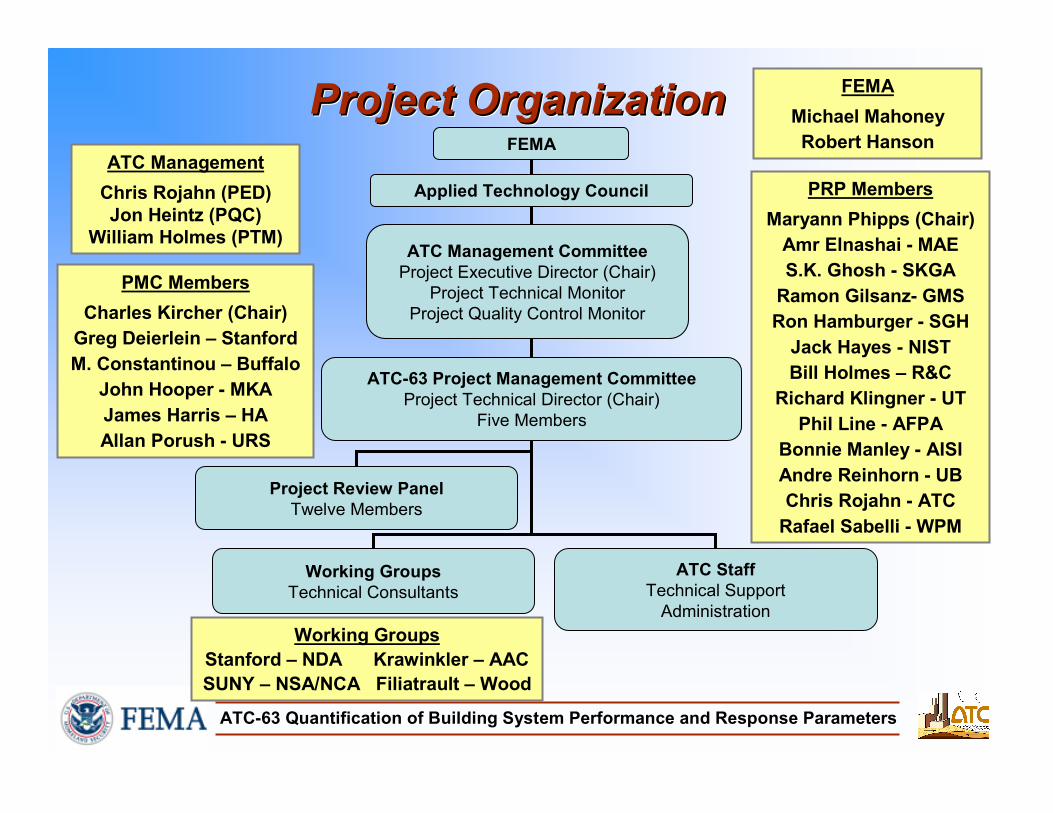
Project OrganizationProject OrganizationProject OrganizationFEMA
Applied Technology Council
ATC Management Committee
Project Executive Director (Chair)
Project Technical Monitor
Project Quality Control Monitor
ATC-63 Project Management Committee
Project Technical Director (Chair)
Five Members
Working Groups
Technical Consultants
ATC Staff
Technical Support
Administration
Project Review Panel
Twelve Members
PMC Members
Charles Kircher (Chair)
Greg Deierlein – Stanford
M. Constantinou – Buffalo
John Hooper - MKA
James Harris – HA
Allan Porush - URS
Working Groups
Stanford – NDA Krawinkler – AAC
SUNY – NSA/NCA Filiatrault – Wood
PRP Members
Maryann Phipps (Chair)
Amr Elnashai - MAE
S.K. Ghosh - SKGA
Ramon Gilsanz- GMS
Ron Hamburger - SGH
Jack Hayes - NIST
Bill Holmes – R&C
Richard Klingner - UT
Phil Line - AFPA
Bonnie Manley - AISI
Andre Reinhorn - UB
Chris Rojahn - ATC
Rafael Sabelli - WPM
FEMA
Michael Mahoney
Robert HansonATC Management
Chris Rojahn (PED)
Jon Heintz (PQC)
William Holmes (PTM)
ATC-63 Quantification of Building System Performance and Response Parameters
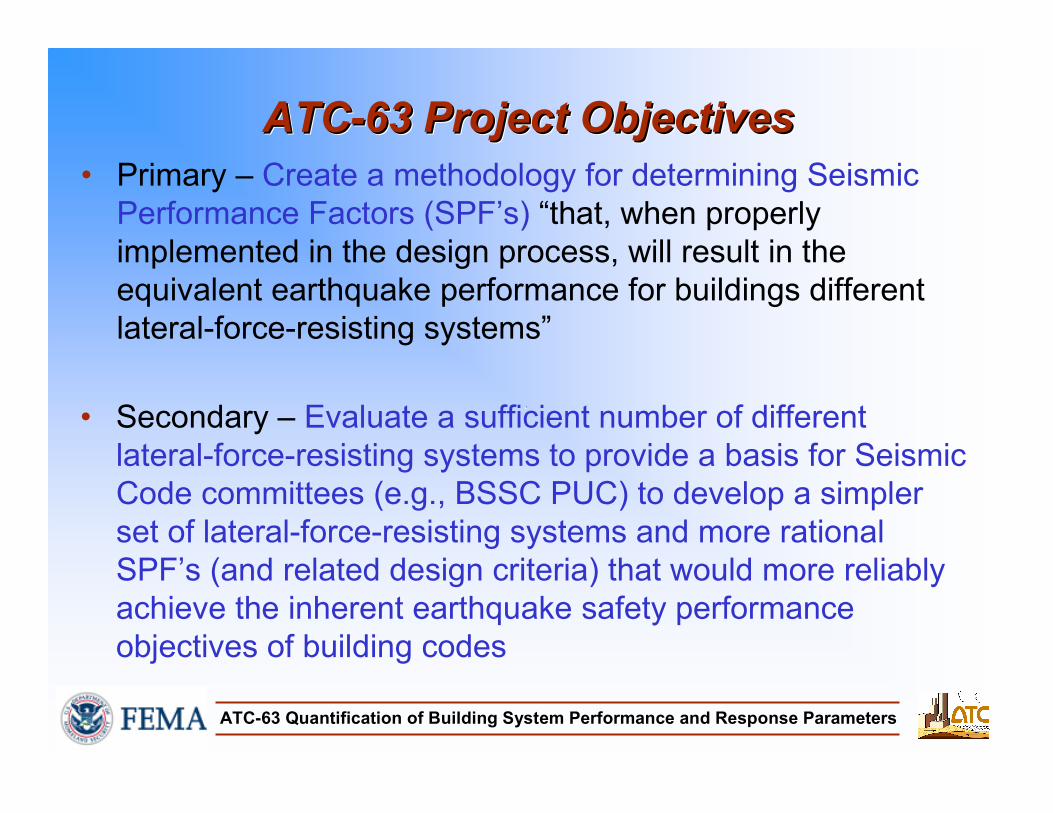
ATC-63 Project ObjectivesATCATC--63 Project Objectives63 Project Objectives
• Primary – Create a methodology for determining Seismic
Performance Factors (SPF’s) “that, when properly
implemented in the design process, will result in the
equivalent earthquake performance for buildings different
lateral-force-resisting systems”
• Secondary – Evaluate a sufficient number of different
lateral-force-resisting systems to provide a basis for Seismic
Code committees (e.g., BSSC PUC) to develop a simpler
set of lateral-force-resisting systems and more rational
SPF’s (and related design criteria) that would more reliably
achieve the inherent earthquake safety performance
objectives of building codes
ATC-63 Quantification of Building System Performance and Response Parameters
• New Buildings – Methodology applies to the seismic-force-resisting system of new buildings and may not be appropriate for non-building structures and does not apply to nonstructural systems.
• NEHRP Provisions (ASCE 7-05) – Methodology is based on design criteria, detailing requirements, etc. of the NEHRP Provisions (i.e., ASCE 7-05 as adopted by the BSSC for future NEHRP Provisionsdevelopment) and, by reference, applicable design standards
• Life Safety – Methodology is based on life safety performance (only) and does not address damage protection and functionality issues (e.g., I = 1.0 will be assumed)
• Structure Collapse – Life safety performance is achieved by providing an acceptably low probability of partial collapse and global instability of the seismic-force-resisting system for MCE ground motions
• MCE Ground Motions – MCE ground motions are based on the spectral response parameters of the NEHRP Provisions (ASCE 7-05), including site class effects
Scope and Basis of the MethodologyScope and Basis of the MethodologyScope and Basis of the Methodology
ATC-63 Quantification of Building System Performance and Response Parameters
Ground Motion Record SetGround Motion Record SetGround Motion Record Set
0
0.2
0.4
0.6
0.8
1
1.2
1.4
1.6
1.8
2
2.2
2.4
0 0.5 1 1.5 2 2.5 3 3.5 4
Period (seconds)
Spectral Acceleration (g)
0.0
0.2
0.4
0.6
0.8
1.0
1.2
Standard Deviation - Ln (Sa)
Median Spectrum - Far-Field Set
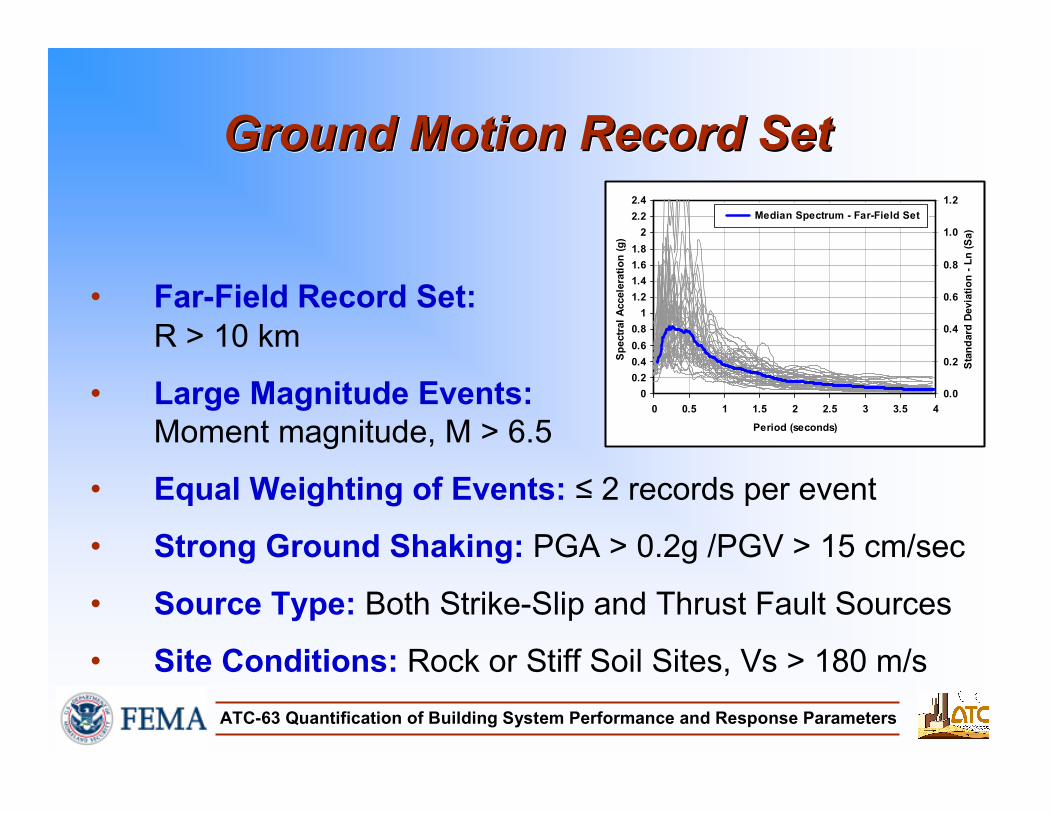
• Far-Field Record Set:
R > 10 km
• Large Magnitude Events:
Moment magnitude, M > 6.5
• Equal Weighting of Events: ≤ 2 records per event
• Strong Ground Shaking: PGA > 0.2g /PGV > 15 cm/sec
• Source Type: Both Strike-Slip and Thrust Fault Sources
• Site Conditions: Rock or Stiff Soil Sites, Vs > 180 m/s
ATC-63 Quantification of Building System Performance and Response Parameters
Technical Approach of the MethodologyTechnical Approach of the MethodologyTechnical Approach of the Methodology
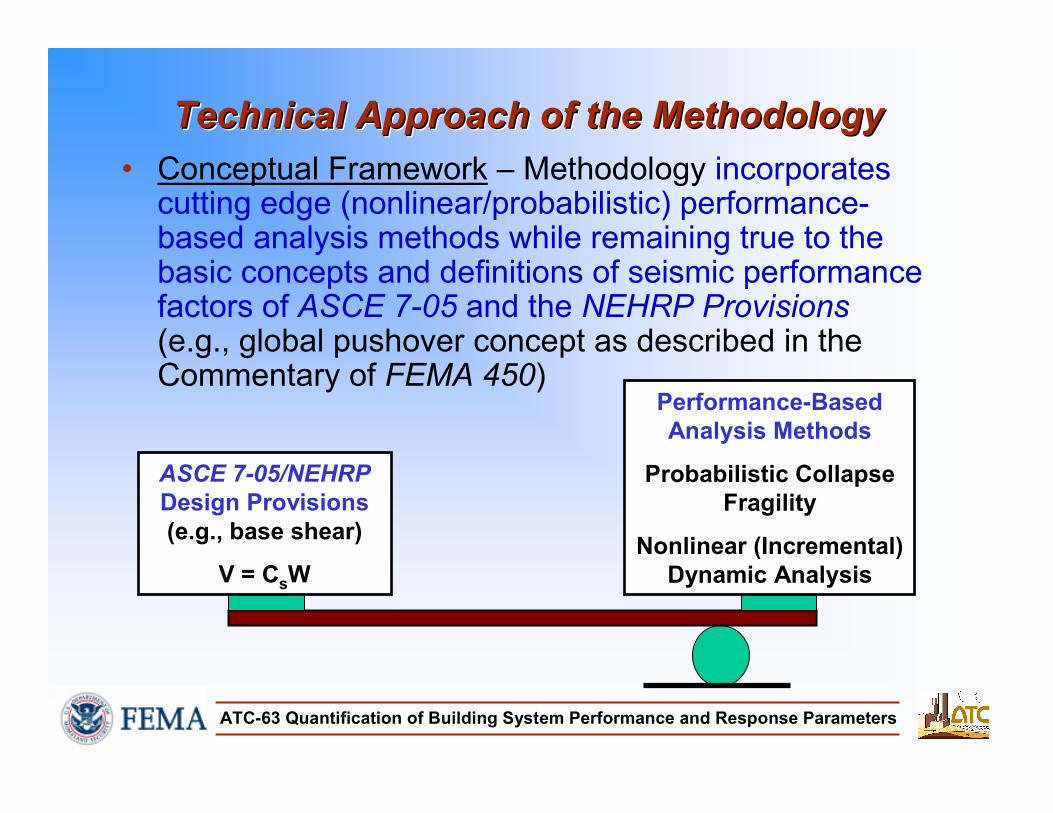
• Conceptual Framework – Methodology incorporates cutting edge (nonlinear/probabilistic) performance-based analysis methods while remaining true to the basic concepts and definitions of seismic performance factors of ASCE 7-05 and the NEHRP Provisions(e.g., global pushover concept as described in the Commentary of FEMA 450)
ASCE 7-05/NEHRP
Design Provisions
(e.g., base shear)
V = CsW
Performance-Based
Analysis Methods
Probabilistic Collapse
Fragility
Nonlinear (Incremental)
Dynamic Analysis
ATC-63 Quantification of Building System Performance and Response Parameters
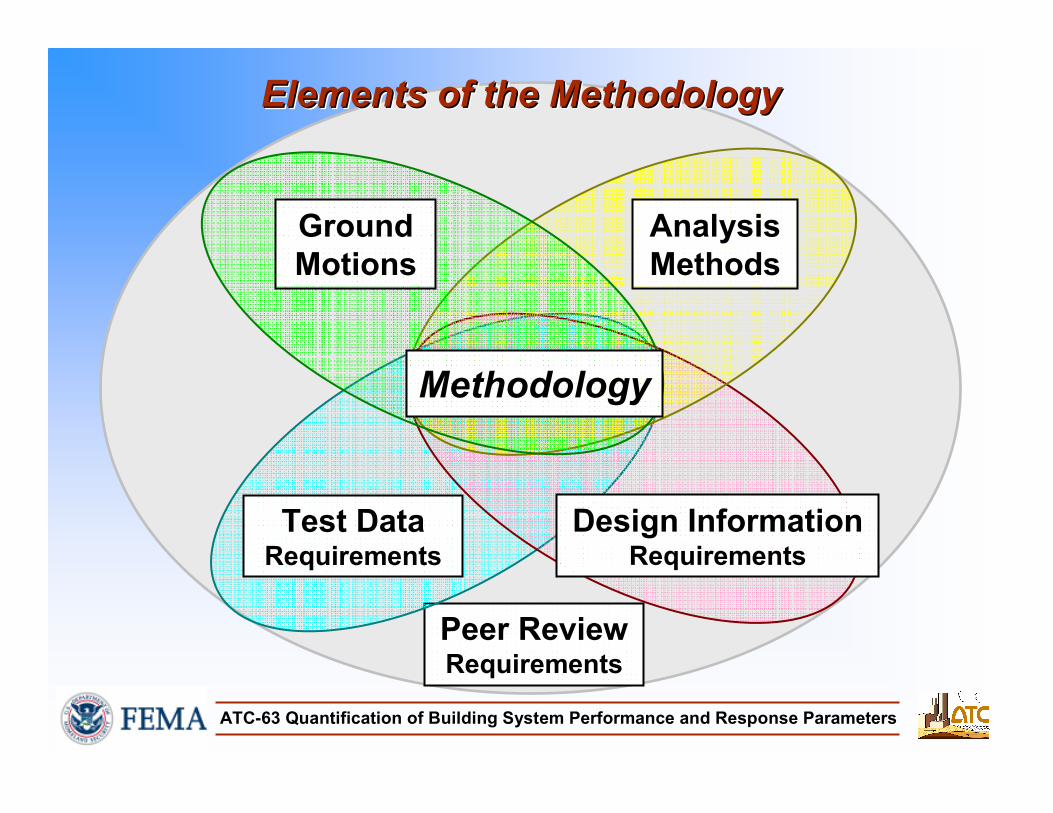
Overview of the MethodologyOverview of the MethodologyOverview of the Methodology
ATC-63 Quantification of Building System Performance and Response Parameters
Peer ReviewRequirements
Test Data Requirements
Design Information Requirements
Analysis
Methods
Ground
Motions
Methodology
Elements of the MethodologyElements of the MethodologyElements of the Methodology
ATC-63 Quantification of Building System Performance and Response Parameters
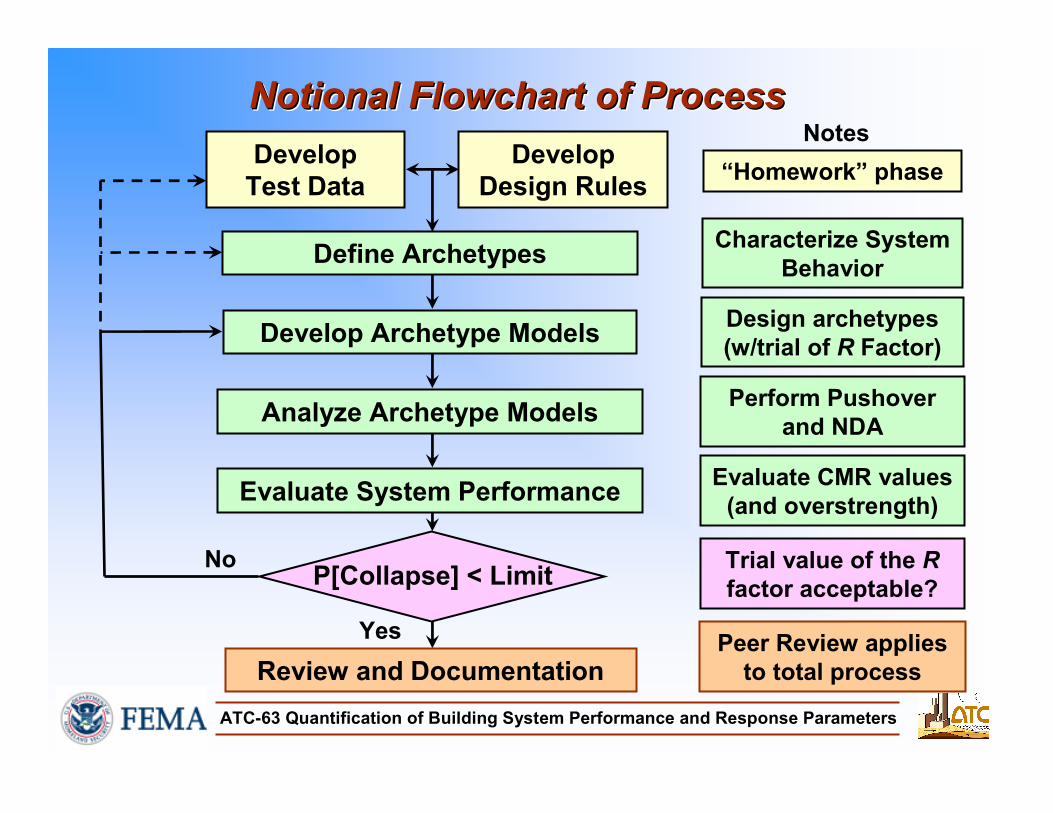
Notional Flowchart of ProcessNotional Flowchart of ProcessNotional Flowchart of Process
Develop
Design Rules
Develop
Test Data
Notes
“Homework” phase
Characterize System
BehaviorDefine Archetypes
YesPeer Review applies
to total processReview and Documentation
P[Collapse] < LimitTrial value of the R
factor acceptable?
Evaluate System PerformanceEvaluate CMR values
(and overstrength)
Perform Pushover
and NDAAnalyze Archetype Models
Design archetypes
(w/trial of R Factor)Develop Archetype Models
No
ATC-63 Quantification of Building System Performance and Response Parameters
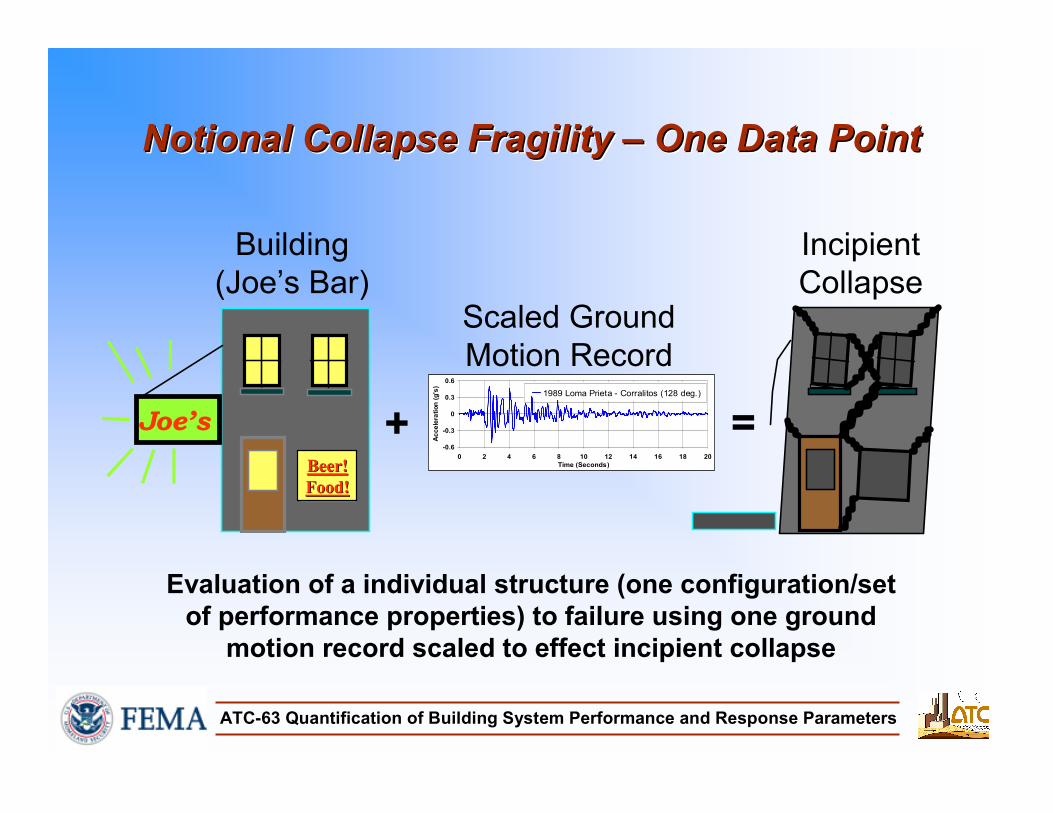
Notional Collapse Fragility – One Data PointNotional Collapse Fragility Notional Collapse Fragility –– One Data PointOne Data Point
-0.6
-0.3
0
0.3
0.6
0 2 4 6 8 10 12 14 16 18 20
Time (Seconds)
Acceleration (g's)
1989 Loma Prieta - Corralitos (128 deg.)
Scaled Ground
Motion Record
+Joe’s
Beer!Beer!
Food!Food!
Building
(Joe’s Bar)
Incipient
Collapse
=
Evaluation of a individual structure (one configuration/set
of performance properties) to failure using one ground
motion record scaled to effect incipient collapse
ATC-63 Quantification of Building System Performance and Response Parameters
-0.6
-0.3
0
0.3
0.6
0 2 4 6 8 10 12 14 16 18 20
Time (Seconds)
Acceleration (g's)
1989 Loma Prieta - Corralitos (128 deg.)
Ground Motion
+Joe’s
Beer!Beer!
Food!Food!
Building
(Joe’s Bar)
Incipient
Collapse
=-0.6
-0.3
0
0.3
0.6
0 2 4 6 8 10 12 14 16 18 20
Time (Seconds)
Acceleration (g's)
1989 Loma Prieta - Corralitos (128 deg.)
Ground Motion
+Joe’s
Beer!Beer!
Food!Food!
Building
(Joe’s Bar)
Incipient
Collapse
=-0.6
-0.3
0
0.3
0.6
0 2 4 6 8 10 12 14 16 18 20
Time (Seconds)
Acceleration (g's)
1989 Loma Prieta - Corralitos (128 deg.)
Ground Motion
+Joe’s
Beer!Beer!
Food!Food!
Building
(Joe’s Bar)
Incipient
Collapse
=-0.6
-0.3
0
0.3
0.6
0 2 4 6 8 10 12 14 16 18 20
Time (Seconds)
Acceleration (g's)
1989 Loma Prieta - Corralitos (128 deg.)
Ground Motion
+Joe’s
Beer!Beer!
Food!Food!
Building
(Joe’s Bar)
Incipient
Collapse
=-0.6
-0.3
0
0.3
0.6
0 2 4 6 8 10 12 14 16 18 20
Time (Seconds)
Acceleration (g's)
1989 Loma Prieta - Corralitos (128 deg.)
Ground Motion
+Joe’s
Beer!Beer!
Food!Food!
Building
(Joe’s Bar)
Incipient
Collapse
=-0.6
-0.3
0
0.3
0.6
0 2 4 6 8 10 12 14 16 18 20
Time (Seconds)
Acceleration (g's)
1989 Loma Prieta - Corralitos (128 deg.)
Ground Motion
+Joe’s
Beer!Beer!
Food!Food!
Building
(Joe’s Bar)
Incipient
Collapse
=-0.6
-0.3
0
0.3
0.6
0 2 4 6 8 10 12 14 16 18 20
Time (Seconds)
Acceleration (g's)
1989 Loma Prieta - Corralitos (128 deg.)
Ground Motion
+Joe’s
Beer!Beer!
Food!Food!
Building
(Joe’s Bar)
Incipient
Collapse
=-0.6
-0.3
0
0.3
0.6
0 2 4 6 8 10 12 14 16 18 20
Time (Seconds)
Acceleration (g's)
1989 Loma Prieta - Corralitos (128 deg.)
Ground Motion
+Joe’s
Beer!Beer!
Food!Food!
Building
(Joe’s Bar)
Incipient
Collapse
=-0.6
-0.3
0
0.3
0.6
0 2 4 6 8 10 12 14 16 18 20
Time (Seconds)
Acceleration (g's)
1989 Loma Prieta - Corralitos (128 deg.)
Ground Motion
+Joe’s
Beer!Beer!
Food!Food!
Building
(Joe’s Bar)
Incipient
Collapse
=-0.6
-0.3
0
0.3
0.6
0 2 4 6 8 10 12 14 16 18 20
Time (Seconds)
Acceleration (g's)
1989 Loma Prieta - Corralitos (128 deg.)
Ground Motion
+Joe’s
Beer!Beer!
Food!Food!
Building
(Joe’s Bar)
Incipient
Collapse
=-0.6
-0.3
0
0.3
0.6
0 2 4 6 8 10 12 14 16 18 20
Time (Seconds)
Acceleration (g's)
1989 Loma Prieta - Corralitos (128 deg.)
Ground Motion
+Joe’s
Beer!Beer!
Food!Food!
Building
(Joe’s Bar)
Incipient
Collapse
=-0.6
-0.3
0
0.3
0.6
0 2 4 6 8 10 12 14 16 18 20
Time (Seconds)
Acceleration (g's)
1989 Loma Prieta - Corralitos (128 deg.)
Ground Motion
+Joe’s
Beer!Beer!
Food!Food!
Building
(Joe’s Bar)
Incipient
Collapse
=-0.6
-0.3
0
0.3
0.6
0 2 4 6 8 10 12 14 16 18 20
Time (Seconds)
Acceleration (g's)
1989 Loma Prieta - Corralitos (128 deg.)
Ground Motion
+Joe’s
Beer!Beer!
Food!Food!
Building
(Joe’s Bar)
Incipient
Collapse
=-0.6
-0.3
0
0.3
0.6
0 2 4 6 8 10 12 14 16 18 20
Time (Seconds)
Acceleration (g's)
1989 Loma Prieta - Corralitos (128 deg.)
Ground Motion
+Joe’s
Beer!Beer!
Food!Food!
Building
(Joe’s Bar)
Incipient
Collapse
=-0.6
-0.3
0
0.3
0.6
0 2 4 6 8 10 12 14 16 18 20
Time (Seconds)
Acceleration (g's)
1989 Loma Prieta - Corralitos (128 deg.)
Ground Motion
+Joe’s
Beer!Beer!
Food!Food!
Building
(Joe’s Bar)
Incipient
Collapse
=-0.6
-0.3
0
0.3
0.6
0 2 4 6 8 10 12 14 16 18 20
Time (Seconds)
Acceleration (g's)
1989 Loma Prieta - Corralitos (128 deg.)
Ground Motion
+Joe’s
Beer!Beer!
Food!Food!
Building
(Joe’s Bar)
Incipient
Collapse
=-0.6
-0.3
0
0.3
0.6
0 2 4 6 8 10 12 14 16 18 20
Time (Seconds)
Acceleration (g's)
1989 Loma Prieta - Corralitos (128 deg.)
Ground Motion
+Joe’s
Beer!Beer!
Food!Food!
Building
(Joe’s Bar)
Incipient
Collapse
=-0.6
-0.3
0
0.3
0.6
0 2 4 6 8 10 12 14 16 18 20
Time (Seconds)
Acceleration (g's)
1989 Loma Prieta - Corralitos (128 deg.)
Ground Motion
+Joe’s
Beer!Beer!
Food!Food!
Building
(Joe’s Bar)
Incipient
Collapse
=
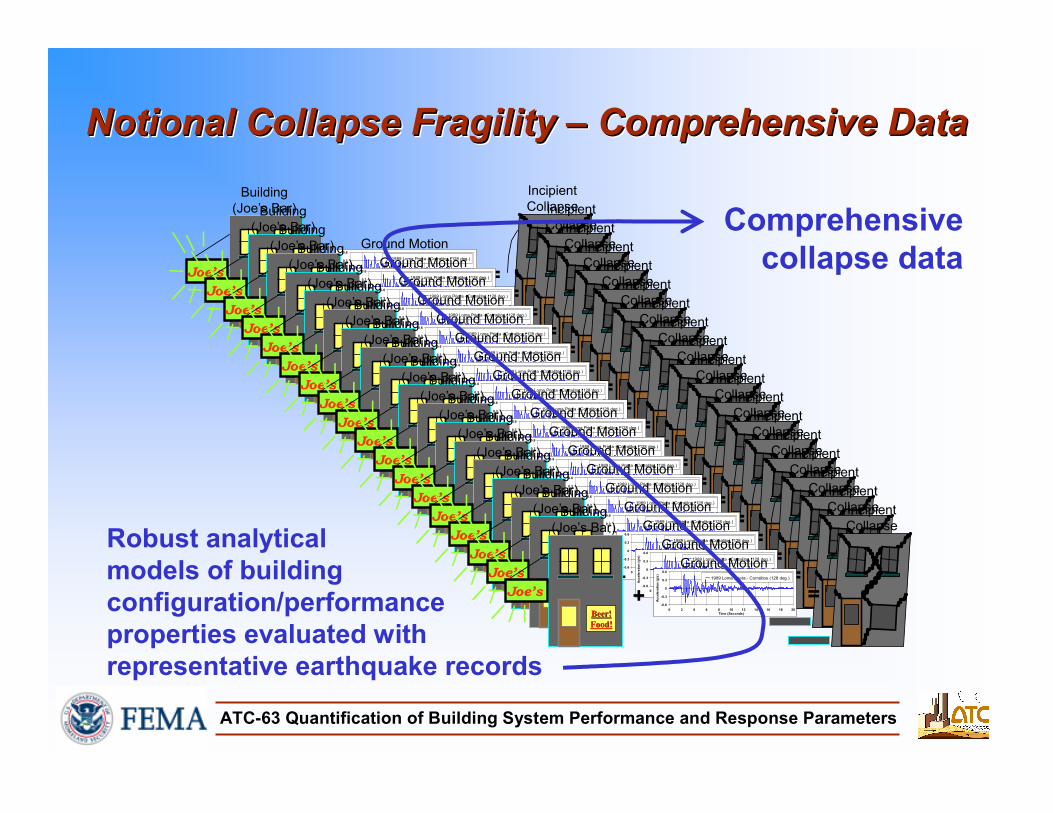
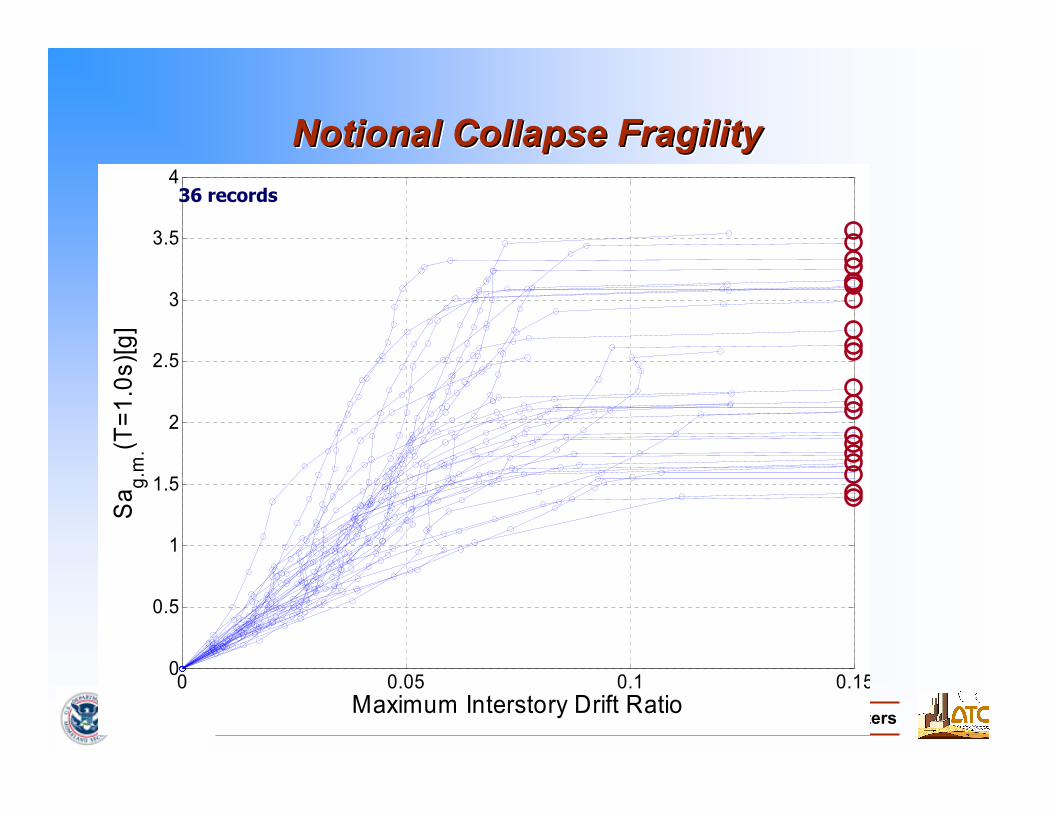
Notional Collapse Fragility – Comprehensive DataNotional Collapse Fragility Notional Collapse Fragility –– Comprehensive DataComprehensive Data
Robust analytical
models of building
configuration/performance
properties evaluated with
representative earthquake records
Comprehensive
collapse data
ATC-63 Quantification of Building System Performance and Response Parameters
0 0.05 0.1 0.150
0.5
1
1.5
2
2.5
3
3.5
4
Sa
g.m
.(T=
1.0
s)[
g]
Maximum Interstory Drift Ratio
36 records
Notional Collapse FragilityNotional Collapse FragilityNotional Collapse Fragility
ATC-63 Quantification of Building System Performance and Response Parameters
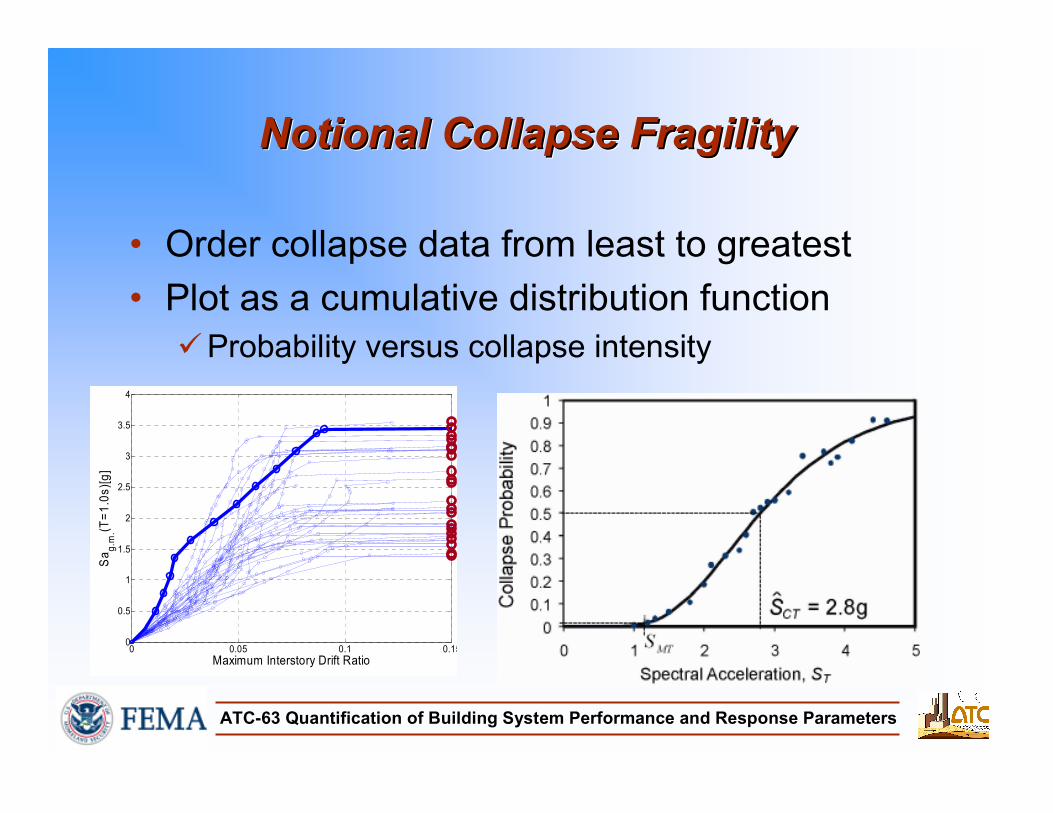
Notional Collapse FragilityNotional Collapse FragilityNotional Collapse Fragility
• Order collapse data from least to greatest
• Plot as a cumulative distribution function
Probability versus collapse intensity
0 0.05 0.1 0.150
0.5
1
1.5
2
2.5
3
3.5
4
Sa
g.m
.(T=
1.0
s)[
g]
Maximum Interstory Drift Ratio
ATC-63 Quantification of Building System Performance and Response Parameters
0.0
0.1
0.2
0.3
0.4
0.5
0.6
0.7
0.8
0.9
1.0
0.0 0.2 0.4 0.6 0.8 1.0 1.2 1.4 1.6 1.8 2.0 2.2 2.4 2.6 2.8 3.0
Collapse Spectral Acceleration (g)
Collapse Probability .
Comprehensive Collapse Data
Lognormal Distribution
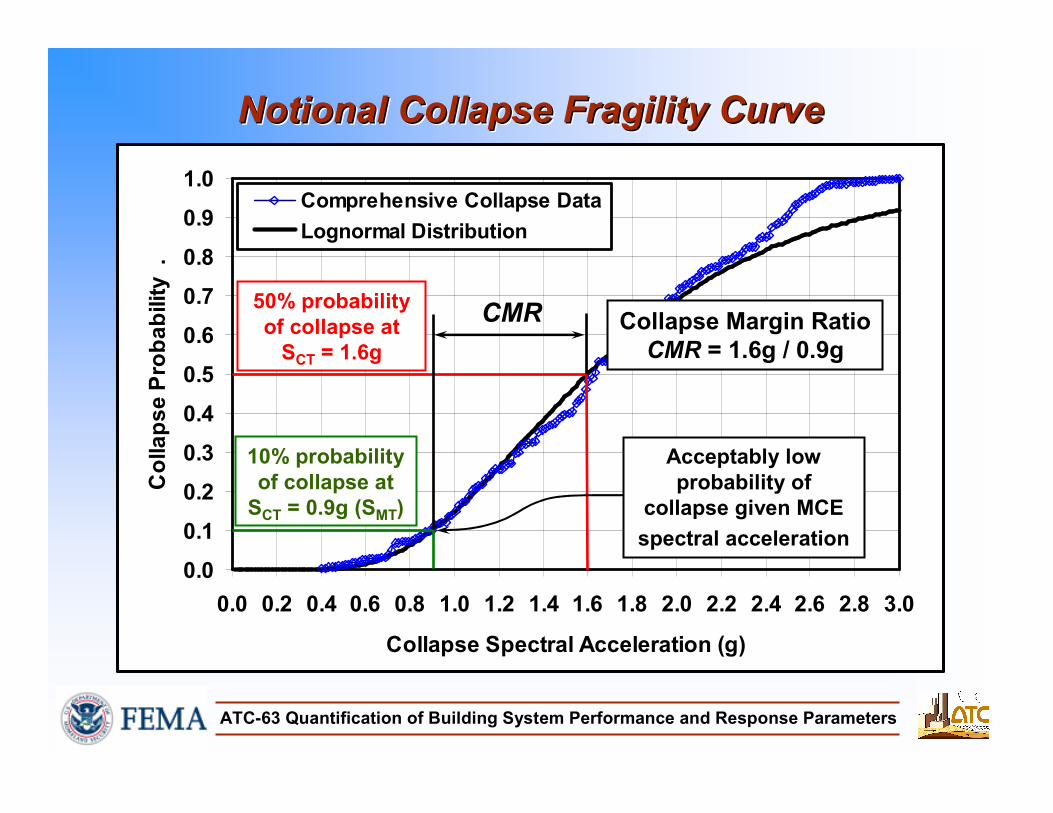
Notional Collapse Fragility CurveNotional Collapse Fragility CurveNotional Collapse Fragility Curve
50% probability
of collapse at
SCT = 1.6g
10% probability
of collapse at
SCT = 0.9g (SMT)
Acceptably low
probability of
collapse given MCE
spectral acceleration
CMR Collapse Margin Ratio
CMR = 1.6g / 0.9g
ATC-63 Quantification of Building System Performance and Response Parameters
Performance EvaluationPerformance EvaluationPerformance Evaluation
• Simply…
Verify that calculated CMR < acceptable CMR
• But…
What is an acceptable probability of collapse?
How many data points are enough?
What is an appropriate analytical model?
How do we address uncertainty?
• Ground motion, Design, Modeling, Testing

ATC-63 Quantification of Building System Performance and Response Parameters
Illustrative ExampleIllustrative ExampleIllustrative Example
ATC-63 Quantification of Building System Performance and Response Parameters
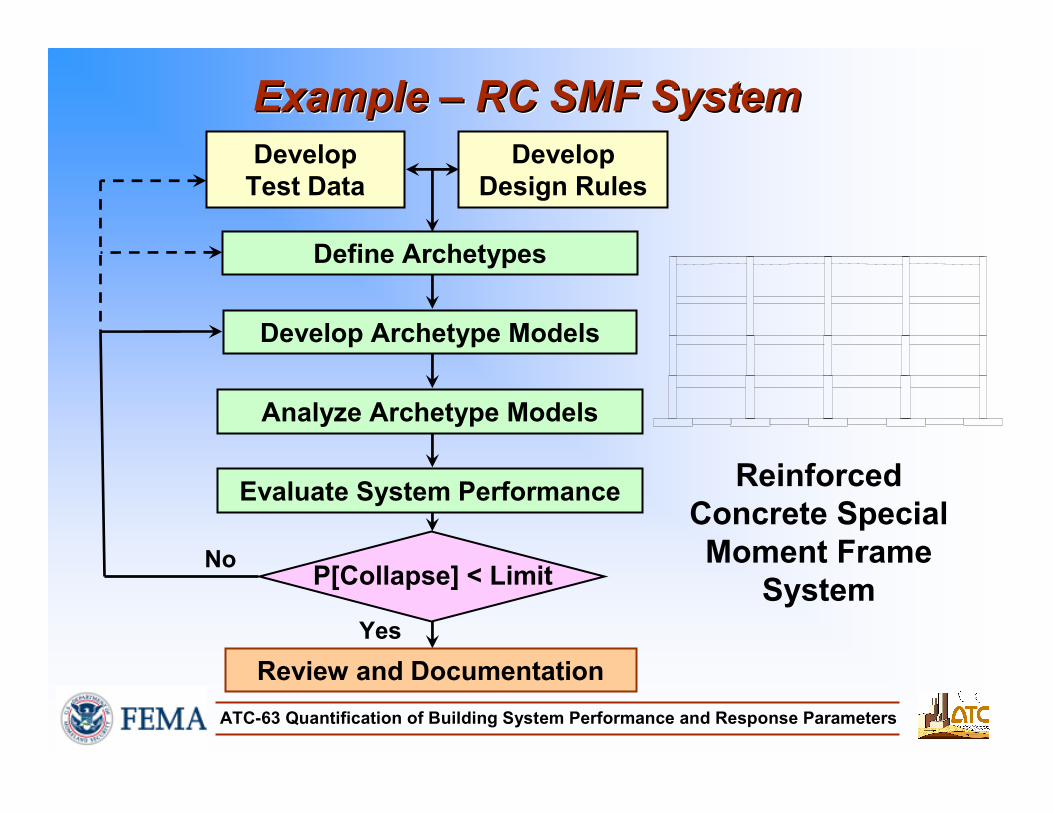
Develop
Design Rules
Develop
Test Data
Define Archetypes
Yes
Review and Documentation
P[Collapse] < Limit
Evaluate System Performance
Analyze Archetype Models
Develop Archetype Models
No
Reinforced
Concrete Special
Moment Frame
System
Example – RC SMF SystemExample Example –– RC SMF SystemRC SMF System
ATC-63 Quantification of Building System Performance and Response Parameters27
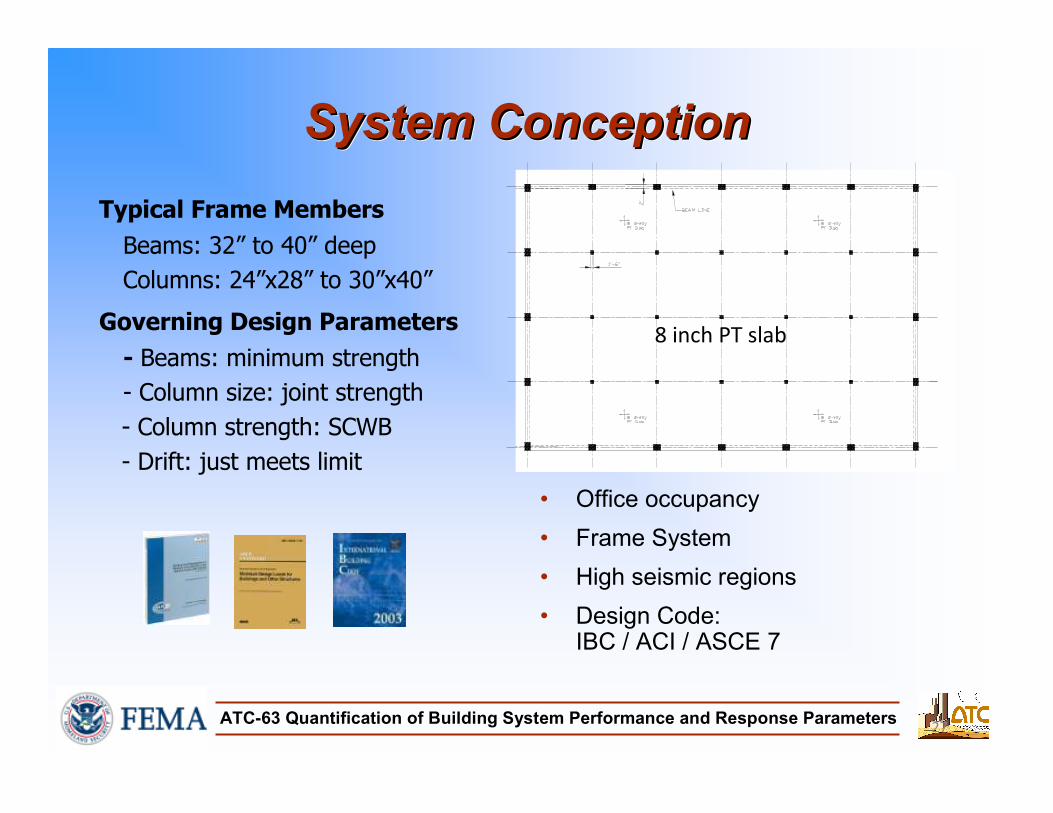
• Office occupancy
• Frame System
• High seismic regions
• Design Code: IBC / ACI / ASCE 7
Typical Frame Members
Beams: 32” to 40” deep
Columns: 24”x28” to 30”x40”
Governing Design Parameters
- Beams: minimum strength
- Column size: joint strength
- Column strength: SCWB
- Drift: just meets limit
8 inch PT slab
System ConceptionSystem ConceptionSystem Conception
ATC-63 Quantification of Building System Performance and Response Parameters
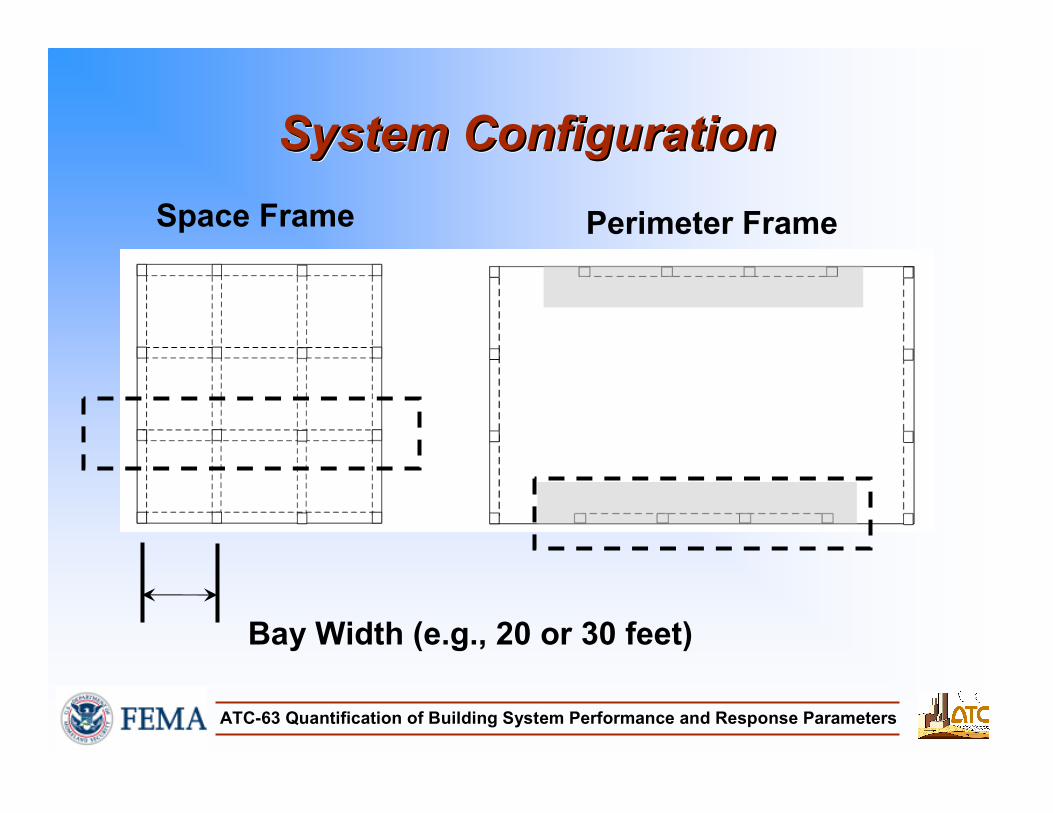
System ConfigurationSystem ConfigurationSystem Configuration
Space Frame Perimeter Frame
Bay Width (e.g., 20 or 30 feet)
ATC-63 Quantification of Building System Performance and Response Parameters
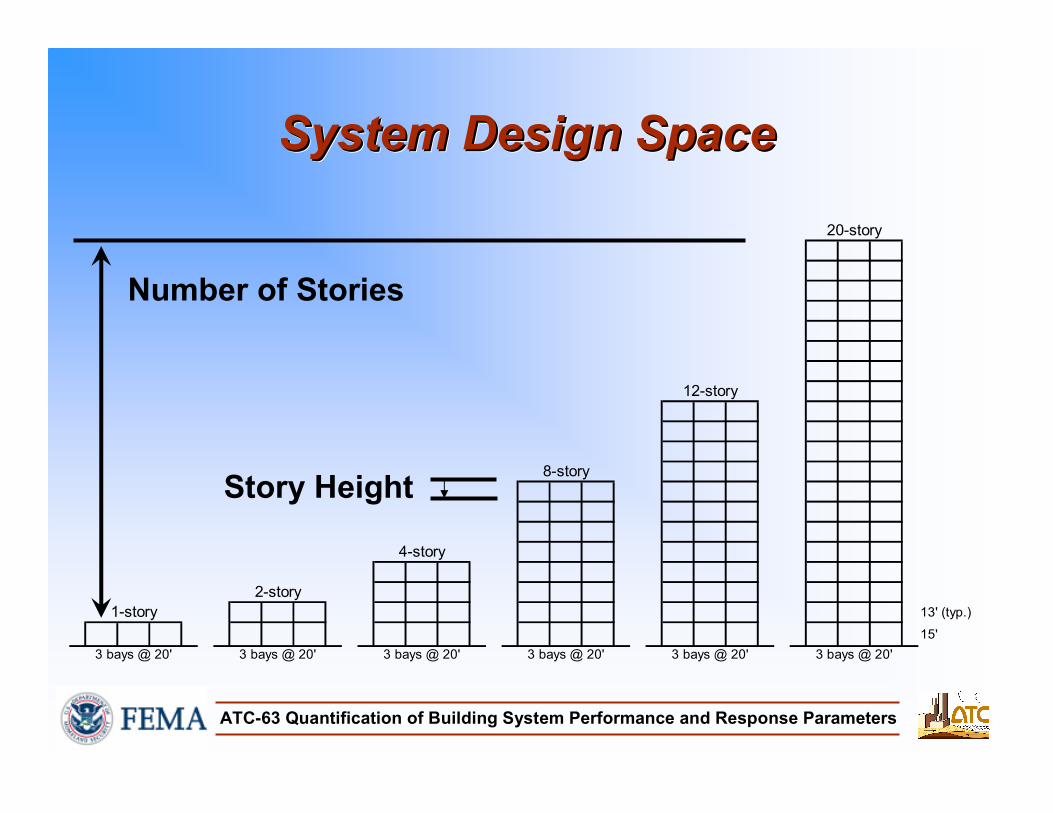
System Design SpaceSystem Design SpaceSystem Design Space
13' (typ.)
15'
12-story
20-story
1-story
2-story
4-story
8-story
3 bays @ 20' 3 bays @ 20' 3 bays @ 20' 3 bays @ 20' 3 bays @ 20' 3 bays @ 20'
Number of Stories
Story Height
ATC-63 Quantification of Building System Performance and Response Parameters
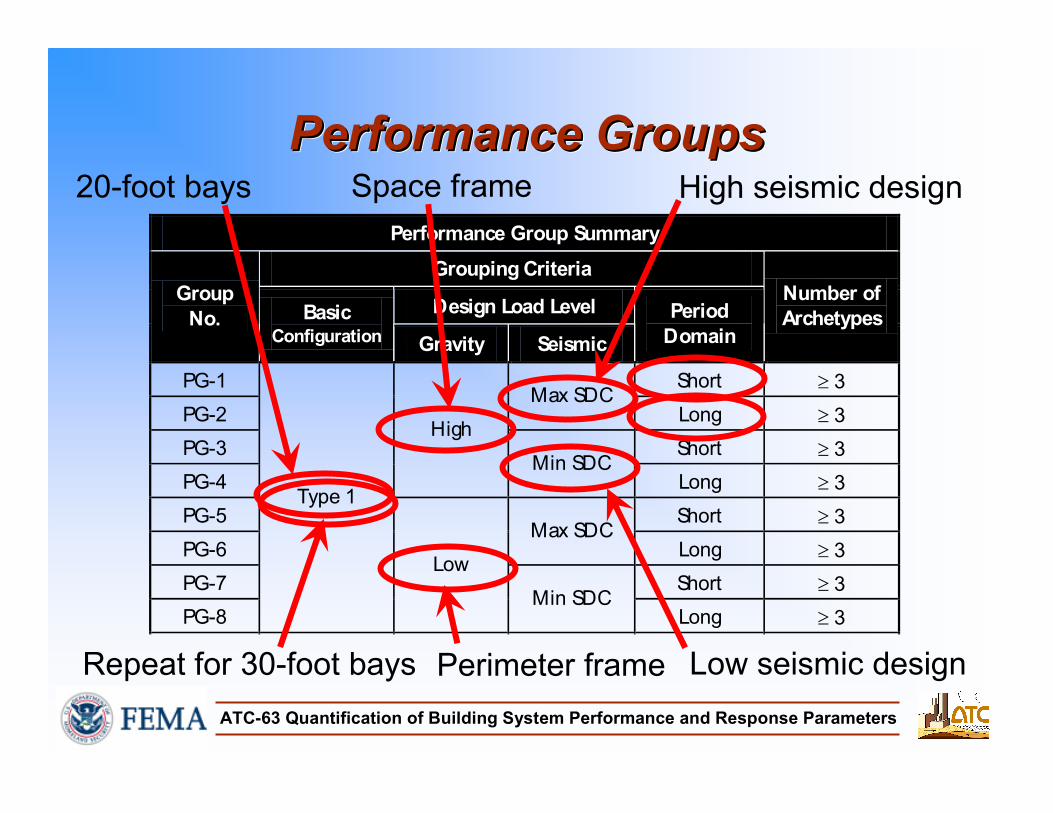
Performance GroupsPerformance GroupsPerformance Groups
Performance Group Summary
Grouping Criteria
Design Load Level Group
No. Basic Configuration Gravity Seismic
Period
Domain
Number of
Archetypes
PG-1 Short ≥ 3
PG-2 Max SDC
Long ≥ 3
PG-3 Short ≥ 3
PG-4
High
Min SDC Long ≥ 3
PG-5 Short ≥ 3
PG-6 Max SDC
Long ≥ 3
PG-7 Short ≥ 3
PG-8
Type 1
Low
Min SDC Long ≥ 3
20-foot bays
Repeat for 30-foot bays
Space frame
Perimeter frame
High seismic design
Low seismic design
ATC-63 Quantification of Building System Performance and Response Parameters
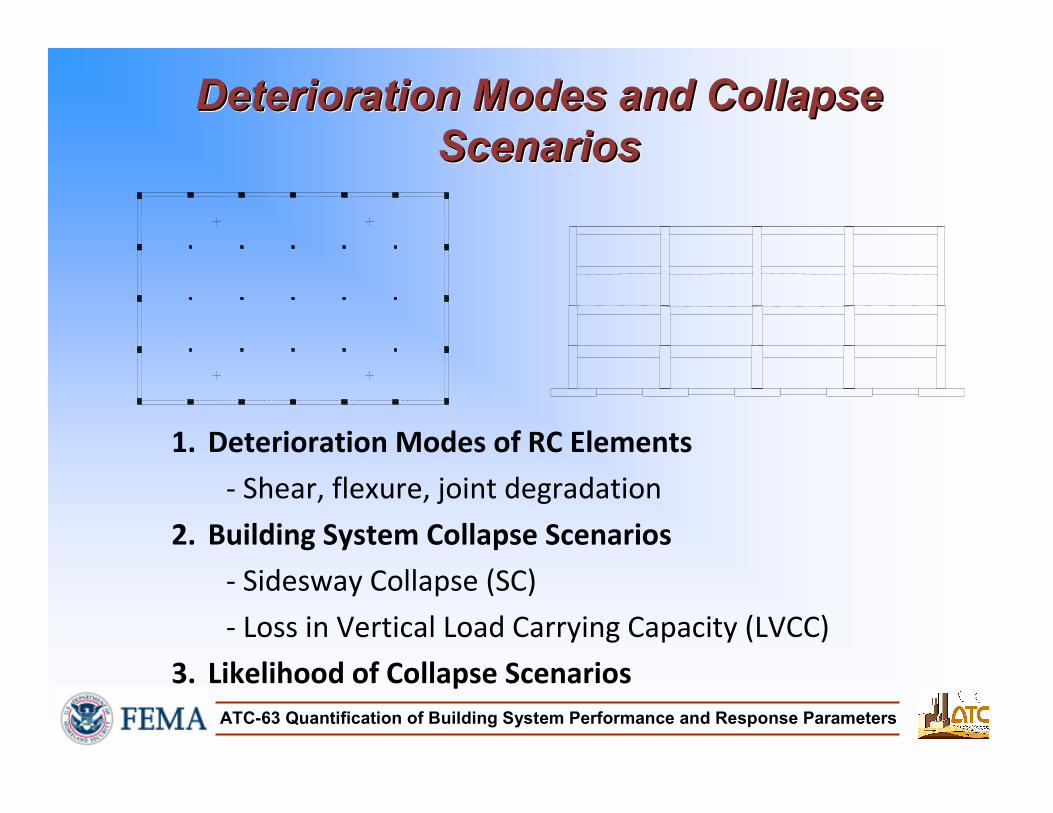
Deterioration Modes and Collapse
Scenarios
Deterioration Modes and Collapse Deterioration Modes and Collapse
ScenariosScenarios
1. Deterioration Modes of RC Elements
- Shear, flexure, joint degradation
2. Building System Collapse Scenarios
- Sidesway Collapse (SC)
- Loss in Vertical Load Carrying Capacity (LVCC)
3. Likelihood of Collapse Scenarios
ATC-63 Quantification of Building System Performance and Response Parameters
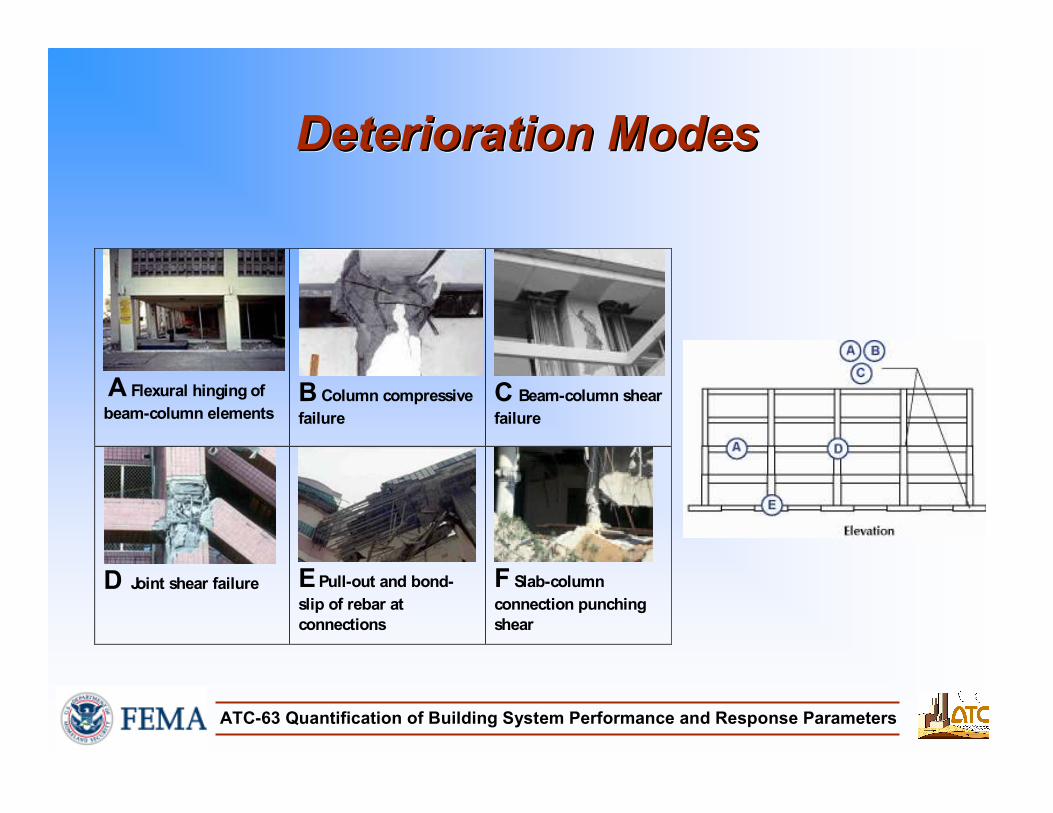
Deterioration ModesDeterioration ModesDeterioration Modes
A Flexural hinging of beam-column elements
B Column compressive failure
C Beam-column shear failure
D Joint shear failure
E Pull-out and bond-slip of rebar at
connections
F Slab-column connection punching
shear
ATC-63 Quantification of Building System Performance and Response Parameters
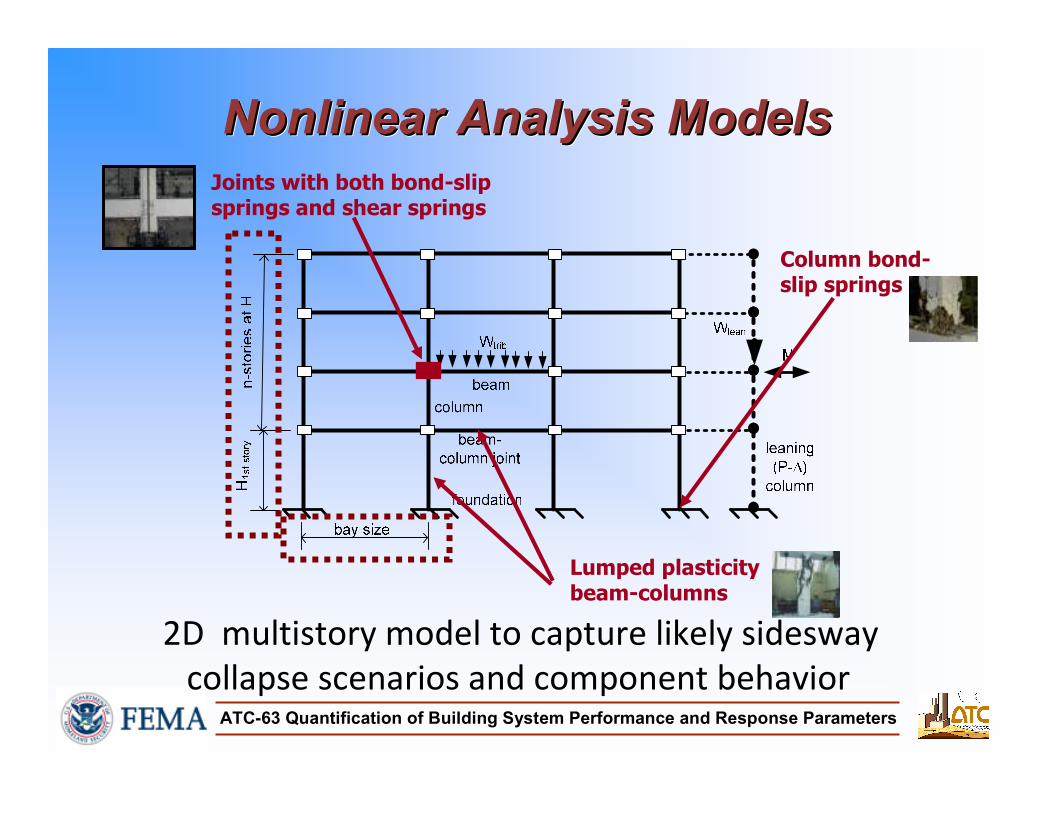
Nonlinear Analysis ModelsNonlinear Analysis ModelsNonlinear Analysis Models
2D multistory model to capture likely sidesway
collapse scenarios and component behavior
Joints with both bond-slip springs and shear springs
Column bond-slip springs
Lumped plasticity beam-columns
ATC-63 Quantification of Building System Performance and Response Parameters
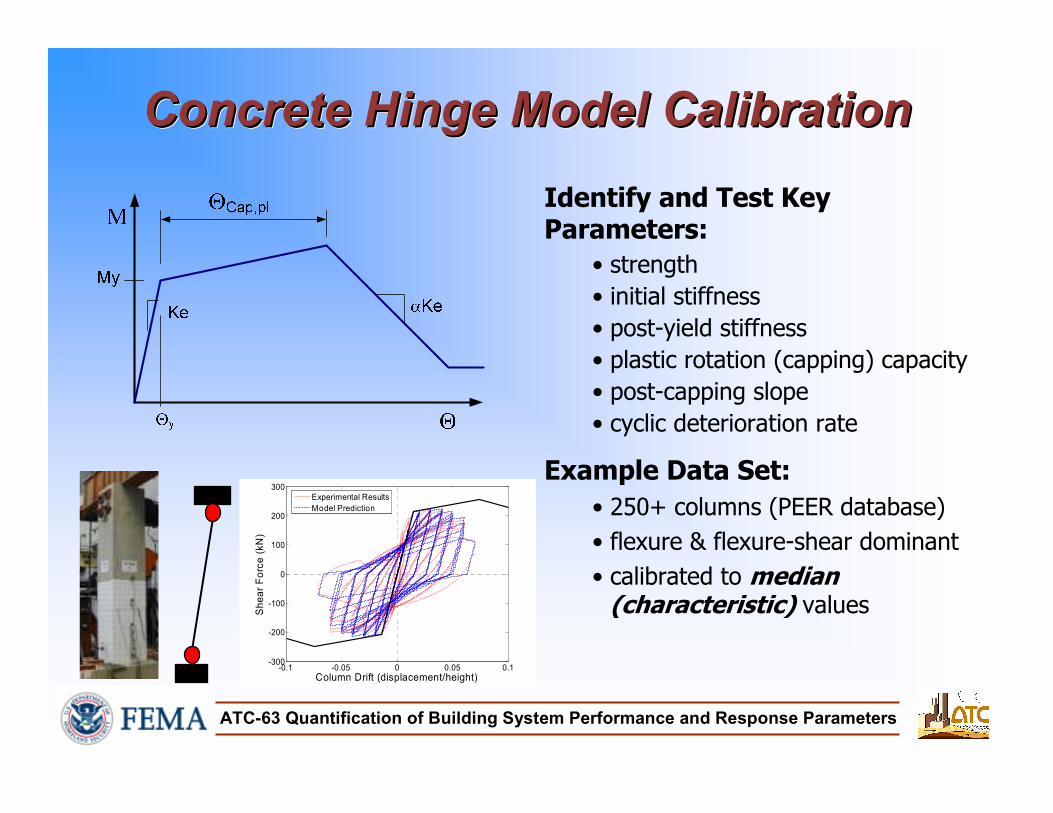
Concrete Hinge Model CalibrationConcrete Hinge Model CalibrationConcrete Hinge Model Calibration
-0.1 -0.05 0 0.05 0.1-300
-200
-100
0
100
200
300
Sh
ea
r F
orc
e (
kN
)
Column Drift (displacement/height)
Experimental Results
Model Prediction
Identify and Test Key Parameters:
• strength
• initial stiffness
• post-yield stiffness
• plastic rotation (capping) capacity
• post-capping slope
• cyclic deterioration rate
Example Data Set:
• 250+ columns (PEER database)
• flexure & flexure-shear dominant
• calibrated to median (characteristic) values
ATC-63 Quantification of Building System Performance and Response Parameters
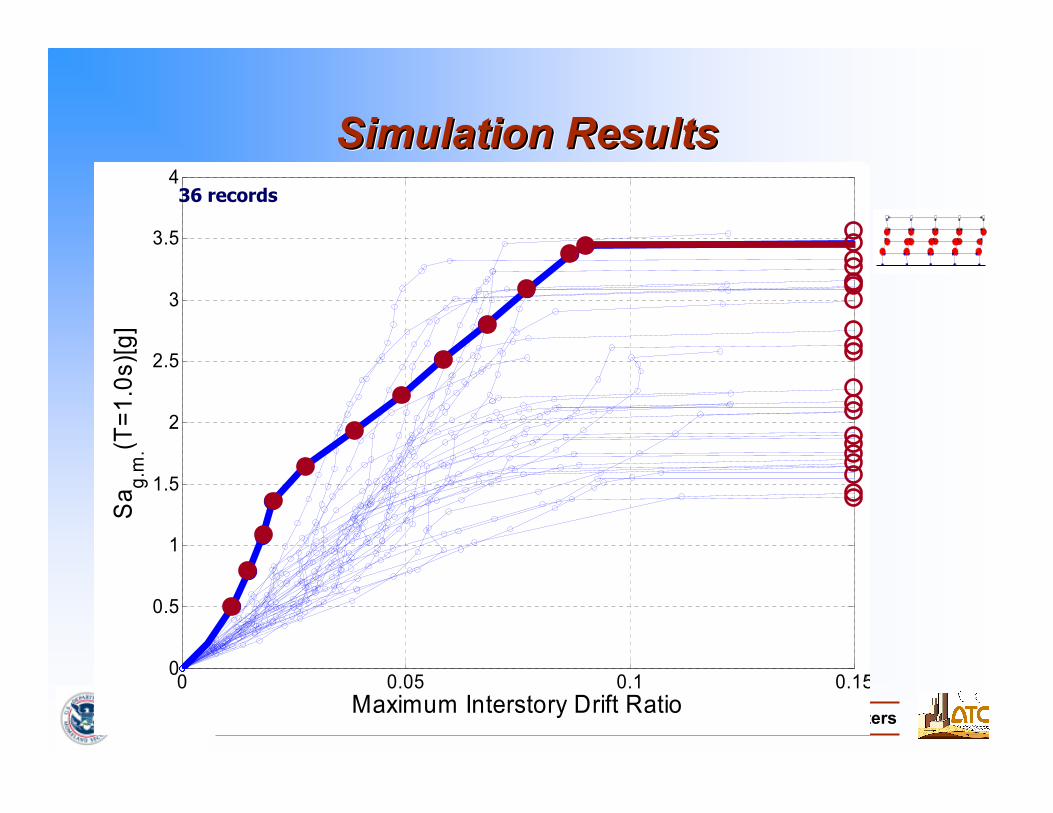
0 0.05 0.1 0.150
0.5
1
1.5
2
2.5
3
3.5
4
Sa
g.m
.(T=
1.0
s)[
g]
Maximum Interstory Drift Ratio0 0.05 0.1 0.15
0
0.5
1
1.5
2
2.5
3
3.5
4
Sa
g.m
.(T=
1.0
s)[
g]
Maximum Interstory Drift Ratio
36 records
Simulation ResultsSimulation ResultsSimulation Results
ATC-63 Quantification of Building System Performance and Response Parameters
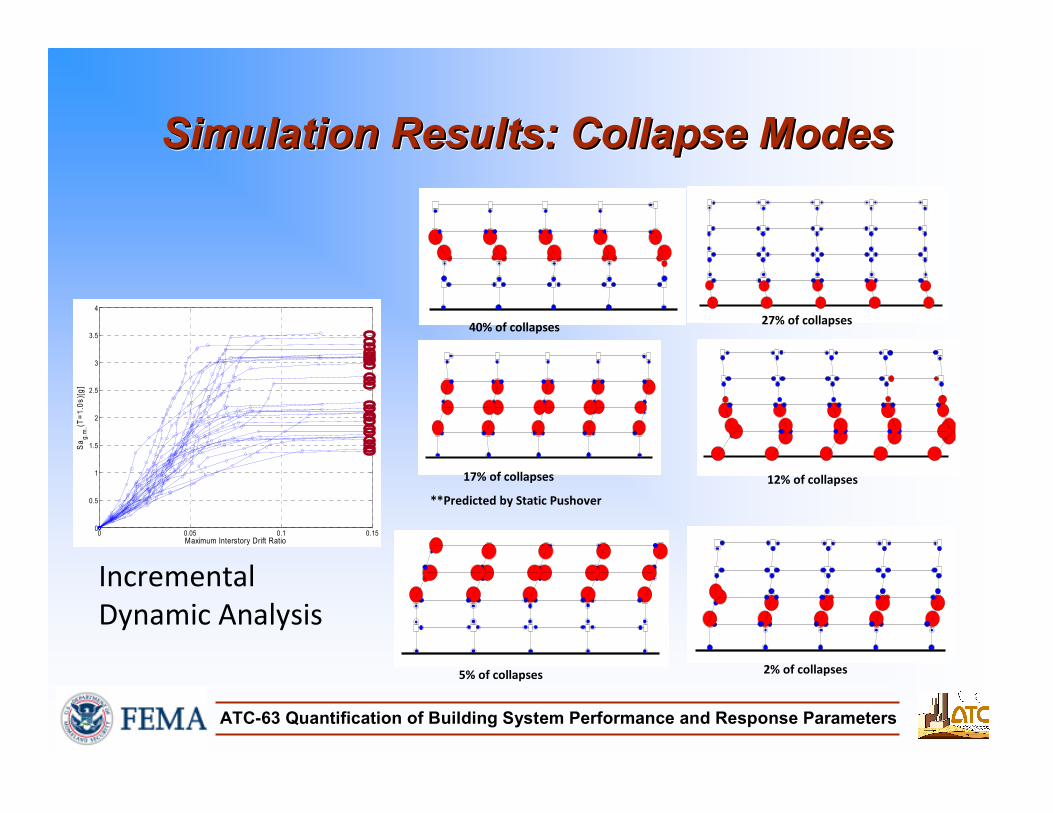
Simulation Results: Collapse ModesSimulation Results: Collapse ModesSimulation Results: Collapse Modes
40% of collapses27% of collapses
17% of collapses
**Predicted by Static Pushover
12% of collapses
5% of collapses 2% of collapses
0 0.05 0.1 0.150
0.5
1
1.5
2
2.5
3
3.5
4
Sa
g.m
.(T=
1.0
s)[
g]
Maximum Interstory Drift Ratio
Incremental
Dynamic Analysis
ATC-63 Quantification of Building System Performance and Response Parameters
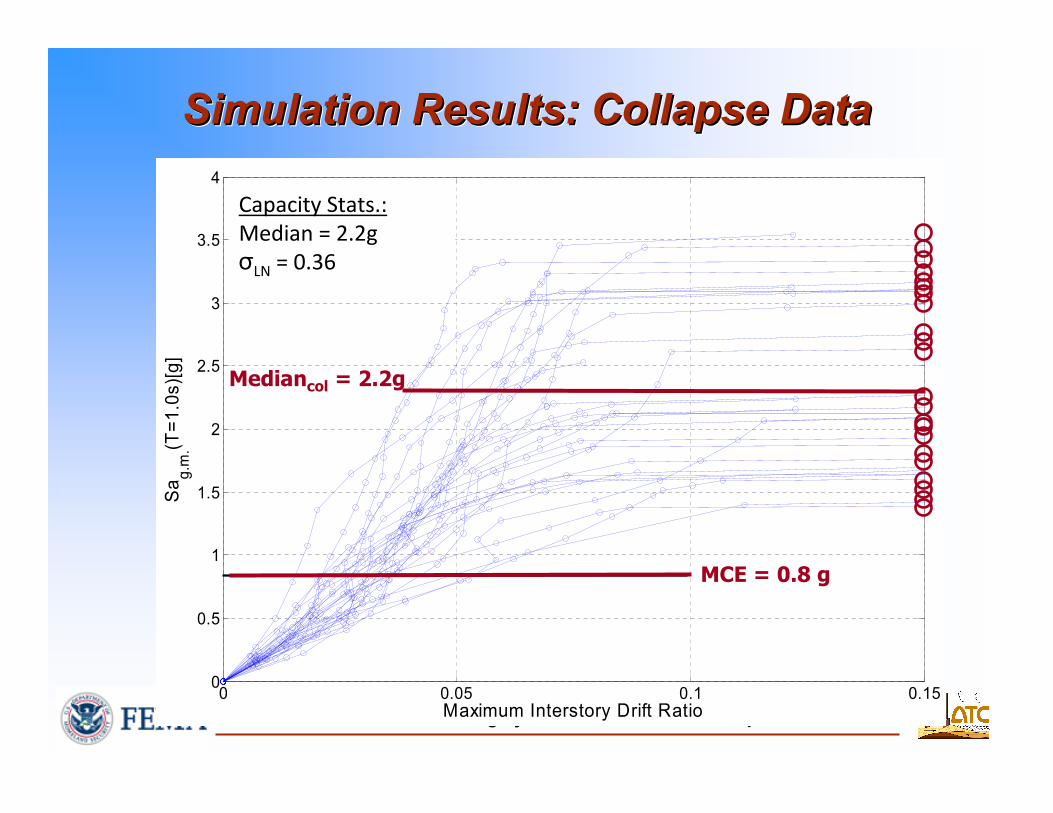
0 0.05 0.1 0.150
0.5
1
1.5
2
2.5
3
3.5
4S
ag
.m.(T
=1
.0s)[
g]
Maximum Interstory Drift Ratio
Capacity Stats.:
Median = 2.2g
σLN = 0.36
Simulation Results: Collapse DataSimulation Results: Collapse DataSimulation Results: Collapse Data
MCE = 0.8 g
Mediancol = 2.2g
ATC-63 Quantification of Building System Performance and Response Parameters
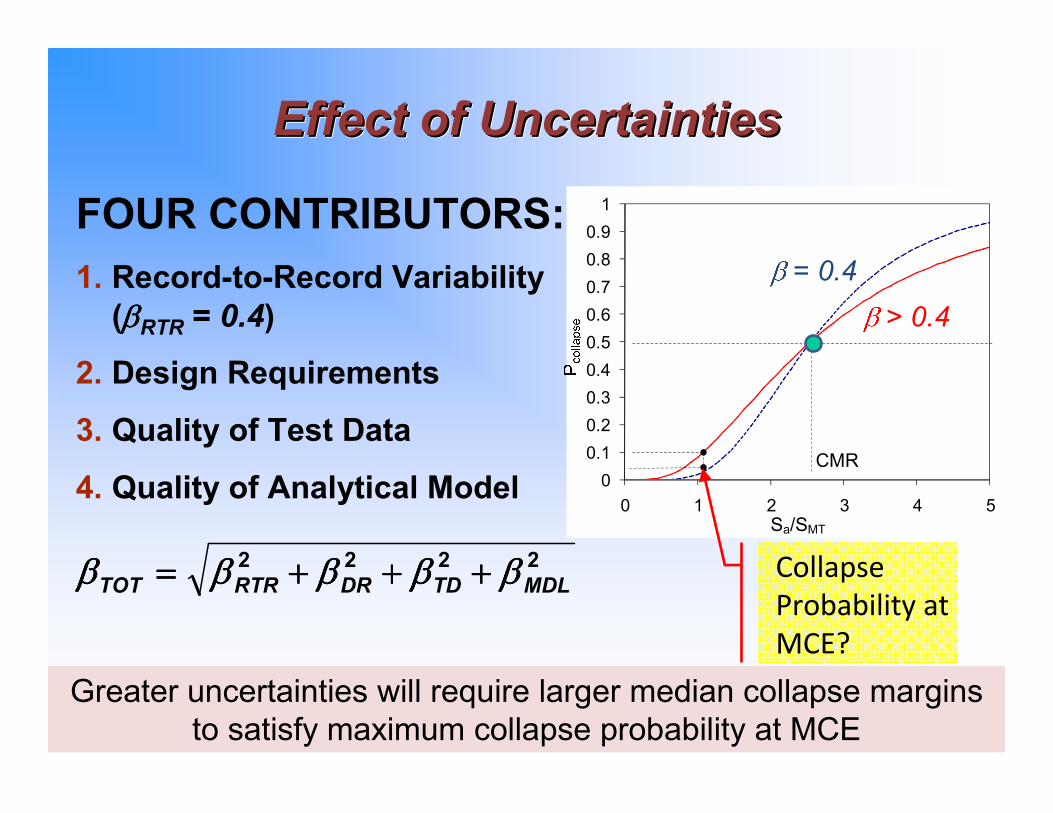
Effect of UncertaintiesEffect of UncertaintiesEffect of Uncertainties
0
0.1
0.2
0.3
0.4
0.5
0.6
0.7
0.8
0.9
1
0 1 2 3 4 5
CMR
= 0.4
Sa/SMT
> 0.4
FOUR CONTRIBUTORS:
1. Record-to-Record Variability
(ββββRTR = 0.4)
2. Design Requirements
3. Quality of Test Data
4. Quality of Analytical Model
2222
MDLTDDRRTRTOT ββββββββββββββββββββ ++++++++++++====
Greater uncertainties will require larger median collapse margins
to satisfy maximum collapse probability at MCE
Collapse
Probability at
MCE?
ATC-63 Quantification of Building System Performance and Response ParametersATC-63 Quantification of Building System Performance and Response Parameters
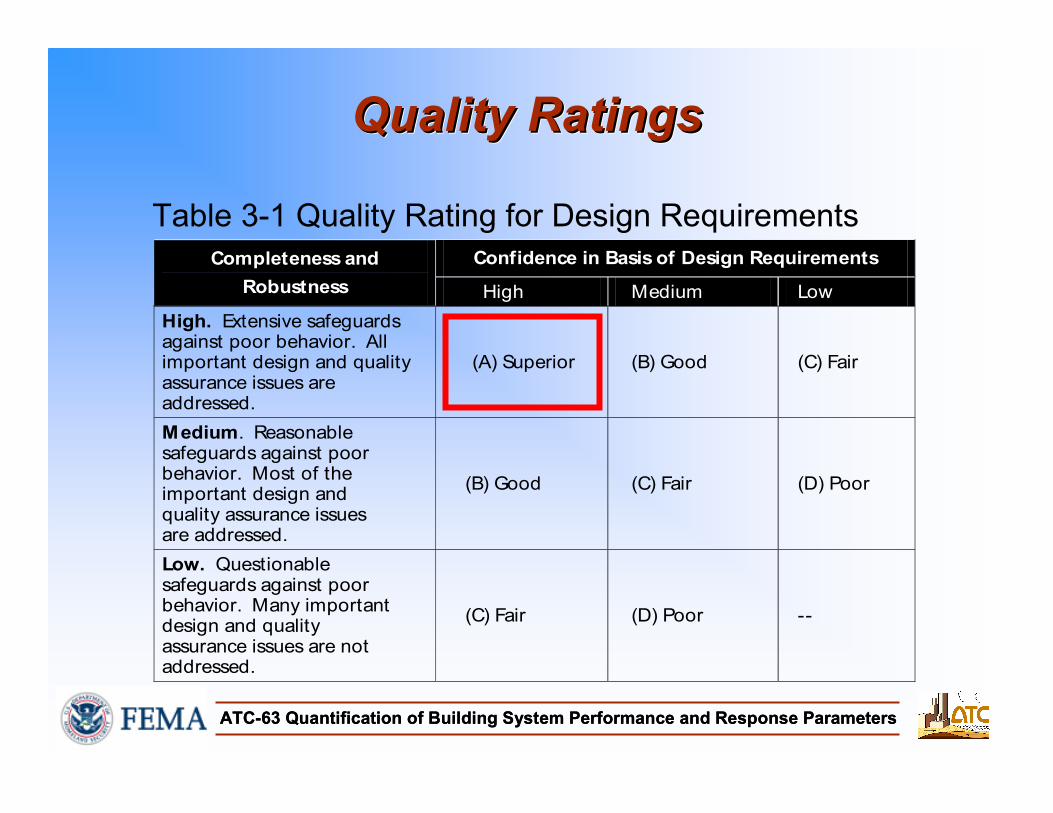
Table 3-1 Quality Rating for Design Requirements
Completeness and
Robustness
Confidence in Basis of Design Requirements
High Medium Low
High. Extensive safeguards against poor behavior. All important design and quality assurance issues are addressed.
(A) Superior (B) Good (C) Fair
Medium. Reasonable safeguards against poor behavior. Most of the important design and quality assurance issues are addressed.
(B) Good (C) Fair (D) Poor
Low. Questionable safeguards against poor behavior. Many important design and quality assurance issues are not addressed.
(C) Fair (D) Poor --
Quality RatingsQuality RatingsQuality Ratings
ATC-63 Quantification of Building System Performance and Response Parameters
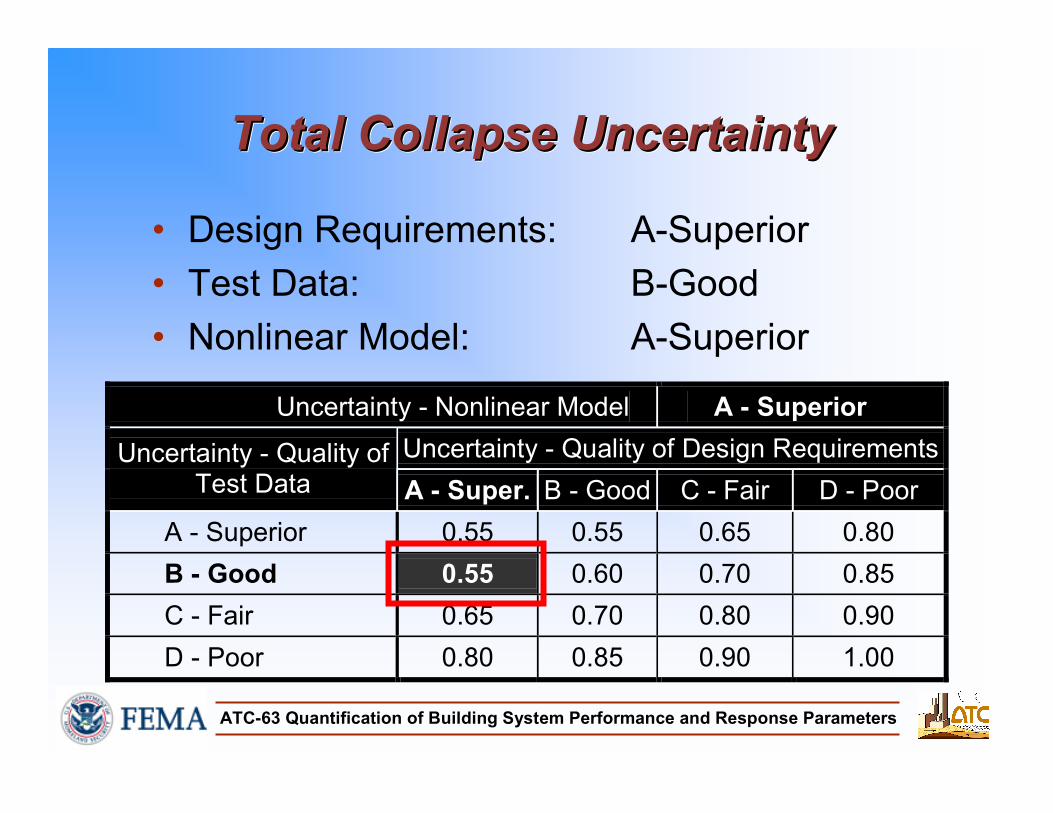
Total Collapse UncertaintyTotal Collapse UncertaintyTotal Collapse Uncertainty
• Design Requirements: A-Superior
• Test Data: B-Good
• Nonlinear Model: A-Superior
Uncertainty - Nonlinear Model A - Superior
Uncertainty - Quality of Design Requirements Uncertainty - Quality of Test Data A - Super. B - Good C - Fair D - Poor
A - Superior 0.55 0.55 0.65 0.80
B - Good 0.55 0.60 0.70 0.85
C - Fair 0.65 0.70 0.80 0.90
D - Poor 0.80 0.85 0.90 1.00
ATC-63 Quantification of Building System Performance and Response Parameters
0 0.05 0.1 0.150
0.5
1
1.5
2
2.5
3
3.5
4
Sa
g.m
.(T=
1.0
s)[
g]
Maximum Interstory Drift Ratio
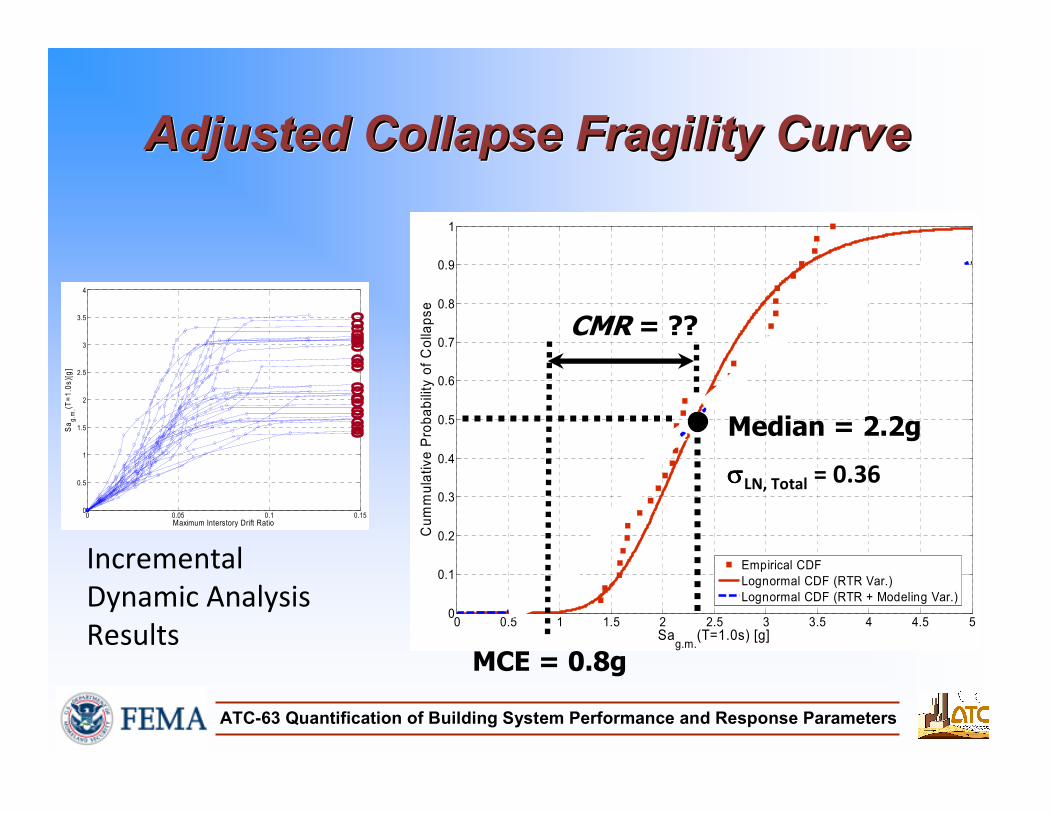
Incremental
Dynamic Analysis
Results0 0.5 1 1.5 2 2.5 3 3.5 4 4.5 5
0
0.1
0.2
0.3
0.4
0.5
0.6
0.7
0.8
0.9
1
Sag.m.
(T=1.0s) [g]
Cu
mm
ula
tiv
e P
rob
ab
ility
of
Co
llap
se
Empirical CDF
Lognormal CDF (RTR Var.)
Lognormal CDF (RTR + Modeling Var.)
Median = 2.2g
σσσσLN, Total = 0.36
Adjusted Collapse Fragility CurveAdjusted Collapse Fragility CurveAdjusted Collapse Fragility Curve
MCE = 0.8g
CMR = ??
ATC-63 Quantification of Building System Performance and Response Parameters
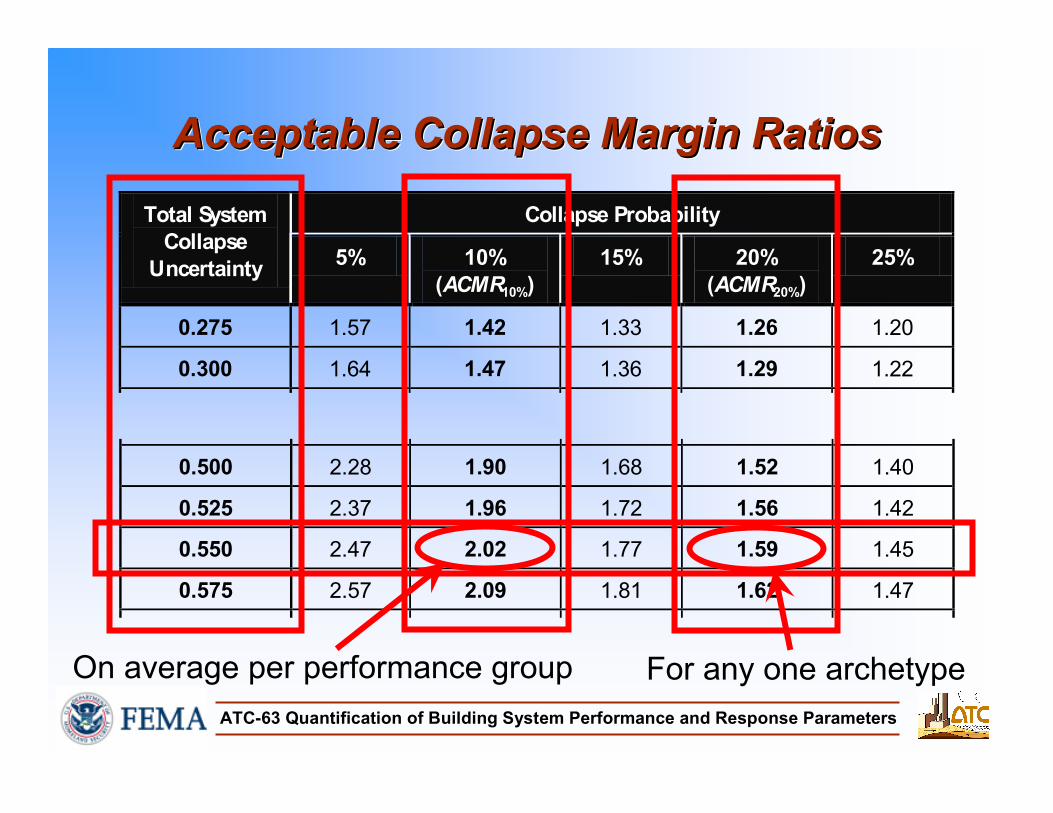
Acceptable Collapse Margin RatiosAcceptable Collapse Margin RatiosAcceptable Collapse Margin Ratios
Collapse Probability Total System
Collapse
Uncertainty 5% 10%
(ACMR10%)
15% 20%
(ACMR20%)
25%
0.275 1.57 1.42 1.33 1.26 1.20
0.300 1.64 1.47 1.36 1.29 1.22
0.500 2.28 1.90 1.68 1.52 1.40
0.525 2.37 1.96 1.72 1.56 1.42
0.550 2.47 2.02 1.77 1.59 1.45
0.575 2.57 2.09 1.81 1.62 1.47
For any one archetypeOn average per performance group
ATC-63 Quantification of Building System Performance and Response Parameters
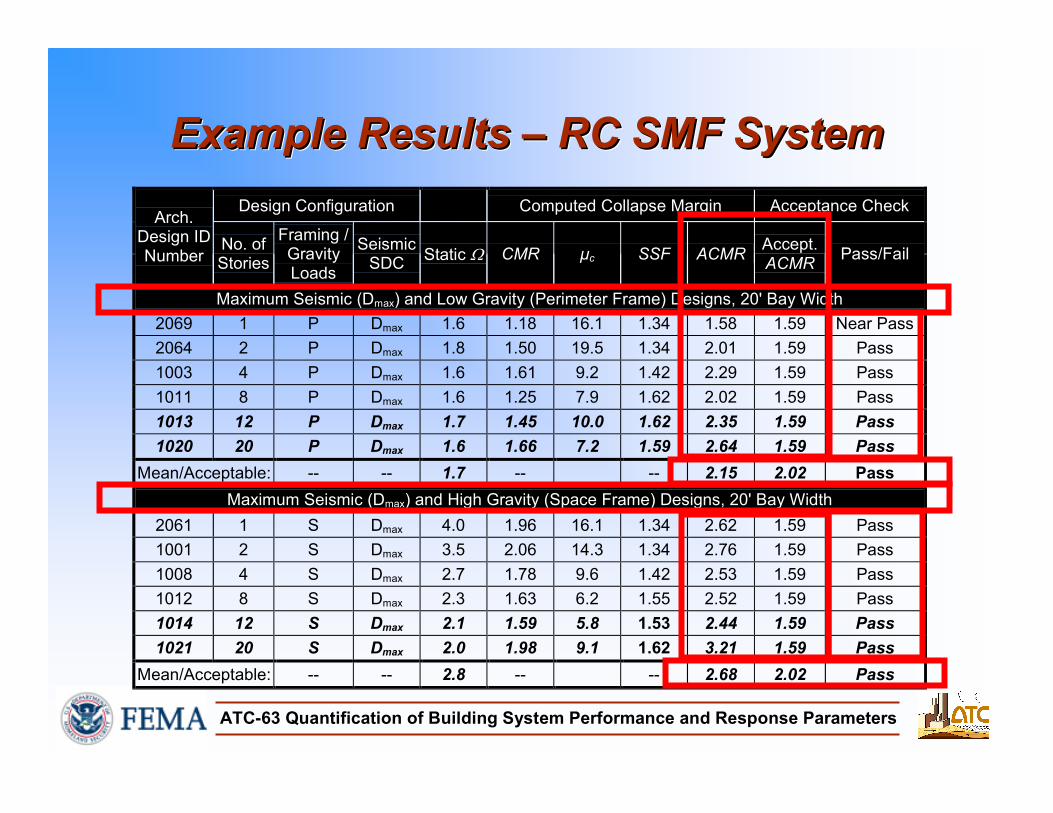
Example Results – RC SMF SystemExample Results Example Results –– RC SMF SystemRC SMF System
Design Configuration Computed Collapse Margin Acceptance Check Arch.
Design ID Number
No. of Stories
Framing / Gravity Loads
Seismic SDC
Static Ω CMR µc SSF ACMR Accept. ACMR
Pass/Fail
Maximum Seismic (Dmax) and Low Gravity (Perimeter Frame) Designs, 20' Bay Width
2069 1 P Dmax 1.6 1.18 16.1 1.34 1.58 1.59 Near Pass
2064 2 P Dmax 1.8 1.50 19.5 1.34 2.01 1.59 Pass
1003 4 P Dmax 1.6 1.61 9.2 1.42 2.29 1.59 Pass
1011 8 P Dmax 1.6 1.25 7.9 1.62 2.02 1.59 Pass
1013 12 P Dmax 1.7 1.45 10.0 1.62 2.35 1.59 Pass
1020 20 P Dmax 1.6 1.66 7.2 1.59 2.64 1.59 Pass
Mean/Acceptable: -- -- 1.7 -- -- 2.15 2.02 Pass
Maximum Seismic (Dmax) and High Gravity (Space Frame) Designs, 20' Bay Width
2061 1 S Dmax 4.0 1.96 16.1 1.34 2.62 1.59 Pass
1001 2 S Dmax 3.5 2.06 14.3 1.34 2.76 1.59 Pass
1008 4 S Dmax 2.7 1.78 9.6 1.42 2.53 1.59 Pass
1012 8 S Dmax 2.3 1.63 6.2 1.55 2.52 1.59 Pass
1014 12 S Dmax 2.1 1.59 5.8 1.53 2.44 1.59 Pass
1021 20 S Dmax 2.0 1.98 9.1 1.62 3.21 1.59 Pass
Mean/Acceptable: -- -- 2.8 -- -- 2.68 2.02 Pass
ATC-63 Quantification of Building System Performance and Response Parameters
RC SMF Example - ConclusionsRC SMF Example RC SMF Example -- ConclusionsConclusions
• A value of R=8 provides an acceptable level
of collapse safety
• The Methodology is reasonably well-
calibrated to current design provisions
RC SMF systems didn’t fail miserably
RC SMF systems didn’t pass easily
• This was true of all systems tested
ATC-63 Quantification of Building System Performance and Response Parameters
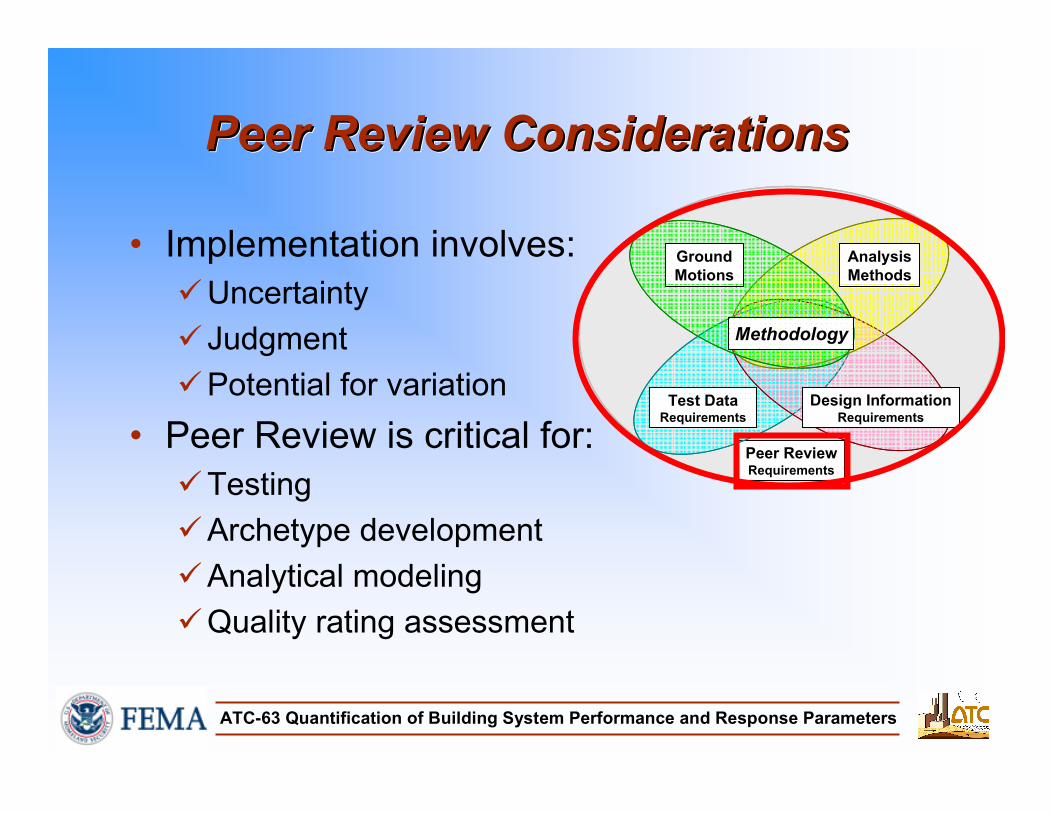
Peer Review ConsiderationsPeer Review ConsiderationsPeer Review Considerations
• Implementation involves:
Uncertainty
Judgment
Potential for variation
• Peer Review is critical for:
Testing
Archetype development
Analytical modeling
Quality rating assessment
Peer ReviewRequirements
Test Data Requirements
Design Information Requirements
Analysis
Methods
Ground
Motions
Methodology
Peer ReviewRequirements
Peer ReviewRequirements
Test Data Requirements
Test Data Requirements
Design Information Requirements
Design Information Requirements
Analysis
Methods
Analysis
Methods
Ground
Motions
Ground
Motions
Methodology
ATC-63 Quantification of Building System Performance and Response Parameters
Observations and FindingsObservations and FindingsObservations and Findings
ATC-63 Quantification of Building System Performance and Response Parameters
Observations and FindingsObservations and FindingsObservations and Findings
• Methodology was developed considering:
special concrete moment frames
ordinary concrete moment frames
special steel moment frames
wood shear walls
• Some trends in our current design process
have become apparent…
ATC-63 Quantification of Building System Performance and Response Parameters
Observations and FindingsObservations and FindingsObservations and Findings
• Performance assessment is a difficult challenge
fraught with much uncertainty
• Buildings located in the near-field have higher
collapse probabilities
• Short period buildings have higher collapse
probabilities
• Collapse performance varies by Seismic Design
Category
• Secondary systems influence collapse capacity
• There is no practical difference in performance
between R=6 and R=6.5
ATC-63 Quantification of Building System Performance and Response Parameters
SummarySummarySummary
• Recommended Methodology provides a rational basis for establishing global seismic performance factors (e.g., R factors)
• Intended to support and improve Seismic Codes:
Adoption of new systems that must be assigned values of seismic performance factors
Improvement of current values of seismic performance factors of existing systems
Collapse evaluation of a specific building designed using alternative “performance-based” methods
• FEMA P-695 is now available online and in print
(App. F)
ATC-63 Quantification of Building System Performance and Response Parameters
Thank you!Thank you!Thank you!