associations between single nucleotide polymorphisms and … · 2015-09-22 · genetics and...
TRANSCRIPT
©FUNPEC-RP www.funpecrp.com.brGenetics and Molecular Research 14 (3): 11133-11144 (2015)
Associations between single nucleotide polymorphisms and carcass traits in Nellore cattle using high-density panels
R. Espigolan1, F. Baldi1, A.A. Boligon1,2, F.R.P. Souza1,3, G.A. Fernandes Júnior1, D.G.M. Gordo1, G.C. Venturini1, G.M.F. de Camargo1, F.L.B. Feitosa1, D.A. Garcia1, H. Tonhati1, L.A.L. Chardulo4, H.N. Oliveira1 and L.G. Albuquerque1
1Departamento de Zootecnia, Faculdade de Ciências Agrárias e Veterinárias, Jaboticabal, SP, Brasil2Departamento de Zootecnia, Universidade Federal de Pelotas, Pelotas, RS, Brasil3Departamento de Ecologia, Zoologia e Genética, Instituto de Biologia, Universidade Federal de Pelotas, Pelotas, RS, Brasil4Departamento de Melhoramento e Nutrição Animal, Faculdade de Medicina Veterinária e Zootecnia, Universidade Estadual Paulista, Botucatu, SP, Brasil
Corresponding author: L.G. AlbuquerqueE-mail: [email protected]
Genet. Mol. Res. 14 (3): 11133-11144 (2015)Received December 1, 2014Accepted June 3, 2015Published September 22, 2015DOI http://dx.doi.org/10.4238/2015.September.22.7
ABSTRACT. The objective of this study was to evaluate associations between single nucleotide polymorphism (SNP) markers and carcass traits measured postmortem in Nellore cattle. Records of loin eye area (LEA) and backfat thickness (BF) from 740 males and records of hot carcass weight (HCW) from 726 males were analyzed. All of the animals were genotyped using the BovineHD BeadChip. Association analyses were performed by the restricted maximum likelihood method that considered one SNP at a time. Significant SNPs were identified on
11134R. Espigolan et al.
©FUNPEC-RP www.funpecrp.com.brGenetics and Molecular Research 14 (3): 11133-11144 (2015)
chromosomes 2 and 6 for LEA and on chromosomes 7, 1, and 2 for BF. For HCW, associations with SNPs were found on chromosomes 13, 14, and 28, in addition to genome regions that were directly related to this trait, such as the EFCAB8 and VSTM2L genes, and to bone development (RHOU). Some SNPs were located in very close proximity to genes involved in basal metabolism (BLCAP, NNAT, CTNNBL1, TGM2, and LOC100296770) and the immune system (BPI).
Key words: Beef cattle; Genome; Meat quality; Molecular marker
INTRODUCTION
Brazil possesses the largest commercial beef cattle herd in the world, with an estimated 188.5 million animals and a production of more than 8 million carcass weights equivalent per year (Anualpec, 2014). Zebu breeds account for approximately 80% of the Brazilian herd, and the main focus of Zebu breeding programs has been the selection for growth traits but few programs have focused on traits related to carcass and meat quality. However, there has been a marked increase in international consumer demand in terms of the quality and safety of meat products, a trend also observed in the national market.
Animals of the Nellore breed deposit subcutaneous fat relatively early, and offer advantages in terms of carcass yield; however, muscle tissue growth is low when compared to taurine breeds (Restle et al., 2002). In addition, Nellore animals produce carcasses with a lower proportion of fat and a lower intramuscular fat percentage than Bos taurus (Cundiff, 2004). A high-quality carcass should contain a sufficient amount of fat cover to guarantee its preservation and characteristics desirable for consumption (Cundiff et al., 1993).
Traits such as loin eye area (LEA) and backfat thickness (BF) can be measured by ultrasound or directly in the carcass. However, correlations between measures obtained by ultrasound and those evaluated directly in the carcass are affected by several factors, such as experience of the technician, fat and muscle carcass levels, postmortem tissue characteristics, and muscle displacement in relation to the skeleton (Perkins, 1992). In Brazil, although genetic evaluations of ultrasound-measured carcass traits are performed in some breeding programs, it is still difficult to find young animals in which these traits are evaluated, particularly Nellore animals.
In genome-wide association studies (GWAS), variations that exist across the genome (mainly single nucleotide polymorphisms, SNPs) are used together with phenotype and pedigree data to identify genes and regions that contain potential quantitative trait loci (QTLs) for traits that are important in livestock production. GWAS have been used for the first time for the analysis of human diseases, and have become a suitable tool for domestic animals as a result of the development of large collections of SNPs and the large-scale analysis of SNPs at moderate cost (Zhang et al., 2012). The molecular data obtained in GWAS permit the genetic evaluation of young animals for traits of interest in livestock production, such as hot carcass weight (HCW), LEA, and BF.
Recently, studies have been conducted that have explored the potential of GWAS in detecting regions that contain potential QTLs. Lee et al. (2012) genotyped Korean Hanwoo cattle using the 10K Affymetrix SNP Chip, and identified QTLs for carcass weight, LEA, fat thickness, and marbling on chromosomes 4, 6, 13, 16, and 23. Using a chip with a higher
11135Genetic markers for meat quality traits in Nellore cattle
©FUNPEC-RP www.funpecrp.com.brGenetics and Molecular Research 14 (3): 11133-11144 (2015)
density of markers (BovineSNP50 BeadChip), Nishimura et al. (2012) identified SNPs associated with carcass weight on chromosomes 6, 8, and 14 of Japanese Black cattle. Mokry et al. (2013) genotyped 400 Canchim cattle using the BovineHD BeadChip. The authors found an association between SNPs and BF, indicating regions with potential QTLs for this trait on chromosomes 1, 3, 13, and 19.
Few studies have used high-density SNP chips for association analysis with carcass and meat traits measured postmortem in Nellore cattle. Therefore, the objective of the present study was to evaluate associations between SNP markers in the Nellore genome with carcass traits measured postmortem, in order to provide data that contribute to genetic evaluations for these traits.
MATERIAL AND METHODS
Animals and traits studied
The phenotypic data used in this study were obtained from uncastrated Nellore males from eight farms in the Brazilian states of Mato Grosso, Mato Grosso do Sul, Bahia, and Goiás, which participate in three large Nellore breeding programs (DeltaGen, Paint CRV Lagoa, and Nelore Qualitas). Nellore is a breed of Indian origin used as beef cattle. About 80% of the Brazilian cattle herd is composed of animals of this breed and their crossbreds (Albuquerque et al., 2006).
Records of LEA and BF obtained from 740 animals and records of HCW obtained from 726 animals were used (Table 1). The animals were sons of 108 sires and were born between 2008 and 2009, reared on pasture, and feedlot-fed over a period of approximately 90 days during the finishing phase. The mean age (SD) of the animals at slaughter was 704 (52) days. The following phenotypic traits were studied: HCW, LEA, and BF. The animals were slaughtered at commercial slaughterhouses, and HCW was measured by weighing the half-carcasses in the slaughter line of each facility. The carcasses were then cooled for a minimum period of 24 h. After cooling, samples of Longissimus dorsi muscle with bone that were approximately 2.54 cm thick were collected between the 12th and 13th rib of the left half-carcass of each animal. For BF evaluation, the fat layer located at an angle of 45° from the geometric center of the sample was measured with a caliper, and the results are reported in millimeters. LEA was measured by the grid method, and is expressed as squared centimeters. Descriptive statistics for the traits studied are presented in Table 1.
Trait N Means SD
HCW (kg) 726 270.19 20.87LEA (cm²) 740 66.99 7.97BF (mm) 740 5.39 3.28
HCW = hot carcass weight; LEA = loin eye area; BF = backfat thickness; N = number of observations; SD = standard deviation.
Table 1. Descriptive statistics for Nellore cattle carcass traits.
Genotyping and quality control
Genotyping was performed using the BovineHD BeadChip (Illumina Inc., San Diego,
11136R. Espigolan et al.
©FUNPEC-RP www.funpecrp.com.brGenetics and Molecular Research 14 (3): 11133-11144 (2015)
CA, USA) according to the manufacturer protocol in a HiScanTM SQ System. The BovineHD BeadChip contains 777,962 SNP markers distributed across the genome at an average distance of 3.43 kb between markers. The GenomeStudio software (Illumina®) was used to analyze the HiScanTM images and obtain the genotypes.
The genotypes were defined as 0 (AA), 1 (AB), and 2 (BB), and those not identified as 5. The exclusion criteria used for quality control of the genotyping data are shown in Table 2.
Exclusion criterion N
MAF < 0.05 279,991Heterozygosis >0.30 851Call frequency <0.93 7,335Mean cluster intensity >0.30 12,630Elimination of sex chromosomes 23,766Elimination of markers with low A/B frequency 6,403
MAF = minor allele frequency.
Table 2. Number of single nucleotide polymorphisms excluded (N) according to each exclusion criterion.
In order to prevent possible genotyping errors, SNPs with excess heterozygosity or homozygosity were excluded from the analyses. Call frequency and call rate are measures of the genotyping efficiency of each SNP, and consequently of each animal. Genotyped animals with a call rate lower than 0.90 were eliminated. The final dataset contained 446,986 markers for genome-wide association and 740 genotyped males.
In addition to the criteria of consistency described above, animals in contemporary groups (CGs) with at least three animals were maintained. The CGs were defined as year, farm, and management group at birth, in addition to weaning and postweaning management groups. Therefore, a total of 117 CGs were formed in this study.
Association study
Association analyses were performed by the restricted maximum likelihood method and considered one marker at a time. The model included the random effect of sire, fixed effects of CG (117 levels), date of slaughter (15 levels), and age at slaughter, and SNP as a covariate (linear effect). The false-positive rate (FPR) was calculated as follows:
where m is the number of markers tested that passed the quality control, p is the level of significance, and n is the number of significant markers for each trait.
Quantile-quantile plots were used to compare the distribution of observed values with the distribution of expected values under the null hypothesis, i.e., that there was no association between SNPs and the trait studied (McCarthy et al., 2008). For this purpose, Manhattan and quantile-quantile plots were constructed using the mht.control and mhtplot functions available in the GAP instructions of the R software (R Development Core Team, 2013). Levels of significance of 5, 1, and 0.1% were set for the markers. A Bonferroni correction at a 5% level of significance was also applied.

11137Genetic markers for meat quality traits in Nellore cattle
©FUNPEC-RP www.funpecrp.com.brGenetics and Molecular Research 14 (3): 11133-11144 (2015)
The National Center for Biotechnology Information’s Map Viewer 6.1 (http://www.ncbi.nlm.nih.gov/mapview/) of the bovine genome was used to identify genes located in close proximity to statistically significant SNPs for each trait.
RESULTS AND DISCUSSION
The extent of linkage disequilibrium in the animals used in this study has been reported in a recent study by Espigolan et al. (2013) using the same dataset. The authors found an average linkage disequilibrium (determined by r²) of 0.17 between SNP pairs.
After applying a Bonferroni correction to the three traits studied (P < 1.12 x 10⁻⁷), there were only 27 significant SNPs for HCW (Figure 1). No significant SNPs were detected for the other traits (LEA and BF), probably because the level of restriction of the test was high. According to Kim et al. (2011), this is a conservative test, and SNPs that meet the Bonferroni criterion exert a highly significant effect on the trait.
A total of 7048, 5356, and 4404 SNPs were significantly associated (P < 0.01) with HCW, LEA, and BF, respectively. At the 5% level, these numbers increased to 27,526, 24,874, and 22,515 SNPs, respectively (Figure 1).
Figure 1. Manhattan plot of genome-wide association results for hot carcass weight (a), loin eye area (b), and backfat thickness (c) in Nellore cattle. Values higher than -logP > 3 are equivalent to P < 0.001.
11138R. Espigolan et al.
©FUNPEC-RP www.funpecrp.com.brGenetics and Molecular Research 14 (3): 11133-11144 (2015)
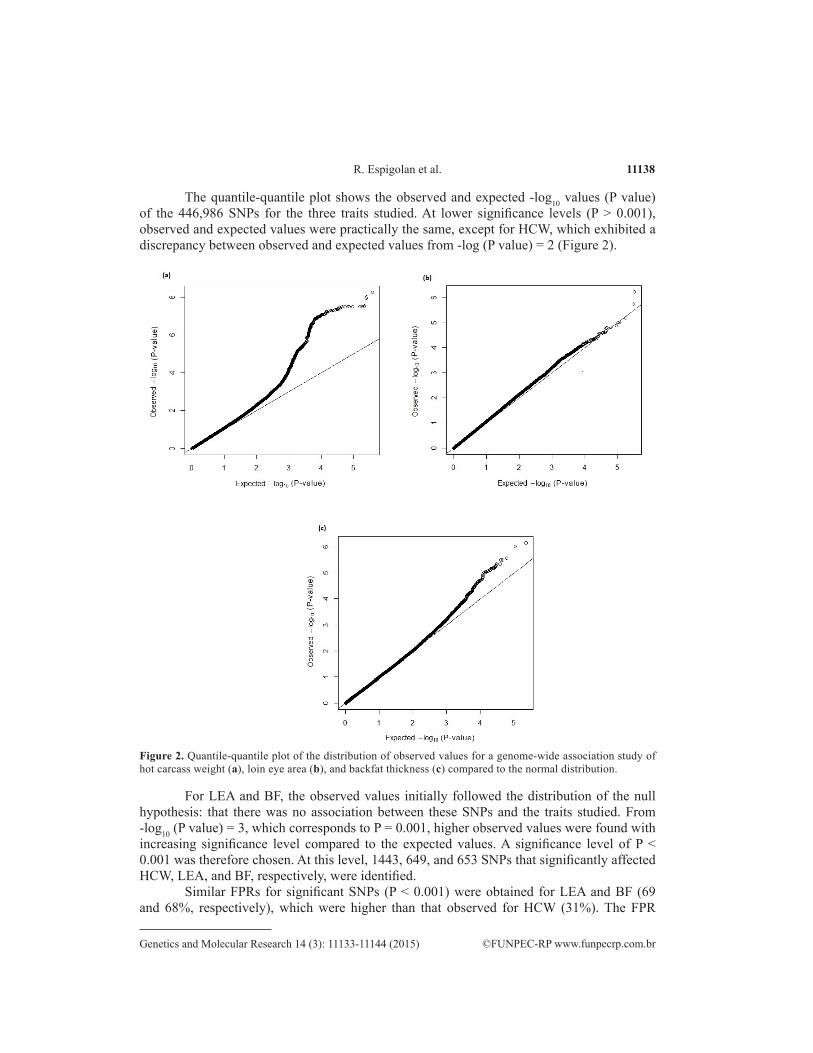
The quantile-quantile plot shows the observed and expected -log10 values (P value) of the 446,986 SNPs for the three traits studied. At lower significance levels (P > 0.001), observed and expected values were practically the same, except for HCW, which exhibited a discrepancy between observed and expected values from -log (P value) = 2 (Figure 2).
Figure 2. Quantile-quantile plot of the distribution of observed values for a genome-wide association study of hot carcass weight (a), loin eye area (b), and backfat thickness (c) compared to the normal distribution.
For LEA and BF, the observed values initially followed the distribution of the null hypothesis: that there was no association between these SNPs and the traits studied. From -log10 (P value) = 3, which corresponds to P = 0.001, higher observed values were found with increasing significance level compared to the expected values. A significance level of P < 0.001 was therefore chosen. At this level, 1443, 649, and 653 SNPs that significantly affected HCW, LEA, and BF, respectively, were identified.
Similar FPRs for significant SNPs (P < 0.001) were obtained for LEA and BF (69 and 68%, respectively), which were higher than that observed for HCW (31%). The FPR
11139Genetic markers for meat quality traits in Nellore cattle
©FUNPEC-RP www.funpecrp.com.brGenetics and Molecular Research 14 (3): 11133-11144 (2015)
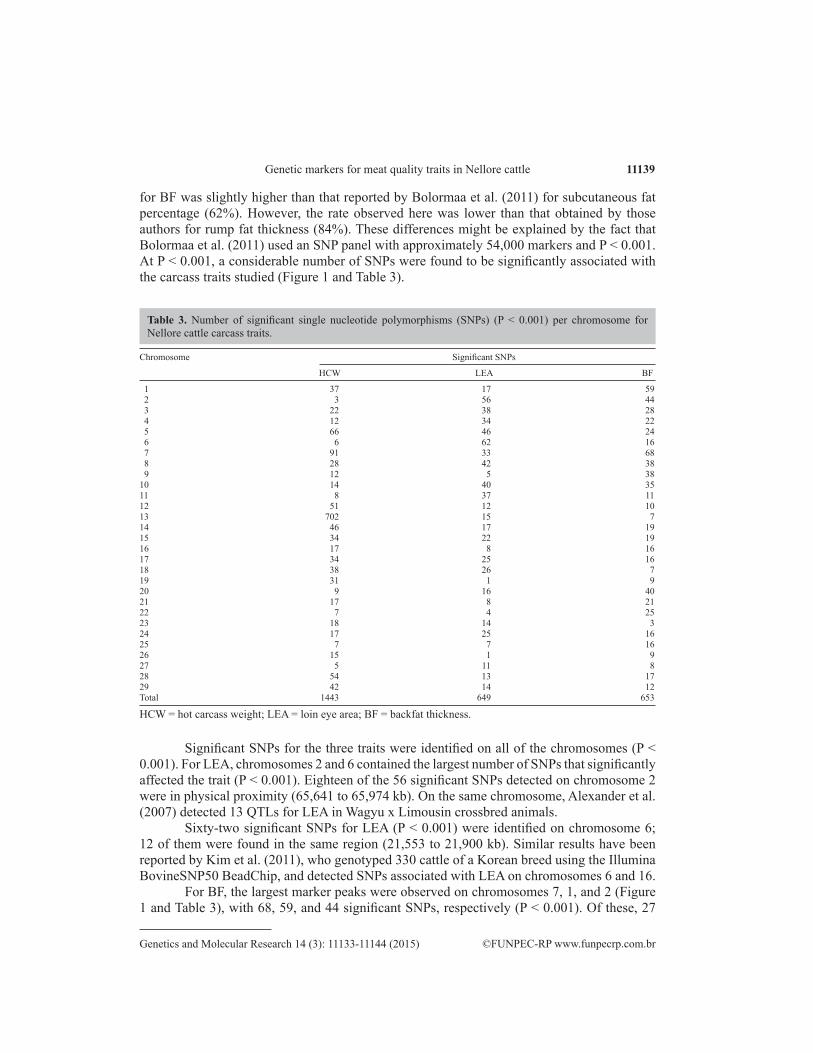
for BF was slightly higher than that reported by Bolormaa et al. (2011) for subcutaneous fat percentage (62%). However, the rate observed here was lower than that obtained by those authors for rump fat thickness (84%). These differences might be explained by the fact that Bolormaa et al. (2011) used an SNP panel with approximately 54,000 markers and P < 0.001. At P < 0.001, a considerable number of SNPs were found to be significantly associated with the carcass traits studied (Figure 1 and Table 3).
Chromosome Significant SNPs
HCW LEA BF
1 37 17 59 2 3 56 44 3 22 38 28 4 12 34 22 5 66 46 24 6 6 62 16 7 91 33 68 8 28 42 38 9 12 5 3810 14 40 3511 8 37 1112 51 12 1013 702 15 714 46 17 1915 34 22 1916 17 8 1617 34 25 1618 38 26 719 31 1 920 9 16 4021 17 8 2122 7 4 2523 18 14 324 17 25 1625 7 7 1626 15 1 927 5 11 828 54 13 1729 42 14 12Total 1443 649 653
HCW = hot carcass weight; LEA = loin eye area; BF = backfat thickness.
Table 3. Number of significant single nucleotide polymorphisms (SNPs) (P < 0.001) per chromosome for Nellore cattle carcass traits.
Significant SNPs for the three traits were identified on all of the chromosomes (P < 0.001). For LEA, chromosomes 2 and 6 contained the largest number of SNPs that significantly affected the trait (P < 0.001). Eighteen of the 56 significant SNPs detected on chromosome 2 were in physical proximity (65,641 to 65,974 kb). On the same chromosome, Alexander et al. (2007) detected 13 QTLs for LEA in Wagyu x Limousin crossbred animals.
Sixty-two significant SNPs for LEA (P < 0.001) were identified on chromosome 6; 12 of them were found in the same region (21,553 to 21,900 kb). Similar results have been reported by Kim et al. (2011), who genotyped 330 cattle of a Korean breed using the Illumina BovineSNP50 BeadChip, and detected SNPs associated with LEA on chromosomes 6 and 16.
For BF, the largest marker peaks were observed on chromosomes 7, 1, and 2 (Figure 1 and Table 3), with 68, 59, and 44 significant SNPs, respectively (P < 0.001). Of these, 27
11140R. Espigolan et al.
©FUNPEC-RP www.funpecrp.com.brGenetics and Molecular Research 14 (3): 11133-11144 (2015)
(79,040 to 79,807 kb), 10 (134,531 to 134,613 kb), and 9 (4123 to 4144 kb) markers, in the same order, were in physical proximity. Although chromosome 7 exhibited a larger number of significant SNPs (P < 0.001), chromosomes 1 and 2 contained regions of less dispersed significant SNPs (P < 0.001) (Figure 1 and Table 3). Using the BovineHD BeadChip to genotype 400 Canchim animals, Mokry et al. (2013) also identified significant SNPs for BF on chromosome 1, in addition to chromosomes 3, 10, 13, and 19. QTLs for BF have been identified on chromosomes 2, 3, 7, and 14 of crossbred cattle (Brahman x Hereford) (Casas et al., 2003). Chromosome 13 contained the largest number of significant SNPs (702) for HCW (P < 0.001), followed by chromosome 7 (91 SNPs) (Table 3). A clearly visible marker peak for this trait was observed on chromosome 13 (Figure 1). This result suggests the presence of a QTL, since 27 SNPs located on this chromosome passed the Bonferroni correction (P < 1.12 x 10⁻⁷), and 24 of them were in physical proximity to each other (62,528 to 62,813 kb and 67,122 to 67,862 kb). These results agree with those of Kim et al. (2003), who analyzed phenotypic data for various growth traits in 538 crossbred animals (Angus x Brahman). The authors used 417 microsatellite markers in order to detect QTLs, and obtained evidence for the presence of a QTL for HCW on chromosome 13.
Two other SNPs that met the Bonferroni criterion of significance for HCW were located on chromosomes 14 and 28. On chromosome 14, a significant SNP (P < 3.65 x 10⁻⁸) was detected at position 4965.4 kb (BovineHD1400001162). Nishimura et al. (2012), who genotyped 1156 Japanese Black cattle using the Illumina BovineSNP50 BeadChip, also detected four SNPs that were significantly associated with carcass weight (P < 1.28 x 10⁻⁶) in the region of chromosome 14. The other SNP (BovineHD2800000740) that was significantly associated with HCW (P < 8.58 x 10⁻⁸) was found at position 2111.2 kb of chromosome 28. On the same chromosome, McClure et al. (2010) identified two QTLs for HCW in Angus cattle.
Our results differ from those reported by Lee et al. (2012), who genotyped a herd of 266 Korean Hanwoo cattle using the 10K Affymetrix SNP Chip. The authors describe regions containing potential QTLs for carcass weight and LEA on chromosomes 4 and 23, respectively, and detected significant markers for fat thickness on chromosomes 13 and 16.
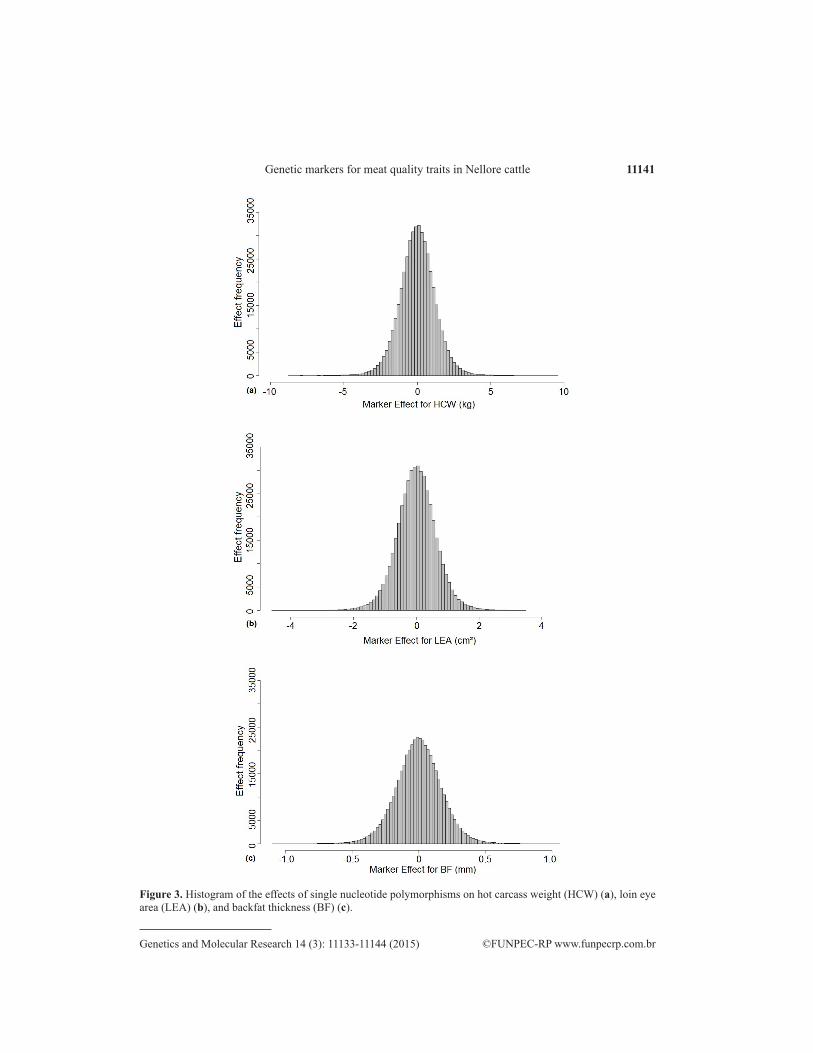
Distributions of the effects of all of the SNPs studied on the three traits are presented in Figure 3. Most of the estimated effects were close to zero, confirming the polygenic nature of the traits.
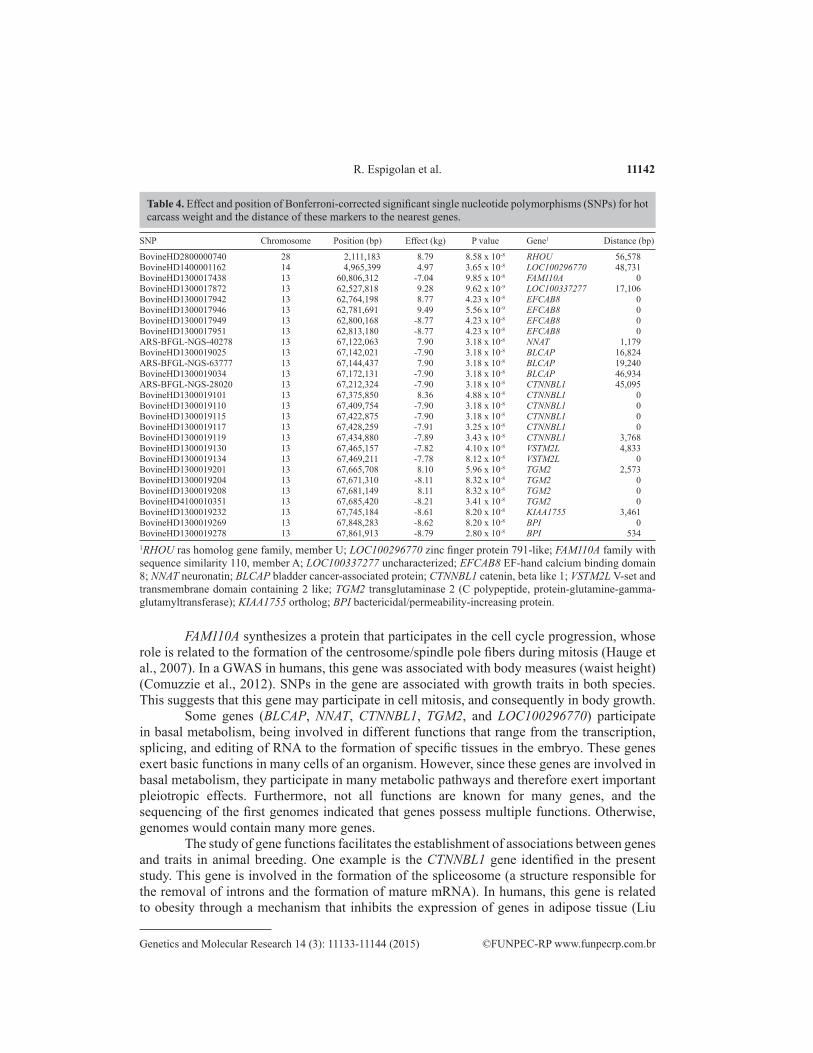
Table 4 shows the results of genome-wide association with HCW in Nellore animals. The distance is reported in base pairs from the SNP to the beginning of the gene, or from the SNP to the end of the gene, according to the position of the polymorphism on the chromosome. A distance of zero indicates that the SNP was located within the gene. The 27 SNPs that met the Bonferroni criterion of significance represent 12 protein-coding genes on three chromosomes (13, 14, and 28).
On the basis of the results obtained, the genes were divided into groups according to their known metabolic function in the organism. Previous studies have revealed genome regions that are directly related to the formation and development of skeletal muscles (EFCAB8 and VSTM2L) (Maki et al., 2002; Rossini et al., 2011) and bone (RHOU) (Brazier et al., 2009), and therefore contribute to HCW. Particularly interesting is the metabolic function of the EFCAB8 gene. The genes of this family act directly on calpain (a muscle-forming protein) and sorcin (involved in the modulation of Ca2+ channels). A certain analogy can be made with the halothane gene of pigs, which encodes a precursor protein of a Ca2+ release channel. A polymorphism in the halothane gene is responsible for a condition called PSE (pale, soft, exudative), a term used to describe poor quality meat.
11141Genetic markers for meat quality traits in Nellore cattle
©FUNPEC-RP www.funpecrp.com.brGenetics and Molecular Research 14 (3): 11133-11144 (2015)
Figure 3. Histogram of the effects of single nucleotide polymorphisms on hot carcass weight (HCW) (a), loin eye area (LEA) (b), and backfat thickness (BF) (c).
11142R. Espigolan et al.
©FUNPEC-RP www.funpecrp.com.brGenetics and Molecular Research 14 (3): 11133-11144 (2015)
FAM110A synthesizes a protein that participates in the cell cycle progression, whose role is related to the formation of the centrosome/spindle pole fibers during mitosis (Hauge et al., 2007). In a GWAS in humans, this gene was associated with body measures (waist height) (Comuzzie et al., 2012). SNPs in the gene are associated with growth traits in both species. This suggests that this gene may participate in cell mitosis, and consequently in body growth.
Some genes (BLCAP, NNAT, CTNNBL1, TGM2, and LOC100296770) participate in basal metabolism, being involved in different functions that range from the transcription, splicing, and editing of RNA to the formation of specific tissues in the embryo. These genes exert basic functions in many cells of an organism. However, since these genes are involved in basal metabolism, they participate in many metabolic pathways and therefore exert important pleiotropic effects. Furthermore, not all functions are known for many genes, and the sequencing of the first genomes indicated that genes possess multiple functions. Otherwise, genomes would contain many more genes.
The study of gene functions facilitates the establishment of associations between genes and traits in animal breeding. One example is the CTNNBL1 gene identified in the present study. This gene is involved in the formation of the spliceosome (a structure responsible for the removal of introns and the formation of mature mRNA). In humans, this gene is related to obesity through a mechanism that inhibits the expression of genes in adipose tissue (Liu
SNP Chromosome Position (bp) Effect (kg) P value Gene1 Distance (bp)
BovineHD2800000740 28 2,111,183 8.79 8.58 x 10⁻⁸ RHOU 56,578BovineHD1400001162 14 4,965,399 4.97 3.65 x 10⁻⁸ LOC100296770 48,731BovineHD1300017438 13 60,806,312 -7.04 9.85 x 10⁻⁸ FAM110A 0BovineHD1300017872 13 62,527,818 9.28 9.62 x 10⁻⁹ LOC100337277 17,106BovineHD1300017942 13 62,764,198 8.77 4.23 x 10⁻⁸ EFCAB8 0BovineHD1300017946 13 62,781,691 9.49 5.56 x 10⁻⁹ EFCAB8 0BovineHD1300017949 13 62,800,168 -8.77 4.23 x 10⁻⁸ EFCAB8 0BovineHD1300017951 13 62,813,180 -8.77 4.23 x 10⁻⁸ EFCAB8 0ARS-BFGL-NGS-40278 13 67,122,063 7.90 3.18 x 10⁻⁸ NNAT 1,179BovineHD1300019025 13 67,142,021 -7.90 3.18 x 10⁻⁸ BLCAP 16,824ARS-BFGL-NGS-63777 13 67,144,437 7.90 3.18 x 10⁻⁸ BLCAP 19,240BovineHD1300019034 13 67,172,131 -7.90 3.18 x 10⁻⁸ BLCAP 46,934ARS-BFGL-NGS-28020 13 67,212,324 -7.90 3.18 x 10⁻⁸ CTNNBL1 45,095BovineHD1300019101 13 67,375,850 8.36 4.88 x 10⁻⁸ CTNNBL1 0BovineHD1300019110 13 67,409,754 -7.90 3.18 x 10⁻⁸ CTNNBL1 0BovineHD1300019115 13 67,422,875 -7.90 3.18 x 10⁻⁸ CTNNBL1 0BovineHD1300019117 13 67,428,259 -7.91 3.25 x 10⁻⁸ CTNNBL1 0BovineHD1300019119 13 67,434,880 -7.89 3.43 x 10⁻⁸ CTNNBL1 3,768BovineHD1300019130 13 67,465,157 -7.82 4.10 x 10⁻⁸ VSTM2L 4,833BovineHD1300019134 13 67,469,211 -7.78 8.12 x 10⁻⁸ VSTM2L 0BovineHD1300019201 13 67,665,708 8.10 5.96 x 10⁻⁸ TGM2 2,573BovineHD1300019204 13 67,671,310 -8.11 8.32 x 10⁻⁸ TGM2 0BovineHD1300019208 13 67,681,149 8.11 8.32 x 10⁻⁸ TGM2 0BovineHD4100010351 13 67,685,420 -8.21 3.41 x 10⁻⁸ TGM2 0BovineHD1300019232 13 67,745,184 -8.61 8.20 x 10⁻⁸ KIAA1755 3,461BovineHD1300019269 13 67,848,283 -8.62 8.20 x 10⁻⁸ BPI 0BovineHD1300019278 13 67,861,913 -8.79 2.80 x 10⁻⁸ BPI 5341RHOU ras homolog gene family, member U; LOC100296770 zinc finger protein 791-like; FAM110A family with sequence similarity 110, member A; LOC100337277 uncharacterized; EFCAB8 EF-hand calcium binding domain 8; NNAT neuronatin; BLCAP bladder cancer-associated protein; CTNNBL1 catenin, beta like 1; VSTM2L V-set and transmembrane domain containing 2 like; TGM2 transglutaminase 2 (C polypeptide, protein-glutamine-gamma-glutamyltransferase); KIAA1755 ortholog; BPI bactericidal/permeability-increasing protein.
Table 4. Effect and position of Bonferroni-corrected significant single nucleotide polymorphisms (SNPs) for hot carcass weight and the distance of these markers to the nearest genes.
11143Genetic markers for meat quality traits in Nellore cattle
©FUNPEC-RP www.funpecrp.com.brGenetics and Molecular Research 14 (3): 11133-11144 (2015)
et al., 2008). The function of this gene, which exerts a basal effect on metabolism and acts in different tissues, acquires importance in adipose tissue, where it promotes fat accumulation and is directly related to HCW in cattle.
The BPI gene identified here is involved in the immune system. This gene is considered to be related to good or poor immune defense of the organism against infectious agents. Animals with a stronger immune system spend less energy in combating external agents, and can use this energy for growth and reproduction. Two of the genes identified were not discussed because they have not yet been characterized (LOC100337277), or their biological function is unknown (KIAA1755).
Recently, Utsunomiya et al. (2013) identified significant SNPs for birthweight on chromosome 14 of Nellore cattle, in regions distant from the SNP found in the present study. This fact is important, since it shows that genes affecting birthweight are not the same as those that affect carcass weight in this breed. It would therefore be possible to use different SNPs to increase carcass weight without increasing birthweight. Nishimura et al. (2012) identified significant SNPs for HCW on chromosomes 6, 8, and 14 of Japanese Black cattle. The SNPs found on chromosome 14 were distant from the SNP identified in the present study. Similarly, Lee et al. (2012) detected significant SNPs for HCW on chromosome 4 of Hanwoo cattle, but the regions were distant from those observed in the present study. This finding suggests that the regions that most affect this trait differ between breeds and/or subspecies.
The present genome-wide association study revealed the presence of various significant SNPs that affect carcass traits in Nellore cattle. For HCW, associations were identified on chromosomes 13, 14, and 28, in addition to genome regions that are directly related to this trait, such as EFCAB8 and VSTM2L, and to bone development (RHOU). Some SNPs were located in close proximity to genes involved in basal metabolism (BLCAP, NNAT, CTNNBL1, TGM2, and LOC100296770) and the immune system (BPI). In-depth studies on HCW should focus on chromosome 13, which contained 27 SNPs that passed the Bonferroni correction. For LEA and BF, the largest numbers of significant SNPs were identified on chromosomes 2 and 6, and 7, 1, and 2, respectively.
ACKNOWLEDGMENTS
Research supported by grants #2009/16118-5 and #2010/14580-0 from the Fundação de Amparo à Pesquisa do Estado de São Paulo (FAPESP) and #480369/2009-7 from the Conselho Nacional de Desenvolvimento Científico e Tecnológico (CNPq). We are indebted to DeltaGen, Paint CRV Lagoa, and Nelore Qualitas for providing the livestock data.
REFERENCES
Albuquerque LG, Mercadante MEZ and Pereira EJ (2006). Recent studies on the genetic basis for selection of Bos indicus for beef production. Proceedings of the 8th World Congress on Genetics Applied to Livestock Production, Belo Horizonte.
Alexander LJ, Geary TW, Snelling WM and MacNeil MD (2007). Quantitative trait loci with additive effects on growth and carcass traits in a Wagyu-Limousin F2 population. Anim. Genet. 38: 413-416.
Anualpec (Anuário da Pecuária Brasileira) (2014). Instituto FNP, São Paulo, 81-82.Bolormaa S, Neto LR, Zhang YD, Bunch RJ, et al. (2011). A genome-wide association study of meat and carcass traits in
Australian cattle. J. Anim. Sci. 89: 2297-2309.Brazier H, Pawlak G, Vives V and Blangy A (2009). The Rho GTPase Wrch 1 regulates osteoclast precursor adhesion and
migration. Int. J. Biochem. Cell Biol. 41: 1391-1401.
11144R. Espigolan et al.
©FUNPEC-RP www.funpecrp.com.brGenetics and Molecular Research 14 (3): 11133-11144 (2015)
Casas E, Shackelford SD, Keele JW, Koohmaraie M, et al. (2003). Detection of quantitative trait loci for growth and carcass composition in cattle. J. Anim. Sci. 81: 2976-2983.
Comuzzie AG, Cole SA, Laston SL, Voruganti VS, et al. (2012). Novel genetic loci identified for the pathophysiology of childhood obesity in the Hispanic population. PLoS One 7: e51954.
Cundiff LV (2004). Breeds and genetics. Encyclopedia of Animal Science, Cornell.Cundiff LV, Koch RM, Gregory KE, Crouse JD, et al. (1993). Characteristics of diverse breeds in cycle IV of the cattle
germplasm evaluation. Beef. Res. Prog. Rep. 71: 57-60.Espigolan R, Baldi F, Boligon AA, Souza FRP, et al. (2013). Study of whole genome linkage disequilibrium in Nellore
cattle. BMC Genomics 14: 305.Hauge H, Patzke S and Aasheim HC (2007). Characterization of the FAM110 gene family. Genomics 90: 14-27.Kim JJ, Farnir F, Savell J and Taylor JF (2003). Detection of quantitative trait loci for growth and beef carcass fatness traits
in a cross between Bos taurus (Angus) and Bos indicus (Brahman) cattle. J. Anim. Sci. 81: 1933-1942.Kim Y, Ryu J, Woo J, Kim JB, et al. (2011). Genome-wide association study reveals five nucleotide sequence variants for
carcass traits in beef cattle. Anim. Genet. 42: 361-365.Lee SH, Van der Werf J, Lee SH, Lim DJ, et al. (2012). Genome wide QTL mapping to identify candidate genes for
carcass traits in Hanwoo (Korean Cattle). Genes Genomics 34: 43-49.Liu YJ, Liu XG, Wang L, Dina C, et al. (2008). Genome-wide association scans identified CTNNBL1 as a novel gene for
obesity. Hum. Mol. Genet. 17: 1803-1813.Maki M, Kitaura Y, Satoh H, Susumu O, et al. (2002). Structures, functions and molecular evolution of the penta-EF-hand
Ca2+-binding proteins. Biochim. Biophys. Acta 1600: 51-60.McCarthy MI, Abecasis GR, Cardon LR, Goldstein DB, et al. (2008). Genome-wide association studies for complex traits:
consensus, uncertainty and challenges. Nat. Rev. 9: 356-369.McClure MC, Morsci NS, Schnabel RD, Kim JW, et al. (2010). A genome scan for quantitative trait loci influencing
carcass, post-natal growth and reproductive traits in commercial Angus cattle. Anim. Genet. 41: 597-607.Mokry FB, Higa RH, Mudadu MA, Lima AO, et al. (2013). Genome-wide association study for backfat thickness in
Canchim beef cattle using Random Forest approach. BMC Genet. 14: 47.Nishimura S, Watanabe T, Mizoshita K, Tatsuda K, et al. (2012). Genome-wide association study identified three major
QTL for carcass weight including the PLAG1-CHCHD7 QTN for stature in Japanese Black cattle. BMC Genet. 13: 40.Perkins TL (1992). The use of real-time, linear-array ultrasound techniques to predict final carcass composition in beef
cattle. Doctoral thesis, Texas Tech University, Lubbock.R Development Core Team (2013). R: A language and environment for statistical computing. Vienna, Austria. Available
at [http://www.R-project.org]. Accessed October 12, 2014.Restle J, Pascoal LL, Faturi C, Filho DCA, et al. (2002). Efeito do Grupo Genético e da Heterose nas Características
Quantitativas da Carcaça de Vacas de Descarte Terminadas em Confinamento. Rev. Bras. Zootec. 31: 350-362.Rossini L, Hashimoto Y, Suzuki H, Kurita M, et al. (2011). VSTM2L is a novel secreted antagonist of the neuroprotective
peptide Humanin. FASEB J. 25: 1983-2000.Utsunomiya YT, Carmo AS, Carvalheiro R, Neves HHR, et al. (2013). Genome-wide association study for birth weight
in Nellore cattle points to previously described orthologous genes affecting human and bovine height. BMC Genet. 14: 52.
Zhang H, Wang Z, Wang S and Li H (2012). Progress of genome wide association study in domestic animals. J. Anim. Sci. Biotechnol. 3: 26-27.