asset/liability management - year 2 · 2 asset/liability management: proce ss, positioning, &...
TRANSCRIPT

ASSET/LIABILITY MANAGEMENT - YEAR 2
“ALM Process, Positioning & Profitability”
Darren Herrmann Executive Vice President & Treasurer
UMB Financial Corporation & UMB Bank Corporate Treasury
Kansas City, MO [email protected]
816-860-7195
July 30, 2018

1
Asset/Liability Management: Process, Positioning, & Profitability
Graduate School of Banking, Madison, Wisconsin 1
Asset/Liability Management:Process, Positioning, & Profitability
Darren D. Herrmann
Executive Vice President & Treasurer
UMB Financial Corporation
Graduate School of Banking
Madison, Wisconsin
July 30, 2018
Asset/Liability Management: Process, Positioning, & Profitability
Graduate School of Banking, Madison, Wisconsin 2
Year 2 OverviewDarren Herrmann—Day 1
• Asset/Liability Management (ALM): Positioning, Profitability & Process
Andy Trovillion—Day 2
• Interest Rate Risk Measurement and Management
John McQueen—Day 3
• Developing an Effective Liquidity Strategy
Dave Koch—Day 4
• Putting it all together: Implementation of a Risk-Return Framework

2
Asset/Liability Management: Process, Positioning, & Profitability
Graduate School of Banking, Madison, Wisconsin 3
DisclosuresThe information and opinions expressed in this message are solely those of the author and do not necessarily state or reflect the opinion of UMB Bank, n.a. or UMB Financial Corporation. This communication is provided for informational purposes only. UMB Bank, n.a. and UMB Financial Corporation are not liable for any errors, omissions, or misstatements.
Asset/Liability Management: Process, Positioning, & Profitability
Graduate School of Banking, Madison, Wisconsin 4
Overview• ALM Overview
• ALM and Positioning in the Current Environment
• ALM & Profitability• Drivers of Net Interest Income (NII)
• A Case Study
• Marginal Cost of Funding
• Simple Derivatives to Manage the ALM Profile
• Intersession Project Part 1
• The ALM Process• Structure, responsibilities
• Seven Steps to an Improved ALCO
• Intersession Project Part 2

3
Asset/Liability Management: Process, Positioning, & Profitability
Graduate School of Banking, Madison, Wisconsin 5
ALM Overview
Asset/Liability Management: Process, Positioning, & Profitability
Graduate School of Banking, Madison, Wisconsin 6
ALM
Definition
• The term “asset/liability management” refers to the processes of acquiring and deploying funds to maximize net interest income, and thereby profitability and the value of the bank, while managing related financial risks and constraints.

4
Asset/Liability Management: Process, Positioning, & Profitability
Graduate School of Banking, Madison, Wisconsin 7
ALM
Net Interest Margin
Interest Rate Risk
Liquidity Risk
ROE
LeverageROA
Asset/Liability Management: Process, Positioning, & Profitability
Graduate School of Banking, Madison, Wisconsin 8
ALM’s Primary Areas of Responsibility• Net Interest Income & Net Interest Margin
• Balance Sheet & Off Balance Sheet Structure• ALM Mix
• Loan and Deposit Pricing
• Investment Portfolio Management
• Wholesale Funding
• Capital/Leverage
• Derivatives
• Risk Measurement and Management/Constraints• Interest Rate Risk
• Liquidity Risk
• Capital

5
Asset/Liability Management: Process, Positioning, & Profitability
Graduate School of Banking, Madison, Wisconsin 9
ALM Levers
• Balance Sheet Composition/Mix Optimization
• Pricing
• Capital/Leverage
• Interest Rate Risk
• Liquidity Risk
• Derivatives
Asset/Liability Management: Process, Positioning, & Profitability
Graduate School of Banking, Madison, Wisconsin 10
ALM and the Current Environment

6
Asset/Liability Management: Process, Positioning, & Profitability
Graduate School of Banking, Madison, Wisconsin 11
Questions for the Current ALM Environment• Should I keep making fixed-rate loans?
• Should I add funding with tenor now?
• Will my deposit mix shift back toward my pre-crisis position?
• Am I modeling deposit sensitivity appropriately?
• Should I lever or delever my balance sheet?
• What could happen to my liquidity as rates increase and the Fed shrinks its balance sheet?
• How has technology changed the competitive landscape in terms of raising deposits, rate sensitivity, switching costs (remote deposit capture, mobile banking, Kasasa)?
• Do I know who my large funds providers are and how they might behave?
• Do I know the trend in uninsured deposits at my institution?
Asset/Liability Management: Process, Positioning, & Profitability
Graduate School of Banking, Madison, Wisconsin 12
• What is the marginal cost of new deposits raised?
• The Fed has increased 175 basis points since December 2015, has the expected impact materialized in your bank’s NIM?
• Do I have exposure to a flattening yield curve and if so which kind?
• Am I using derivatives to enable loan growth and/or provides protection during a flat curve period?
• What is my bond portfolio’s exposure to rising rates and what are the market value and liquidity implications?
• What will be the impact of no more Reg. D?
• Do I have a Liquidity Coverage Ratio (LCR) bank in any of my markets and how could that impact deposit rates?
Questions for the Current ALM Environment

7
Asset/Liability Management: Process, Positioning, & Profitability
Graduate School of Banking, Madison, Wisconsin 13
Is This Time Different?
Asset/Liability Management: Process, Positioning, & Profitability
Graduate School of Banking, Madison, Wisconsin 14
Yield Curve Is Flat by Historical Norms
1.16
1.31
1.74
1.41
0.69
0.36
Last 30 years Last 20 years Last 10 years Last 5 years Last year Current
10‐2 Slope Over Time

8
Asset/Liability Management: Process, Positioning, & Profitability
Graduate School of Banking, Madison, Wisconsin 15
Interest Rates: Past, Present, Future?
‐
1.00
2.00
3.00
4.00
5.00
6.00
3 MO 6 MO 1 YR 2 YR 3 YR 5 YR 7 YR 10 YR 30 YR
Percen
t
2007 2013 2018 1 Year Forward Rates
Asset/Liability Management: Process, Positioning, & Profitability
Graduate School of Banking, Madison, Wisconsin 16
Cost of Funds vs. Market Rates Will Be Key to Interest Rate Risk Sensitivity—Historically 55% of Market Rates
‐
1.00
2.00
3.00
4.00
5.00
6.00
2005Q1
2005Q2
2005Q3
2005Q4
2006Q1
2006Q2
2006Q3
2006Q4
2007Q1
2007Q2
2007Q3
2007Q4
2008Q1
2008Q2
2008Q3
2008Q4
2009Q1
2009Q2
2009Q3
2009Q4
2010Q1
2010Q2
2010Q3
2010Q4
2011Q1
2011Q2
2011Q3
2011Q4
2012Q1
2012Q2
2012Q3
2012Q4
2013Q1
2013Q2
2013Q3
2013Q4
2014Q1
2014Q2
2014Q3
2014Q4
2015Q1
2015Q2
2015Q3
2015Q4
2016Q1
2016Q2
2016Q3
2016Q4
2017Q1
2017Q2
2017Q3
2017Q4
2018Q1
Percen
t
Cost of Funds with DDA Comparison
UMB Financial Corporation 1 Month Libor
Credit Crisis

9
Asset/Liability Management: Process, Positioning, & Profitability
Graduate School of Banking, Madison, Wisconsin 17
30%36% 41%
35%
19%18%
22% 35%20%
23%
22%18%
9%
8%
6%6%22%
15%9% 6%
2008 2011 2014 2018
Funding Mix More Indeterminate, Less Term
DDA NOW MMDA Savings CDs
Asset/Liability Management: Process, Positioning, & Profitability
Graduate School of Banking, Madison, Wisconsin 18
ALM & Profitability
10
Asset/Liability Management: Process, Positioning, & Profitability
Graduate School of Banking, Madison, Wisconsin 19
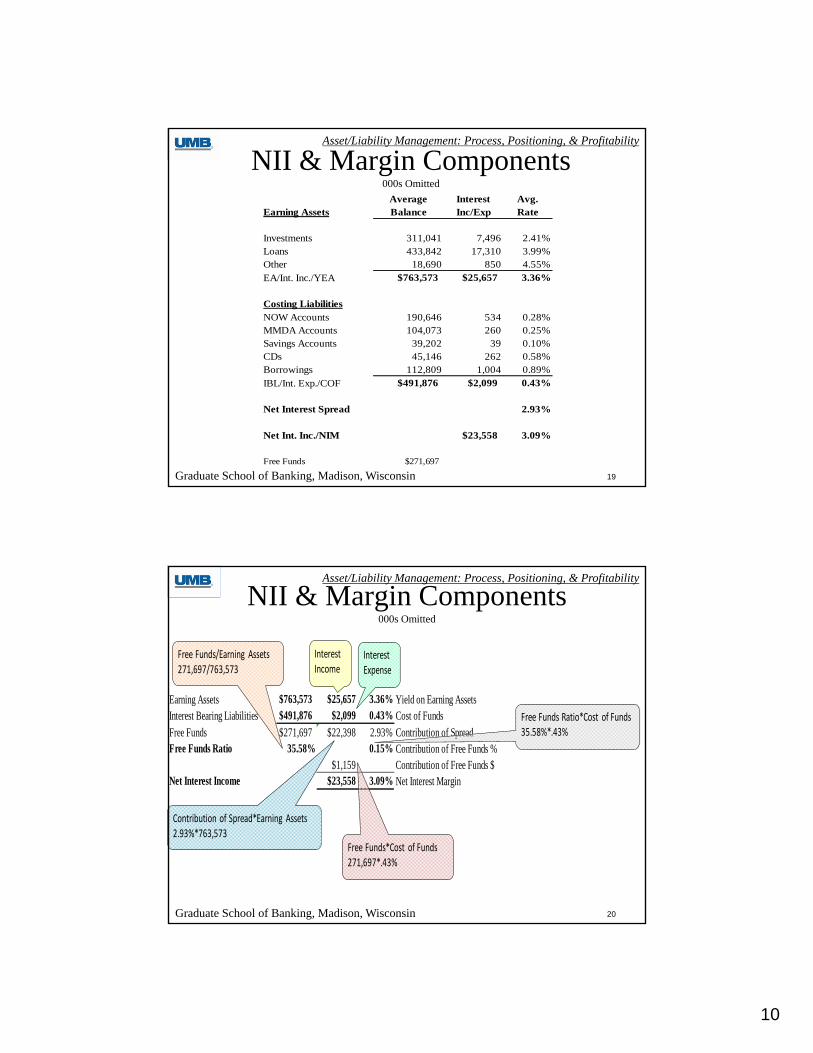
NII & Margin Components000s Omitted
Average Interest Avg.Earning Assets Balance Inc/Exp Rate
Investments 311,041 7,496 2.41%Loans 433,842 17,310 3.99%Other 18,690 850 4.55%EA/Int. Inc./YEA $763,573 $25,657 3.36% Costing LiabilitiesNOW Accounts 190,646 534 0.28%MMDA Accounts 104,073 260 0.25%Savings Accounts 39,202 39 0.10%CDs 45,146 262 0.58%Borrowings 112,809 1,004 0.89%IBL/Int. Exp./COF $491,876 $2,099 0.43%
Net Interest Spread 2.93%
Net Int. Inc./NIM $23,558 3.09%
Free Funds $271,697
Asset/Liability Management: Process, Positioning, & Profitability
Graduate School of Banking, Madison, Wisconsin 20
NII & Margin Components000s Omitted
Earning Assets $763,573 $25,657 3.36% Yield on Earning AssetsInterest Bearing Liabilities $491,876 $2,099 0.43% Cost of FundsFree Funds $271,697 $22,398 2.93% Contribution of SpreadFree Funds Ratio 35.58% 0.15% Contribution of Free Funds %
$1,159 Contribution of Free Funds $Net Interest Income $23,558 3.09% Net Interest Margin
InterestIncome
InterestExpense
Free Funds/Earning Assets271,697/763,573
Contribution of Spread*Earning Assets2.93%*763,573
Free Funds*Cost of Funds271,697*.43%
Free Funds Ratio*Cost of Funds35.58%*.43%
11
Asset/Liability Management: Process, Positioning, & Profitability
Graduate School of Banking, Madison, Wisconsin 21
Drivers of Net Interest Income
Asset/Liability Management: Process, Positioning, & Profitability
Graduate School of Banking, Madison, Wisconsin 22
Drivers of NII
• Rate (Pricing, credit risk interest rate risk, liquidity risk)
• Volume of assets and liabilities
• Mix of assets and liabilities

12
Asset/Liability Management: Process, Positioning, & Profitability
Graduate School of Banking, Madison, Wisconsin 23
Net Interest Income Variance Equations
Avg. Avg. Avg. Avg.Balance Rate Balance Rate309,937 2.07% Investments 311,041 2.41%719,755 Earning Assets 763,573
Investments Rate M2 * L2 * R2 - M2 * L2 * R1
Variance 311,041 / 763,573 763,573 2.41% - 311,041 / 763,573 763,573 2.07% = 1,058
Investments Volume M2 * L2 * R1 - M2 * L1 * R1
Variance 311,041 / 763,573 763,573 2.07% - 311,041 / 763,573 719,755 2.07% = 369
Investments Mix M2 * L1 * R1 - M1 * L1 * R1
Variance 311,041 / 763,573 719,755 2.07% - 309,937 / 719,755 719,755 2.07% = -347
Total Investments Variance 1,080
Net Interest Income Variance Analysis Calculation ExampleDollars 000s Omitted
Period 1 Period 2
Rate Variance = M(2)*L(2)*R(2) - M(2)*L(2)*R(1) Volume Variance = M(2)*L(2)*R(1) - M(2)*L(1)*R(1) Mix Variance = M(2)*L(1)*R(1)* - M(1)*L(1)*R(1)
Asset/Liability Management: Process, Positioning, & Profitability
Graduate School of Banking, Madison, Wisconsin 24
Net Interest Income Variance Analysis
Period 1 Period 2 Rate + Volume + Mix = TotalAmount Rate Amount Rate Variance Variance Variance Variance
Earning Assets309,937 2.07% 311,041 2.41% Investments 1,058 369 -347 1,080
391,643 3.68% 433,842 3.99% Loans 1,345 916 637 2,898
18,176 4.60% 18,690 4.55% Other -9 49 -26 14
$719,755 3.01% $763,573 3.36%
$21,664 $25,657 Interest Income $2,393 $1,335 $264 $3,993
Costing Liabilities167,524 0.15% 190,646 0.28% NOW Accounts 248 16 18 283123,014 0.11% 104,073 0.25% MMDA Accounts 146 7 -27 125
34,318 0.09% 39,202 0.10% Savings Accounts 4 2 2 842,064 0.51% 45,146 0.58% CDs 32 13 3 4790,593 0.45% 112,809 0.89% Borrowings 496 29 71 596
$457,513 0.23% $491,876 0.43%
$1,040 $2,099 Interest Expense $925 $67 $67 $1,059
$20,625 2.87% $23,558 3.09% Variance $1,468 $1,268 $198 $2,933
Sample BankNet Interest Income Variance Analysis
(000s Omitted)

13
Asset/Liability Management: Process, Positioning, & Profitability
Graduate School of Banking, Madison, Wisconsin 25
Case Study
Asset/Liability Management: Process, Positioning, & Profitability
Graduate School of Banking, Madison, Wisconsin 26
Year-to-Date -- Jun 2009 Year-to-Date -- Jun 2008AVG AVG VARIANCE ANALYSISRATE RATE
AVERAGE INTEREST EARNED/ AVERAGE INTEREST EARNED/ RATE BASIS VOLUME MIX TOTALASSETS: BALANCE INC/EXP PAID BALANCE INC/EXP PAID VARIANCE VARIANCE VARIANCE VARIANCE VARIANCE Net Loans 436,723 10,013 4.58% 405,634 11,702 5.74% (2,704) (70) 2,240 (1,154) (1,688) Total Investment Securities 446,703 7,048 3.51% 313,818 6,601 4.64% (2,278) (5) 1,634 1,095 447 Other Earning Assets 43,277 97 .57% 44,635 609 2.86% (489) (3) 103 (123) (512) Total Earning Assets 932,151 17,159 3.87% 768,882 18,912 5.12% (5,471) (78) 3,977 (182) (1,754) Int Inc
LIABILITIES: - - - - - - - - - Total Demand Deposits 235,101 - 189,917 - - - - - - Total Transaction Accounts 368,692 929 .51% 284,896 1,825 1.29% (1,317) (12) 396 38 (896) Total Time Deposits 148,622 1,714 2.33% 147,947 3,055 4.15% (1,336) (17) 537 (525) (1,341) Total Interest Bearing Deposits 517,314 2,643 1.03% 432,843 4,879 2.27% (2,652) (29) 933 (487) (2,236) Total Borrowings 150,951 197 .26% 137,335 1,627 2.38% (1,595) (10) 316 (141) (1,430) Total Interest Bearing Liabilities 668,265 2,841 .86% 570,178 6,507 2.29% (4,247) (39) 1,248 (628) (3,666) Int Exp
Interest Income & Rate Earned 17,159 3.87% 18,912 5.12% - - - - - Interest Expense & Rate Paid 2,841 .86% 6,507 2.29% - - - - - Net Interest Income & Rate Spread 14,318 3.01% 12,406 2.83% (1,224) (39) 2,729 446 1,912 NII
Net Interest Margin 3.25% 3.41%
Net Interest Income Variance Analysis

14
Asset/Liability Management: Process, Positioning, & Profitability
Graduate School of Banking, Madison, Wisconsin 27
Drivers of NII Observations• Fairly large negative rate variance during period of
declining rates becoming a drag on net interest income growth
• What does that indicate?• The bank has seen its spread widen but its net interest
margin decline• What explains this?• What does this indicate about this bank’s interest rate risk
exposure?• The bank’s volume variance offset the negative rate
variance due to significant asset growth, what happens if this growth slows and rates stay low?
• What levers remain for this bank to pull?
Asset/Liability Management: Process, Positioning, & Profitability
Graduate School of Banking, Madison, Wisconsin 28
Net Interest Income Variance Analysis$ In Thousands
Year-to-Date -- 2013 Year-to-Date -- 2012AVG AVG VARIANCE ANALYSIS
RATE RATEAVERAGE INTEREST EARNED/ AVERAGE INTEREST EARNED/ RATE VOLUME MIX TOTAL
ASSETS: BALANCE INC/EXP PAID BALANCE INC/EXP PAID VARIANCE VARIANCE VARIANCE VARIANCE
Net Loans 585,582 9,267 3.78% 502,719 9,023 4.26% (988) 1,078 154 244 Investment Securities 679,385 4,544 1.90% 611,730 4,839 2.22% (833) 591 (54) (295)Other Earning Assets #1 21,721 248 3.55% 16,896 211 3.77% (26) 30 32 36 Other Earning Assets #2 81,706 98 .29% 85,313 115 .32% 7 10 (34) (17) Total Earning Assets 1,376,012 14,156 2.64% 1,224,685 14,187 2.95% (1,839) 1,709 99 (31)LIABILITIES: - - - - - Total Demand Deposits 465,905 403,855 - - - - Total Rate Bearing Transaction Accts. 588,867 247 .10% 497,235 293 .14% (98) 38 14 (46)Total Time Deposits 112,048 357 .77% 133,181 505 .91% (68) 47 (127) (148)Total Int Bearing Deposits 700,915 603 .21% 630,417 798 .30% (167) 85 (113) (195)Total Borrowings 170,871 100 .14% 153,066 105 .17% (5) 12 (12) (5)Total Interest Bearing Liabilities 871,787 704 .20% 783,483 903 .28% (171) 96 (125) (200)
Interest Income & Rate Earned 14,156 2.64% 14,187 2.95%Interest Expense & Rate Paid 704 .20% 903 .28%Net Interest Income & Rate Spread 13,452 2.44% 13,284 2.67% (1,668) 1,613 223 168 Net Interest Margin 2.52% 2.77%

15
Asset/Liability Management: Process, Positioning, & Profitability
Graduate School of Banking, Madison, Wisconsin 29
Drivers of NII Observations• Bank continues to offset negative rate variance with
positive volume variance and positive mix variance• What constraints could this bank face in trying to continue
this strategy?• The bank is sacrificing net interest margin for net interest
income, what financial goals must be a priority (ROA vs. ROE vs. EPS)?
• As you survey the regulatory and competitive landscape what if anything concerns you about the bank’s funding base?
• What levers remain for this bank to pull?
Asset/Liability Management: Process, Positioning, & Profitability
Graduate School of Banking, Madison, Wisconsin 30
$ In ThousandsYear-to-Date -- 2018 Year-to-Date -- 2017
AVG AVG VARIANCE ANALYSISRATE RATE
AVERAGE INTEREST EARNED/ AVERAGE INTEREST EARNED/ RATE VOLUME MIX TOTALASSETS: BALANCE INC/EXP PAID BALANCE INC/EXP PAID VARIANCE VARIANCE VARIANCE VARIANCE
Net Loans 1,123,626 21,630 4.61% 1,057,795 18,186 4.12% 1,985 432 1,026 3,444 Investment Securities 614,401 5,036 2.29% 642,474 4,796 2.12% 404 105 (269) 241 Other Earning Assets #1 135,721 1,490 3.91% 131,855 1,353 3.64% 90 32 15 137 Other Earning Assets #2 51,162 396 1.87% 49,672 238 1.16% 179 5 (25) 158 Total Earning Assets 1,924,910 28,553 3.75% 1,881,795 24,573 3.33% 2,659 574 747 3,980 LIABILITIES:Total Demand Deposits 592,719 592,498 Total Rate Bearing Transaction Accts. 973,433 2,222 .55% 848,939 823 .23% 1,266 22 112 1,400 Total Time Deposits 103,973 320 .74% 115,075 272 .57% 75 6 (32) 49 Total Int Bearing Deposits 1,077,406 2,542 .57% 964,014 1,094 .27% 1,341 27 80 1,448 Total Borrowings 167,846 1,080 1.55% 252,902 865 .83% 491 13 (290) 215 Total Interest Bearing Liabilities 1,245,252 3,622 .70% 1,216,916 1,959 .39% 1,832 41 (210) 1,663
Interest Income & Rate Earned 28,553 3.75% 24,573 3.33%Interest Expense & Rate Paid 3,622 .70% 1,959 .39%Net Interest Income & Rate Spread 24,931 3.05% 22,614 2.94% 827 533 957 2,317 Net Interest Margin 3.30% 3.08%
Net Interest Income Variance Analysis

16
Asset/Liability Management: Process, Positioning, & Profitability
Graduate School of Banking, Madison, Wisconsin 31
Drivers of NII Conclusions• Determine what has been driving net interest income• Has rate variance been positive or negative as rates have
increased—how fits with interest rate risk results?• Assess what levers exist to alter this• Assess likelihood of offsetting if negative rate variance through
growth or mix changes• If already highly loaned, assess likelihood of improving mix
variance on the liability side of the balance sheet• Assess the impact of any changes on the institution’s risk profile• Model forward results and load into simple comparison• Consider the potential impact of sustained high or low rate
environments
Asset/Liability Management: Process, Positioning, & Profitability
Graduate School of Banking, Madison, Wisconsin 32
Marginal Cost Funding
17
Asset/Liability Management: Process, Positioning, & Profitability
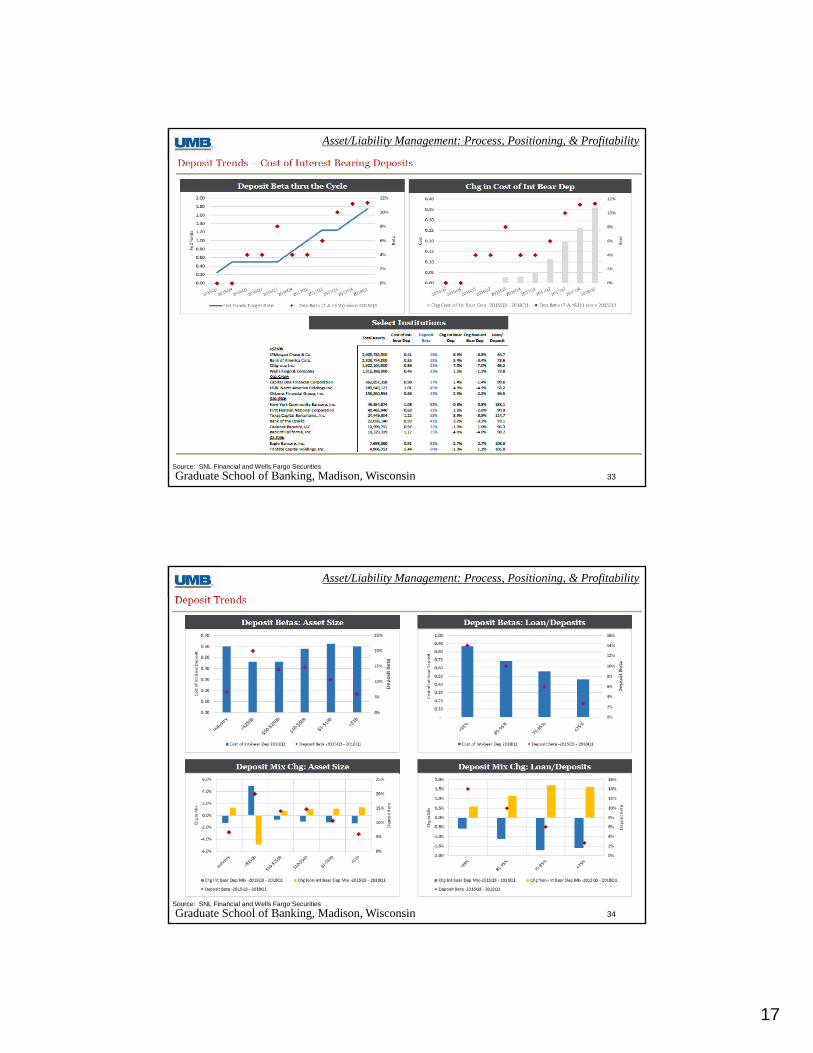
Graduate School of Banking, Madison, Wisconsin 33Source: SNL Financial and Wells Fargo Securities
Asset/Liability Management: Process, Positioning, & Profitability
Graduate School of Banking, Madison, Wisconsin 34Source: SNL Financial and Wells Fargo Securities

18
Asset/Liability Management: Process, Positioning, & Profitability
Graduate School of Banking, Madison, Wisconsin 35
Marginal Cost Funding AnalysisNo Growth Strategy
Interest Interest InterestBalance Rate Expense Balance Rate Expense Balance Rate Expense
MMDA 15,000,000 0.25% 37,500 15,000,000 0.75% 112,500 13,500,000 0.25% 33,750 Wholesale Funding 1,500,000 1.90% 28,500 Combined Position 15,000,000 0.25% 37,500 15,000,000 0.75% 112,500 15,000,000 0.42% 62,250
Marginal Cost Savings 50,250 Marginal Cost Break Even 5.25%
Growth StrategyInterest Interest Interest
Balance Rate Expense Balance Rate Expense Balance Rate ExpenseExisting CDs 15,000,000 1.00% 150,000 13,500,000 1.00% 135,000 15,000,000 1.00% 150,000 New Money 37 Month CD Special 1,500,000 2.25% 33,750 Old Money 37 Month CD Special 1,500,000 2.25% 33,750 Wholesale Funding 1,500,000 2.90% 43,500 Combined Position 15,000,000 1.00% 150,000 16,500,000 1.23% 202,500 16,500,000 1.17% 193,500
Marginal Cost of Funds $ 52,500 43,500 Marginal Cost of Funds Rate 3.50% 2.90%
Comments:75% new money assumption gets the special CD option down to a marginal cost of 2.33%.Breakeven new money percentage equals 60.33%.
Current Position Rates Up 50bp Match Rate Rates Up 50bp Don't Match Rate
Current Position Special Nets $3 Million 50/50 Split No Special, Fund Wholesale
Asset/Liability Management: Process, Positioning, & Profitability
Graduate School of Banking, Madison, Wisconsin 36
• What is my expected range of new money to be raised?
• What is my expected range of existing deposit cannibalization?
• Am I raising in all locations or the cheapest?
• What is my expected rate of outflow if don’t match rate?
• How much outflow can I tolerate?
• What would my wholesale funding options cost?
• What are my breakeven results?
Key Considerations

19
Asset/Liability Management: Process, Positioning, & Profitability
Graduate School of Banking, Madison, Wisconsin 37
Simple Derivatives to Manage the ALM Profile
Asset/Liability Management: Process, Positioning, & Profitability
Graduate School of Banking, Madison, Wisconsin 38
• Bank has experienced margin expansion as rates rise
• Two thirds of loan book reprices or cash flows within 12 months
• Believes Fed will increase another 100 basis points over the next year
• Late in economic cycle and flat curve raises likelihood of lower rates to come which would be adverse to margin
• Bank has experience with embedding loan rate floors, but averse to doing so presently
Context

20
Asset/Liability Management: Process, Positioning, & Profitability
Graduate School of Banking, Madison, Wisconsin 39
Interest Rate Swaps Overview
Initial cost is 80 basis points
Initial benefit is 80 basis points
1 Month Libor
2.10%
5 year bullet
2.90%
1 Month Libor
2.10%
5 year bullet
2.90%
Your Bank1. Pay Fixed, Receive Float2. Convert fixed rate loans
or bonds to floating rate3. Convert floating rate
funding to fixed4. Expect rates to rise
and/or want to limit exposure to rising rates
Counterparty
Receive FixedPay Float
Your Bank1. Pay Float, Receive Fixed2. Convert floating rate
loans or bonds to fixed3. Convert fixed rate
funding to floating4. Expect rates to fall
and/or want to limit exposure to falling rates
Counterparty
Receive FloatPay Fixed
Fixed Rate Loan or BondFloating Rate Funding
Floating Rate Loan or BondFixed Rate Funding
Asset/Liability Management: Process, Positioning, & Profitability
Graduate School of Banking, Madison, Wisconsin 40
Interest Rate Cap
Interest Rate Floor
5 Year ATM Cap Rate = 2.77%
Pay 2.08%
Receive Amount 1ML
Exceeds Strike
Receive Amount 1ML
Below Strike
Your Bank1. Long (Buys) Cap2. Pays Option Premium3. If 1 Month Libor goes
above strike price, Your Bank receives payment
4. Used to limit exposure to 1 Month Libor rising above a certain level
Counterparty1. Short (Sells) Cap2. Receives Option
PremiumFixed Rate Loan or BondFloating Rate Funding
Your Bank1. Long (Buys) Floor2. Pays Option Premium3. If 1 Month Libor goes
below strike price, Your Bank receives payment
4. Used to limit exposure to 1 Month Libor falling below a certain level
Counterparty1. Short (Sells) Floor2. Receives Option
PremiumFloating Rate Loan or BondFixed Rate Funding (DDAs)

21
Asset/Liability Management: Process, Positioning, & Profitability
Graduate School of Banking, Madison, Wisconsin 41
Asset/Liability Management: Process, Positioning, & Profitability
Graduate School of Banking, Madison, Wisconsin 42
Intersession Project Part 1
Analysis of Financial Performance

22
Asset/Liability Management: Process, Positioning, & Profitability
Graduate School of Banking, Madison, Wisconsin 43
Equity Multiplier
Total Assets 100,000,000$ Total Equity 8,000,000$ Equity Ratio 8%Equity Multiplier 12.5
Peer Total Assets 100%Peer Equity 8%Equity Multiplier 12.5
Asset/Liability Management: Process, Positioning, & Profitability
Graduate School of Banking, Madison, Wisconsin 44
Seven Steps to a Better ALCO

23
Asset/Liability Management: Process, Positioning, & Profitability
Graduate School of Banking, Madison, Wisconsin 45
Seven Steps to a Better ALCO• Step 1: Make your policies metric driven• Step 2: Get your membership right• Step 3: Focus your agenda on risk/return metrics
and action items• Step 4: Build meeting information around agenda• Step 5: Review Your Risk/Return Profile
--Is the bank measuring the opportunity cost of its current interest rate risk position?
• Step 6: Pricing methodologies should be robust and reflect metrics
• Step 7: Have action items--Meeting should not just be a history lesson
Asset/Liability Management: Process, Positioning, & Profitability
Graduate School of Banking, Madison, Wisconsin 46
Setting Limits
0.00%
0.20%
0.40%
0.60%
0.80%
1.00%
1.20%
‐
500
1,000
1,500
2,000
2,500
3,000
3,500
4,000
Base Case 20% NII Limits 0.80% ROA
Comparison of Base Case to Limit Methodologies
NII ROA
Base Case 20% NII LimitsMinimum .80%
ROA MetricTotal Assets 100,000,000 100,000,000 100,000,000 NII 3,500,000 2,800,000 3,192,308 NI 1,000,000 545,000 800,000 Tax Rate 35% 35% 35%ROA 1.00% 0.55% 0.80%
ROA metric requires NII limit of < 9%, not 10%-20%

24
Asset/Liability Management: Process, Positioning, & Profitability
Graduate School of Banking, Madison, Wisconsin 47
Expected Outcomes
• More engaged ALCO
• Better questions
• Increased volume and quality of ideas
• Greater strategic focus
• Improved financial results
Asset/Liability Management: Process, Positioning, & Profitability
Graduate School of Banking, Madison, Wisconsin 48
Intersession Project Part 2
ALCO Responsibilities and Tools

25
Asset/Liability Management: Process, Positioning, & Profitability
Graduate School of Banking, Madison, Wisconsin 49
Conclusions• ALM’s primary responsibilities center on
• Net interest income and net interest margin
• Rate, volume, mix
• Interest rate risk
• Liquidity risk
• Capital Management
• Levers—Balance Sheet Mix Composition, Capital/Leverage, Pricing, Interest Rate Risk, Liquidity Risk, Derivatives
• Understand the interest rate cycles and what the yield curve is saying
• Follow the 7 steps for an improved ALM process
Asset/Liability Management: Process, Positioning, & Profitability
Graduate School of Banking, Madison, Wisconsin 50
Questions?
Darren Herrmann
Executive Vice President & Treasurer
UMB Financial Corporation
816-860-7195