asset allocation and risk assessment with gross exposure ... · asset allocation and risk...
TRANSCRIPT

Asset Allocation and Risk Assessment with
Gross Exposure Constraints
Forrest Zhang
Bendheim Center for Finance
Princeton University
A joint work with Jianqing Fan and Ke Yu, Princeton
Princeton University Asset Allocation with Gross Exposure Constraints 1/25

Introduction
Princeton University Asset Allocation with Gross Exposure Constraints 2/25
Markowitz’s Mean-variance analysis
�Problem: minw wTΣw, s.t. wT
1 = 1, and wTµ = r0.
Solution: w = c1 Σ−1
µ + c2 Σ−1
1
• Cornerstone of modern finance where CAPM and many
portfolio theory is built upon.
• Too sensitive on input vectors and their estimation errors.
• Can result in extreme short positions (Green and Holdfield,
1992).
• More severe for large portfolio.
Princeton University Asset Allocation with Gross Exposure Constraints 3/25
Challenge of High Dimensionality
�Estimating high-dim cov-matrices is intrinsically challenging.
• Suppose we have 500 (2000) stocks to be managed. There
are 125K (2 m) free parameters!
• Yet, 2-year daily returns yield only about sample size n = 500.
Accurately estimating it poses significant challenges.
• Impact of dimensionality is large and poorly understood:
Risk: wTΣw. Allocation: c1Σ
−11 + c2Σ
−1µ.
• Accumulating of millions of estimation errors can have a
devastating effect.
Princeton University Asset Allocation with Gross Exposure Constraints 4/25
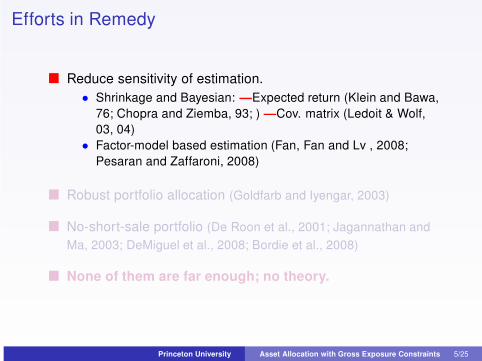
Efforts in Remedy
� Reduce sensitivity of estimation.
• Shrinkage and Bayesian: —Expected return (Klein and Bawa,
76; Chopra and Ziemba, 93; ) —Cov. matrix (Ledoit & Wolf,
03, 04)
• Factor-model based estimation (Fan, Fan and Lv , 2008;
Pesaran and Zaffaroni, 2008)
� Robust portfolio allocation (Goldfarb and Iyengar, 2003)
� No-short-sale portfolio (De Roon et al., 2001; Jagannathan and
Ma, 2003; DeMiguel et al., 2008; Bordie et al., 2008)
� None of them are far enough; no theory.
Princeton University Asset Allocation with Gross Exposure Constraints 5/25
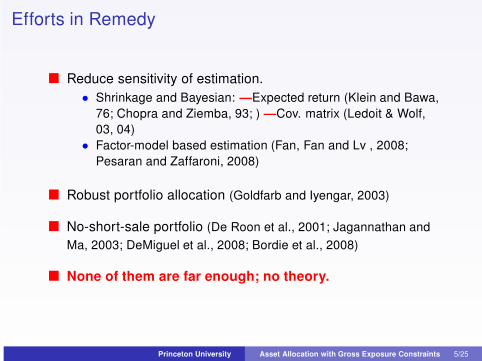
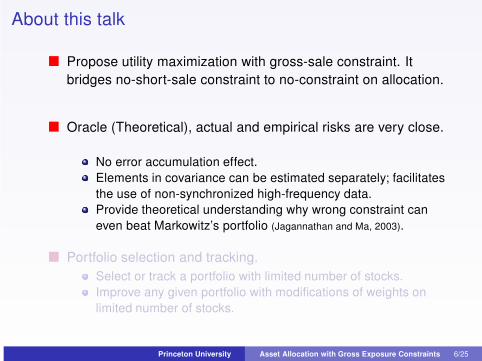
About this talk
� Propose utility maximization with gross-sale constraint. It
bridges no-short-sale constraint to no-constraint on allocation.
� Oracle (Theoretical), actual and empirical risks are very close.
No error accumulation effect.
Elements in covariance can be estimated separately; facilitates
the use of non-synchronized high-frequency data.
Provide theoretical understanding why wrong constraint can
even beat Markowitz’s portfolio (Jagannathan and Ma, 2003).
� Portfolio selection and tracking.
Select or track a portfolio with limited number of stocks.
Improve any given portfolio with modifications of weights on
limited number of stocks.
Princeton University Asset Allocation with Gross Exposure Constraints 6/25
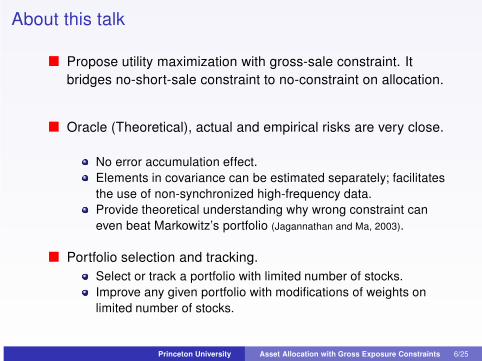
Outline
1 Portfolio optimization with gross-exposure constraint.
2 Portfolio selection and tracking.
3 Simulation studies
4 Empirical studies:
Princeton University Asset Allocation with Gross Exposure Constraints 7/25
Short-constrained portfolio selection
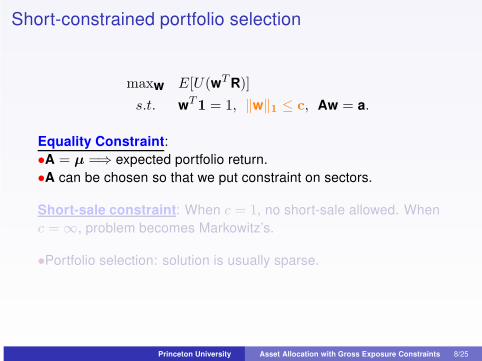
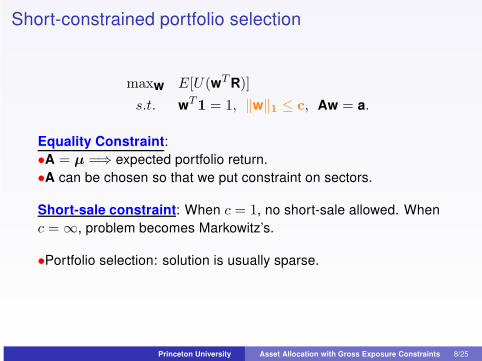
maxw E[U(wT R)]
s.t. wT1 = 1, ‖w‖1 ≤ c, Aw = a.
Equality Constraint:
•A = µ =⇒ expected portfolio return.
•A can be chosen so that we put constraint on sectors.
Short-sale constraint: When c = 1, no short-sale allowed. When
c = ∞, problem becomes Markowitz’s.
•Portfolio selection: solution is usually sparse.
Princeton University Asset Allocation with Gross Exposure Constraints 8/25
Short-constrained portfolio selection
maxw E[U(wT R)]
s.t. wT1 = 1, ‖w‖1 ≤ c, Aw = a.
Equality Constraint:
•A = µ =⇒ expected portfolio return.
•A can be chosen so that we put constraint on sectors.
Short-sale constraint: When c = 1, no short-sale allowed. When
c = ∞, problem becomes Markowitz’s.
•Portfolio selection: solution is usually sparse.
Princeton University Asset Allocation with Gross Exposure Constraints 8/25
Risk optimization Theory
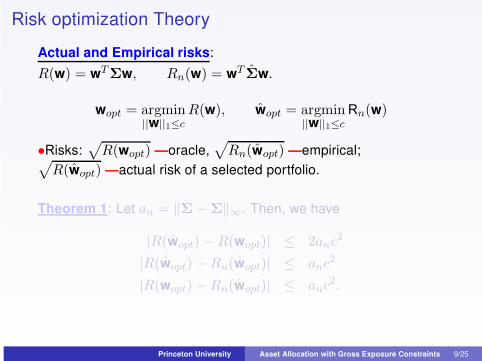
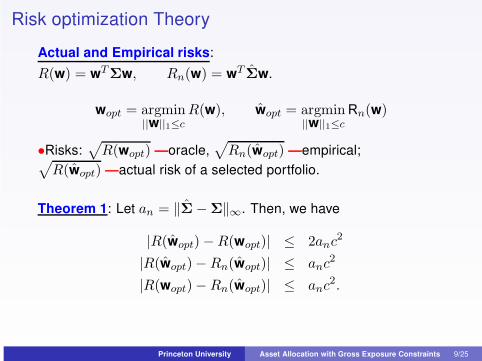
Actual and Empirical risks:
R(w) = wTΣw, Rn(w) = wT
Σw.
wopt = argmin||w||1≤c
R(w), wopt = argmin||w||1≤c
Rn(w)
•Risks:√
R(wopt) —oracle,√
Rn(wopt) —empirical;√
R(wopt) —actual risk of a selected portfolio.
Theorem 1: Let an = ‖Σ − Σ‖∞. Then, we have
|R(wopt) − R(wopt)| ≤ 2anc2
|R(wopt) − Rn(wopt)| ≤ anc2
|R(wopt) − Rn(wopt)| ≤ anc2.
Princeton University Asset Allocation with Gross Exposure Constraints 9/25
Risk optimization Theory
Actual and Empirical risks:
R(w) = wTΣw, Rn(w) = wT
Σw.
wopt = argmin||w||1≤c
R(w), wopt = argmin||w||1≤c
Rn(w)
•Risks:√
R(wopt) —oracle,√
Rn(wopt) —empirical;√
R(wopt) —actual risk of a selected portfolio.
Theorem 1: Let an = ‖Σ − Σ‖∞. Then, we have
|R(wopt) − R(wopt)| ≤ 2anc2
|R(wopt) − Rn(wopt)| ≤ anc2
|R(wopt) − Rn(wopt)| ≤ anc2.
Princeton University Asset Allocation with Gross Exposure Constraints 9/25

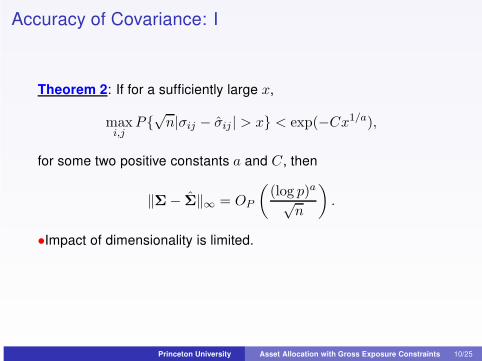
Accuracy of Covariance: I
Theorem 2: If for a sufficiently large x,
maxi,j
P{√
n|σij − σij | > x} < exp(−Cx1/a),
for some two positive constants a and C, then
‖Σ − Σ‖∞ = OP
(
(log p)a√n
)
.
•Impact of dimensionality is limited.
Princeton University Asset Allocation with Gross Exposure Constraints 10/25
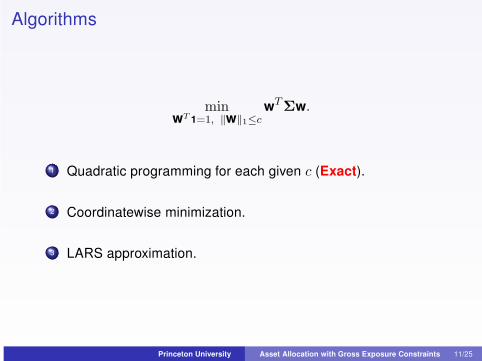
Algorithms
minwT 1=1, ‖w‖1≤c
wTΣw.
1 Quadratic programming for each given c (Exact).
2 Coordinatewise minimization.
3 LARS approximation.
Princeton University Asset Allocation with Gross Exposure Constraints 11/25

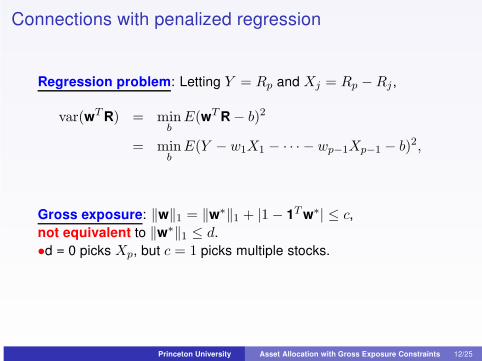
Connections with penalized regression
Regression problem: Letting Y = Rp and Xj = Rp − Rj ,
var(wT R) = minb
E(wT R − b)2
= minb
E(Y − w1X1 − · · · − wp−1Xp−1 − b)2,
Gross exposure: ‖w‖1 = ‖w∗‖1 + |1 − 1T w∗| ≤ c,
not equivalent to ‖w∗‖1 ≤ d.
•d = 0 picks Xp, but c = 1 picks multiple stocks.
Princeton University Asset Allocation with Gross Exposure Constraints 12/25
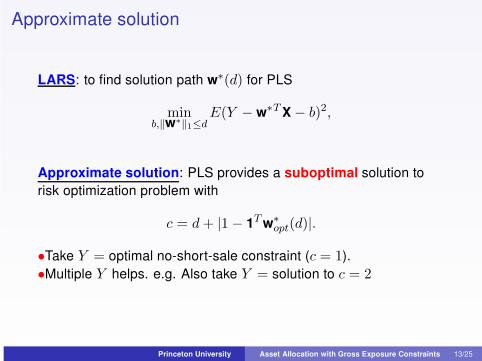
Approximate solution
LARS: to find solution path w∗(d) for PLS
minb,‖w∗‖1≤d
E(Y − w∗T X − b)2,
Approximate solution: PLS provides a suboptimal solution to
risk optimization problem with
c = d + |1 − 1T w∗opt(d)|.
•Take Y = optimal no-short-sale constraint (c = 1).
•Multiple Y helps. e.g. Also take Y = solution to c = 2
Princeton University Asset Allocation with Gross Exposure Constraints 13/25
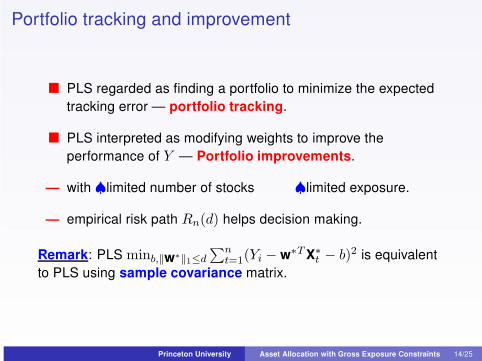
Portfolio tracking and improvement
� PLS regarded as finding a portfolio to minimize the expected
tracking error — portfolio tracking.
� PLS interpreted as modifying weights to improve the
performance of Y — Portfolio improvements.
— with ♠limited number of stocks ♠limited exposure.
— empirical risk path Rn(d) helps decision making.
Remark: PLS minb,‖w∗‖1≤d
∑nt=1
(Yi − w∗T X∗t − b)2 is equivalent
to PLS using sample covariance matrix.
Princeton University Asset Allocation with Gross Exposure Constraints 14/25
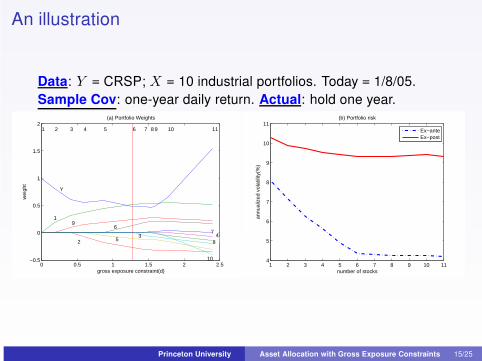
An illustration
Data: Y = CRSP; X = 10 industrial portfolios. Today = 1/8/05.
Sample Cov: one-year daily return. Actual: hold one year.
0 0.5 1 1.5 2 2.5−0.5
0
0.5
1
1.5
21 2 3 4 5 6 7 8 9 10 11
gross exposure constraint(d)
wei
ght
(a) Portfolio Weights
Y
19
2 5
6
3
10
7
84
1 2 3 4 5 6 7 8 9 10 114
5
6
7
8
9
10
11(b) Portfolio risk
number of stocks
annu
aliz
ed v
olat
ility
(%)
Ex−anteEx−post
Princeton University Asset Allocation with Gross Exposure Constraints 15/25
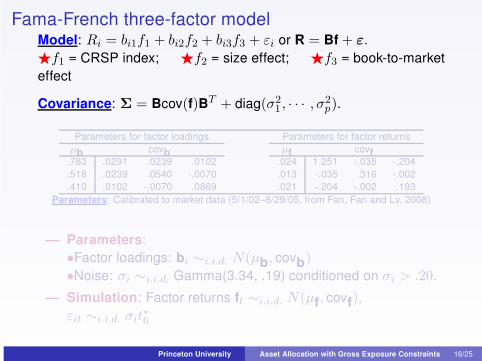
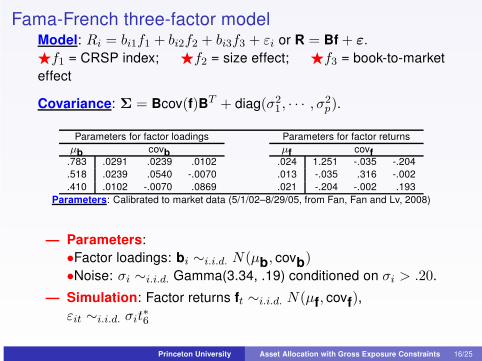
Fama-French three-factor modelModel: Ri = bi1f1 + bi2f2 + bi3f3 + εi or R = Bf + ε.
⋆f1 = CRSP index; ⋆f2 = size effect; ⋆f3 = book-to-market
effect
Covariance: Σ = Bcov(f)BT + diag(σ2
1, · · · , σ2
p).
Parameters for factor loadings Parameters for factor returns
µb covb µf covf.783 .0291 .0239 .0102 .024 1.251 -.035 -.204
.518 .0239 .0540 -.0070 .013 -.035 .316 -.002
.410 .0102 -.0070 .0869 .021 -.204 -.002 .193
Parameters: Calibrated to market data (5/1/02–8/29/05, from Fan, Fan and Lv, 2008)
— Parameters:
•Factor loadings: bi ∼i.i.d. N(µb, covb)•Noise: σi ∼i.i.d. Gamma(3.34, .19) conditioned on σi > .20.
— Simulation: Factor returns ft ∼i.i.d. N(µf, covf),εit ∼i.i.d. σit
∗6
Princeton University Asset Allocation with Gross Exposure Constraints 16/25
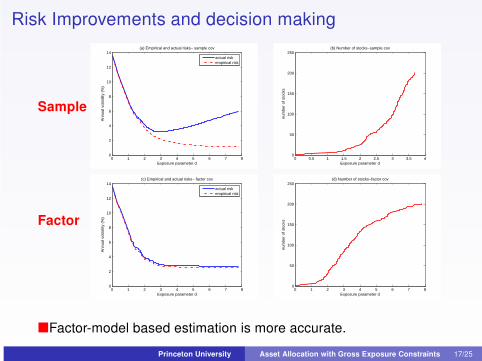
Risk Improvements and decision making
0 1 2 3 4 5 6 7 80
2
4
6
8
10
12
14(a) Empirical and actual risks− sample cov
Exposure parameter d
Ann
ual v
olat
ility
(%
)
actual riskempirical risk
0 0.5 1 1.5 2 2.5 3 3.5 40
50
100
150
200
250
Exposure parameter d
num
ber
of s
tock
s
(b) Number of stocks−sample cov
0 1 2 3 4 5 6 7 80
2
4
6
8
10
12
14(c) Empirical and actual risks− factor cov
Exposure parameter d
Ann
ual v
olat
ility
(%
)
actual riskempirical risk
0 1 2 3 4 5 6 7 80
50
100
150
200
250
Exposure parameter d
num
ber
of s
tock
s
(d) Number of stocks−factor cov
�Factor-model based estimation is more accurate.
Sample
Factor
Princeton University Asset Allocation with Gross Exposure Constraints 17/25

Empirical studies (I)
Princeton University Asset Allocation with Gross Exposure Constraints 18/25
Some details
Data: 100 portfolios from the website of Kenneth French from
1998–2007 (10 years)
Portfolios: two-way sort according to the size and book-to-equity
ratio, 10 categories each.
Evaluation: Rebalance monthly, and record daily returns.
Covariance matrix: Estimate by sample covariance matrix, factor
model used last twelve months daily data, and RiskMetrics.
Princeton University Asset Allocation with Gross Exposure Constraints 19/25
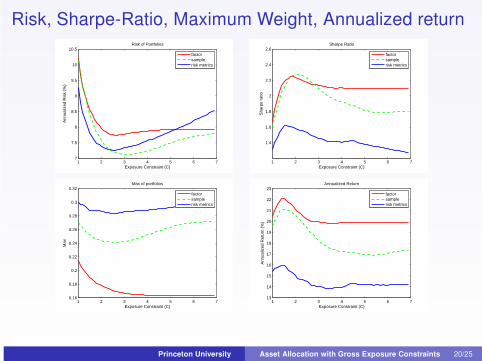
Risk, Sharpe-Ratio, Maximum Weight, Annualized return
1 2 3 4 5 6 77
7.5
8
8.5
9
9.5
10
10.5
Exposure Constraint (C)
Ann
ualiz
ed R
isk
(%)
Risk of Portfolios
factorsamplerisk metrics
1 2 3 4 5 6 7
1.4
1.6
1.8
2
2.2
2.4
2.6
Exposure Constraint (C)
Sha
rpe
ratio
Sharpe Ratio
factorsamplerisk metrics
1 2 3 4 5 6 70.16
0.18
0.2
0.22
0.24
0.26
0.28
0.3
0.32
Exposure Constraint (C)
Max
Max of portfolios
factorsamplerisk metrics
1 2 3 4 5 6 713
14
15
16
17
18
19
20
21
22
23
Exposure Constraint (C)
Ann
ualiz
ed R
etur
n (%
)
Annualized Return
factorsamplerisk metrics
Princeton University Asset Allocation with Gross Exposure Constraints 20/25
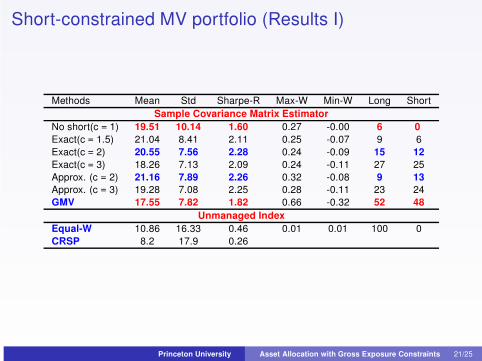
Short-constrained MV portfolio (Results I)
Methods Mean Std Sharpe-R Max-W Min-W Long Short
Sample Covariance Matrix Estimator
No short(c = 1) 19.51 10.14 1.60 0.27 -0.00 6 0
Exact(c = 1.5) 21.04 8.41 2.11 0.25 -0.07 9 6
Exact(c = 2) 20.55 7.56 2.28 0.24 -0.09 15 12
Exact(c = 3) 18.26 7.13 2.09 0.24 -0.11 27 25
Approx. (c = 2) 21.16 7.89 2.26 0.32 -0.08 9 13
Approx. (c = 3) 19.28 7.08 2.25 0.28 -0.11 23 24
GMV 17.55 7.82 1.82 0.66 -0.32 52 48
Unmanaged Index
Equal-W 10.86 16.33 0.46 0.01 0.01 100 0
CRSP 8.2 17.9 0.26
Princeton University Asset Allocation with Gross Exposure Constraints 21/25

Empirical studies (II)
Princeton University Asset Allocation with Gross Exposure Constraints 22/25
Some details
Data: 1000 stocks with missing data selected from Russell 3000
from 2003-2007 (5 years).
Allocation: Each month, pick 400 stocks at random and allocate
them (mitigating survivor biases).
Evaluation: Rebalance monthly, and record daily returns.
Covariance matrix: Estimate by sample covariance matrix, factor
model used last twenty-four months daily data, and RiskMetrics.
Princeton University Asset Allocation with Gross Exposure Constraints 23/25
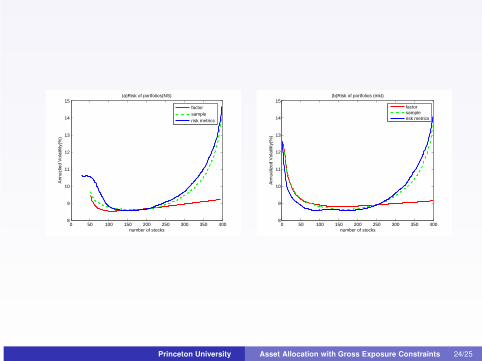
0 50 100 150 200 250 300 350 4008
9
10
11
12
13
14
15
number of stocks
Ann
uzlie
d V
olat
ility
(%)
(a)Risk of portfolios(NS)
factorsamplerisk metrics
0 50 100 150 200 250 300 350 4008
9
10
11
12
13
14
15
number of stocks
Ann
ualiz
ed V
olat
ility
(%)
(b)Risk of portfolios (mkt)
factorsamplerisk metrics
Princeton University Asset Allocation with Gross Exposure Constraints 24/25
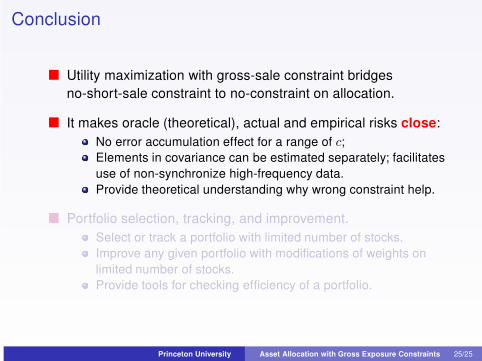
Conclusion
� Utility maximization with gross-sale constraint bridges
no-short-sale constraint to no-constraint on allocation.
� It makes oracle (theoretical), actual and empirical risks close:
No error accumulation effect for a range of c;
Elements in covariance can be estimated separately; facilitates
use of non-synchronize high-frequency data.
Provide theoretical understanding why wrong constraint help.
� Portfolio selection, tracking, and improvement.
Select or track a portfolio with limited number of stocks.
Improve any given portfolio with modifications of weights on
limited number of stocks.
Provide tools for checking efficiency of a portfolio.
Princeton University Asset Allocation with Gross Exposure Constraints 25/25