assessment of the spatial and temporal trends in smallholder cattle production across ... ·...
TRANSCRIPT
Assessment of the spatial and temporal trends in smallholder cattle production across Northern Laos and
Southern Cambodia.
Luke E. York
The University of Sydney Funded by the Australian Centre for International Agricultural Research
28 Nile Street Orange
NSW Australia 2800
Email: [email protected] Phone: 0431484235
2
1. Abstract
In April 2002, an animal health and production survey was conducted across two
Northern Lao provinces, Luang Prabang and Xieng Khouang as part of the Forage and
Livestock Systems Project (FLSP). This study acted as a pilot study for two cattle health
and production surveys conducted in 2007 as part of Australian Centre for International
Agricultural Research (ACIAR) project AH/2006/077 in the Northern Lao provinces,
Luang Prabang, Xieng Khouang and Houaphanh and the Southern Cambodian provinces,
Kampong Cham, Kandal and Takeo. Comparison of survey results allowed temporal and
spatial trends in the importance of cattle and productive constraints to be assessed. In
Laos, farmers identified the main use of cattle was for income generation. Cambodian
farmers used cattle primarily for; manure, a store of wealth, work, sale and breeding. The
two main constraints to production – disease and insufficient feed, did not vary on a
temporal or spatial scale. Cambodian farmers were more sensitive to constraints that
negatively influenced productive characteristics such as; reproductive performance,
mortality rate and the labour intensity of production due to breed deficiencies in the
Hariana cattle. Improved nutrition and disease management will improve the productivity
of Lao and Cambodian cattle. However, further research is required to determine the
disease causing pathogens and reasons for insufficient feed in Northern Laos and
Southern Cambodia.
Keywords: Cattle, Laos, Cambodia, Developing countries, Asia
3
2. Introduction
Poverty is a major challenge for the South East Asian region, particularly the Lao
People’s Democratic Republic (commonly referred to as Laos) and the Kingdom of
Cambodia, which are ranked amongst the lowest of all South East Asian countries in the
United Nation’s Human Development (UNDP) index. These two countries were ranked
130 and 131 respectively out of 173 world countries in 2007/08 (UNDP, 2008). Laos is
one of the smallest and poorest developing countries in the world with a total population
in 2004 of 5.84 million people of which 78.8% (approximately 4.6 million people) live in
rural communities (International Fund for Agricultural development (IFAD), 2007).
Poverty levels are high in rural Lao communities with 1998 estimates suggesting that
41% of all rural Lao people (approximately 1.9 million people) exist below the
international poverty line with an income of less than US$1 a day (IFAD, 2007). Similar
trends are also apparent in Cambodia. Cambodia is a country of approximately 13.8
million people in 2004 (IFAD, 2007) of which 80.8% (approximately 11.2 million
people) reside in rural areas (IFAD, 2007). Poverty levels are also high in rural areas of
Cambodia with 40.1% of rural people (approximately 4.2 million people) existing below
the international poverty line in 1999 (IFAD, 2007). This presents significant challenges
to the economy of these countries as the large rural populations have prevented
industrialization from occurring, as observed in the neighbouring countries of Thailand,
Vietnam and China (Knips, 2004; IFAD, 2007). Thus, the socio-economic stability of
Laos and Cambodia is overwhelmingly reliant on the agricultural sector, particularly
livestock production which contributes 9 percent and 7.6 percent to the total Gross
Domestic Product (GDP) of the respective countries (IFAD, 2007). However, at present
agriculture in Laos and Cambodia is primarily rice focused with 98.50% all livestock
production being extensively based and characterized by low inputs (Knips, 2004; FAO,
2005a).
Within Laos and Cambodia villagers traditionally keep small numbers of cattle (less than
5 head per household) (Wilson, 2007; Millar and Photakoun, 2008; Soun, 2008; Windsor
et al., 2008). Cattle provide draught power and harrowing, manure that can be used as
4
fertilizer, and are often an animal ‘bank’ for conversion to cash when money for major
household expenditure such as weddings, funerals, health and education is required
(Wilson, 2007; Suon, 2007). Over the past decade, there has been an increase in
consumption of beef and demand for live cattle within Thailand, Vietnam and China
(Quirke et al., 2003). This has created demand and markets for fattened cattle in the
region (Stür et al., 2002; Windsor et al., 2008). Thus, opportunities now exist for both
Cambodia and Laos to engage in the growing Asian livestock sector (Stür et al., 2002;
Windsor et al., 2008).
At present, the main limitations to livestock production within Laos and Cambodia are
insufficient and poor quality feed sources, especially during the dry season, and livestock
diseases (Millar and Photakoun, 2008; Soun, 2008; Windsor et al., 2008). These
limitations influence productive capabilities of the cattle through high morbidity and
mortality rates, poor reproductive rates, limited growth rates and weight gains (Stür et al.,
2002; Windsor et al., 2008). Thus, opportunities exist to assist smallholder farmers to
progress from the currently low levels of production per animal to the much higher levels
observed in developed countries (Knips, 2004). By improving the health and nutrition of
cattle and targeting beef production, a shift of the production system away from rice
dependence (Suon, 2008) to higher value production per hectare and per unit of labour
(Knips, 2004) may be achieved to help alleviate poverty within the rural communities of
these countries (Stür et al., 2002; Windsor et al., 2008). However, to identify the
necessary interventions that can achieve this; the ways in which cattle contribute to the
livelihoods of the farming household and the constraints to production (Livestock in
Development (LiD), 1999; Stür et al., 2002) need to be understood. Therefore, the aim of
this investigation is to determine the importance of cattle to farming households and
identify current constraints to production through describing the spatial and temporal
trends in smallholder cattle production across the upland regions of Northern Laos and
the lowland regions of Southern Cambodia.
5
3. Materials and Methods
3.1 2002 FLSP survey in Northern Laos
The study was conducted within the frame of the International Centre for Tropical
Agriculture’s (CIAT) research program, FLSP
3.1.1. Research site
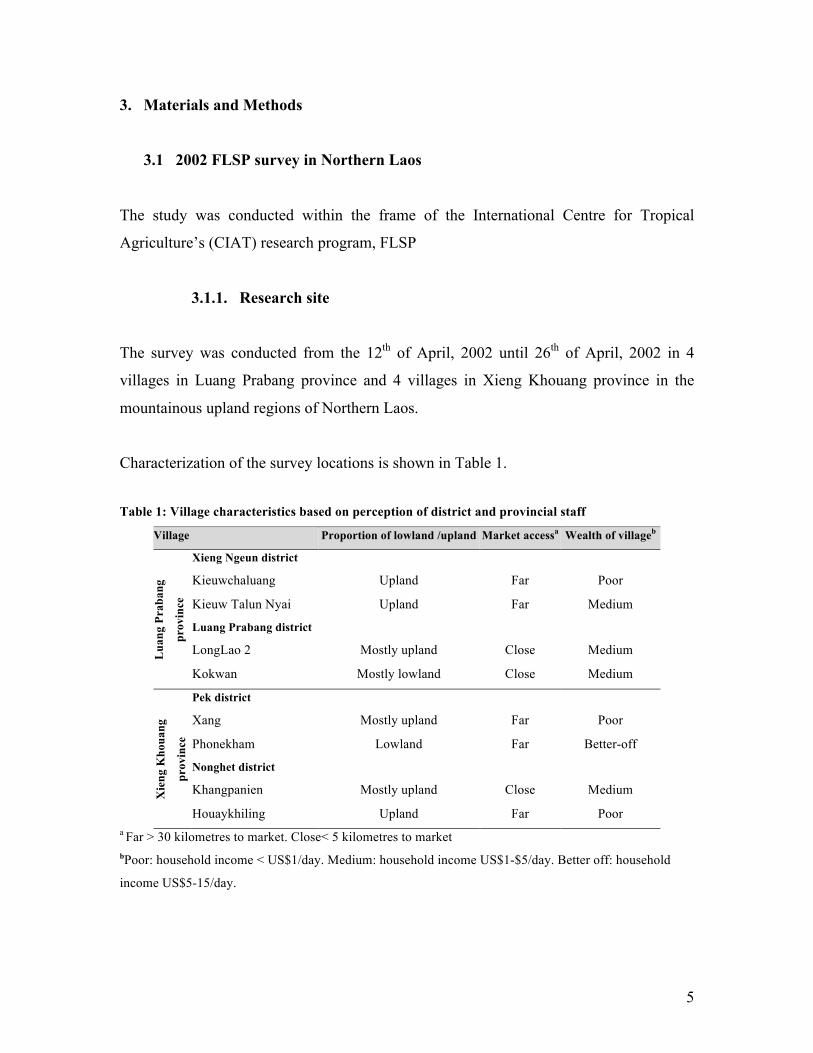
The survey was conducted from the 12th of April, 2002 until 26th of April, 2002 in 4
villages in Luang Prabang province and 4 villages in Xieng Khouang province in the
mountainous upland regions of Northern Laos.
Characterization of the survey locations is shown in Table 1.
Table 1: Village characteristics based on perception of district and provincial staff
Village Proportion of lowland /upland Market accessa Wealth of villageb
Lua
ng P
raba
ng
prov
ince
Xieng Ngeun district
Kieuwchaluang Upland Far Poor
Kieuw Talun Nyai Upland Far Medium
Luang Prabang district
LongLao 2 Mostly upland Close Medium
Kokwan Mostly lowland Close Medium
Xie
ng K
houa
ng
prov
ince
Pek district
Xang Mostly upland Far Poor
Phonekham Lowland Far Better-off
Nonghet district
Khangpanien Mostly upland Close Medium
Houaykhiling Upland Far Poor a Far > 30 kilometres to market. Close< 5 kilometres to market bPoor: household income < US$1/day. Medium: household income US$1-$5/day. Better off: household
income US$5-15/day.
6
3.1.2. Sampling method
3.1.2.1. Selection of villages
Two villages were selected from each of the 4 districts that the FLSP had been working
in since 2001. Villages were selected by provincial staff from the Department of
Livestock and Fisheries (DLF), Laos using local knowledge on the basis that:
1. There was a high potential of uptake of technologies offered by the FLSP and,
2. The selected villages cover the range of farming systems (poultry, pigs, goats,
cattle and buffalo), ethnic groups, market access and wealth status of all
villages engaged with the FLSP.
3.1.2.2. Selection of Households
Four to six households per village were selected for interview. Households participating
in the FLSP in each village were sorted by district staff on the basis of technology uptake,
from high to low potential. Technology uptake was determined through evidence of
forage technology and/or evidence of supplementary feeding. Households were selected
for interview by CIAT staff in consultation with local experts from the DLF, Laos on the
basis that:
1. They had a high potential for technology uptake.
2. Represent the range of livelihood systems and wealth of households
participating in FLSP. A proportion of households did not own particular
species, namely large ruminant species (cattle and/or buffalo).
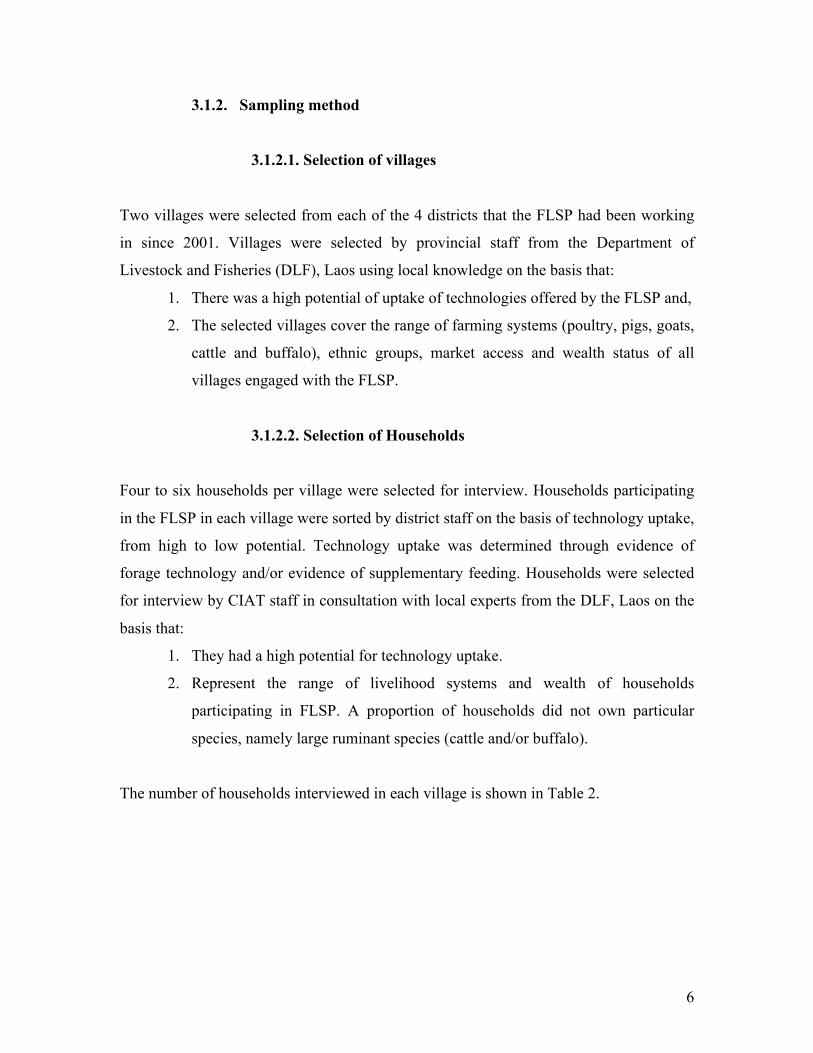
The number of households interviewed in each village is shown in Table 2.
7
Table 2: Number of households interviewed in each per district
Village Number of households
interviewed
Lua
ng P
raba
ng P
rovi
nce
Xieng Ngeun district
Kieuwchaluang 4
Kieuw Talun Nyai 4
Luang Prabang district
LongLao 2 4
Kokwan 6
Sub-Total 18
Xie
ng K
houa
ng P
rovi
nce Pek district
Xang 6
Phonekham 6
Nonghet district
Khangpanien 6
Houaykhiling 6
Sub-Total 24
Total 42
3.1.3. Survey format and interview techniques
The survey was developed by CIAT staff and FLSP partners. The interview was tested
with FLSP partners in Luang Prabang to ensure questions were not ambiguous or overly
technical. A copy of the survey is shown in Appendix 1. Interviews were conducted by
staff from the DLF, Laos after undertaking a 3-day training course in survey
methodology. The study was conducted as a semi-structured interview requiring 2-3
hours using open and probing questions to ensure a good understanding of the livelihoods
of each household as well as providing actual data on productivity of individual animals.
The interview was conducted with the male and female head of households together in
the language most comfortable for respondents. For example, the Hmong language was
used in the case of ethnic Hmong households and the Lao language in ethnic Lao
households. Visual and interactive tools such as; mapping, matrix weighting and seasonal
8
calendars, were incorporated into the interview to make the interview fun for the
respondents and to overcome potential language and literacy limitations.
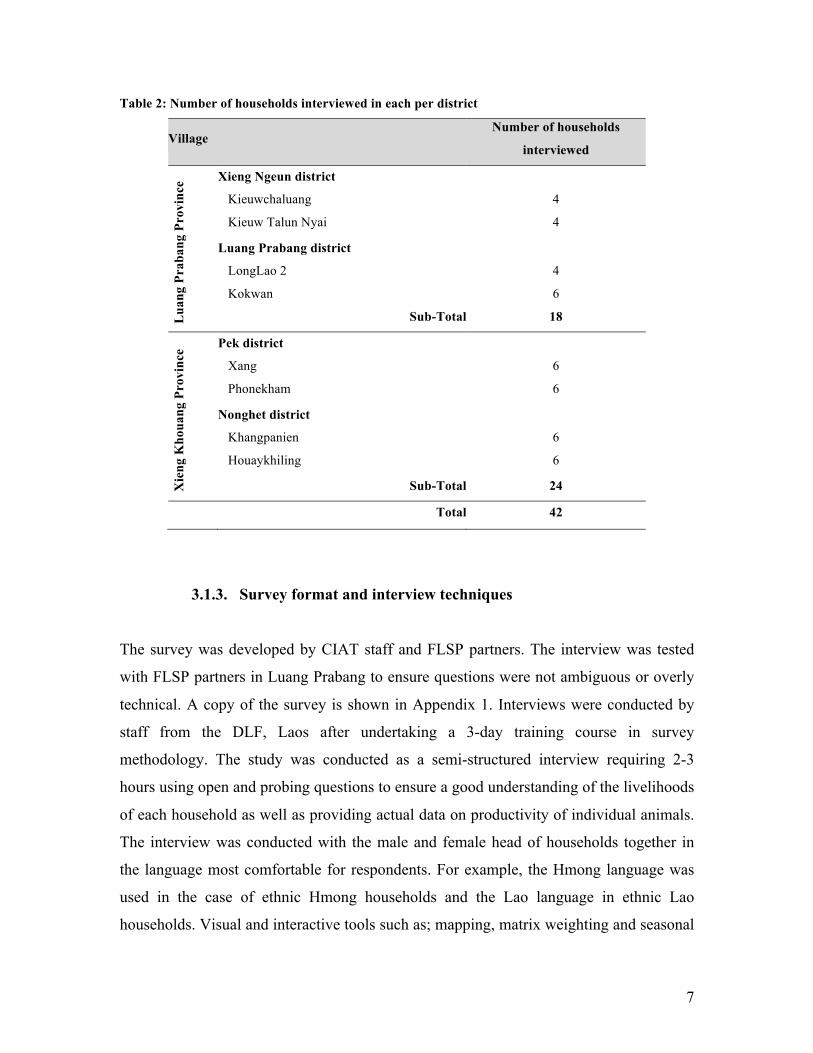
Interviews covered socioeconomic parameters, livestock production in general, and
details pertaining to the management and productivity of major livestock types such as
cattle, buffalo and pigs. For the purpose of this investigation only productive
characteristics of cattle were examined. Parameters examined are shown in Table 3.
Table 3: The parameters examined across Northern Laos in 2002.
+ indicates multiple answers were possible
3.1.4. Data analysis
The raw data were translated into English and transcribed into Microsoft Excel by
translators at the DLF, Laos. Data pertaining to cattle production were imported into
Genstat, 9th edition for statistical analysis. A two-sided Students t-test was used to
compare quantitative traits between provinces. The data were found to meet the
assumptions of Students t-test and no transformations were necessary. Qualitative data
Question topic
Household demographic information
Total Land size
Number of cattle
Age and gender distribution of cattle
Labour requirements for cattle production+
Importance of livelihood factors+
Constraints to agricultural production +
Reproductive performance of cattle
Mortality rates of cattle+
Cause of mortalities+
Medical treatments for cattle+
9
were analyzed with the use of a Pearson’s Chi-square test for comparisons between
provinces. In the circumstances where expected values were less than 5, a Fisher’s Exact
test was to improve the reliability of test results. A P-value <0.05 was considered to be
significant. Results were used to describe the cattle production system across Northern
Laos in 2002. The description was compared to the results of a survey conducted by the
ACIAR in 2007 across Northern Laos to allow temporal differences in cattle production
to be determined.
3.2. 2007 ACIAR survey in Laos
The study was conducted within the frame of the ACIAR project AH 2006/077:
“Identifying research priorities for the development for the beef industry in Cambodia
and Lao PDR with special reference to animal health interventions.”
3.2.1. Research sites
The study was conducted in August 2007 involving 6 households in 5 villages in each of
the provinces, Luang Prabang, Xieng Khouang and Houaphanh in the upland regions of
Northern Laos.
3.2.2. Sampling method
3.2.2.1. Selection of villages
Five villages in each province were selected by Dr Syseng Khounsey from the DLF, Laos
as survey sites based on the criteria that;
1. A high level of cooperation from farmers, local authorities, district staff
and provincial staff.
2. A high potential for uptake of technologies offered.
3. Evidence of intensification of cattle production system such as widespread
stall feeding.
10
4. Perceived active market for the sale of fattened cattle and/or buffalo,
preferably with an export element.
5. At least 200 cattle in each village (>100 adults, >50 weaners, >50 calves)
6. Evidence of enhanced feed resources such as forages
7. Access to project sites.
Fulfillment of the selection criteria was determined through consultation with district and
provincial specialists and assessment of census data.
3.2.2.2. Selection of households
A total of 6 households were interviewed per village. Households were selected by Dr
Syseng Khounsey in consultation with village leaders on the basis that they owned at
least one head of cattle and/or buffalo and displayed a high level of receptivity to the
possible introduction of new technologies.
3.2.3. Survey format and interview techniques
The 2002 FLSP survey acted as a pilot study for this investigation from which survey
questions were adapted as shown in Appendix 2. Interviews were conducted by staff from
the DLF, Laos after undertaking a 3-day training course in survey methodology. Two
additional households were surveyed under observation from Dr Syseng Khounsey to
ensure the survey methodology was being correctly implemented by the research team.
The survey was conducted as described previously for the 2002 FLSP survey (section
3.1.3.).
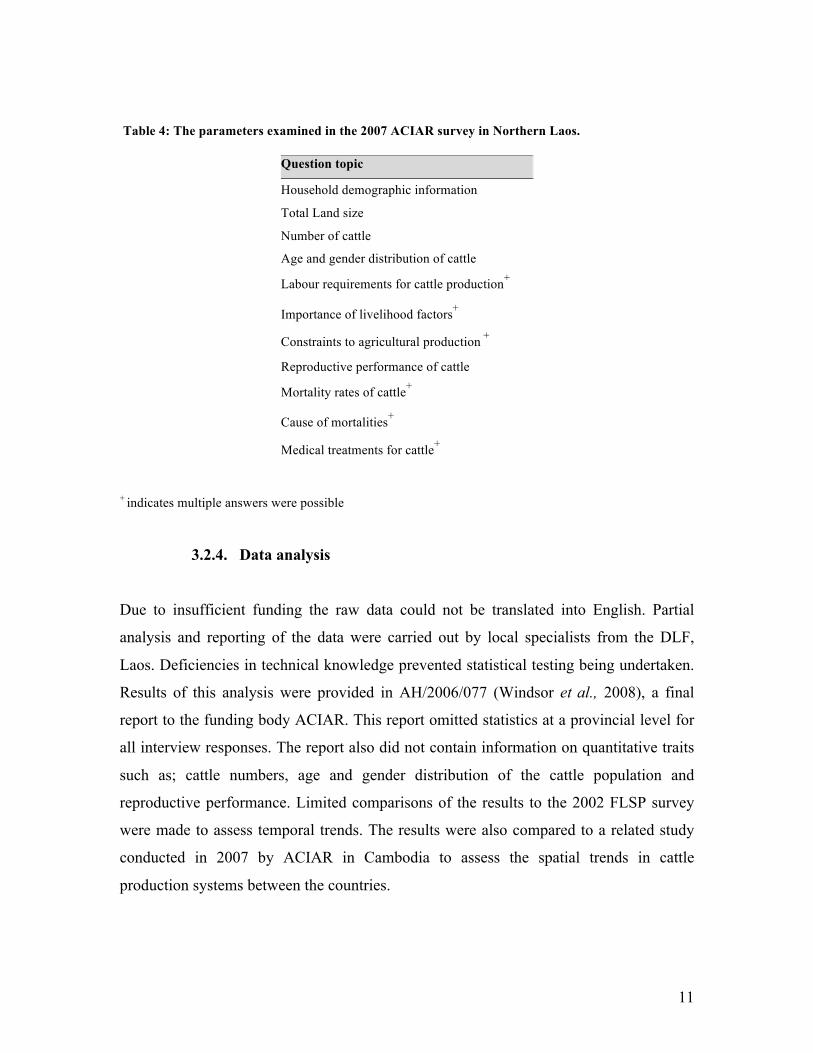
Interviews for this study focused on cattle production in the areas shown in Table 4.
11
Table 4: The parameters examined in the 2007 ACIAR survey in Northern Laos.
+ indicates multiple answers were possible
3.2.4. Data analysis
Due to insufficient funding the raw data could not be translated into English. Partial
analysis and reporting of the data were carried out by local specialists from the DLF,
Laos. Deficiencies in technical knowledge prevented statistical testing being undertaken.
Results of this analysis were provided in AH/2006/077 (Windsor et al., 2008), a final
report to the funding body ACIAR. This report omitted statistics at a provincial level for
all interview responses. The report also did not contain information on quantitative traits
such as; cattle numbers, age and gender distribution of the cattle population and
reproductive performance. Limited comparisons of the results to the 2002 FLSP survey
were made to assess temporal trends. The results were also compared to a related study
conducted in 2007 by ACIAR in Cambodia to assess the spatial trends in cattle
production systems between the countries.
Question topic
Household demographic information
Total Land size
Number of cattle
Age and gender distribution of cattle
Labour requirements for cattle production+
Importance of livelihood factors+
Constraints to agricultural production +
Reproductive performance of cattle
Mortality rates of cattle+
Cause of mortalities+
Medical treatments for cattle+
12
3.3. 2007 ACIAR survey in Cambodia
The study was also conducted within the frame of the ACIAR project: AH 2006/077
“Identifying research priorities for the development for the beef industry in Cambodia
and Lao PDR with special reference to animal health interventions.”
3.3.1. Research site
This study commenced in August 2007 involving 6 households in 5 villages in each of
the Southern Cambodian lowland provinces of Kandal, Takeo and Kampong Cham.
3.3.2. Sampling style
3.3.2.1. Selection of villages
Five villages in each of the three provinces were selected by Dr Soun Sothoeun from the
Department of Animal and Health and Production (DAHP), Cambodia, based on the
same criteria as described for the 2007 ACIAR Laos study (section 3.2.2.1).
3.3.2.2. Selection of households
A total of 6 households were interviewed per village. Households were selected by Dr
Soun Sothoeun from the DAHP, Cambodia in consultation with village leaders on the
same criteria as described for the 2007 ACIAR Laos study (section 3.2.2.2.).
3.3.3. Survey format
Interviews were conducted by staff from the DAHP, Cambodia, after undertaking a 3-day
training course in survey methodology. Survey questions are shown in Appendix 2.
Surveys covered the same parameters as described for the Laos 2007 ACIAR survey
(Table 4). The interviews were conducted in Khmer.
13
3.3.4. Data analysis
Due to insufficient funding the data were analyzed in Khmer by local specialists from the
DAHP, Cambodia. Deficiencies in statistical knowledge prevented analytical tests of the
data being undertaken. Results of this analysis were provided in a final report
(AH/2006/077) (Windsor et al., 2008) to the funding body ACIAR. Limited statistics
were provided at a provincial level for; land size, cattle inventory, constraints to
production, cattle productivity, mortality rates and labour requirements. This allowed for
qualitative data to be analyzed with a Pearson’s chi-square test in statistical program
Genstat (9th Edition). If expected values were less than 5, a Fisher’s Exact test was to
improve the reliability of test results. A P-value <0.05 was considered to be significant.
Quantitative data could not be statistically tested as it can not be determined from the
information provided whether the data fulfills the assumptions of statistical tests. The
results provide a descriptive account of the Southern Cambodian cattle production system.
Comparisons of the results were made with the 2007 ACIAR Laos survey to allow for
spatial trends in cattle production to be assessed between the two countries.
4. Results
4.1. Temporal trends in Cattle production (Northern Laos 2002-2007)
4.1.1. Demographic information
In 2002 a total of 42 households were interviewed in the provinces Luang Prabang and
Xieng Khouang. In 2007 a total of 92 households in Luang Prabang, Xieng Khouang and
Houaphanh provinces were interviewed. The composition of households interviewed is
shown in Table 5.
Table 5: Composition of households interviewed in the provinces Luang Prabang and Xieng
Khouang in 2002 and Northern Laos in 2007.
Province Luang Prabang Xieng Khouang Total1 Northern Laos (2007)
14
1 the total across the provinces surveyed in 2002
4.1.2. Production statistics
The land area utilized by households in Luang Prabang and Xieng Khouang provinces for
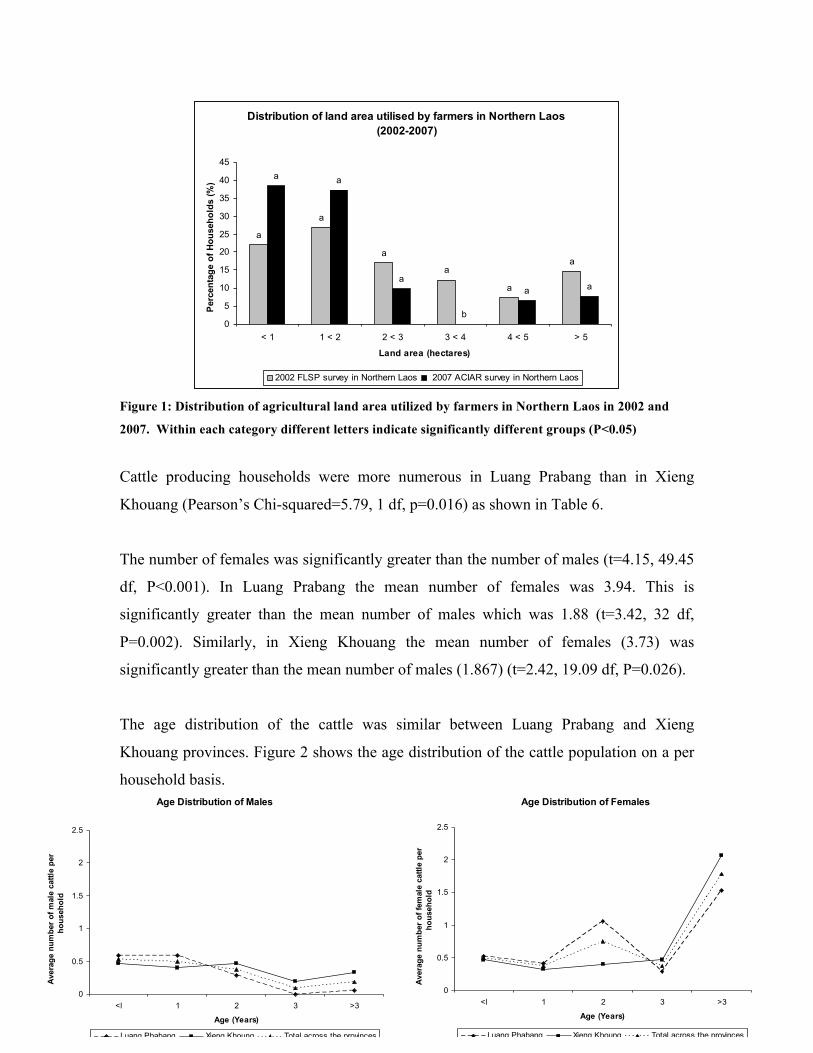
farming activities in 2002 is shown in Table 6. Table 6 also shows the amount of
agricultural land used by farmers that is communal land and upland region. Figure 1
shows distribution of land amongst farmers in 2002 and 2007 across Northern Laos.
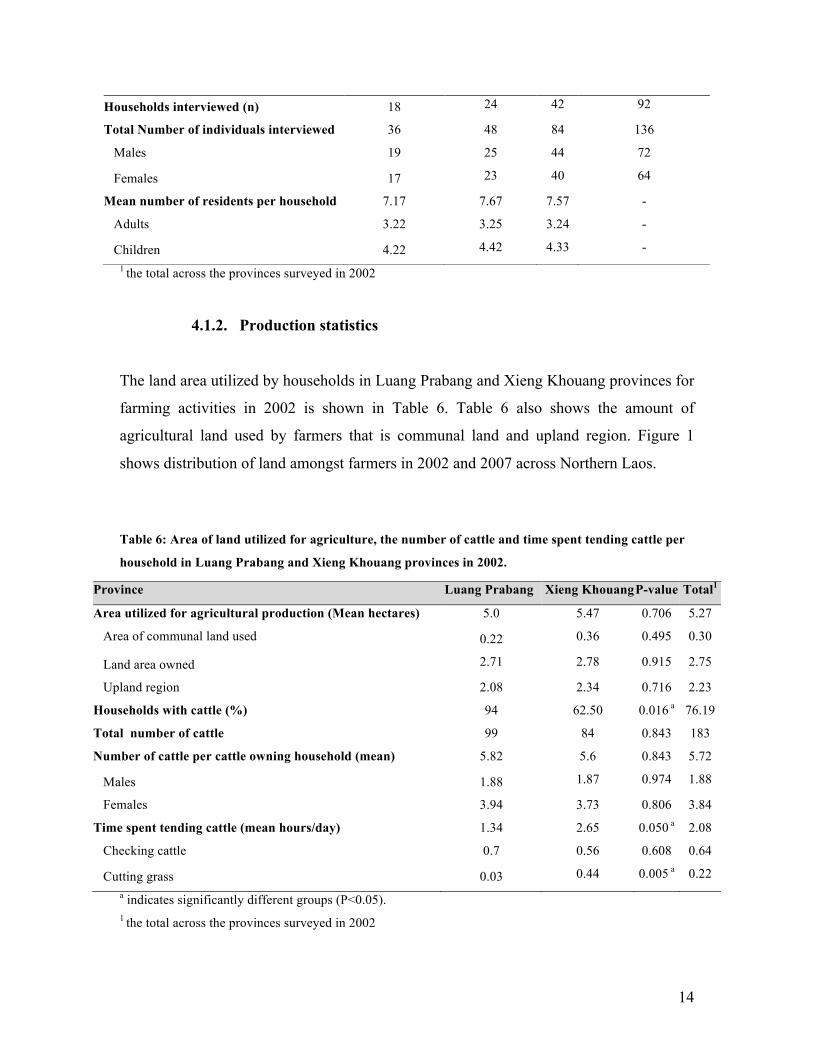
Table 6: Area of land utilized for agriculture, the number of cattle and time spent tending cattle per
household in Luang Prabang and Xieng Khouang provinces in 2002.
a indicates significantly different groups (P<0.05). 1 the total across the provinces surveyed in 2002
Households interviewed (n) 18 24 42 92
Total Number of individuals interviewed 36 48 84 136
Males 19 25 44 72
Females 17 23 40 64
Mean number of residents per household 7.17 7.67 7.57 -
Adults 3.22 3.25 3.24 -
Children 4.22 4.42 4.33 -
Province Luang Prabang Xieng Khouang P-value Total1
Area utilized for agricultural production (Mean hectares) 5.0 5.47 0.706 5.27
Area of communal land used 0.22 0.36 0.495 0.30
Land area owned 2.71 2.78 0.915 2.75
Upland region 2.08 2.34 0.716 2.23
Households with cattle (%) 94 62.50 0.016 a 76.19
Total number of cattle 99 84 0.843 183
Number of cattle per cattle owning household (mean) 5.82 5.6 0.843 5.72
Males 1.88 1.87 0.974 1.88
Females 3.94 3.73 0.806 3.84
Time spent tending cattle (mean hours/day) 1.34 2.65 0.050 a 2.08
Checking cattle 0.7 0.56 0.608 0.64
Cutting grass 0.03 0.44 0.005 a 0.22
15
Age Distribution of Females
0
0.5
1
1.5
2
2.5
<l 1 2 3 >3
Age (Years)
Aver
age
num
ber o
f fem
ale
cattl
e pe
r ho
useh
old
Luang Phabang Xieng Khoung Total across the provinces
Age Distribution of Males
0
0.5
1
1.5
2
2.5
<l 1 2 3 >3
Age (Years)
Aver
age
num
ber o
f mal
e ca
ttle
per
hous
ehol
d
Luang Phabang Xieng Khoung Total across the provinces
Distribution of land area utilised by farmers in Northern Laos (2002-2007)
a
a
a
a
a
a
a a
a
b
a a
0
5
10
15
20
25
30
35
40
45
< 1 1 < 2 2 < 3 3 < 4 4 < 5 > 5
Land area (hectares)
Perc
enta
ge o
f Hou
seho
lds
(%)
2002 FLSP survey in Northern Laos 2007 ACIAR survey in Northern Laos
Figure 1: Distribution of agricultural land area utilized by farmers in Northern Laos in 2002 and
2007. Within each category different letters indicate significantly different groups (P<0.05)
Cattle producing households were more numerous in Luang Prabang than in Xieng
Khouang (Pearson’s Chi-squared=5.79, 1 df, p=0.016) as shown in Table 6.
The number of females was significantly greater than the number of males (t=4.15, 49.45
df, P<0.001). In Luang Prabang the mean number of females was 3.94. This is
significantly greater than the mean number of males which was 1.88 (t=3.42, 32 df,
P=0.002). Similarly, in Xieng Khouang the mean number of females (3.73) was
significantly greater than the mean number of males (1.867) (t=2.42, 19.09 df, P=0.026).
The age distribution of the cattle was similar between Luang Prabang and Xieng
Khouang provinces. Figure 2 shows the age distribution of the cattle population on a per
household basis.
16
Labour requirements for cattle production
aa
aa b
a
b
b0
10
20
30
40
50
60
70
80
< 1 1 < 3 3 < 5 > 5
Time spent tending cattle (hours per day)
Perc
enta
ge o
f hou
seho
lds
(%)
Northern Laos 2002 Northern Laos 2007
Figure 2: Mean number of male and female cattle per household in Xieng Khouang and Luang
Prabang in 2002.
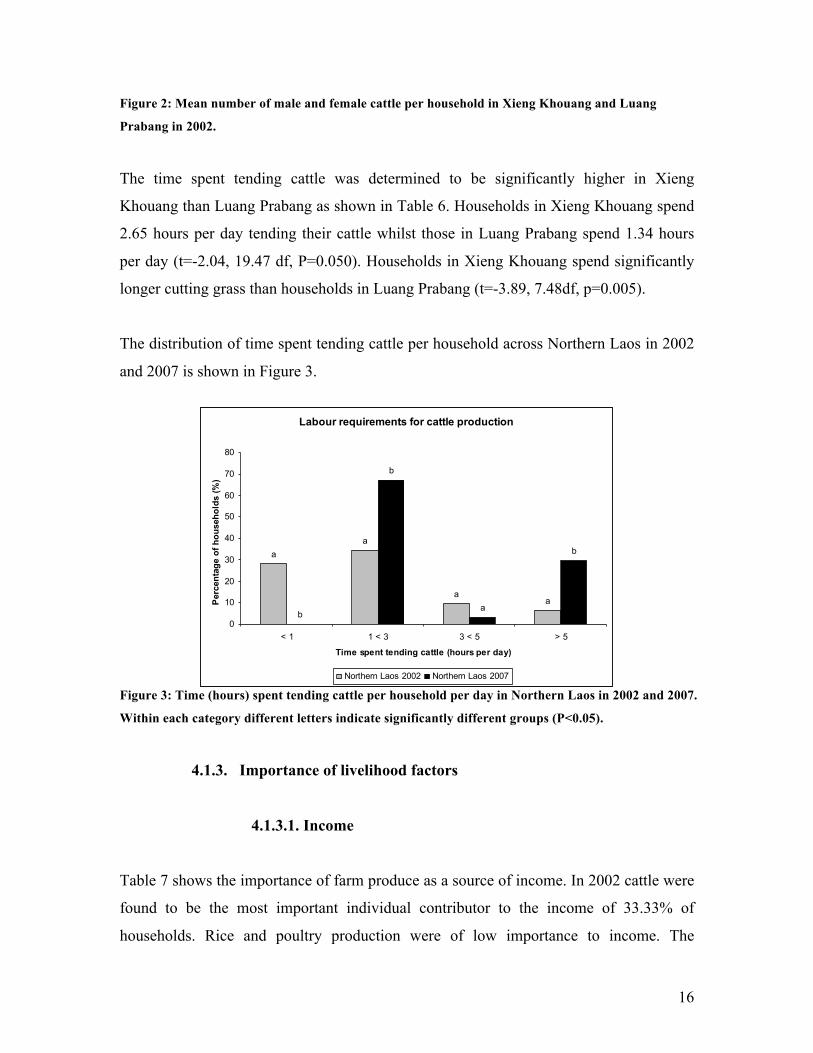
The time spent tending cattle was determined to be significantly higher in Xieng
Khouang than Luang Prabang as shown in Table 6. Households in Xieng Khouang spend
2.65 hours per day tending their cattle whilst those in Luang Prabang spend 1.34 hours
per day (t=-2.04, 19.47 df, P=0.050). Households in Xieng Khouang spend significantly
longer cutting grass than households in Luang Prabang (t=-3.89, 7.48df, p=0.005).
The distribution of time spent tending cattle per household across Northern Laos in 2002
and 2007 is shown in Figure 3.
Figure 3: Time (hours) spent tending cattle per household per day in Northern Laos in 2002 and 2007. Within each category different letters indicate significantly different groups (P<0.05).
4.1.3. Importance of livelihood factors
4.1.3.1. Income
Table 7 shows the importance of farm produce as a source of income. In 2002 cattle were
found to be the most important individual contributor to the income of 33.33% of
households. Rice and poultry production were of low importance to income. The
17
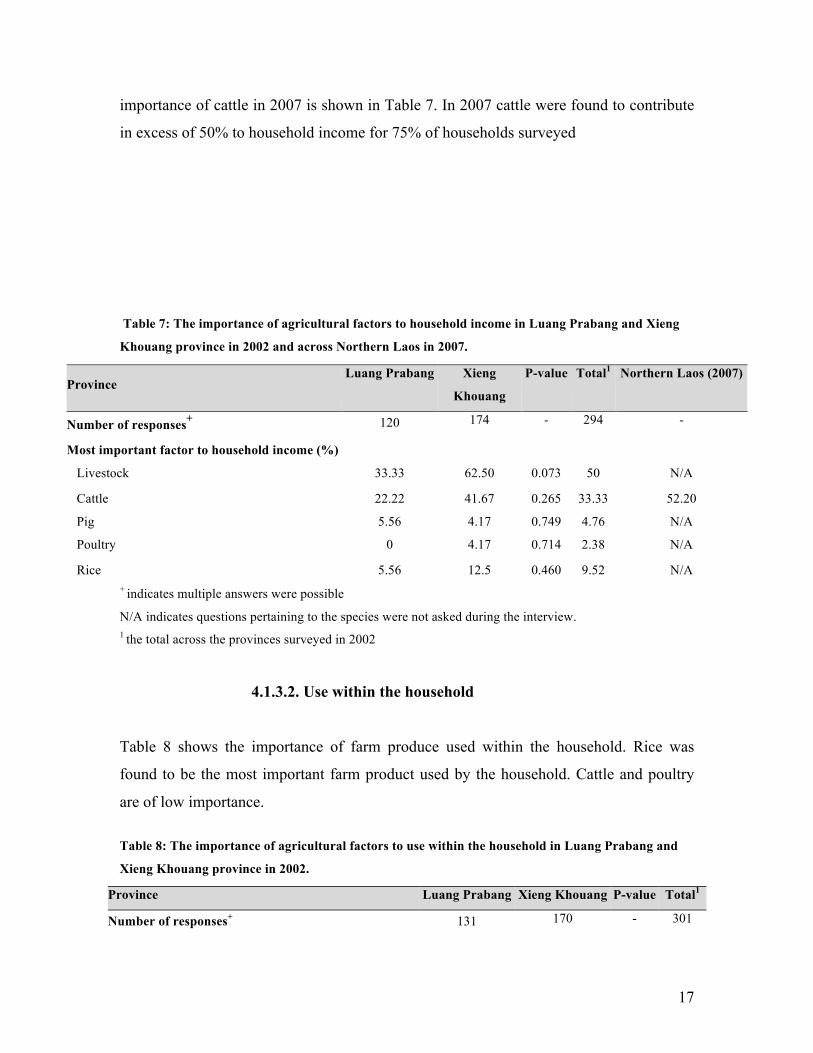
importance of cattle in 2007 is shown in Table 7. In 2007 cattle were found to contribute
in excess of 50% to household income for 75% of households surveyed
Table 7: The importance of agricultural factors to household income in Luang Prabang and Xieng
Khouang province in 2002 and across Northern Laos in 2007.
+ indicates multiple answers were possible
N/A indicates questions pertaining to the species were not asked during the interview. 1 the total across the provinces surveyed in 2002
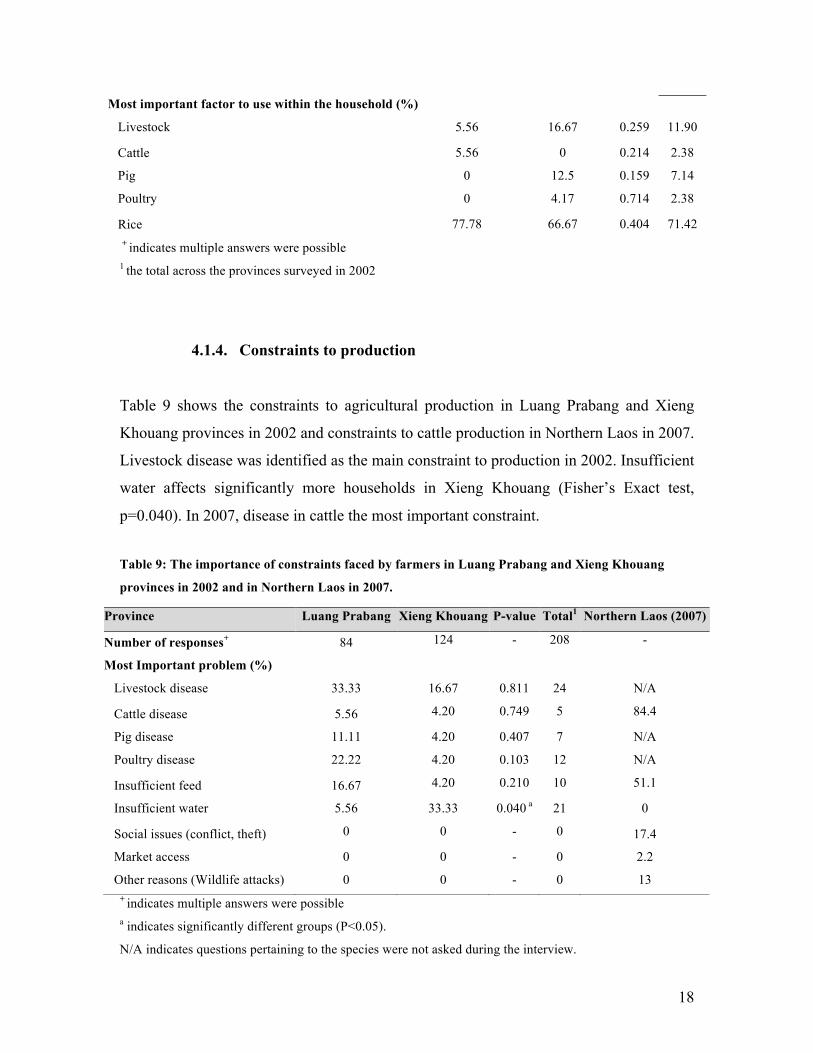
4.1.3.2. Use within the household
Table 8 shows the importance of farm produce used within the household. Rice was
found to be the most important farm product used by the household. Cattle and poultry
are of low importance.
Table 8: The importance of agricultural factors to use within the household in Luang Prabang and
Xieng Khouang province in 2002.
Province Luang Prabang Xieng
Khouang
P-value Total1 Northern Laos (2007)
Number of responses+ 120 174 - 294 -
Most important factor to household income (%)
Livestock 33.33 62.50 0.073 50 N/A
Cattle 22.22 41.67 0.265 33.33 52.20
Pig 5.56 4.17 0.749 4.76 N/A
Poultry 0 4.17 0.714 2.38 N/A
Rice 5.56 12.5 0.460 9.52 N/A
Province Luang Prabang Xieng Khouang P-value Total1
Number of responses+ 131 170 - 301
18
+ indicates multiple answers were possible 1 the total across the provinces surveyed in 2002
4.1.4. Constraints to production
Table 9 shows the constraints to agricultural production in Luang Prabang and Xieng
Khouang provinces in 2002 and constraints to cattle production in Northern Laos in 2007.
Livestock disease was identified as the main constraint to production in 2002. Insufficient
water affects significantly more households in Xieng Khouang (Fisher’s Exact test,
p=0.040). In 2007, disease in cattle the most important constraint.
Table 9: The importance of constraints faced by farmers in Luang Prabang and Xieng Khouang
provinces in 2002 and in Northern Laos in 2007.
+ indicates multiple answers were possible a indicates significantly different groups (P<0.05).
N/A indicates questions pertaining to the species were not asked during the interview.
Most important factor to use within the household (%)
Livestock 5.56 16.67 0.259 11.90
Cattle 5.56 0 0.214 2.38
Pig 0 12.5 0.159 7.14
Poultry 0 4.17 0.714 2.38
Rice 77.78 66.67 0.404 71.42
Province Luang Prabang Xieng Khouang P-value Total1 Northern Laos (2007)
Number of responses+ 84 124 - 208 -
Most Important problem (%)
Livestock disease 33.33 16.67 0.811 24 N/A
Cattle disease 5.56 4.20 0.749 5 84.4
Pig disease 11.11 4.20 0.407 7 N/A
Poultry disease 22.22 4.20 0.103 12 N/A
Insufficient feed 16.67 4.20 0.210 10 51.1
Insufficient water 5.56 33.33 0.040 a 21 0
Social issues (conflict, theft) 0 0 - 0 17.4
Market access 0 0 - 0 2.2
Other reasons (Wildlife attacks) 0 0 - 0 13
19
1 the total across the provinces surveyed in 2002
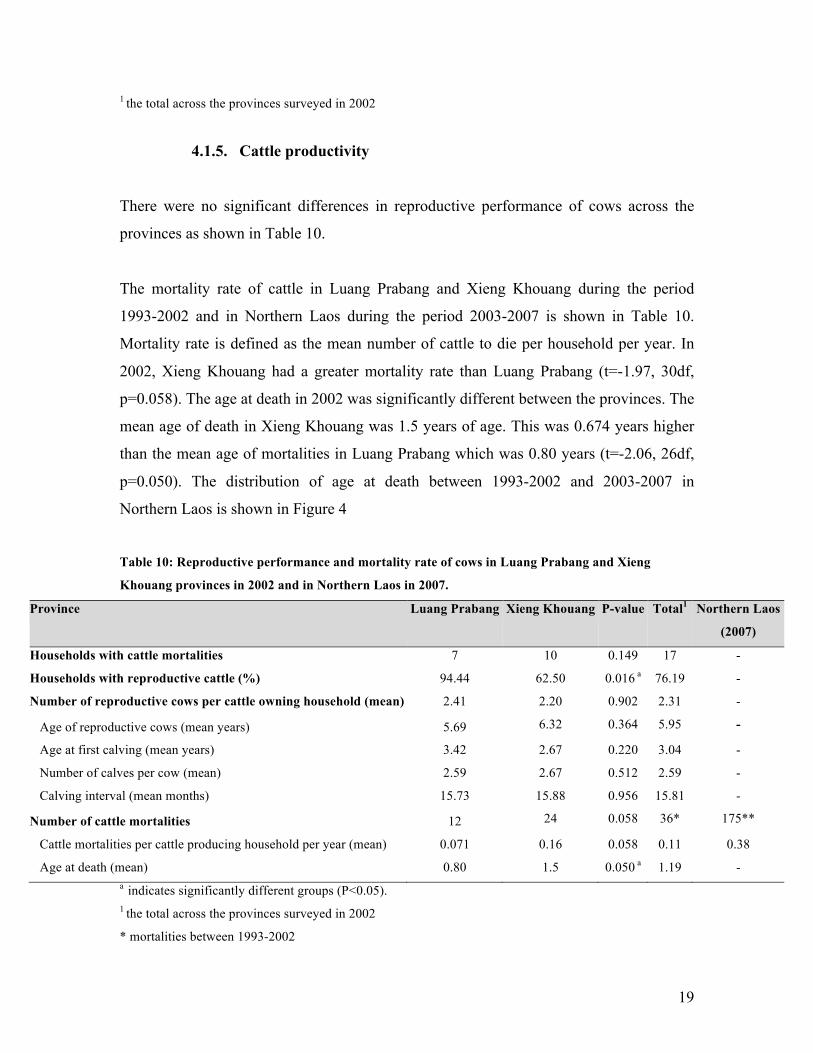
4.1.5. Cattle productivity
There were no significant differences in reproductive performance of cows across the
provinces as shown in Table 10.
The mortality rate of cattle in Luang Prabang and Xieng Khouang during the period
1993-2002 and in Northern Laos during the period 2003-2007 is shown in Table 10.
Mortality rate is defined as the mean number of cattle to die per household per year. In
2002, Xieng Khouang had a greater mortality rate than Luang Prabang (t=-1.97, 30df,
p=0.058). The age at death in 2002 was significantly different between the provinces. The
mean age of death in Xieng Khouang was 1.5 years of age. This was 0.674 years higher
than the mean age of mortalities in Luang Prabang which was 0.80 years (t=-2.06, 26df,
p=0.050). The distribution of age at death between 1993-2002 and 2003-2007 in
Northern Laos is shown in Figure 4
Table 10: Reproductive performance and mortality rate of cows in Luang Prabang and Xieng
Khouang provinces in 2002 and in Northern Laos in 2007.
Province Luang Prabang Xieng Khouang P-value Total1 Northern Laos
(2007)
Households with cattle mortalities 7 10 0.149 17 -
Households with reproductive cattle (%) 94.44 62.50 0.016 a 76.19 -
Number of reproductive cows per cattle owning household (mean) 2.41 2.20 0.902 2.31 -
Age of reproductive cows (mean years) 5.69 6.32 0.364 5.95 -
Age at first calving (mean years) 3.42 2.67 0.220 3.04 -
Number of calves per cow (mean) 2.59 2.67 0.512 2.59 -
Calving interval (mean months) 15.73 15.88 0.956 15.81 -
Number of cattle mortalities 12 24 0.058 36* 175**
Cattle mortalities per cattle producing household per year (mean) 0.071 0.16 0.058 0.11 0.38
Age at death (mean) 0.80 1.5 0.050 a 1.19 - a indicates significantly different groups (P<0.05). 1 the total across the provinces surveyed in 2002
* mortalities between 1993-2002

20
The distibution of cattle mortalities in Northern Laos based on age
a
a
a
a
aa
0
10
20
30
40
50
60
< 1 1 < 5 > 5
Age of the animal at death (years)
Perc
enta
ge o
f cat
tle m
orta
litie
s (%
)
1993-2002 2003-2007
** mortalities between 2003-2007.
.
Figure 4: Distribution of cattle mortalities based on age between 1993-2002 and 2003-2007 across
Northern Laos. Within each category different letters indicate significantly different groups (P<0.05).
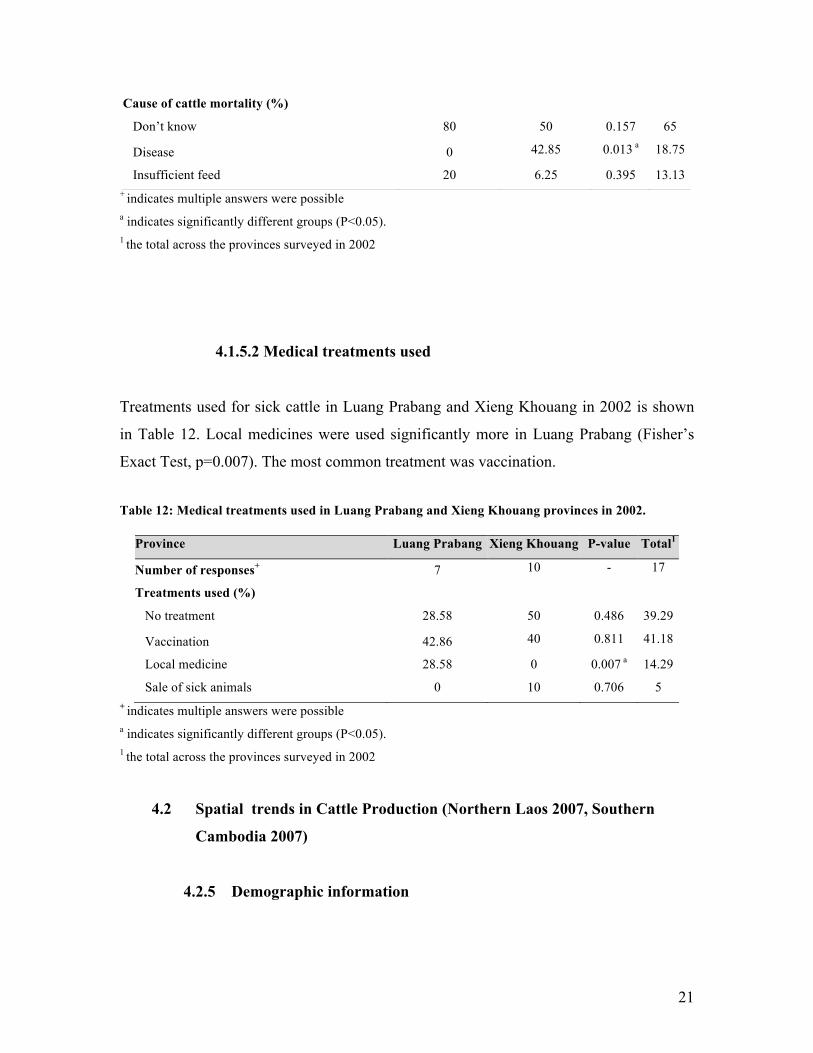
4.1.5.1 Cause of Mortalities
The cause of mortalities in Luang Prabang and Xieng Khouang provinces in 2002 is
shown in Table 11. Disease affected significantly more households in Xieng Khouang
than in Luang Prabang (Fisher’s Exact test, p=0.013).
Table 11: Causes of cattle mortalities in Luang Prabang and Xieng Khouang provinces in 2002.
Province Luang Prabang Xieng Khouang P-value Total1
Number of responses+ 10 14 - 24
21
+ indicates multiple answers were possible a indicates significantly different groups (P<0.05). 1 the total across the provinces surveyed in 2002
4.1.5.2 Medical treatments used
Treatments used for sick cattle in Luang Prabang and Xieng Khouang in 2002 is shown
in Table 12. Local medicines were used significantly more in Luang Prabang (Fisher’s
Exact Test, p=0.007). The most common treatment was vaccination.
Table 12: Medical treatments used in Luang Prabang and Xieng Khouang provinces in 2002.
+ indicates multiple answers were possible a indicates significantly different groups (P<0.05). 1 the total across the provinces surveyed in 2002
4.2 Spatial trends in Cattle Production (Northern Laos 2007, Southern
Cambodia 2007)
4.2.5 Demographic information
Cause of cattle mortality (%)
Don’t know 80 50 0.157 65
Disease 0 42.85 0.013 a 18.75
Insufficient feed 20 6.25 0.395 13.13
Province Luang Prabang Xieng Khouang P-value Total1
Number of responses+ 7 10 - 17
Treatments used (%)
No treatment 28.58 50 0.486 39.29
Vaccination 42.86 40 0.811 41.18
Local medicine 28.58 0 0.007 a 14.29
Sale of sick animals 0 10 0.706 5
22
In 2007 a total of 90 households across the Southern Cambodian provinces of Takeo,
Kampong Cham and Kandal were interviewed. In Northern Laos, 92 households were
interviewed across the provinces of Xieng Khouang, Luang Prabang, and Houaphanh.
The number of individuals interviewed and the mean number of residents per household
is shown in Table 13.
Table 13: The composition of households interviewed in the provinces Kampong Cham, Kandal and
Takeo and in Northern Laos in 2007.
1 the total across the provinces surveyed in 2007
4.2.6 Production statistics
The mean land area utilized for agricultural production by farmers in Kampong Cham,
Kandal and Takeo provinces in 2007 is shown in Table 14. The distribution of land
amongst farmers in Northern Laos in 2007 can be seen in Figure 1. The number of cattle
per household in Kampong Cham, Kandal and Takeo provinces is shown in Table 14.
The time spent tending cattle in Kampong Cham, Kandal and Takeo in 2007 is shown in
Table 14. The distribution of time spent tending cattle amongst farmers in Northern Laos
in 2007 is shown in Figure 3
Table 14: The area of land utilized for agricultural production, the number of cattle, and the time
spent tending cattle in the provinces Kampong Cham, Kandal and Takeo in 2007.
Province Kampong Cham Kandal Takeo Total1 Northern Laos (2007)
Households interviewed (n) 30 30 30 90 92
Total Number of individuals interviewed - - - - 136
Males - - - - 72
Females - - - - 64
Mean number of residents per household 5.87 5.67 5.9 5.81 -
Province Kampong Cham Kandal Takeo Total1
Area utilized for agricultural production (Mean hectares) 1.62 1.29 1.22 1.38
Total Number of cattle 200 155 105 460
Number of cattle per household (mean) 6.67 5.17 3.5 5.11
23
1 the total across the provinces surveyed in 2007
4.2.7 Importance of cattle
In Southern Cambodia cattle were the most popular animal for 95.55% of households.
The importance of cattle to households in Northern Laos in 2007 is shown in Table 7.
The use of cattle in Southern Cambodia and Northern Laos in 2007 is shown in Table 15.
Table 15: Use of cattle in Southern Cambodia and Northern Laos in 2007.
4.2.8 Constraints to production
Table 16 shows the current constraints to cattle production in Kampong Cham, Takeo and
Kandal provinces and in Northern Laos in 2007. The constraints to production differ
significantly between Southern Cambodian provinces. Households in Takeo were more
significantly affected by insufficient feed than households in Kandal (Pearson’s Chi-
square=9.60, 1df, p=0.002). Disease was the most important constraint in Southern
Cambodia and Northern Laos.
Time spent tending cattle (mean hours/day) 4.18 4 4.23 4.14
Province Southern Cambodia
(2007)
Northern Laos
(2007)
Use of cattle (% of households)
Sale 76.66 96.70
Work 86.66 13.00
Breeding 76.66 0
Manure 100 0
Family asset 100 0
24
Distribution of the age at first calving in Southern Cambodia
0
10
20
30
40
50
60
70
80
90
24 30 36
Months
Perc
enta
ge o
f cow
s to
cal
ve (%
)
Kampong Cham Kandal Takeo Total
Table 16: The importance of problems faced by farmers in Kampong Cham, Kandal and Takeo
provinces and in Northern Laos in 2007.
Values with different superscripts (a,b ) indicates significantly different groups (P<0.05). 1 the total across the provinces surveyed in 2007.
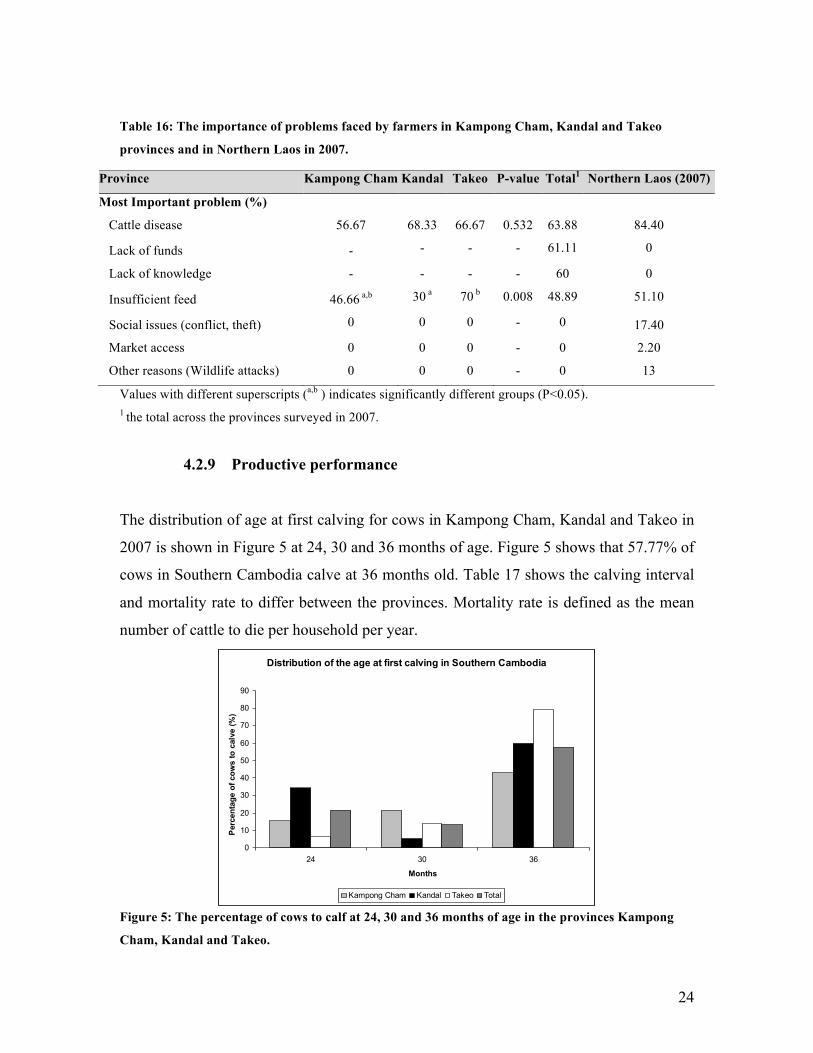
4.2.9 Productive performance
The distribution of age at first calving for cows in Kampong Cham, Kandal and Takeo in
2007 is shown in Figure 5 at 24, 30 and 36 months of age. Figure 5 shows that 57.77% of
cows in Southern Cambodia calve at 36 months old. Table 17 shows the calving interval
and mortality rate to differ between the provinces. Mortality rate is defined as the mean
number of cattle to die per household per year.
Figure 5: The percentage of cows to calf at 24, 30 and 36 months of age in the provinces Kampong
Cham, Kandal and Takeo.
Province Kampong Cham Kandal Takeo P-value Total1 Northern Laos (2007)
Most Important problem (%)
Cattle disease 56.67 68.33 66.67 0.532 63.88 84.40
Lack of funds - - - - 61.11 0
Lack of knowledge - - - - 60 0
Insufficient feed 46.66 a,b 30 a 70 b 0.008 48.89 51.10
Social issues (conflict, theft) 0 0 0 - 0 17.40
Market access 0 0 0 - 0 2.20
Other reasons (Wildlife attacks) 0 0 0 - 0 13
25
Table 17: Calving interval and mortality rate of cattle in Kampong Cham, Kandal and Takeo
provinces and in Northern Laos in 2007.
1 the total across the provinces surveyed in 2007
** mortalities between 2003-2007
5. Discussion
The results provide an overview of the cattle production systems of Northern Laos and
Southern Cambodia. The 2002 survey in Northern Laos identified smallholder producers
utilize a land area of 5.27 hectares. The area of land used for production was higher than
expected as the national average area of land used by farmers was 1.57 hectares in an
Agricultural census carried out in 1998/1999 (SCAC, 2000). Due to the short time frame
since the census, it is unlikely that the land area used by farmers has increased. Thus, this
variation in land size is a function of the villages and/or districts interviewed during this
investigation. Though significant differences in land area between provinces could not be
identified, Darr and Uibrig (2004) were able to show that land area utilized by farmers in
Northern Laos differed at both a village and district level. Detecting such effects was
beyond this investigation as the sample size was too small to warrant analysis at a village
(n=6) or district (n=12) level (Thrusfield, 1995). Therefore, 5.27 hectares is an accurate
estimate of the average land area used by farmers in Xieng Khouang and Luang Prabang
province. This figure is further supported by the 2007 results. Differences in reporting
style prevent an average estimate being obtained. However, the distribution of land
amongst farmers is similar between the years, indicated by minimal significant
differences being detected.
The herd structure and age distribution was found to be very similar across the Northern
Lao provinces in 2002. Significantly greater numbers of female cattle were identified.
Province Kampong Cham Kandal Takeo Total1 Northern Laos (2007)
Calving interval (mean months) 21.6 20.8 23.2 21.87 -
Number of cattle mortalities 24 21 36 81 175
Cattle mortalities per household per year (mean) 0.8 0.7 1.2 0.9** 0.38**
26
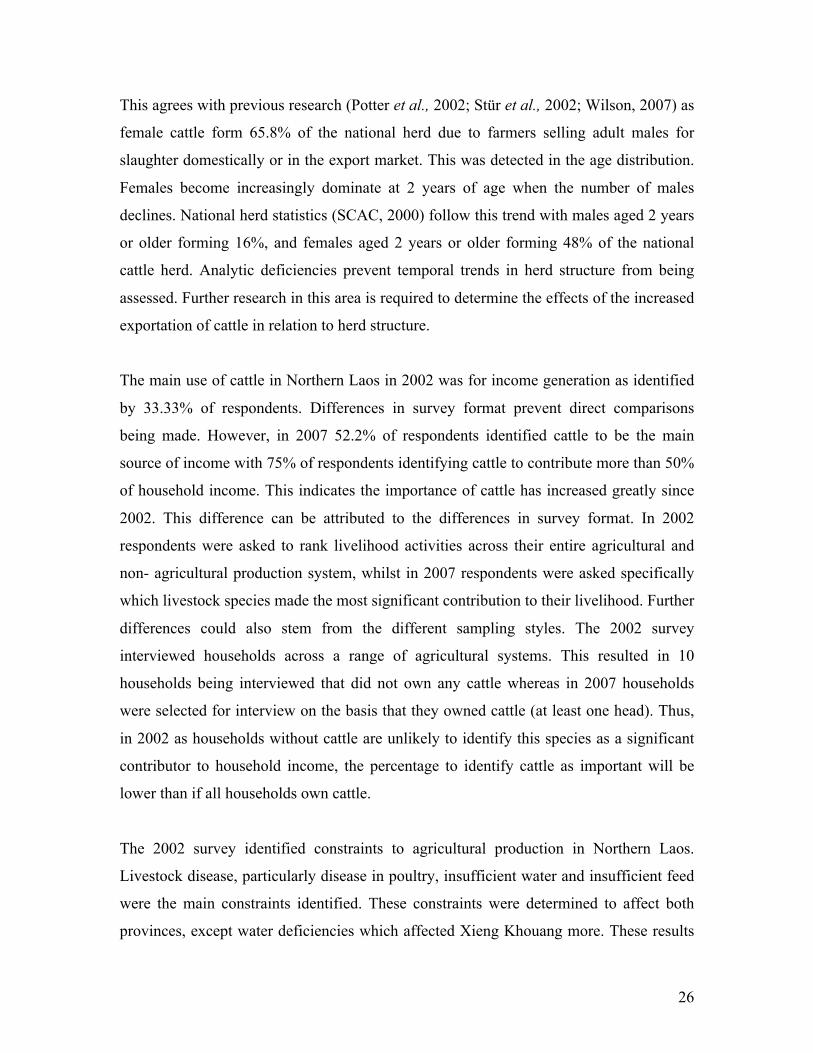
This agrees with previous research (Potter et al., 2002; Stür et al., 2002; Wilson, 2007) as
female cattle form 65.8% of the national herd due to farmers selling adult males for
slaughter domestically or in the export market. This was detected in the age distribution.
Females become increasingly dominate at 2 years of age when the number of males
declines. National herd statistics (SCAC, 2000) follow this trend with males aged 2 years
or older forming 16%, and females aged 2 years or older forming 48% of the national
cattle herd. Analytic deficiencies prevent temporal trends in herd structure from being
assessed. Further research in this area is required to determine the effects of the increased
exportation of cattle in relation to herd structure.
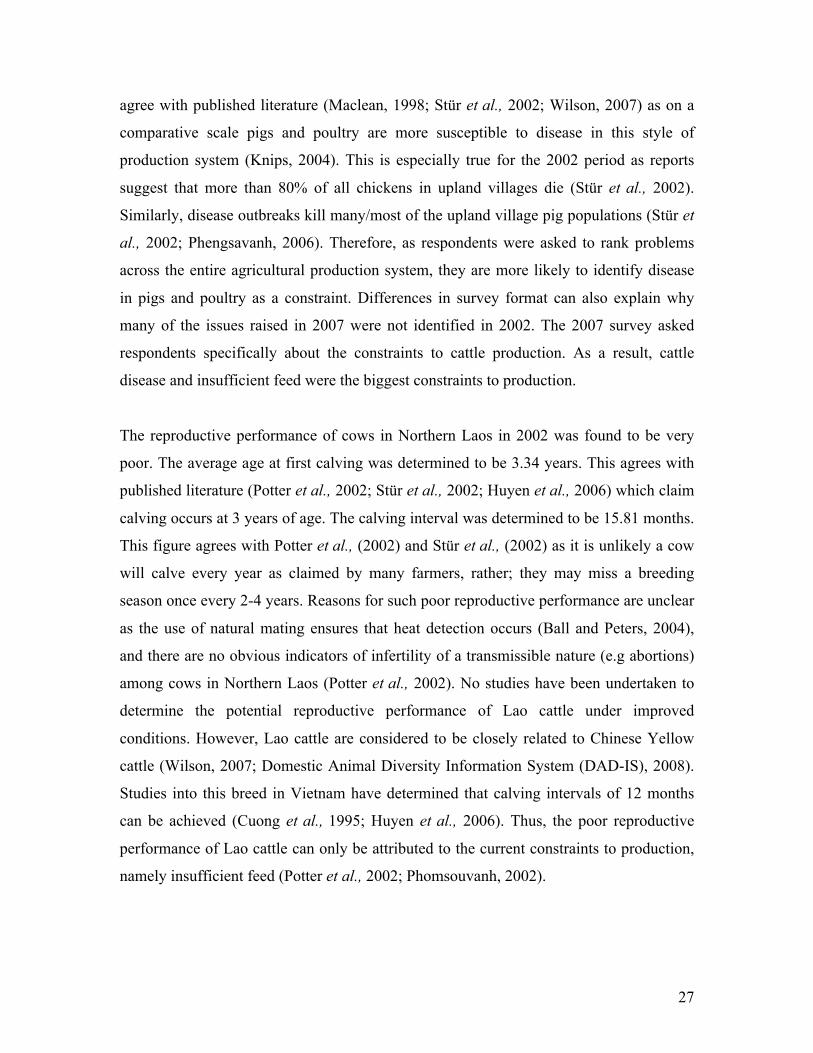
The main use of cattle in Northern Laos in 2002 was for income generation as identified
by 33.33% of respondents. Differences in survey format prevent direct comparisons
being made. However, in 2007 52.2% of respondents identified cattle to be the main
source of income with 75% of respondents identifying cattle to contribute more than 50%
of household income. This indicates the importance of cattle has increased greatly since
2002. This difference can be attributed to the differences in survey format. In 2002
respondents were asked to rank livelihood activities across their entire agricultural and
non- agricultural production system, whilst in 2007 respondents were asked specifically
which livestock species made the most significant contribution to their livelihood. Further
differences could also stem from the different sampling styles. The 2002 survey
interviewed households across a range of agricultural systems. This resulted in 10
households being interviewed that did not own any cattle whereas in 2007 households
were selected for interview on the basis that they owned cattle (at least one head). Thus,
in 2002 as households without cattle are unlikely to identify this species as a significant
contributor to household income, the percentage to identify cattle as important will be
lower than if all households own cattle.
The 2002 survey identified constraints to agricultural production in Northern Laos.
Livestock disease, particularly disease in poultry, insufficient water and insufficient feed
were the main constraints identified. These constraints were determined to affect both
provinces, except water deficiencies which affected Xieng Khouang more. These results
27
agree with published literature (Maclean, 1998; Stür et al., 2002; Wilson, 2007) as on a
comparative scale pigs and poultry are more susceptible to disease in this style of
production system (Knips, 2004). This is especially true for the 2002 period as reports
suggest that more than 80% of all chickens in upland villages die (Stür et al., 2002).
Similarly, disease outbreaks kill many/most of the upland village pig populations (Stür et
al., 2002; Phengsavanh, 2006). Therefore, as respondents were asked to rank problems
across the entire agricultural production system, they are more likely to identify disease
in pigs and poultry as a constraint. Differences in survey format can also explain why
many of the issues raised in 2007 were not identified in 2002. The 2007 survey asked
respondents specifically about the constraints to cattle production. As a result, cattle
disease and insufficient feed were the biggest constraints to production.
The reproductive performance of cows in Northern Laos in 2002 was found to be very
poor. The average age at first calving was determined to be 3.34 years. This agrees with
published literature (Potter et al., 2002; Stür et al., 2002; Huyen et al., 2006) which claim
calving occurs at 3 years of age. The calving interval was determined to be 15.81 months.
This figure agrees with Potter et al., (2002) and Stür et al., (2002) as it is unlikely a cow
will calve every year as claimed by many farmers, rather; they may miss a breeding
season once every 2-4 years. Reasons for such poor reproductive performance are unclear
as the use of natural mating ensures that heat detection occurs (Ball and Peters, 2004),
and there are no obvious indicators of infertility of a transmissible nature (e.g abortions)
among cows in Northern Laos (Potter et al., 2002). No studies have been undertaken to
determine the potential reproductive performance of Lao cattle under improved
conditions. However, Lao cattle are considered to be closely related to Chinese Yellow
cattle (Wilson, 2007; Domestic Animal Diversity Information System (DAD-IS), 2008).
Studies into this breed in Vietnam have determined that calving intervals of 12 months
can be achieved (Cuong et al., 1995; Huyen et al., 2006). Thus, the poor reproductive
performance of Lao cattle can only be attributed to the current constraints to production,
namely insufficient feed (Potter et al., 2002; Phomsouvanh, 2002).
28
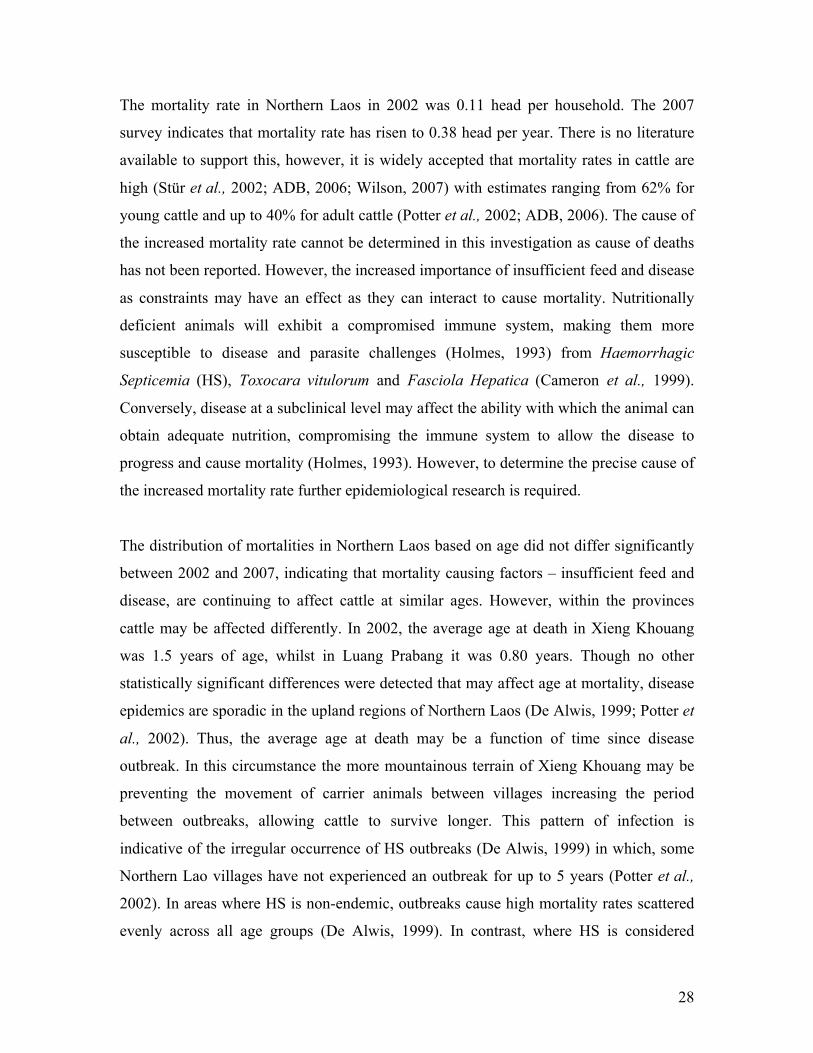
The mortality rate in Northern Laos in 2002 was 0.11 head per household. The 2007
survey indicates that mortality rate has risen to 0.38 head per year. There is no literature
available to support this, however, it is widely accepted that mortality rates in cattle are
high (Stür et al., 2002; ADB, 2006; Wilson, 2007) with estimates ranging from 62% for
young cattle and up to 40% for adult cattle (Potter et al., 2002; ADB, 2006). The cause of
the increased mortality rate cannot be determined in this investigation as cause of deaths
has not been reported. However, the increased importance of insufficient feed and disease
as constraints may have an effect as they can interact to cause mortality. Nutritionally
deficient animals will exhibit a compromised immune system, making them more
susceptible to disease and parasite challenges (Holmes, 1993) from Haemorrhagic
Septicemia (HS), Toxocara vitulorum and Fasciola Hepatica (Cameron et al., 1999).
Conversely, disease at a subclinical level may affect the ability with which the animal can
obtain adequate nutrition, compromising the immune system to allow the disease to
progress and cause mortality (Holmes, 1993). However, to determine the precise cause of
the increased mortality rate further epidemiological research is required.
The distribution of mortalities in Northern Laos based on age did not differ significantly
between 2002 and 2007, indicating that mortality causing factors – insufficient feed and
disease, are continuing to affect cattle at similar ages. However, within the provinces
cattle may be affected differently. In 2002, the average age at death in Xieng Khouang
was 1.5 years of age, whilst in Luang Prabang it was 0.80 years. Though no other
statistically significant differences were detected that may affect age at mortality, disease
epidemics are sporadic in the upland regions of Northern Laos (De Alwis, 1999; Potter et
al., 2002). Thus, the average age at death may be a function of time since disease
outbreak. In this circumstance the more mountainous terrain of Xieng Khouang may be
preventing the movement of carrier animals between villages increasing the period
between outbreaks, allowing cattle to survive longer. This pattern of infection is
indicative of the irregular occurrence of HS outbreaks (De Alwis, 1999) in which, some
Northern Lao villages have not experienced an outbreak for up to 5 years (Potter et al.,
2002). In areas where HS is non-endemic, outbreaks cause high mortality rates scattered
evenly across all age groups (De Alwis, 1999). In contrast, where HS is considered
29
endemic, regular seasonal outbreaks cause limited mortalities within cattle aged 6-12
months (De Alwis, 1999). Therefore, HS in Luang Prabang may have become endemic as
the mortality rate and age of death is lower. However, further epidemiological research is
required to confirm this.
The cause of mortalities in 2002 was poorly understood across the provinces with 65% of
households not knowing why their cattle died. This indicates a significant gap in
knowledge exists in disease diagnosis. However, farmers in Xieng Khouang do
demonstrate some health knowledge claiming disease to be the cause of death in 42.85%
of mortalities. Health knowledge is limited to disease diagnosis as 50% of respondents in
Xieng Khouang claimed that there was no treatment available to prevent the mortalities.
This indicates issues of availability or knowledge of treatment techniques may be present.
The most common treatment for sick animals was vaccination for 41.18% of households.
This rate of vaccination is higher than the national average vaccination rate in 1998/1999
of 32.7% (SCAC, 2000). However, very few respondents (n=17) provided information
about medical treatments, making this result unreliable (Thrusfield, 1995). Furthermore,
respondents identified vaccination as a treatment, indicative of a lack of understanding as
to the role of vaccination in disease prevention.
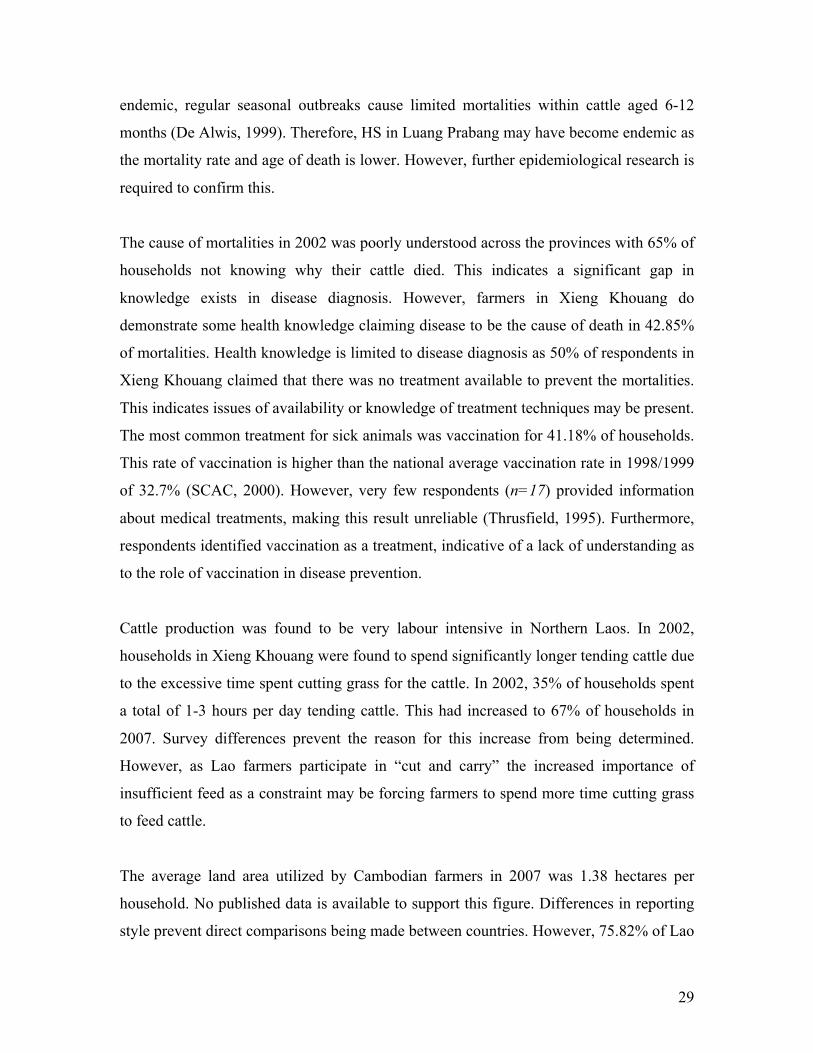
Cattle production was found to be very labour intensive in Northern Laos. In 2002,
households in Xieng Khouang were found to spend significantly longer tending cattle due
to the excessive time spent cutting grass for the cattle. In 2002, 35% of households spent
a total of 1-3 hours per day tending cattle. This had increased to 67% of households in
2007. Survey differences prevent the reason for this increase from being determined.
However, as Lao farmers participate in “cut and carry” the increased importance of
insufficient feed as a constraint may be forcing farmers to spend more time cutting grass
to feed cattle.
The average land area utilized by Cambodian farmers in 2007 was 1.38 hectares per
household. No published data is available to support this figure. Differences in reporting
style prevent direct comparisons being made between countries. However, 75.82% of Lao
30
farmers surveyed utilized a land area of less than 2 hectares. Thus, the majority of
farmers in both countries utilize land areas of less than 2 hectares.
Cattle were found to be very important to households in Southern Cambodia. Cattle were
deemed to be the favourite animal for 95.55% of households. There is a large difference
in results between Laos and Cambodia, as 52.2% of Lao households rated cattle to be
very important. Reasons for this difference are unclear due to the limited information
provided. However, the differing uses of cattle between countries may be influential. In
Cambodia, cattle are used for; work, sale, breeding, manure and act as a family asset.
This increases the importance of cattle beyond a source of income as observed in
Northern Laos.
The constraints to production in Southern Cambodia were disease, lack of funds, lack of
knowledge and insufficient feed. The constraints were very similar to those identified in
Northern Laos. In both countries insufficient feed and disease where rated highly, with
disease affecting more households in Laos. Reasons for this difference are unclear.
However, this may be indicative of an inability of Cambodian Farmers to diagnose
disease especially as the Cambodian mortality rate was higher at 0.9 cattle per year.
Insufficient feed as a constraint was found to be significantly different between the
Southern Cambodian provinces Takeo and Kandal. The rainfall, temperature, population
density, percentage of farmers and area of land utilized for production are similar
between these provinces as shown in Appendix 3 (Ministry of Agriculture Forestry and
Fisheries (MAFF), 2007). Thus, the increased importance of insufficient feed as a
constraint in Takeo must be a function of breed which differs between the provinces.
Takeo is predominantly a rice producing area that prefers Hariana cattle as a source draft
power. This breed is larger than the local Khmer cattle and posses higher maintenance
energy requirements (Maclean, 1998). Therefore, when feed availability declines, the
Hariana cattle are more adversely affected and insufficient feed becomes an increasingly
important constraint. This is reflected in the lower stocking density, longer calving
interval, higher mortality rate and increased labour requirements of production observed
31
in Takeo province. Alternatively, the proximity of Kandal to Phnom Penh has led to
increasing use of land for vegetable growing, including maize and other groups that can
also be provided as feed for cattle.
The reproductive performance of Cambodian cattle was poor. The majority of cows were
determined to begin calving at 36 months of age with a highly variable calving interval
between provinces. Natural mating is primarily used in Cambodia to ensure oestrous is
detected and transmissible diseases of infertility have also never been recorded. Thus, the
variation in calving interval is due to the interaction of poor nutrition and breed effects.
As previously mentioned, Hariana cattle are more adversely affected by insufficient feed
than local Khmer cattle. The provinces with a lower proportion of Hariana cattle,
Kampong Cham and Kandal, rated insufficient feed as less of a constraint and
demonstrated shorter calving intervals at 21.6 and 20.8 months respectively. However, as
these provinces still have a significant proportion of Hariana cattle the average calving
interval is inflated beyond the 18 months determined by Maclean (1998). Breed studies in
India suggest that the reason for the inflated value is insufficient feed rather than breed
deficiencies as Hariana cattle placed on a high plane of nutrition can achieve calving
intervals of 15.6 months (Singh, 2002). This indicates that the cattle present in Cambodia
are currently performing below their genetic potential due the constraint insufficient feed.
The mortality rate in Southern Cambodia differed across the provinces surveyed. The
mortality rate in Takeo was the highest at 1.2 head per household, then Kampong Cham
at 0.8 and Kandal at 0.7. Reasons for this variation in mortality rate between provinces
cannot be determined as cause of death has not been reported. However, the provinces
that rated insufficient feed more highly due to the higher numbers of Hariana cattle also
demonstrate the highest mortality rate. There is currently no published literature to
support this figure although as in Laos, mortality rates are expected to be high due to the
interaction of disease and insufficient feed as constraints. To determine the precise cause
of this variation in mortality rate, further research is required to identify the mortality
causing pathogens present in Cambodia.
32
Labour required for cattle production in Southern Cambodia was 4.14 hours per day. As
with calving interval and mortality rate the differences in time spent tending cattle was
related to the identification of insufficient feed as a constraint. The higher percentage of
households to identify nutrition as a constraint, the greater the time spent tending cattle.
The time allocation of particular activities cannot be determined from this investigation.
However, as Cambodian farmers practice “cut and carry”, if feed availability is low, more
time will be required to find suitable grass and bring it back to the cattle. Direct
comparisons cannot be made to Northern Laos due to differing reporting styles, however,
it appears that the time spent tending cattle in Southern Cambodia is greater as 67% of
households in Northern Laos spend less than 3 hours tending their cattle.
Overall, these surveys provide a good overview of smallholder cattle production in
Northern Lao and Southern Cambodia. However, the surveys were conducted by 3
separate research teams making interviewer bias likely. Interview bias occurs when the
interviewer’s voice creates bias by implying a desirable answer (Thrusfield, 1995). This
is of concern as surveys were conducted by the DAHP, Cambodia, and the DLF, Laos.
These staff members have a vested interest in survey findings and enough technical
knowledge to unintentionally bias results. Selection bias may have also occurred,
particularly in the 2007 surveys. Selection of households for interviews was carried out in
consultation with village leaders. This can create bias as the village leader may volunteer
households of a particular social class and skew results. As many of the Northern Lao
quantitative values determined in this investigation are similar to those identified in
previous investigations, the reliability of these results is high. Conversely, Cambodian
results deviate from published literature which may indicate unreliable results. However,
very little information is available on the Cambodian cattle production system. Thus, the
results may be accurate and reflect a changing production system. Further research will
determine the reliability of these results.
33
6. Conclusion
Cattle are very important to the majority of farming households in Northern Laos and
Southern Cambodia. Cattle were deemed to be more important to Cambodian producers
due to their increased versatility and ability to contribute in ways other than income
generation as observed in Laos. The main constraints to production – insufficient feed
and disease did not vary on a temporal or spatial scale. However, Cambodian producers
were more negatively affected by constraints, displaying longer calving intervals, higher
mortality rates, and increased labour intensity of production. The increased susceptibility
of Cambodian households to the constraints is due to breed deficiencies in the Hariana
cattle that dominate holdings, particularly in Takeo. Such results indicate that the
potential for improvements in cattle production are substantial across both Laos and
Cambodia. However, for Cambodian producers to profitably engage in the developing
South East Asian livestock sector, they will face trade-offs between their desire to
maintain the versatile but poorly adapted Hariana cattle and their desire to improve
household income from beef production as these objectives are mutually exclusive.
7. Acknowledgements
I would like to thank the Australian Centre for International Agricultural Research for
funding the project, Peter Windsor and Luzia Rast for all their support as supervisors,
Navneet Dhand for his statistical expertise, Werner Sturr, Joanne Millar, Sotheun Soun
and Syseng Khounsey for contribution of data.
8. References Asian Development Bank (ADB) (2006). Proposal Loan and Asian Development Fund
Grant Lao People’s Democratic Republic: Northern Region Sustainable livelihoods
through livestock development project. Report and recommendations of the president to
the Board of Directors.
34
Ball, P.H. and Peters, A.R. (2004). Reproduction in Cattle. Cornwall: Blackwell
Publishing
Cameron, A.R., Baldock, C. and Chamnanpood, P. (1999). Epidemiology and Dynamics
of Major Livestock diseases in South East Asia. In: Sharma, P and Baldock, C (ed.).
Understanding Animal Health in South East Asia. Canberra: Australian Centre for
International Agricultural Research
Cuong, V.C., Ly, L.V., Noi, V.V., and Petheram (1995). A profile of a Cattle Rearing
Domain in the Red River Delta, ACIAR proceedings No. 68. Canberra: Australian Centre
for International Agricultural Research.
Domestic Animal Diversity Information System (DAD-IS) (2008). Breed Information
[Online]. Retrieved from: http://www.fao.org/dadis/. Food and Agriculture Organization
of the United Nations, Rome. Date retrieved: 5th of May, 2008
Darr, D. and Uibrig, M. (2004). Farm forestry to alleviate poverty? Findings form 3
differently developed rural economies in Central Laos. Conference on International
Agricultural Research for development. Berlin: Institute of International Forestry and
Forest products.
De Alwis, M. L (1999). Haemorrhagic Septicaemia, ACIAR Monograph Series No. 57.
Canberra: Australian Centre for International Agricultural Research.
FAO (2005a). Livestock sector brief: Laos, People’s Democratic Republic. Rome: Food
and Agricultural Organization of the United Nations.
Holmes, P.H. (1993). Interactions between Parasites and Animal Nutrition: the
Veterinary consequences. Proceedings of the Nutrition Society 52, 113-120.
35
Huyen, L.T., Lemke, U., and Zarate, A.V. (2006). Ruminant breeds and Production
systems in North Vietnam and their contribution to smallholder households in
mountainous areas. Stuttgard: University of Hohenheim.
International Fund for Agricultural Development (IFAD) (2007). Rural Poverty Portal
[Online]. Retrieved from: http://www.ruralpovertyportal.org/english/regions/asia/. Date
retrieved: 5th of May, 2008.
Knips, V. (2004). Review of the livestock sector in the Mekong countries: Livestock
sector report. Rome: Food and Agricultural Organization of the United Nations.
Livestock in Development (LiD). Livestock in Poverty-Focused Development.
Crewkerne:Livestock in Development
Maclean, M. (1998). Livestock in Cambodian Rice Farming Systems. Cambodia:
Cambodia-IRRI-Australia Project.
Millar, J. and Photakoun, V. (2008). Livestock development and poverty alleviation:
Revolution or evolution for upland livelihoods in Lao PDR? International Journal of
Agricultural Sustainability, 6, 89-102.
Ministry of Agriculture Forestry and Fisheries (MAFF) (2007). Provinical Statistics
[Online]. Retrieved from: http://www.maff.gov.kh/en/provinces/takeo.html. Ministry of
Agriculture, Forestry and Fisheries, Cambodia. Date retrieved: 26th of October, 2008
Phengsavanh, P. (2006). Smallholder pig systems in Luang Prabang and Xieng Khouang
Provinces: current feed situation and potential of forage legumes for improving pig
productivity. In: J.V. Conlan, S.D. Blacksell, C.J. Morrissy and A. Colling (ed.), ACIAR
proceedings No. 128. Canberra: Australian Centre for International Agricultural Research
36
Phomosouvanh, A (2002). Country Report: Lao PDR. In: J. Allen and A. Na-Chiangmai
(ed.), Proceedings of an International workshop held in Khon Kaen Province Thailand.
Canberra: Australian Centre for International Agricultural Research.
Potter, E., Singpheng, S. and Bounmixa, T. (2002). Shifting Cultivation Stabilization
Pilot project: Baseline Animal Health Survey. The Provincial Government of Houaphanh.
Quirke, D., Harding, M., Vincent, D., and Garrett, D. (2003) Effects of globalization and
economic development on the Asian livestock sector. ACIAR Monograph Series 97e.
Canberra: Australian Center for International Agricultural Research.
SCAC (2000). Lao Agricultural Census, 1998/99. Vientiane: Steering Committee for the
Agricultural Census Office.
Singh, K (2002). Beef production in India. In: J. Allen and A. Na-Chiangmai (ed.),
Proceedings of an International workshop held in Khon Kaen Province Thailand.
Canberra: Australian Centre for International Agricultural Research.
Stür, W., Gray, D., and Bastin, G. (2002). Review of the livestock sector in the Lao PDR.
Manila: International Livestock Research Institute (ILRI)
Suon, S. (2007). Technology implementation procedure, Fasciolosis of Cattle and
Buffaloes and its Control Measures. Cambodia: Ministry of Agriculture, Forestry and
Fisheries
Suon, S. (2008). Survey of Farmer Attitudes to large ruminant health and husbandry in
Cambodia. Cambodia: Ministry of Agriculture, Forestry and Fisheries
Thrusfield, M. (1995). Veterinary Epidemiology. Cambridge: Blackwell Science.
37
United Nations Development Program (UNDP) (2008). Human Development Reports-
Statistics of the Human Development report [Online]. Retrieved from:
http://hdr.undp.org/en/statistics/. Date Retrieved: 22nd April, 2008.
Wilson, R.T. (2007). Status and prospects for livestock production in the Lao People’s
Democratic Republic. Journal of Tropical Animal Health and Production, 39, 443-452.
Windsor, P., Soun, S. and Khounsey, S. (2008). Identifying research priorities for the
development for the beef industry in Cambodia and Lao PDR with special reference to
animal health interventions AH/2006/077. Canberra: Australian Centre for International
Agricultural Research.
38
9. Appendix
APPENDIX 1
FLSP Baseline Study The study collects information on household livelihood, land and labour resources, and problems and productivity of livestock by interviewing the male and female heads of the household together. A special aim of the study is to provide details on productivity of livestock important to the household and the labour needed to manage and feed these animals. It is important to capture actual information (such as productivity of individual animals), not general information which has already been collected in the participatory diagnosis. The emphasis is on the actual situation of the household interviewed. We need to conduct this interview in an informal way, just like a conversation. Ask open questions about the topic and follow this up with probing questions so you understand the answers. Once you understand the topic you will be able to fill in the information needed in the Tables. For example, ask ‘who lives in the household’ rather than ‘how many adults and children are in the household’. Avoid such direct questioning. The Tables are in a format which enables us to analyse the information. Main Interviewer: .......................................................................................................................... Translator: ..................................................................................................................................... Other Interviewers present: ........................................................................................................... Date: .............................................. Respondent Identification This information is needed to identify with whom we are interviewing and to link this with the FLSP database. Fill in the things you know already before you start the interview. Location (Village): ....................................................................................................................... Ethnic group: ................................................................................................................................
39
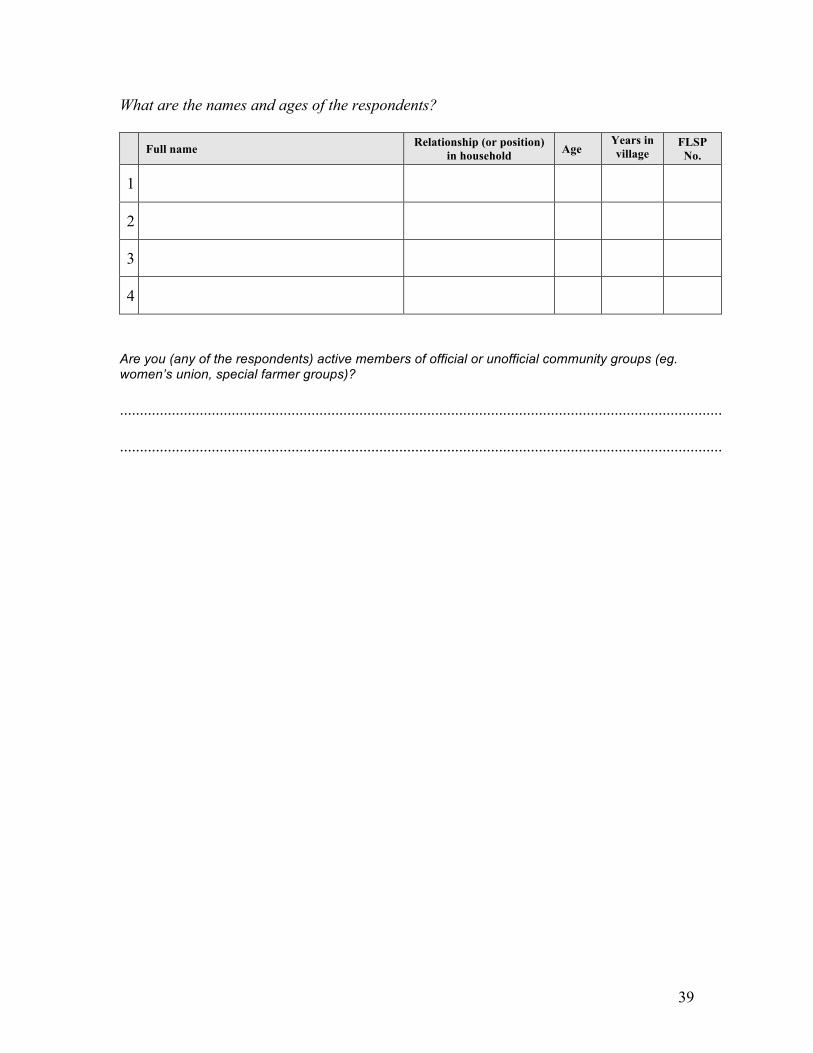
What are the names and ages of the respondents?
Full name Relationship (or position) in household Age
Years in village
FLSP No.
1
2
3
4
Are you (any of the respondents) active members of official or unofficial community groups (eg. women’s union, special farmer groups)? ....................................................................................................................................................... .......................................................................................................................................................
40
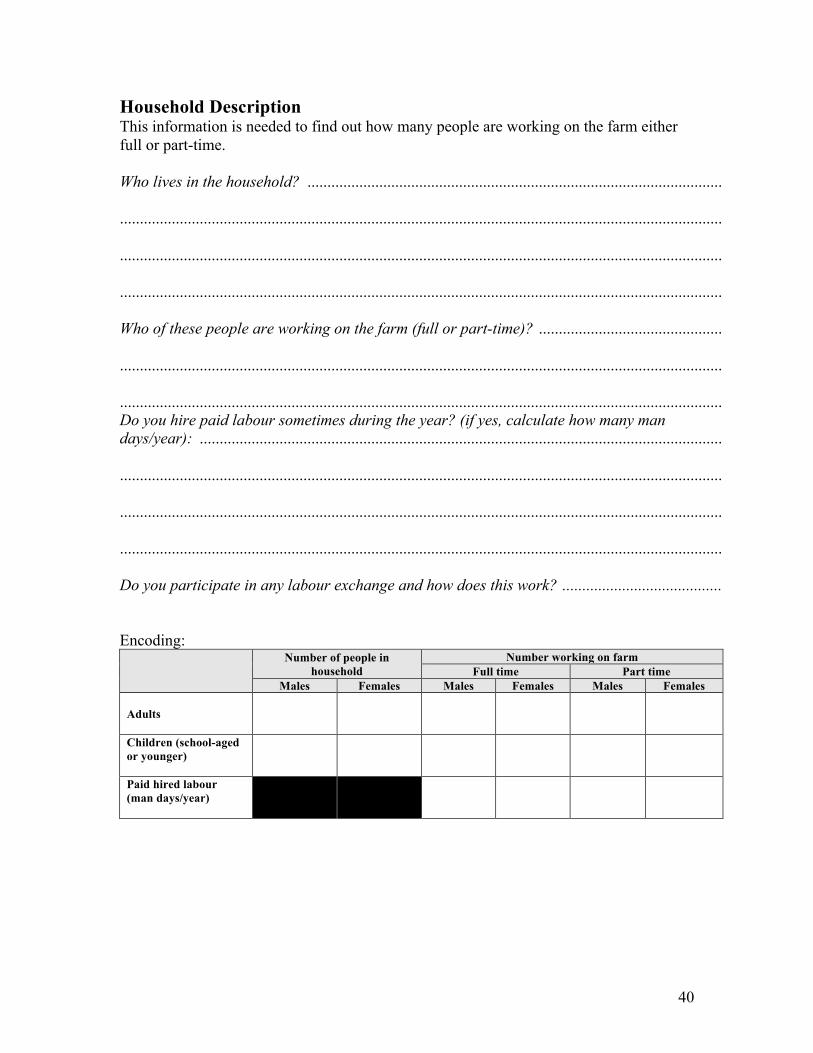
Household Description This information is needed to find out how many people are working on the farm either full or part-time. Who lives in the household? ........................................................................................................ ....................................................................................................................................................... ....................................................................................................................................................... ....................................................................................................................................................... Who of these people are working on the farm (full or part-time)? .............................................. ....................................................................................................................................................... ....................................................................................................................................................... Do you hire paid labour sometimes during the year? (if yes, calculate how many man days/year): ................................................................................................................................... ....................................................................................................................................................... ....................................................................................................................................................... ....................................................................................................................................................... Do you participate in any labour exchange and how does this work? ........................................ Encoding:
Number of people in
household Number working on farm
Full time Part time Males Females Males Females Males Females
Adults
Children (school-aged or younger)
Paid hired labour (man days/year)
41
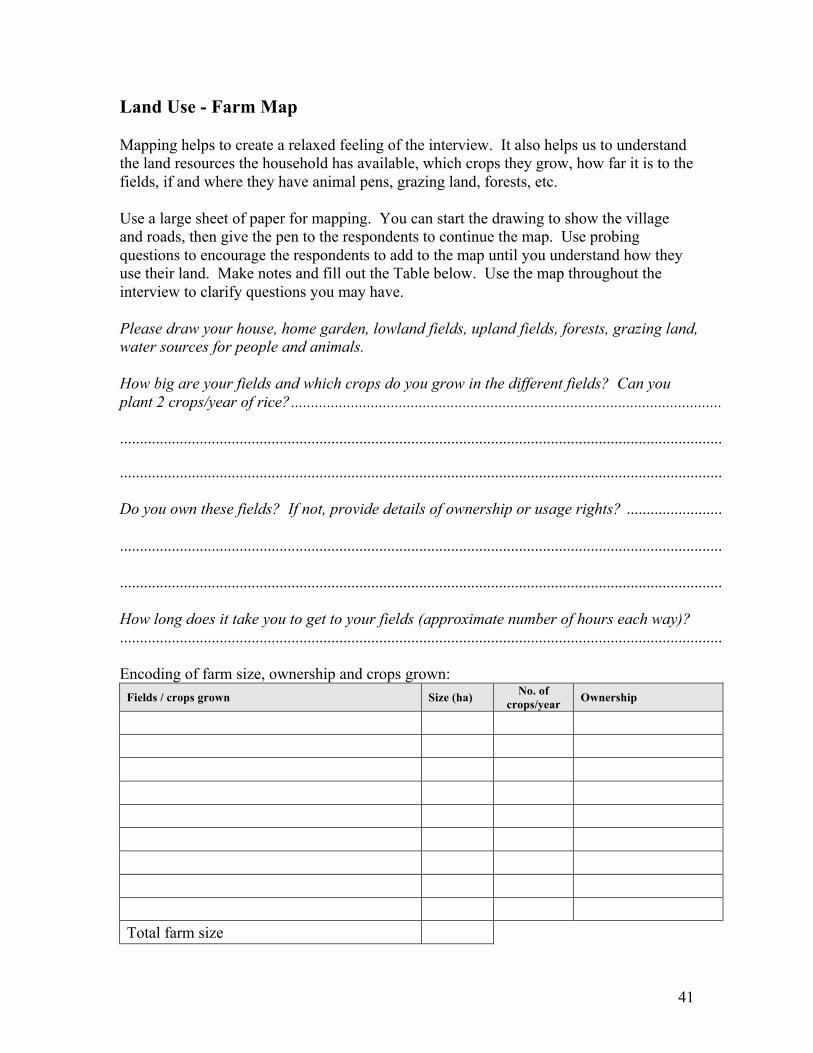
Land Use - Farm Map Mapping helps to create a relaxed feeling of the interview. It also helps us to understand the land resources the household has available, which crops they grow, how far it is to the fields, if and where they have animal pens, grazing land, forests, etc. Use a large sheet of paper for mapping. You can start the drawing to show the village and roads, then give the pen to the respondents to continue the map. Use probing questions to encourage the respondents to add to the map until you understand how they use their land. Make notes and fill out the Table below. Use the map throughout the interview to clarify questions you may have. Please draw your house, home garden, lowland fields, upland fields, forests, grazing land, water sources for people and animals. How big are your fields and which crops do you grow in the different fields? Can you plant 2 crops/year of rice? ............................................................................................................ ....................................................................................................................................................... ....................................................................................................................................................... Do you own these fields? If not, provide details of ownership or usage rights? ........................ ....................................................................................................................................................... ....................................................................................................................................................... How long does it take you to get to your fields (approximate number of hours each way)? ....................................................................................................................................................... Encoding of farm size, ownership and crops grown:
Fields / crops grown Size (ha) No. of crops/year Ownership
Total farm size

42
Do you have a problem with soil erosion? If yes, provide details on which areas and how bad is the problem. ....................................................................................................................... ....................................................................................................................................................... .......................................................................................................................................................
43
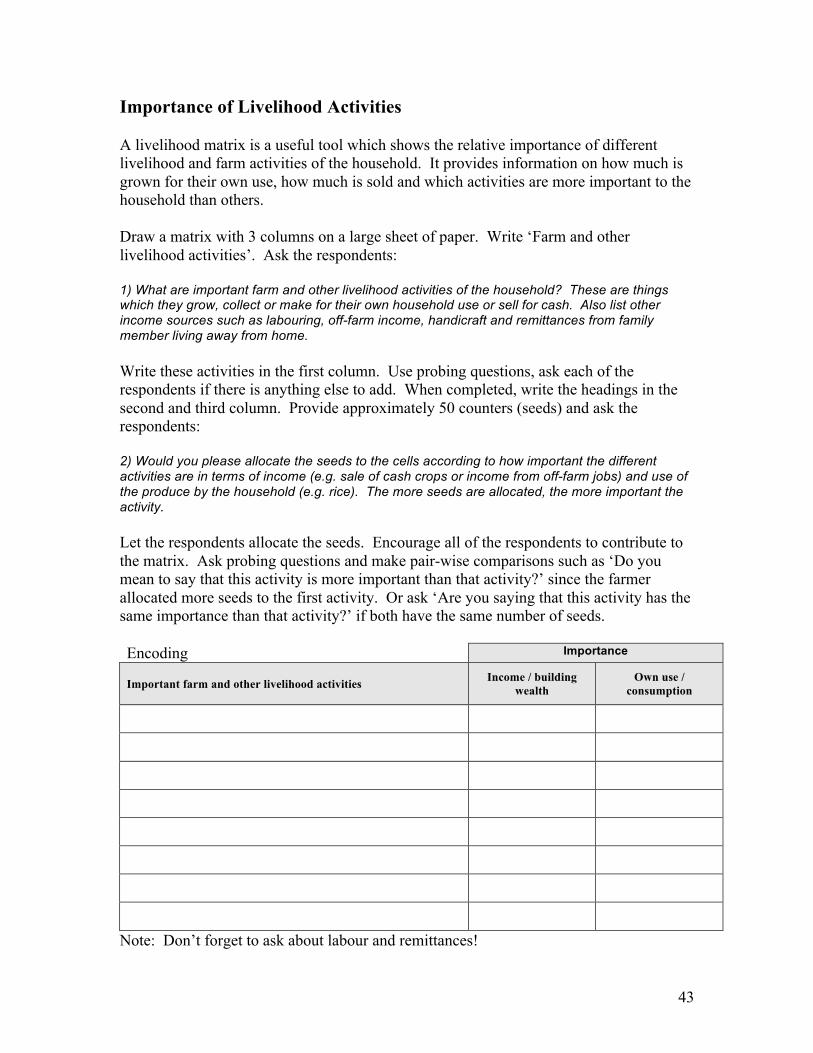
Importance of Livelihood Activities A livelihood matrix is a useful tool which shows the relative importance of different livelihood and farm activities of the household. It provides information on how much is grown for their own use, how much is sold and which activities are more important to the household than others. Draw a matrix with 3 columns on a large sheet of paper. Write ‘Farm and other livelihood activities’. Ask the respondents: 1) What are important farm and other livelihood activities of the household? These are things which they grow, collect or make for their own household use or sell for cash. Also list other income sources such as labouring, off-farm income, handicraft and remittances from family member living away from home. Write these activities in the first column. Use probing questions, ask each of the respondents if there is anything else to add. When completed, write the headings in the second and third column. Provide approximately 50 counters (seeds) and ask the respondents: 2) Would you please allocate the seeds to the cells according to how important the different activities are in terms of income (e.g. sale of cash crops or income from off-farm jobs) and use of the produce by the household (e.g. rice). The more seeds are allocated, the more important the activity. Let the respondents allocate the seeds. Encourage all of the respondents to contribute to the matrix. Ask probing questions and make pair-wise comparisons such as ‘Do you mean to say that this activity is more important than that activity?’ since the farmer allocated more seeds to the first activity. Or ask ‘Are you saying that this activity has the same importance than that activity?’ if both have the same number of seeds. Encoding Importance
Important farm and other livelihood activities Income / building wealth
Own use / consumption
Note: Don’t forget to ask about labour and remittances!
44
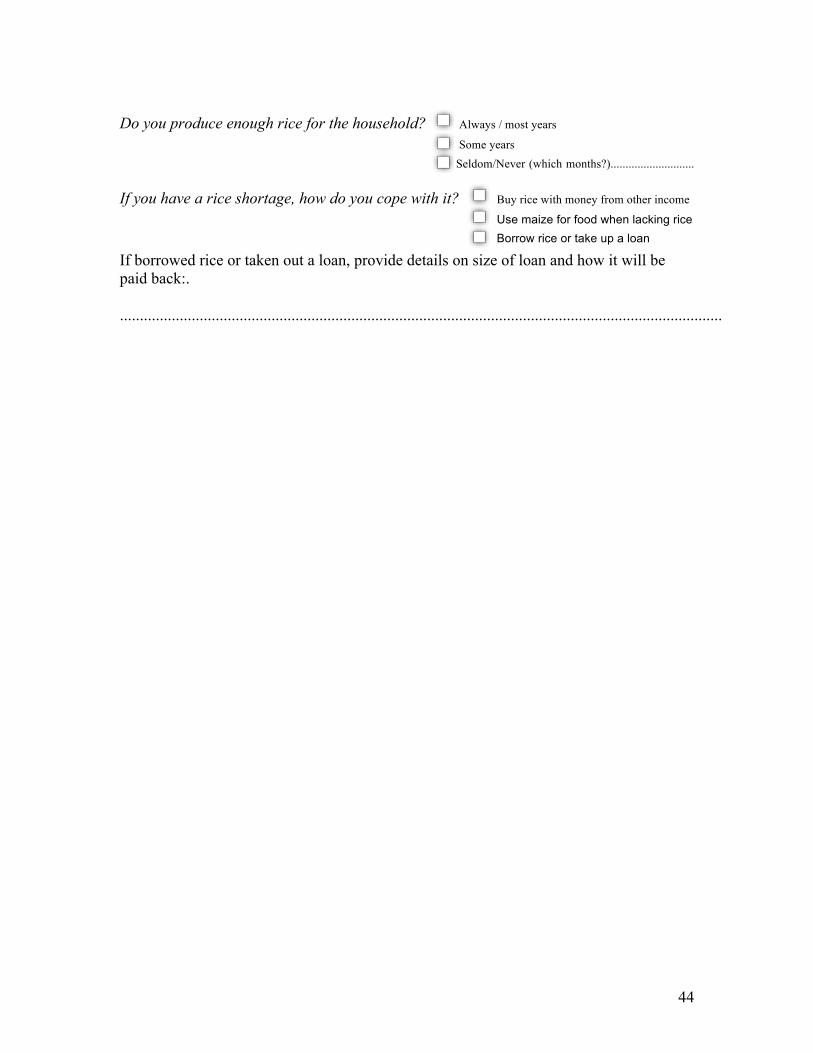
Do you produce enough rice for the household? Always / most years
Some years Seldom/Never (which months?)............................
If you have a rice shortage, how do you cope with it? Buy rice with money from other income
Use maize for food when lacking rice Borrow rice or take up a loan
If borrowed rice or taken out a loan, provide details on size of loan and how it will be paid back:. .......................................................................................................................................................
45
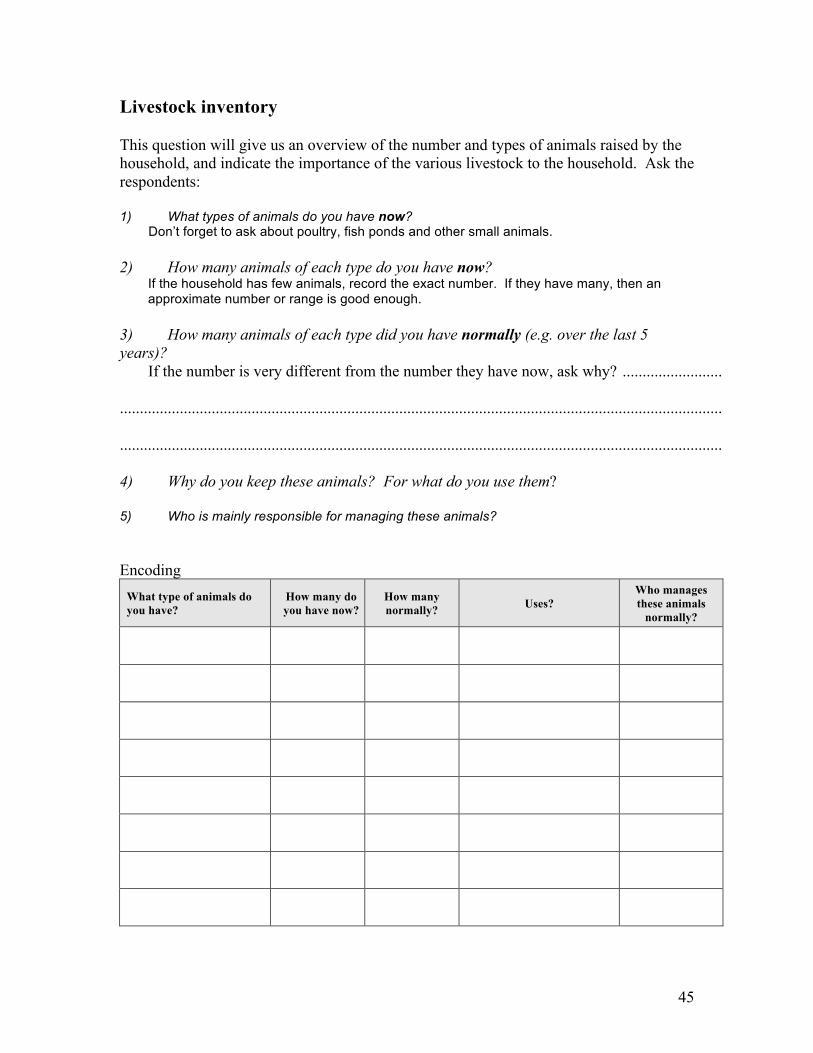
Livestock inventory This question will give us an overview of the number and types of animals raised by the household, and indicate the importance of the various livestock to the household. Ask the respondents: 1) What types of animals do you have now?
Don’t forget to ask about poultry, fish ponds and other small animals. 2) How many animals of each type do you have now?
If the household has few animals, record the exact number. If they have many, then an approximate number or range is good enough.
3) How many animals of each type did you have normally (e.g. over the last 5 years)?
If the number is very different from the number they have now, ask why? ......................... ....................................................................................................................................................... ....................................................................................................................................................... 4) Why do you keep these animals? For what do you use them? 5) Who is mainly responsible for managing these animals? Encoding
What type of animals do you have?
How many do you have now?
How many normally? Uses?
Who manages these animals
normally?
46
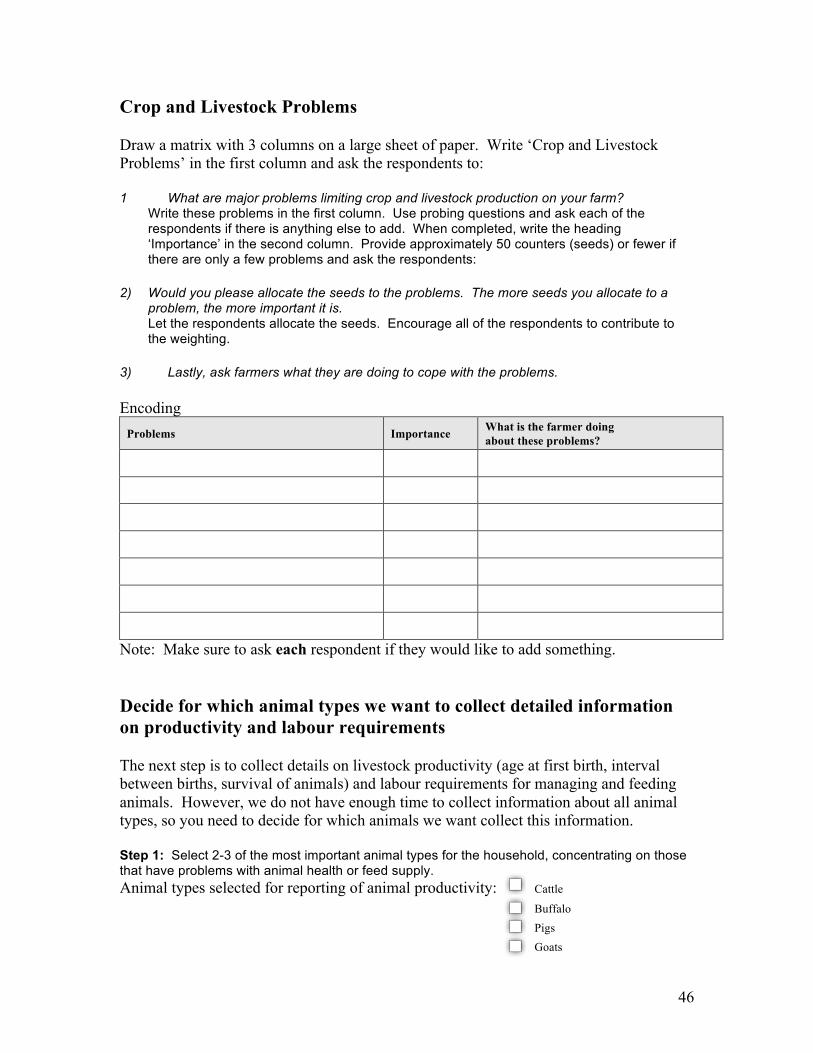
Crop and Livestock Problems Draw a matrix with 3 columns on a large sheet of paper. Write ‘Crop and Livestock Problems’ in the first column and ask the respondents to: 1 What are major problems limiting crop and livestock production on your farm?
Write these problems in the first column. Use probing questions and ask each of the respondents if there is anything else to add. When completed, write the heading ‘Importance’ in the second column. Provide approximately 50 counters (seeds) or fewer if there are only a few problems and ask the respondents:
2) Would you please allocate the seeds to the problems. The more seeds you allocate to a
problem, the more important it is. Let the respondents allocate the seeds. Encourage all of the respondents to contribute to the weighting.
3) Lastly, ask farmers what they are doing to cope with the problems. Encoding
Problems Importance What is the farmer doing about these problems?
Note: Make sure to ask each respondent if they would like to add something. Decide for which animal types we want to collect detailed information on productivity and labour requirements The next step is to collect details on livestock productivity (age at first birth, interval between births, survival of animals) and labour requirements for managing and feeding animals. However, we do not have enough time to collect information about all animal types, so you need to decide for which animals we want collect this information. Step 1: Select 2-3 of the most important animal types for the household, concentrating on those that have problems with animal health or feed supply. Animal types selected for reporting of animal productivity: Cattle
Buffalo Pigs Goats
47
Other ............................................. Step 2: Use the forms in the next few pages to collect details on these animal types. We want to collect actual details on particular animals, not general impressions. Farmers sometime say that their cattle have calves every year but, if we ask about specific cows, we find that they do not have a calf every year. If challenged, farmers say that it did not have a calf that year because there was no bull available or they missed the joining period, but usually the cow has a calf every year. In this study we want to find out actual data on specific animals.
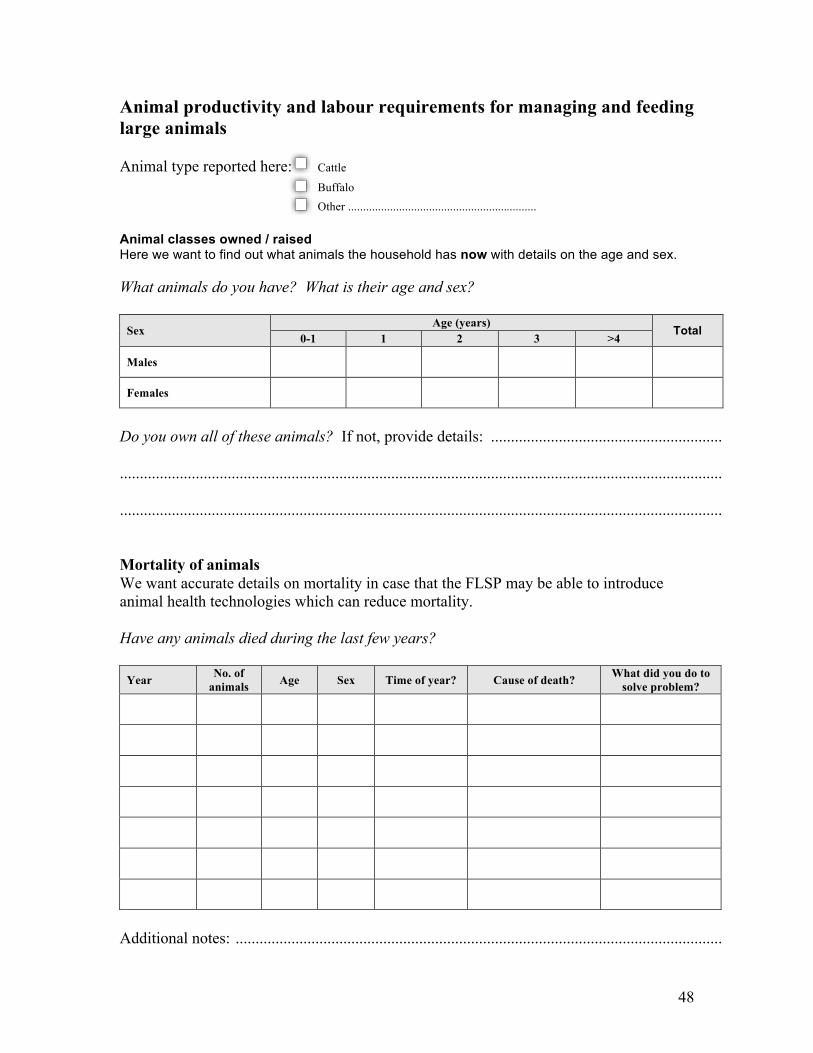
48
Animal productivity and labour requirements for managing and feeding large animals Animal type reported here: Cattle
Buffalo Other ............................................................... Animal classes owned / raised Here we want to find out what animals the household has now with details on the age and sex. What animals do you have? What is their age and sex?
Sex Age (years) Total
0-1 1 2 3 >4
Males
Females
Do you own all of these animals? If not, provide details: .......................................................... ....................................................................................................................................................... ....................................................................................................................................................... Mortality of animals We want accurate details on mortality in case that the FLSP may be able to introduce animal health technologies which can reduce mortality. Have any animals died during the last few years?
Year No. of animals Age Sex Time of year? Cause of death? What did you do to
solve problem?
Additional notes: ..........................................................................................................................
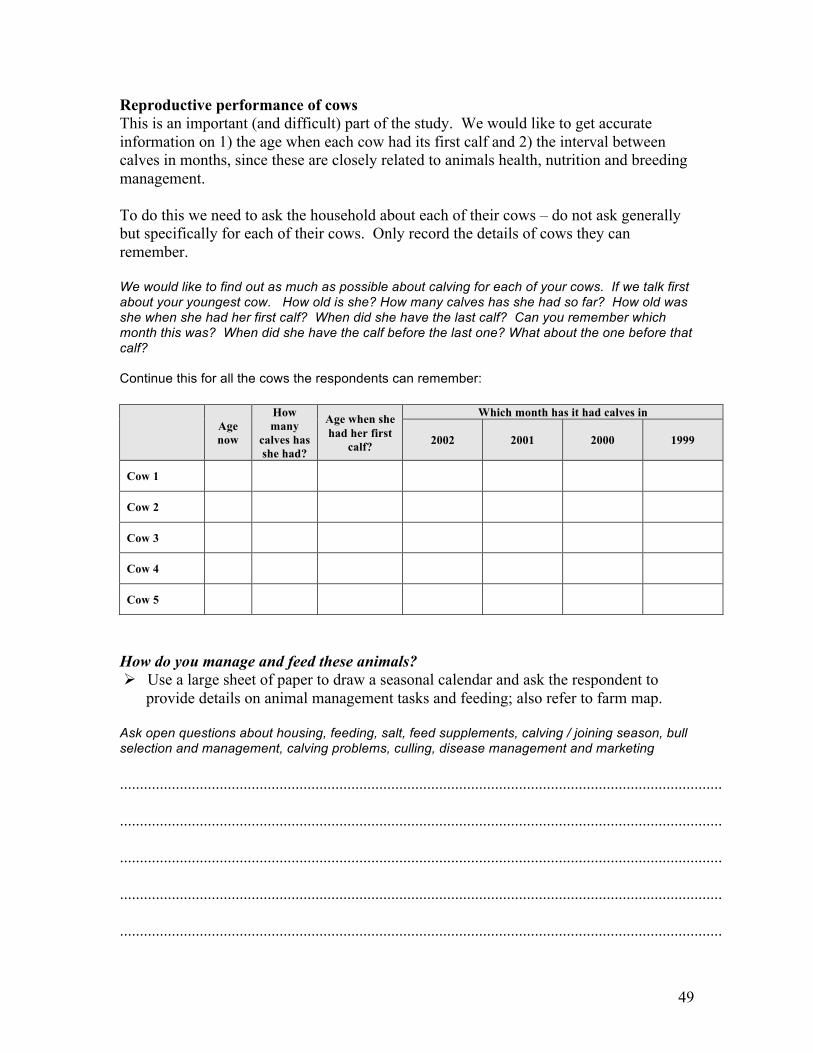
49
Reproductive performance of cows This is an important (and difficult) part of the study. We would like to get accurate information on 1) the age when each cow had its first calf and 2) the interval between calves in months, since these are closely related to animals health, nutrition and breeding management. To do this we need to ask the household about each of their cows – do not ask generally but specifically for each of their cows. Only record the details of cows they can remember. We would like to find out as much as possible about calving for each of your cows. If we talk first about your youngest cow. How old is she? How many calves has she had so far? How old was she when she had her first calf? When did she have the last calf? Can you remember which month this was? When did she have the calf before the last one? What about the one before that calf? Continue this for all the cows the respondents can remember:
Age now
How many
calves has she had?
Age when she had her first
calf?
Which month has it had calves in
2002 2001 2000 1999
Cow 1
Cow 2
Cow 3
Cow 4
Cow 5
How do you manage and feed these animals? Ø Use a large sheet of paper to draw a seasonal calendar and ask the respondent to
provide details on animal management tasks and feeding; also refer to farm map. Ask open questions about housing, feeding, salt, feed supplements, calving / joining season, bull selection and management, calving problems, culling, disease management and marketing ....................................................................................................................................................... ....................................................................................................................................................... ....................................................................................................................................................... ....................................................................................................................................................... .......................................................................................................................................................
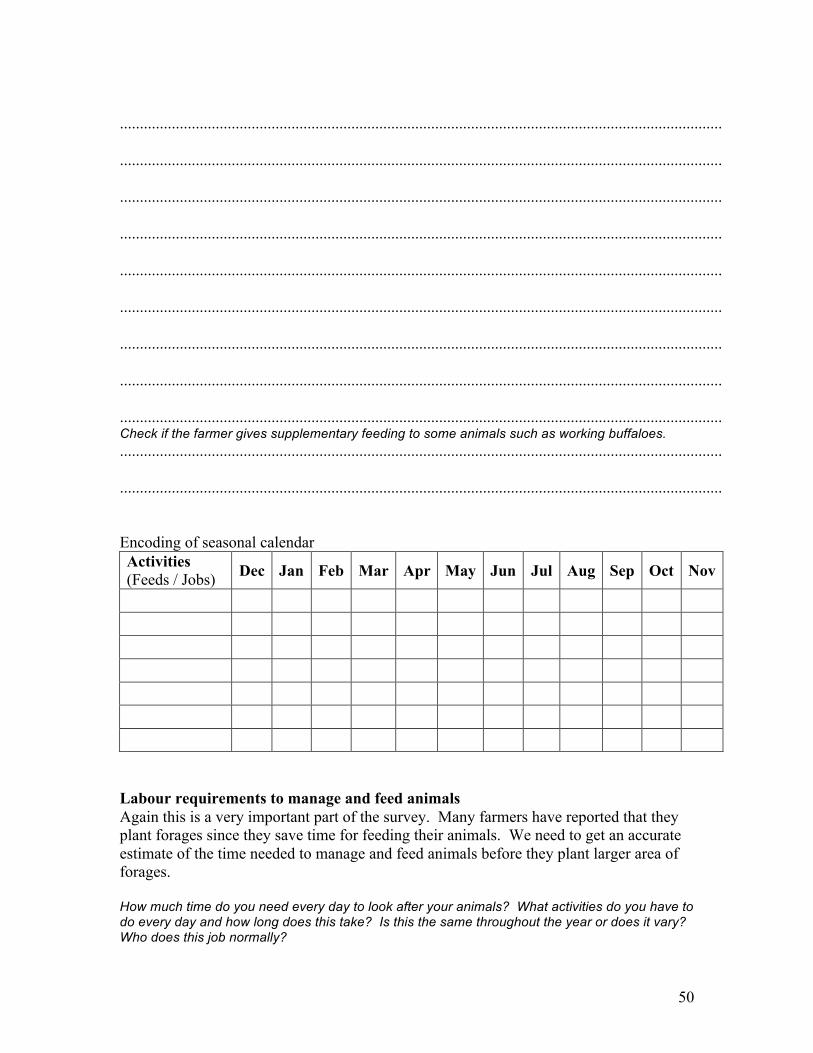
50
....................................................................................................................................................... ....................................................................................................................................................... ....................................................................................................................................................... ....................................................................................................................................................... ....................................................................................................................................................... ....................................................................................................................................................... ....................................................................................................................................................... ....................................................................................................................................................... ....................................................................................................................................................... Check if the farmer gives supplementary feeding to some animals such as working buffaloes. ....................................................................................................................................................... ....................................................................................................................................................... Encoding of seasonal calendar Activities (Feeds / Jobs) Dec Jan Feb Mar Apr May Jun Jul Aug Sep Oct Nov
Labour requirements to manage and feed animals Again this is a very important part of the survey. Many farmers have reported that they plant forages since they save time for feeding their animals. We need to get an accurate estimate of the time needed to manage and feed animals before they plant larger area of forages. How much time do you need every day to look after your animals? What activities do you have to do every day and how long does this take? Is this the same throughout the year or does it vary? Who does this job normally?
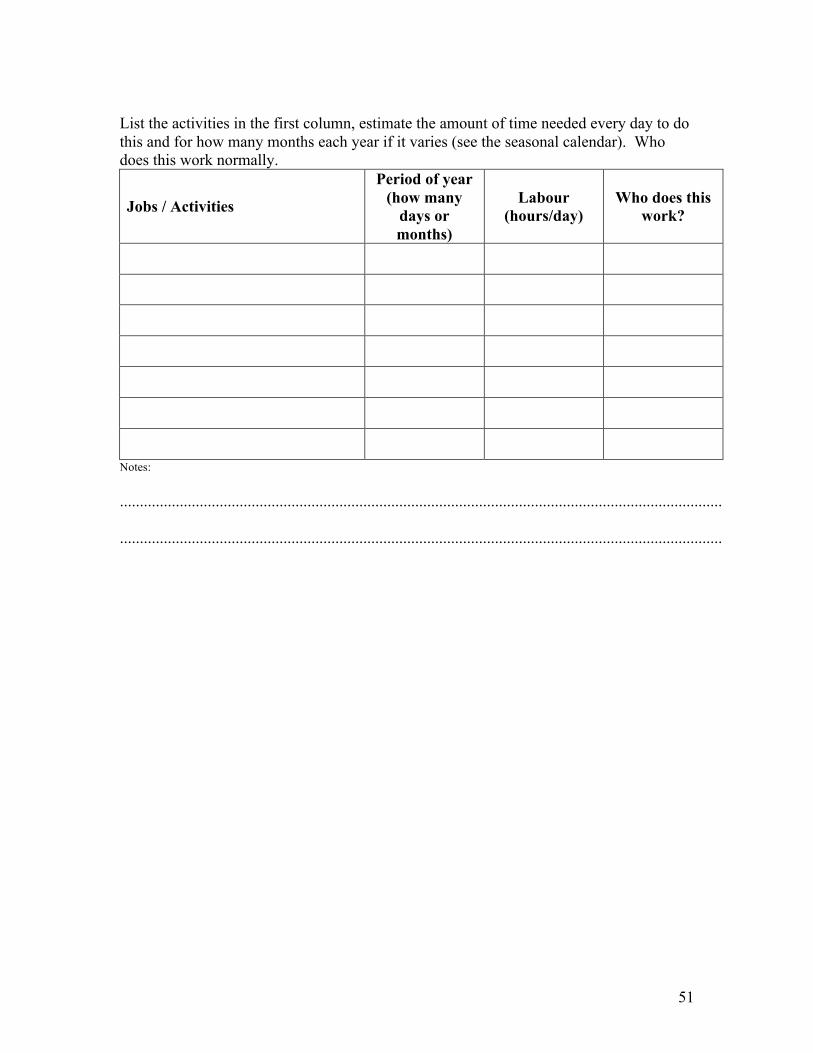
51
List the activities in the first column, estimate the amount of time needed every day to do this and for how many months each year if it varies (see the seasonal calendar). Who does this work normally.
Jobs / Activities
Period of year (how many
days or months)
Labour (hours/day)
Who does this work?
Notes: ....................................................................................................................................................... .......................................................................................................................................................

52
Animal productivity and labour requirements for managing and feeding large animals Animal type reported here: Cattle
Buffalo Other ............................................................... Animal classes owned / raised Here we want to find out what animals the household has now with details on the age and sex. What animals do you have? What is their age and sex?
Sex Age (years) Total
0-1 1 2 3 >4
Males
Females
Do you own all of these animals? If not, provide details: .......................................................... ....................................................................................................................................................... ....................................................................................................................................................... Mortality of animals We want accurate details on mortality in case that the FLSP may be able to introduce animal health technologies which can reduce mortality. Have any animals died during the last few years?
Year No. of animals Age Sex Time of year? Cause of death? What did you do to
solve problem?
Additional notes: ..........................................................................................................................
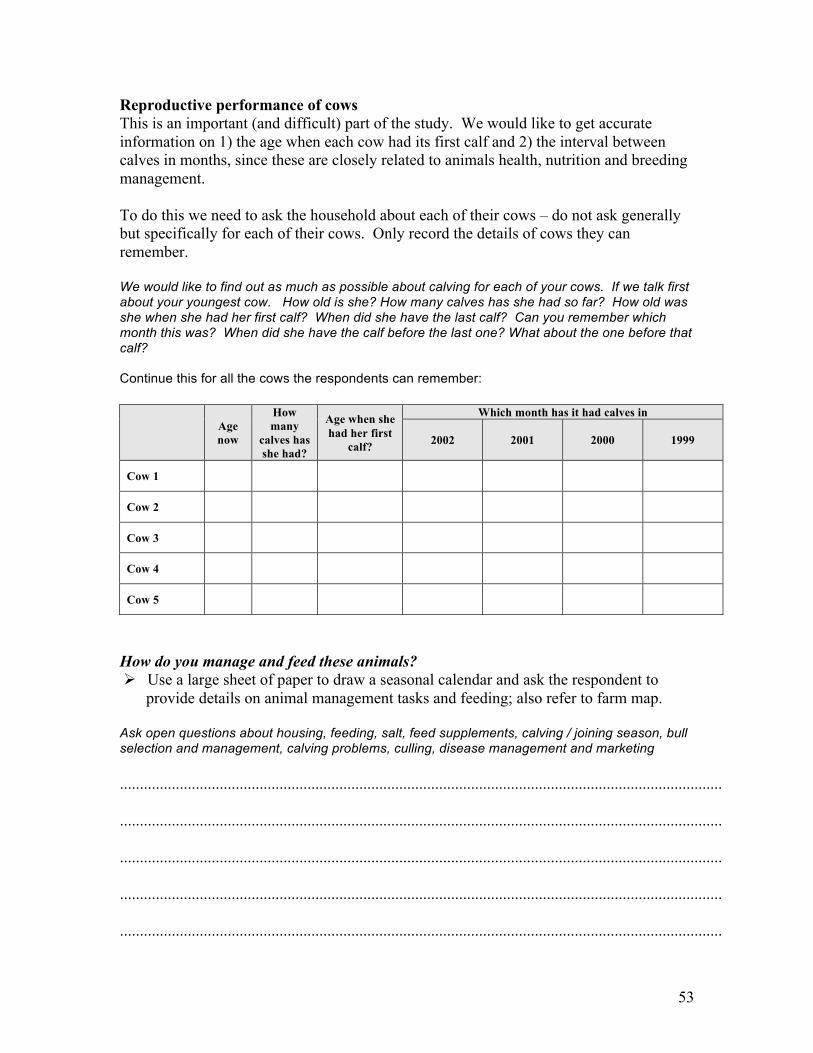
53
Reproductive performance of cows This is an important (and difficult) part of the study. We would like to get accurate information on 1) the age when each cow had its first calf and 2) the interval between calves in months, since these are closely related to animals health, nutrition and breeding management. To do this we need to ask the household about each of their cows – do not ask generally but specifically for each of their cows. Only record the details of cows they can remember. We would like to find out as much as possible about calving for each of your cows. If we talk first about your youngest cow. How old is she? How many calves has she had so far? How old was she when she had her first calf? When did she have the last calf? Can you remember which month this was? When did she have the calf before the last one? What about the one before that calf? Continue this for all the cows the respondents can remember:
Age now
How many
calves has she had?
Age when she had her first
calf?
Which month has it had calves in
2002 2001 2000 1999
Cow 1
Cow 2
Cow 3
Cow 4
Cow 5
How do you manage and feed these animals? Ø Use a large sheet of paper to draw a seasonal calendar and ask the respondent to
provide details on animal management tasks and feeding; also refer to farm map. Ask open questions about housing, feeding, salt, feed supplements, calving / joining season, bull selection and management, calving problems, culling, disease management and marketing ....................................................................................................................................................... ....................................................................................................................................................... ....................................................................................................................................................... ....................................................................................................................................................... .......................................................................................................................................................

54
....................................................................................................................................................... ....................................................................................................................................................... ....................................................................................................................................................... ....................................................................................................................................................... ....................................................................................................................................................... ....................................................................................................................................................... ....................................................................................................................................................... ....................................................................................................................................................... ....................................................................................................................................................... Check if the farmer gives supplementary feeding to some animals such as working buffaloes. ....................................................................................................................................................... ....................................................................................................................................................... Encoding of seasonal calendar Activities (Feeds / Jobs) Dec Jan Feb Mar Apr May Jun Jul Aug Sep Oct Nov
Labour requirements to manage and feed animals Again this is a very important part of the survey. Many farmers have reported that they plant forages since they save time for feeding their animals. We need to get an accurate estimate of the time needed to manage and feed animals before they plant larger area of forages. How much time do you need every day to look after your animals? What activities do you have to do every day and how long does this take? Is this the same throughout the year or does it vary? Who does this job normally?

55
List the activities in the first column, estimate the amount of time needed every day to do this and for how many months each year if it varies (see the seasonal calendar). Who does this work normally.
Jobs / Activities
Period of year (how many
days or months)
Labour (hours/day)
Who does this work?
Notes: ....................................................................................................................................................... .......................................................................................................................................................

56
Animal productivity and labour requirements for managing and feeding small animals Animal type reported here: Pigs
Goats Other ............................................................... Animal classes owned / raised Here we want to find out what animals the household has now with details on the age and sex. What animals do you have? What is their age and sex?
Sex Age (years) Total
0-1 1 2 3 4 +
Males
Females
Do you own all of these animals? If not, provide details: .......................................................... ....................................................................................................................................................... ....................................................................................................................................................... Mortality of animals We want accurate details on mortality in case that the FLSP may be able to introduce animal health technologies which can reduce mortality. Have any animals died during the last few years?
Year No. of animals Age Sex Time of year? Cause of death? What did you do to
solve problem?
Additional notes: ..........................................................................................................................
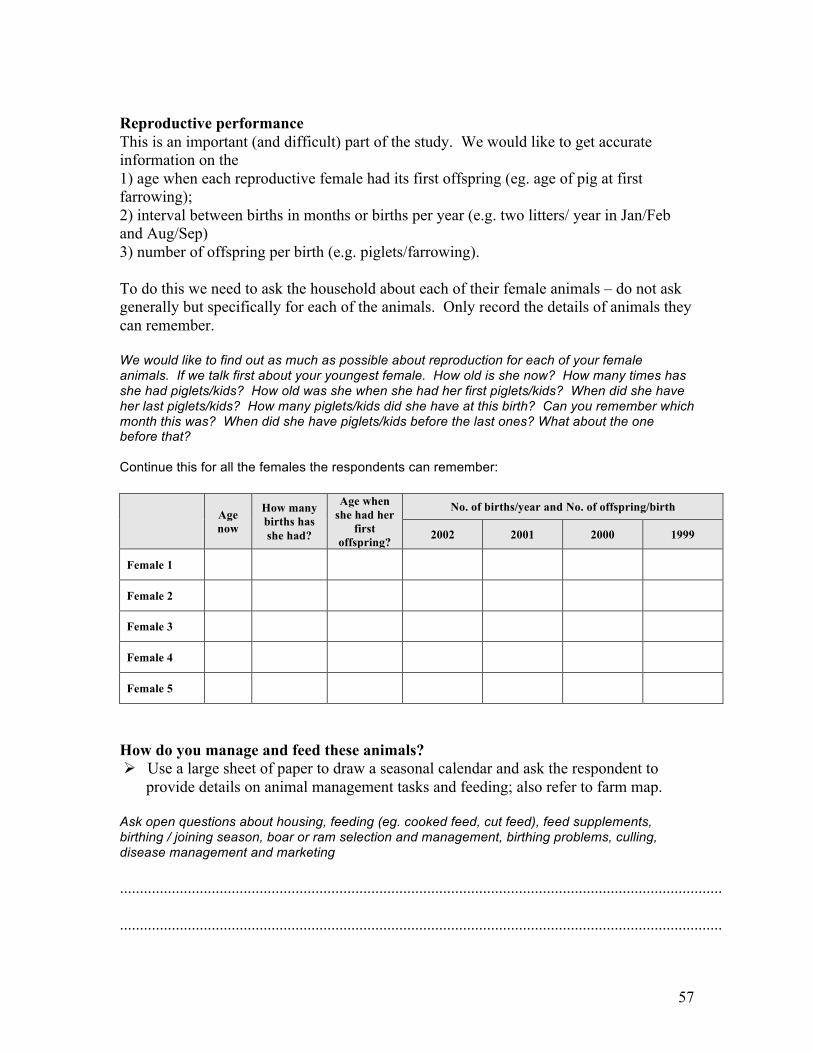
57
Reproductive performance This is an important (and difficult) part of the study. We would like to get accurate information on the 1) age when each reproductive female had its first offspring (eg. age of pig at first farrowing); 2) interval between births in months or births per year (e.g. two litters/ year in Jan/Feb and Aug/Sep) 3) number of offspring per birth (e.g. piglets/farrowing). To do this we need to ask the household about each of their female animals – do not ask generally but specifically for each of the animals. Only record the details of animals they can remember. We would like to find out as much as possible about reproduction for each of your female animals. If we talk first about your youngest female. How old is she now? How many times has she had piglets/kids? How old was she when she had her first piglets/kids? When did she have her last piglets/kids? How many piglets/kids did she have at this birth? Can you remember which month this was? When did she have piglets/kids before the last ones? What about the one before that? Continue this for all the females the respondents can remember:
Age now
How many births has she had?
Age when she had her
first offspring?
No. of births/year and No. of offspring/birth
2002 2001 2000 1999
Female 1
Female 2
Female 3
Female 4
Female 5
How do you manage and feed these animals? Ø Use a large sheet of paper to draw a seasonal calendar and ask the respondent to
provide details on animal management tasks and feeding; also refer to farm map. Ask open questions about housing, feeding (eg. cooked feed, cut feed), feed supplements, birthing / joining season, boar or ram selection and management, birthing problems, culling, disease management and marketing ....................................................................................................................................................... .......................................................................................................................................................
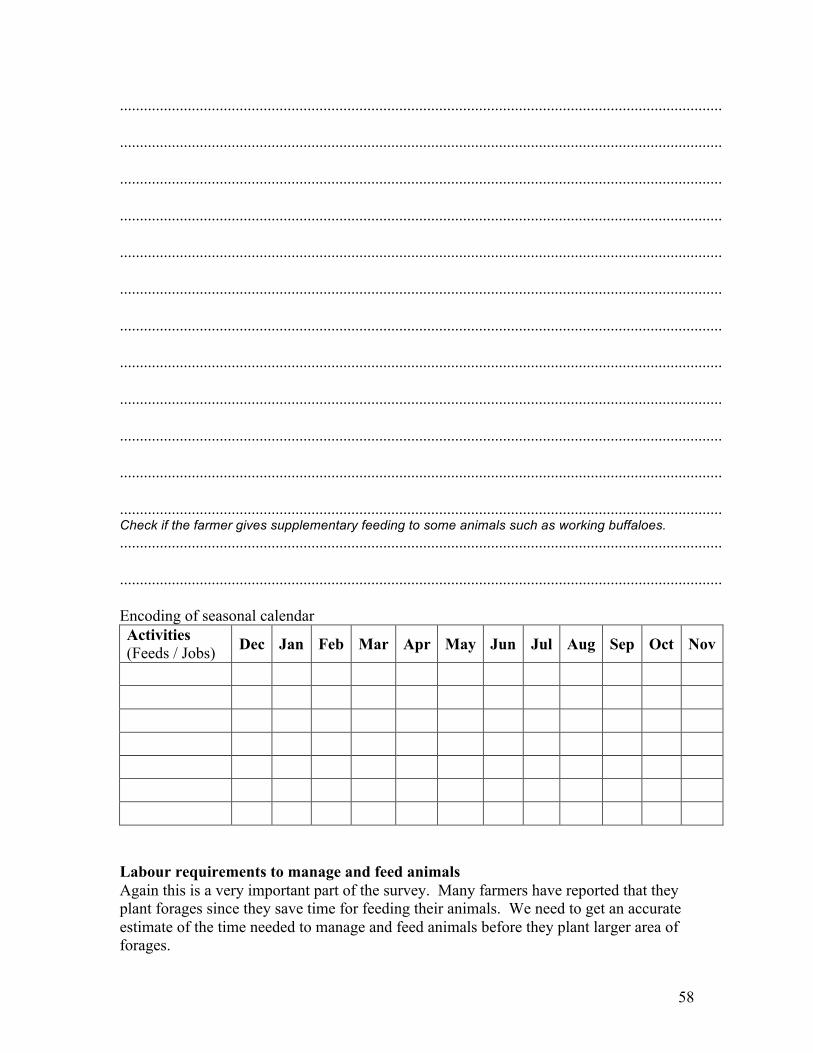
58
....................................................................................................................................................... ....................................................................................................................................................... ....................................................................................................................................................... ....................................................................................................................................................... ....................................................................................................................................................... ....................................................................................................................................................... ....................................................................................................................................................... ....................................................................................................................................................... ....................................................................................................................................................... ....................................................................................................................................................... ....................................................................................................................................................... ....................................................................................................................................................... Check if the farmer gives supplementary feeding to some animals such as working buffaloes. ....................................................................................................................................................... ....................................................................................................................................................... Encoding of seasonal calendar Activities (Feeds / Jobs) Dec Jan Feb Mar Apr May Jun Jul Aug Sep Oct Nov
Labour requirements to manage and feed animals Again this is a very important part of the survey. Many farmers have reported that they plant forages since they save time for feeding their animals. We need to get an accurate estimate of the time needed to manage and feed animals before they plant larger area of forages.
59
How much time do you need every day to look after your animals? What activities do you have to do every day and how long does this take? Is this the same throughout the year or does it vary? Who does this job normally? List the activities in the first column, estimate the amount of time needed every day to do this and for how many months each year if it varies (see the seasonal calendar). Who does this work normally.
Jobs / Activities
Period of year (how many
days or months)
Labour (hours/day)
Who does this work?
Notes: ....................................................................................................................................................... .......................................................................................................................................................
60
Animal productivity and labour requirements for managing and feeding small animals Animal type reported here: Pigs
Goats Other ............................................................... Animal classes owned / raised Here we want to find out what animals the household has now with details on the age and sex. What animals do you have? What is their age and sex?
Sex Age (years) Total
0-1 1 2 3 4 +
Males
Females
Do you own all of these animals? If not, provide details: .......................................................... ....................................................................................................................................................... ....................................................................................................................................................... Mortality of animals We want accurate details on mortality in case that the FLSP may be able to introduce animal health technologies which can reduce mortality. Have any animals died during the last few years?
Year No. of animals Age Sex Time of year? Cause of death? What did you do to
solve problem?
Additional notes: ..........................................................................................................................
61
Reproductive performance This is an important (and difficult) part of the study. We would like to get accurate information on the 1) age when each reproductive female had its first offspring (eg. age of pig at first farrowing); 2) interval between births in months or births per year (e.g. two litters/ year in Jan/Feb and Aug/Sep) 3) number of offspring per birth (e.g. piglets/farrowing). To do this we need to ask the household about each of their female animals – do not ask generally but specifically for each of the animals. Only record the details of animals they can remember. We would like to find out as much as possible about reproduction for each of your female animals. If we talk first about your youngest female. How old is she now? How many times has she had piglets/kids? How old was she when she had her first piglets/kids? When did she have her last piglets/kids? How many piglets/kids did she have at this birth? Can you remember which month this was? When did she have piglets/kids before the last ones? What about the one before that? Continue this for all the females the respondents can remember:
Age now
How many births has she had?
Age when she had her
first offspring?
No. of births/year and No. of offspring/birth
2002 2001 2000 1999
Female 1
Female 2
Female 3
Female 4
Female 5
How do you manage and feed these animals? Ø Use a large sheet of paper to draw a seasonal calendar and ask the respondent to
provide details on animal management tasks and feeding; also refer to farm map. Ask open questions about housing, feeding (eg. cooked feed, cut feed), feed supplements, birthing / joining season, boar or ram selection and management, birthing problems, culling, disease management and marketing ....................................................................................................................................................... ....................................................................................................................................................... .......................................................................................................................................................
62
....................................................................................................................................................... ....................................................................................................................................................... ....................................................................................................................................................... ....................................................................................................................................................... ....................................................................................................................................................... ....................................................................................................................................................... ....................................................................................................................................................... ....................................................................................................................................................... ....................................................................................................................................................... ....................................................................................................................................................... ....................................................................................................................................................... Check if the farmer gives supplementary feeding to some animals such as working buffaloes. ....................................................................................................................................................... ....................................................................................................................................................... Encoding of seasonal calendar Activities (Feeds / Jobs) Dec Jan Feb Mar Apr May Jun Jul Aug Sep Oct Nov
Labour requirements to manage and feed animals Again this is a very important part of the survey. Many farmers have reported that they plant forages since they save time for feeding their animals. We need to get an accurate estimate of the time needed to manage and feed animals before they plant larger area of forages.
63
How much time do you need every day to look after your animals? What activities do you have to do every day and how long does this take? Is this the same throughout the year or does it vary? Who does this job normally? List the activities in the first column, estimate the amount of time needed every day to do this and for how many months each year if it varies (see the seasonal calendar). Who does this work normally.
Jobs / Activities
Period of year (how many
days or months)
Labour (hours/day)
Who does this work?
Notes: ....................................................................................................................................................... ....................................................................................................................................................... Chicken, Ducks, Fish and Other Small Farm Animals Only provide notes on productivity, problems with managing and feeding, labour requirements for animal types which are important for this household: Animal type reported here: Chicken
Ducks Fish ponds Other ............................................................... How do you manage and feed these animals? ....................................................................................................................................................... ....................................................................................................................................................... Could you give us an idea how much time you need every day to do this and who does it normally (hours /day)?
64
....................................................................................................................................................... ....................................................................................................................................................... What are the main problems with raising these animals? ....................................................................................................................................................... ....................................................................................................................................................... If mortality is a problem, provide more details:
Animal class Which year?
What age? Which season? Cause of
death? What do you do to solve problem?
Notes:
65
Use of Manure – always ask this question How important is manure in your farming system? Do you collect manure? If yes, how do you do this? And who does it? ..................................... ....................................................................................................................................................... ....................................................................................................................................................... How do you use manure (which crops and how much)? ............................................................. ....................................................................................................................................................... ....................................................................................................................................................... Aspirations – always ask this question What opportunities do you see to improve your livelihood? What would you like your farm to look like in 5-10 years? ....................................................................................................................................................... ....................................................................................................................................................... ....................................................................................................................................................... Thank you very much for your time Notes by interviewer: 1) Contribution of male respondent: 2) Contribution of female respondent: 3) Contribution of other respondents: 4) Confidence in livelihood matrix 5) Confidence in problem diagnosis 6) Confidence in livestock numbers
Low High
Low High
Low High
Low High
Low High
Low High
Low High
Low Very
66
7) Confidence in age at first birth 8) Confidence in calving / farrowing intervals 9) Confidence in mortality figures 10) Other impressions: ................................................................................................................. ....................................................................................................................................................... .......................................................................................................................................................
Low High
Low High
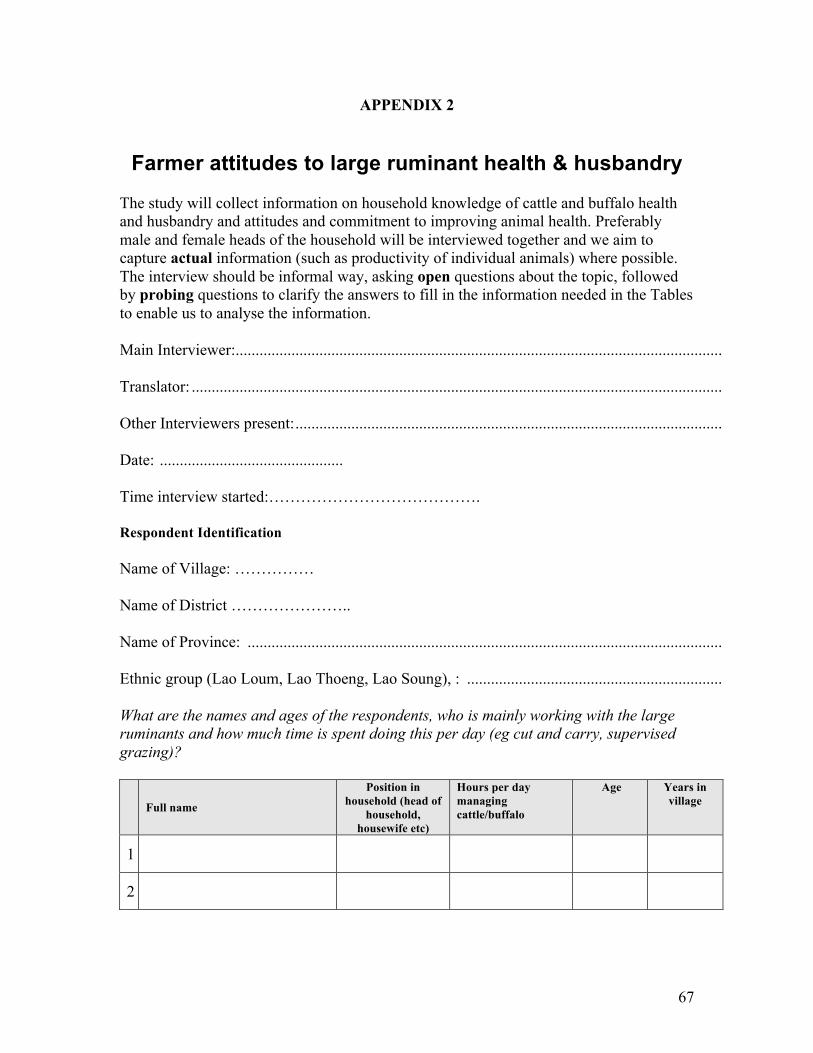
67
APPENDIX 2
Farmer attitudes to large ruminant health & husbandry
The study will collect information on household knowledge of cattle and buffalo health and husbandry and attitudes and commitment to improving animal health. Preferably male and female heads of the household will be interviewed together and we aim to capture actual information (such as productivity of individual animals) where possible. The interview should be informal way, asking open questions about the topic, followed by probing questions to clarify the answers to fill in the information needed in the Tables to enable us to analyse the information. Main Interviewer: .......................................................................................................................... Translator: ..................................................................................................................................... Other Interviewers present: ........................................................................................................... Date: .............................................. Time interview started:…………………………………. Respondent Identification Name of Village: …………… Name of District ………………….. Name of Province: ....................................................................................................................... Ethnic group (Lao Loum, Lao Thoeng, Lao Soung), : ................................................................ What are the names and ages of the respondents, who is mainly working with the large ruminants and how much time is spent doing this per day (eg cut and carry, supervised grazing)?
Full name
Position in household (head of
household, housewife etc)
Hours per day managing cattle/buffalo
Age Years in village
1
2
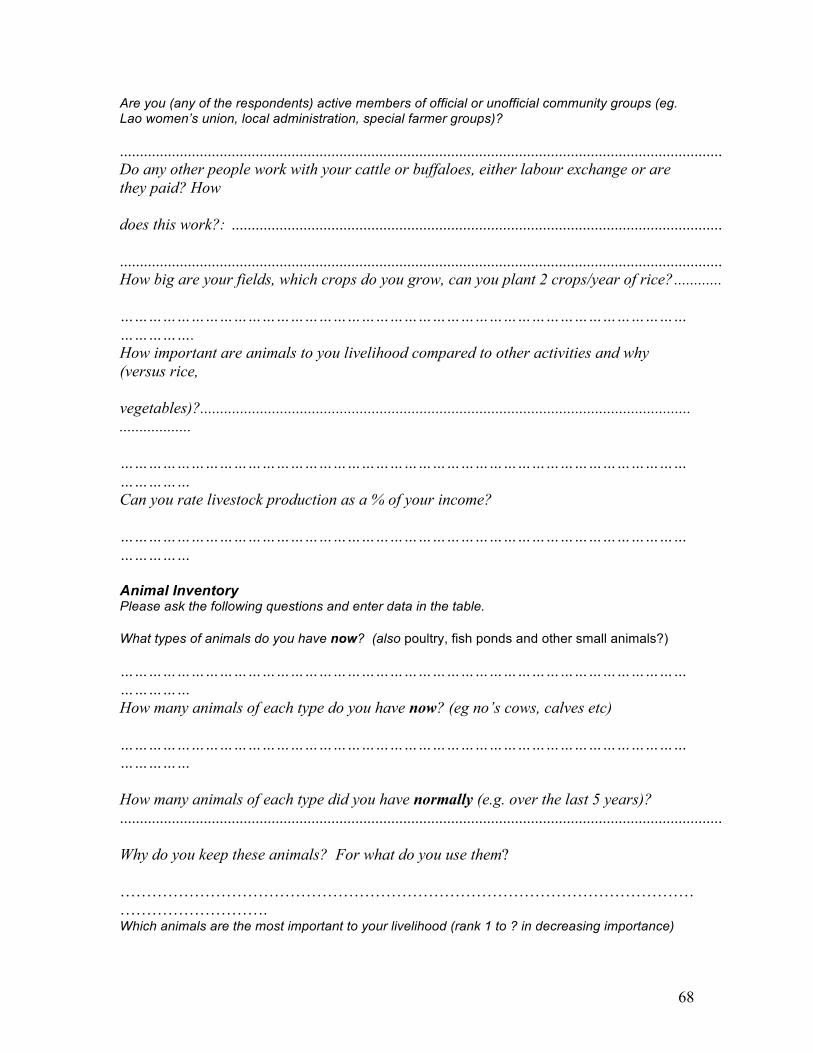
68
Are you (any of the respondents) active members of official or unofficial community groups (eg. Lao women’s union, local administration, special farmer groups)? ....................................................................................................................................................... Do any other people work with your cattle or buffaloes, either labour exchange or are they paid? How does this work?: ........................................................................................................................... ....................................................................................................................................................... How big are your fields, which crops do you grow, can you plant 2 crops/year of rice? ............ ………………………………………………………………………………………………………………………. How important are animals to you livelihood compared to other activities and why (versus rice, vegetables)?............................................................................................................................................. ……………………………………………………………………………………………………………………… Can you rate livestock production as a % of your income? ……………………………………………………………………………………………………………………… Animal Inventory Please ask the following questions and enter data in the table. What types of animals do you have now? (also poultry, fish ponds and other small animals?) ……………………………………………………………………………………………………………………… How many animals of each type do you have now? (eg no’s cows, calves etc) ……………………………………………………………………………………………………………………… How many animals of each type did you have normally (e.g. over the last 5 years)? ....................................................................................................................................................... Why do you keep these animals? For what do you use them? ………………………………………………………………………………………………………………………. Which animals are the most important to your livelihood (rank 1 to ? in decreasing importance)
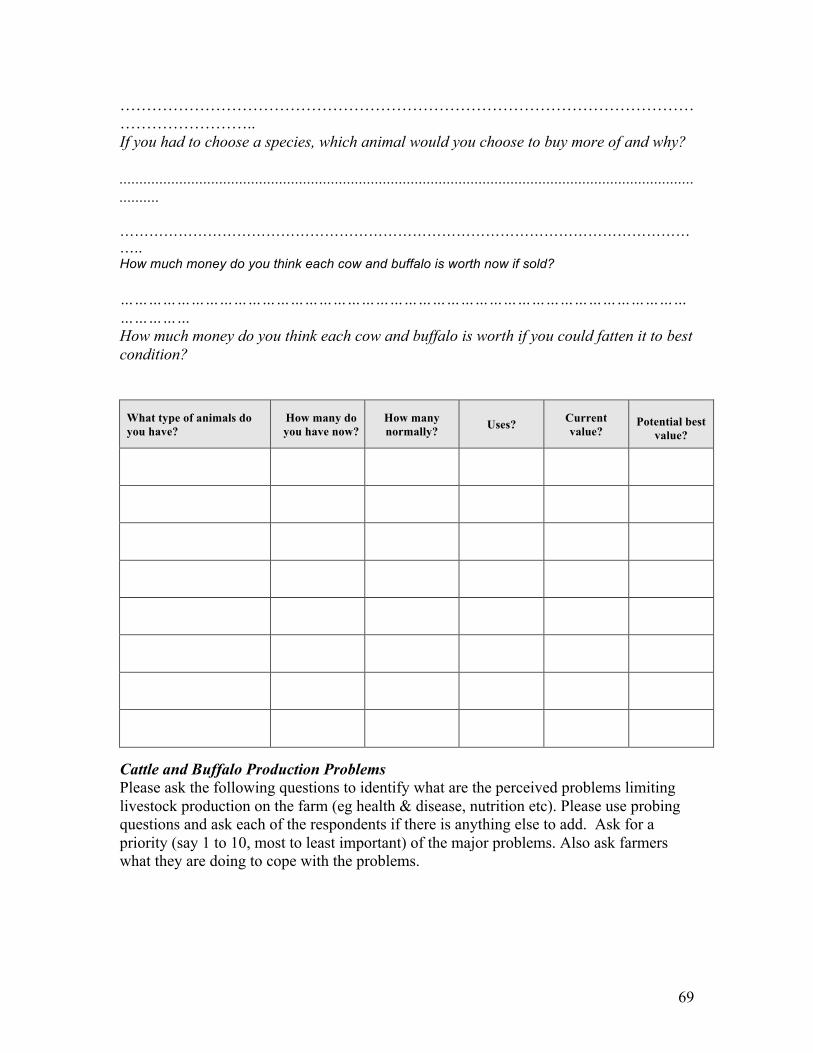
69
…………………………………………………………………………………………………………………….. If you had to choose a species, which animal would you choose to buy more of and why? .......................................................................................................................................................... ………………………………………………………………………………………………………….. How much money do you think each cow and buffalo is worth now if sold? ……………………………………………………………………………………………………………………… How much money do you think each cow and buffalo is worth if you could fatten it to best condition?
What type of animals do you have?
How many do you have now?
How many normally? Uses? Current
value?
Potential best
value?
Cattle and Buffalo Production Problems Please ask the following questions to identify what are the perceived problems limiting livestock production on the farm (eg health & disease, nutrition etc). Please use probing questions and ask each of the respondents if there is anything else to add. Ask for a priority (say 1 to 10, most to least important) of the major problems. Also ask farmers what they are doing to cope with the problems.
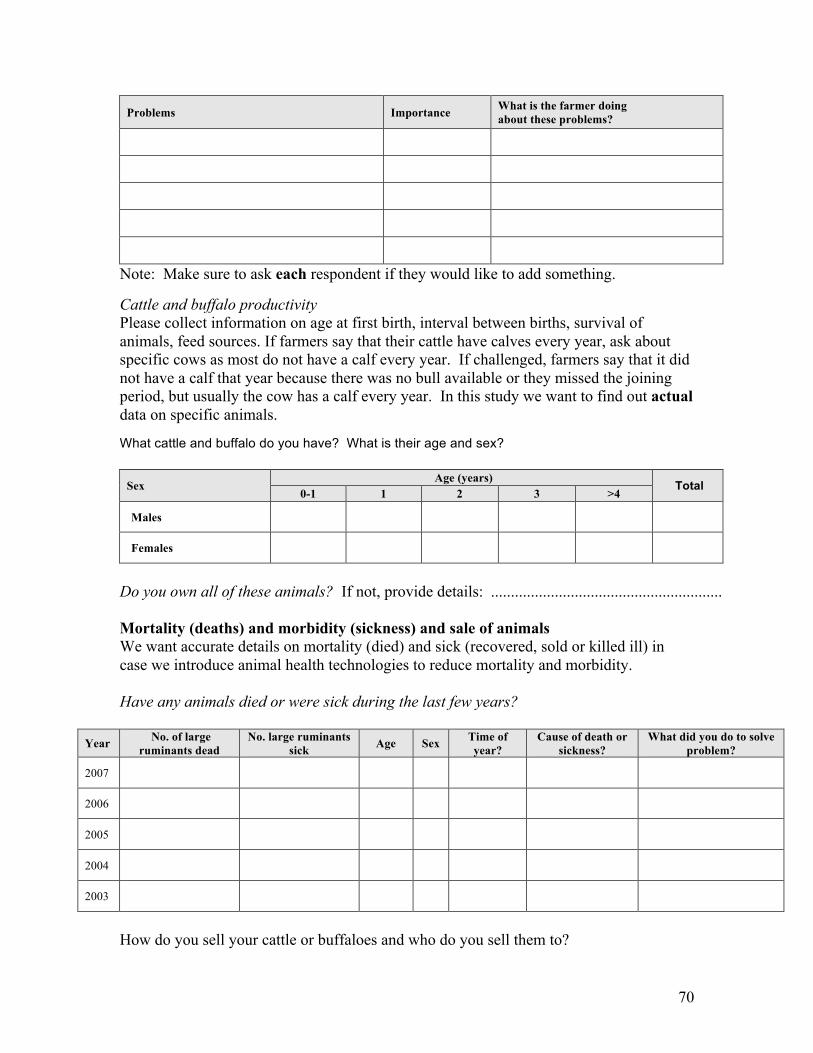
70
Problems Importance What is the farmer doing about these problems?
Note: Make sure to ask each respondent if they would like to add something. Cattle and buffalo productivity Please collect information on age at first birth, interval between births, survival of animals, feed sources. If farmers say that their cattle have calves every year, ask about specific cows as most do not have a calf every year. If challenged, farmers say that it did not have a calf that year because there was no bull available or they missed the joining period, but usually the cow has a calf every year. In this study we want to find out actual data on specific animals. What cattle and buffalo do you have? What is their age and sex?
Sex Age (years) Total
0-1 1 2 3 >4
Males
Females
Do you own all of these animals? If not, provide details: .......................................................... Mortality (deaths) and morbidity (sickness) and sale of animals We want accurate details on mortality (died) and sick (recovered, sold or killed ill) in case we introduce animal health technologies to reduce mortality and morbidity. Have any animals died or were sick during the last few years?
Year No. of large ruminants dead
No. large ruminants sick Age Sex Time of
year? Cause of death or
sickness? What did you do to solve
problem?
2007
2006
2005
2004
2003
How do you sell your cattle or buffaloes and who do you sell them to?
71
……………………………………………………………………………………………………………………… Why do you sell your cattle and buffaloes?.................................................................................................................................................. Additional notes: .......................................................................................................................... ....................................................................................................................................................... ....................................................................................................................................................... Reproductive performance of cows This is an important but difficult part of the study. We would like to get accurate information on 1) the age when each cow had its first calf and 2) the interval between calves in months, since these are closely related to animal health, nutrition and breeding management. To do this we need to ask the household about each of their cows – do not ask generally but specifically for each of their cows. Only record the details of cows they can remember. We would like to find out as much as possible about calving for each of your cows. If we talk first about your youngest cow. How old is she? How many calves has she had so far? How old was she when she had her first calf? When did she have the last calf? Can you remember which month this was? When did she have the calf before the last one? What about the one before that calf? Continue this for all the cows the respondents can remember:
Age now How many calves has she had?
Age when she had her first
calf?
Which month has it had calves in
2007 2006 2005 2004 2003
Cow 1
Cow 2
Cow 3
Cow 4
Cow 5
Cow 6
Cow 7
How do you manage and feed these animals? ............................................................................................................................................................... How do you house your cattle/buffaloes?.............................................................................................
72
…………………………………………………………………………………………………………………….. How do you feed your cattle/buffaloes? What kind of feed do you use? What do you do when there is very little or no feed available? ......................................................................................................................................................................................................................................................................................................................................................................................................................................................................................................... Have any of your cattle been vaccinated? Do you know which kinds of vaccination? What do you know about vaccination for cattle/buffaloes? How did you get this information? ......................................................................................................................................................................................................................................................................................................................................................................................................................................................................................................... Have any of your cattle been treated for internal parasites before? If yes, did this make a difference? What do you know about internal parasite control? How did you get this information? ........................................................................................................................................................................................................................................................................................................................................................................................................................ Have any of your cattle been treated for a disease before? If yes, what did you do? Did this make a difference? …………………………………………………………………………………………………………………………………………………………………………………………………… How do your cows become pregnant? Is this planned? Do you pay for this service? Do you think about the time of year when this occurs? …………………………………………………………………………………………………………………………………………………………………………………………………… Do your cows have difficulty calving? ……………………………………………………………………………………………………………………………………………………………………….. Why do you decide to buy more cattle? ………………………………………………………………………………………………………………………………………………………………………… Why do you decide to sell your cattle? .................................................................................................................... ....................................................................................................................................................... Does the farmer give supplementary feeding to some animals such as working buffaloes. ………………………………………………………………………………………………………………………
73
Seasonal calendar Activities (Feeds / Jobs)
Dec Jan Feb Mar Apr May Jun Jul Aug Sep Oct Nov
Use of Manure – always ask this question How important is manure in your farming system? Do you collect manure? If yes, how do you do this? And who does it? ..................................... ....................................................................................................................................................... How do you use manure (which crops and how much)? ............................................................. ....................................................................................................................................................... Aspirations – always ask this question What opportunities do you see to improve your livelihood? What would you like your farm to look like in 5-10 years? ....................................................................................................................................................... ……………………………………………………………………………………………………………………… Would you consider it worthwhile to spend money on animal health interventions (eg vaccine, de-worming, tick control) to decrease risks of disease? ....................................................................................................................................................... Would you be interested in techniques that increase the likelihood of your cows having more calves in their lifetime (shorter time between calfs being born)? ............................................................................................................................................ ………………………………………………………………………………………………………………………
Low Very
74
Thank you very much for your time Time interview finished: …………………. Notes by interviewer: 1) Contribution of male respondent: 2) Contribution of female respondent: 3) Contribution of other respondents: 4) Confidence in livelihood knowledge 5) Confidence in problem diagnosis 6) Confidence in livestock numbers 7) Confidence in age at first birth 8) Confidence in calving intervals 9) Confidence in mortality/morbidity figures 10) Other impressions: .................................................................................................................
Low High
Low High
Low High
Low High
Low High
Low High
Low High
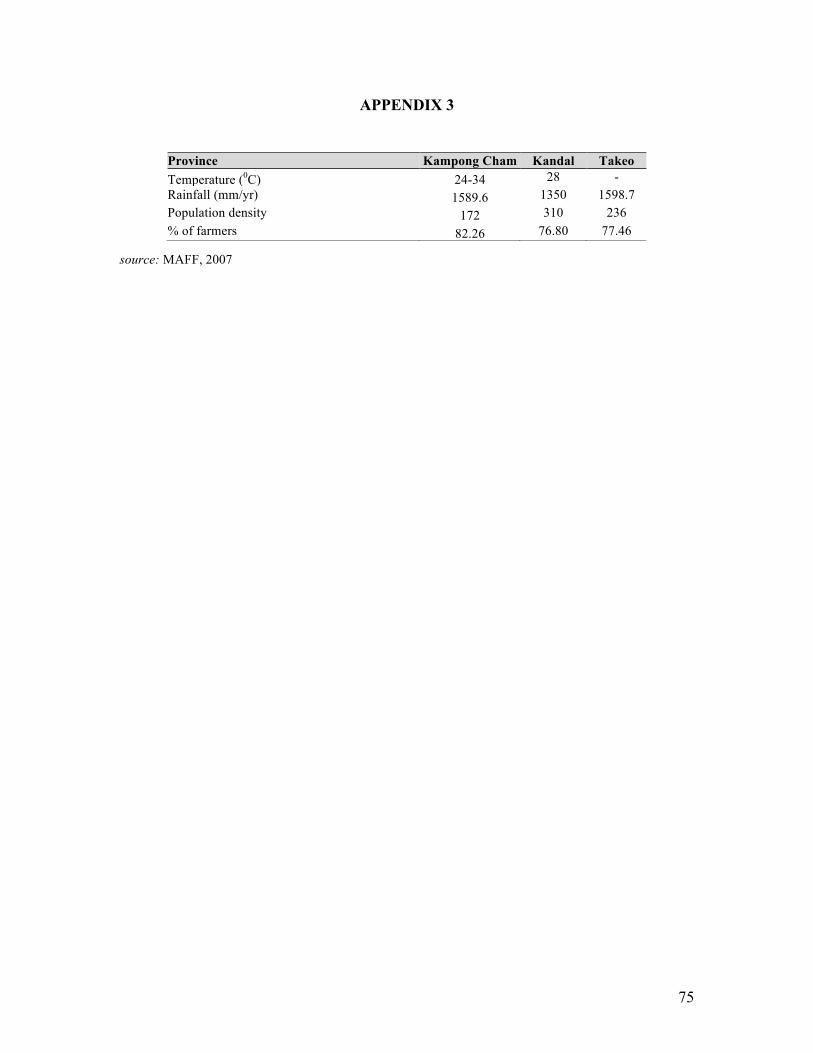
75
APPENDIX 3
source: MAFF, 2007
Province Kampong Cham Kandal Takeo Temperature (0C) 24-34 28 - Rainfall (mm/yr) 1589.6 1350 1598.7 Population density 172 310 236 % of farmers 82.26 76.80 77.46