assessment of right ventricular contractile state with the...
TRANSCRIPT
820 Cardiovascular Research 1995;29:820-826
Assessment of right ventricular contractile state with the conductance catheter technique in the pig
Marc L Dickstein, Osvaldo Yano, Henry M Spotnitz, and Daniel Burkhoff
Objective: Since the conductance catheter method has facilitated evaluation of left ventricular contractile state in both laboratory and clinical studies, the aim of this study was to determine whether the technique is similarly useful for the right ventricle. Methods: A series of right ventricular pressure-volume loops was obtained in seven open chest pigs during transient vena caval occlusion using a 12-electrode conductance catheter. End systolic pressure-volume relationships, stroke work-end diastolic volume relationships, and dP/dt-end diastolic volume relationships were compared at control and during infusion of dobutamine and esmolol. Results: Right ventricular pressure-volume loops generated with the conductance catheter were of a shape consistent with those previously reported by other volume measurement techniques, and responded to changes in inotropic state in a predictable fashion. Dobutamine shifted the three contractile relationships leftward, whereas esmolol shifted them rightward. Comparisons of stroke volume derived with the conductance catheter and with a pulmonary artery flow probe demonstrated the ability of the conductance technique to measure relative volume changes. Conclusions: The conductance catheter provides a continuous measure of right ventricular volume that was used to detect changes in right ventricular contractile state in pigs. This represents a promising and much needed method for the evaluation of right ventricular function. Cardiovascular Research 1995;29:820-826
T he importance of understanding the pathophysiology of right heart failure has become evident recently, especially in the setting of cardiac transplantation and
Methods
left ventricular assist device implantation.’ ’ When occurring in the intraoperative period, right heart failure is associated with difficulty in weaning from cardiopulmonary bypass and with the need for massive pharmacological and mechanical support. In fact, right heart failure is the leading cause of morbidity and mortality following these procedures3
All experimental procedures and protocols used in this investigation were reviewed and approved by the institutional animal care and use committee and are in accordance with the NIH Guide for the care and ux of laboratory animals (NIH publication No 85-23, revised 1985).
Experimental preparation
In order to gain a better understanding of the patho- physiology of right heart failure in an individual patient, it is necessary to be able to assess the independent contri- butions of contractile state, preload, and afterload to overall right ventricular pump function. Determinations of preload and afterload are made relatively straightforwardly by measurements of right ventricular end diastolic pressure and pulmonary impedance, respectively. Quantification of con- tractile state may be accomplished by various analyses of pressure-volume loops that are obtained under different loading conditions. However, the irregular shape and dense trabeculation of the right ventricle complicate many tech- niques for estimation of ventricular volume and therefore impair our ability to quantify right ventricular contractile state.
Conductance catheter measurements of volume have facilitated evaluation of left ventricular contractile state in both laboratory and clinical studies.4 5 The advantages of the conductance catheter for estimating ventricular volume are that it provides a continuous and instantaneous index of ventricular volume, it may be used in the closed chest, and it is relatively simple to use. The purpose of this study was to examine the value of the conductance catheter in characterising right ventricular contractile state. Limitations of the method are also studied.
Seven Digs (30-40 kg) were anaesthetised with isoflurane (2-3%) in 10061 oxygen ifter induct& with intramuscular ketamine (1.0 mg&g-‘) and intravenous sodium thiopentone (10 mg.kg-‘). The lungs were mech- anically ventilated, and ventilatory indices were adjusted to maintain normocarbia, as evidenced by frequent blood gas analyses. Normo- thermia was maintained by the use of two warming blankets and a heating lamp when necessary. The femoral artery was catheterised to monitor systemic blood pressure and to obtain samples for blood gas analysis. A 10 ml capacity 5F balloon tipped catheter (Cordis) was inserted through the femoral vein with its tin situated in the inferior vena cava jusi inferior to the right atrium for the purpose of abrupt alteration of right ventricular preload by vena caval occlusion. Through a midline stemotomy. the- pericardium was opened wide. The pulmonary artery was dissected free from the aorta and a 16 mm perivascular flow probe (Transonics) was placed around the main artery. This flow probe was connected to an ultrasonic flow meter that had a continuous display of cardiac output. Two 5F micromanometer tipped catheters were situated in the right ventricle and pulmonary artery through stab wounds in the right ventricular outflow tract. A 12-electrode (1 .O cm interelectrode spacing) 6F conductance catheter (Webster Laboratories) was inserted into the pulmonary artery just proximal to the flow probe and advanced across the pulmonary valve into the right ventricle. This catheter was connected to a signal conditioner (Leycom 5, Cardiodynamics) which provides the con- ductance signal used for assessing right ventricular volume. This device also measures blood resistivity (p) which is necessary for the estimation of volume; p who measured in each animal before the start of the experimental protocol.
The total conductance signal is not only affected by the conductivity of blood in the chamber in which the catheter is situated, but also by conductive structures that surround the chamber. The contribution to the total conductance signal from these surroundine structures is termed parallel conductance-@,,). We determined V, b; the hypertonic saline technioue” using 5 ml of 5% saline rapidlv mtected into a ueripheral (ear) vein. A typical example is shown in-fig-I. Panel A shows total conductance volume during injection of hypertonic saline with the
College of Physicians and Surgeons, Columbia University, 630 West 168th Street, New York, NY 10032, USA - Department of Anesthesiology: M L Dickstein; Department of Surgery: 0 Yano, H M Spotnitz; Division of Circulatory Physiology: D Burkhoff. Correspondence to Dr Dickstein.
at Colum
bia University H
ealth Sciences Library on F
ebruary 13, 2011cardiovascres.oxfordjournals.org
Dow
nloaded from
Right ventricular contractility and conductance technique 821
I I I
0 1 2 3 4 5 0 1 2 3 4 5
Time k.) Time Ls)
20 60 100 140 0 1 2 3 4 5
Vc,,, (ml) Time (s)
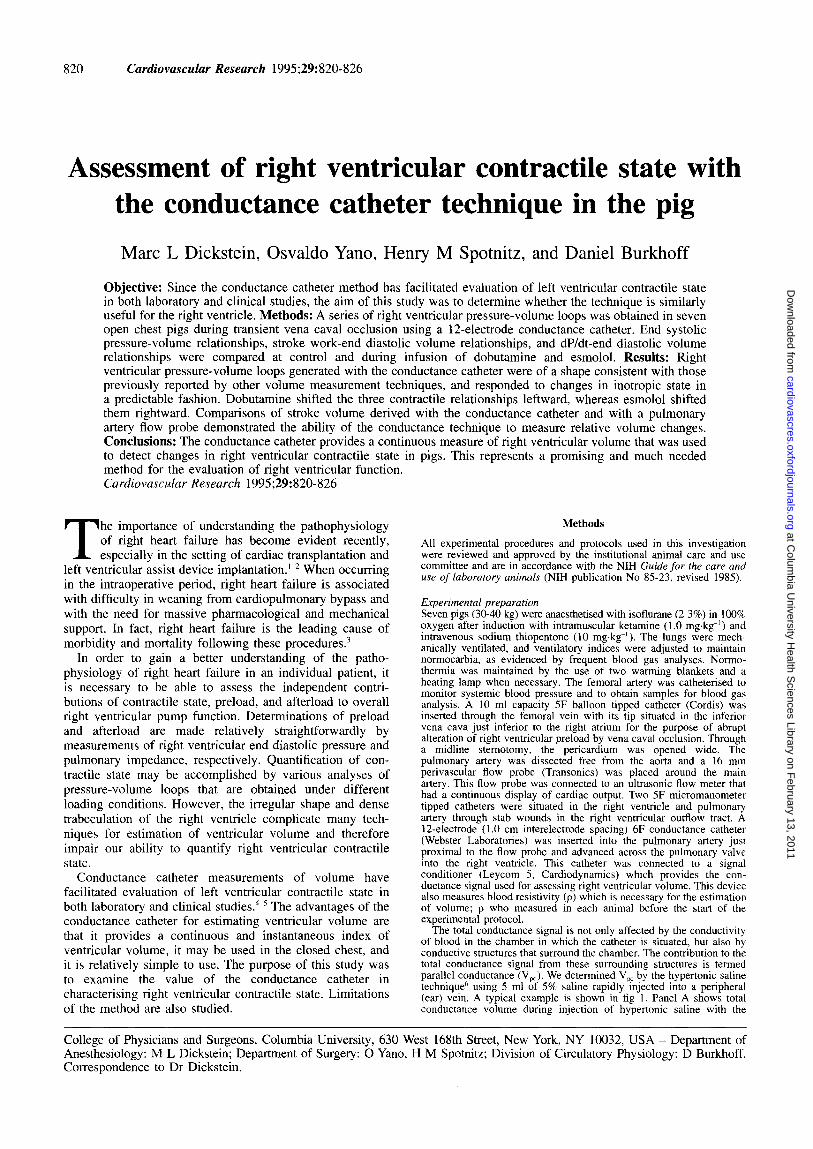
Figure I Panel A shows total conductance volume (Vc) during injection of hypertonic saline with the maximum and minimum values for each cardiac cycle identijied. Panel B shows the plot of maximum versus minimum conductance volumes, the linear regression line through these points, and the line of identity. Parallel conductance volume (V,,) is determined by the intersection of these two lines. This technique assumes that right ventricular volume and function remain constant throughout the conductivity transient. Panels C and D demonstrate that right ventricular pressure and peak dP/dt are not affected by the hypertonic saline injection.
maximum and minimum values for each cardiac cycle identified by the circles and crosses, respectively. Panel B of the same figure shows the plot of maximum versus minimum conductance, the linear regression line through these points, and the line of identity. V,, is determined by the intersection of these two lines. This technique assumes that the saline alters conductivity of right ventricular blood while actual right ventricular volume and left ventricular conductivity is unchanged. As shown in panels C and D, there were no changes in right ventricular end diastolic pressure, peak right ventricular pressure, or peak right ventricular dP/dt during the conductivity transient, indicating that the assumptions about the right ventricle are reasonable. Maximum and minimum conductance data during only the ascending limb of the conductivity transient were used for estimation of V, to minimise the chance of left ventricular conductivity alterations. If the correlation coefficient of the linear regression was less than 0.85, the data were ignored and V, was remeasured. V,, was measured in each animal before the start of the experimental protocol, and was found to range from 53 to 98 ml in the seven animals tested [table I].
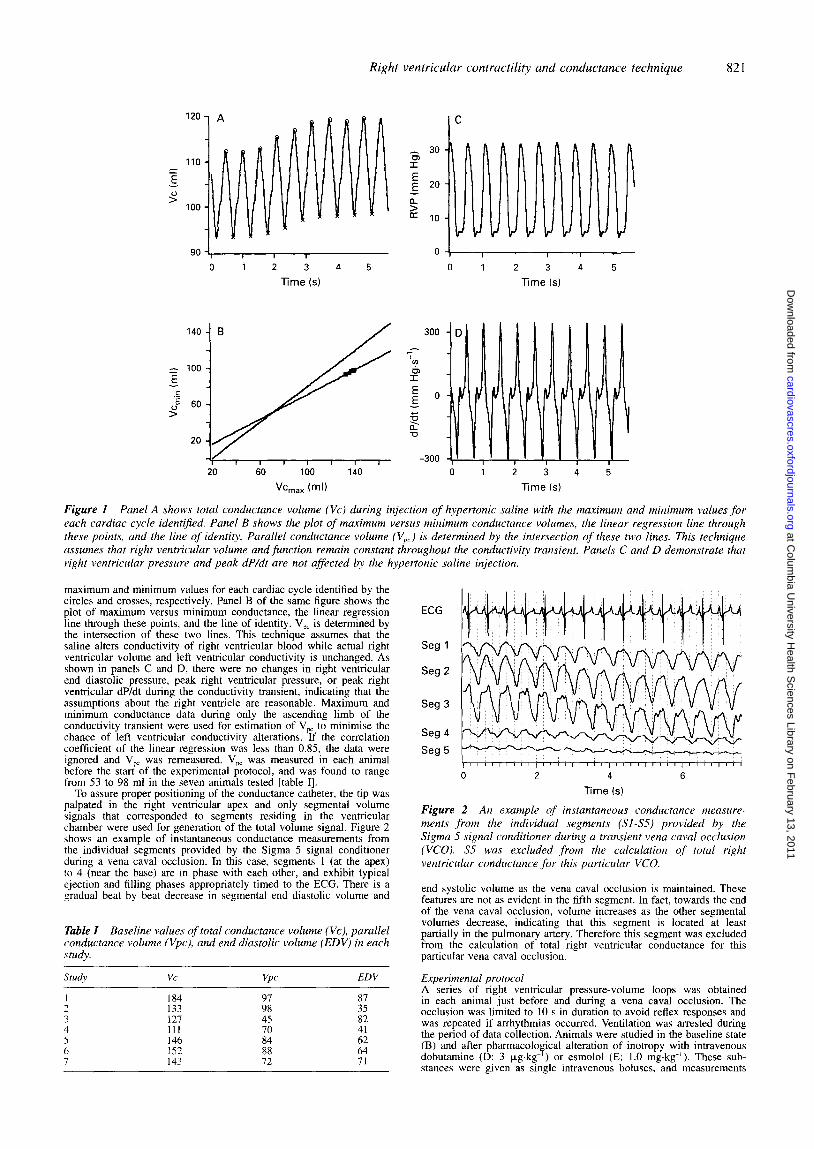
To assure proper positioning of the conductance catheter, the tip was palpated in the right ventricular apex and only segmental volume signals that corresponded to segments residing in the ventricular chamber were used for generation of the total volume signal. Figure 2 shows an example of instantaneous conductance measurements from the individual segments provided by the Sigma 5 signal conditioner during a vena caval occlusion. In this case, segments 1 (at the apex) to 4 (near the base) are in phase with each other, and exhibit typical ejection and filling phases appropriately timed to the ECG. There is a gradual beat by beat decrease in segmental end diastolic volume and
Table I Baseline values of total conductance volume (Vc), parallel conductance volume (Vpc), and end diastolic volume (EDV) in each study.
Study VC VPC EDV
1 184 2 133 ;i 3s; A 121 45 82 4 111 70 41 5 146 6 152 ii ii: 7 143 72 71
ECG
Seg 1
Seg 2
Seg 3
Seg 4
Seg 5
0 2 4 6
Time (s)
Figure 2 An example of instantaneous conductance measure- ments from the individual segments (Sl-S5) provided by the Sigma 5 signal conditioner during a transient vena caval occlusion (VCO). S5 wus excluded from the calculation of total right ventricular conductance for this particular VCO.
end systolic volume as the vena caval occlusion is maintained. These features are not as evident in the fifth segment. In fact, towards the end of the vena caval occlusion, volume increases as the other segmental volumes decrease, indicating that this segment is located at least partially in the pulmonary artery. Therefore this segment was excluded from the calculation of total right ventricular conductance for this particular vena caval occlusion.
Experimental protocol A series of right ventricular pressure-volume loops was obtained in each animal just before and during a vena caval occlusion. The occlusion was limited to 10 s in duration to avoid reflex responses and was repeated if arrhythmias occurred. Ventilation was arrested during the period of data collection. Animals were studied in the baseline state (B) and after pharmacological alteration of inotropy with intravenous dobutamine (D: 3 pg.kg- ) or esmolol (E: 1.0 mg.kg-‘). These sub- stances were given as single intravenous boluses, and measurements
at Colum
bia University H
ealth Sciences Library on F
ebruary 13, 2011cardiovascres.oxfordjournals.org
Dow
nloaded from
822 Dickstein, Yano, Spotnitz, Burkhoff
were made 30 s after observing a change in heart rate or mean arterial pressure. Baseline measurements were made first, followed by administration of one of the two inotropic agents chosen randomly. After arterial pressure and cardiac output had returned to their baseline level, the other inotropic agent was administered and a third series of right ventricular pressure-volume loops was obtained.
Data ana/wi.s All analogue signals were digitised at 200 Hz using a 12 bit A-D board and stored on a removable hard drive for subsequent analysis using IGOR analysis software (WaveMetrics).
Pressure, flow, and volume data were subjected to five pass binomial smoothing (Gaussian filtering). End diastolic pressure was identified as the point just preceding the upstroke of the right ventricular pressure wave. End diastolic volume (EDV) was determined by the lower right hand comer of the pressure-volume loop. End ejection volume was determined by the average volume signal during the 25 ms that followed peak negative dP/dt. Conductance derived stroke volume (SVc) was assigned the difference between these two volumes. Ejection fraction was defined by SVc/EDV. Flow derived stroke volume (SVf) was determined by integrating the pulmonary artery flow signal over the individual cardiac cycle.
Three relationship\ that describe ventricular contractile state were examined during the vena caval occlusion.
(I 1 End systolic pre.ssure-volume relationship (ESPVR) - The slope (Ees) and volume axis intercept (Vo) of the ESPVR were determined as in previous studies.(’ Briefly, Vo was initially assumed to be 0 ml and values for end systolic pressure and end systolic volume were determined for each cardiac cycle by identifying the point at which the value of P(t)/(V(t)-Vo) reached a maximum. Regression analysis of these end systolic pressure and volume points provided an improved estimate of Vo. This updated Vo value was then substituted into the above equation and new values for end systolic pressure and volume were obtained. Subsequent iterations were performed until the value of Vo changed by less than 2 ml.
(2) Stroke work-end diastolic volume relationship (SWEDV) - Stroke work was determined for each cardiac cycle by calculating the area within the respective pressure-volume loop. SWEDV was defined by the relationship between stroke work and end diastolic volume.
(3) dP/dt,,,,,-end diustolir volume relationship (dP/dt EDV) - Right ventricular pressure was mathematically differentiated to calculate right ventricular dP/dt. The peak value of dP/dt during each cardiac cycle was identified. dP/dt EDV was defined by the relationship between peak dP/dt and the end diastolic volume.
At least seven cardiac cycles free of arrhythmias were used for each analysis.
Statistical anulvsis Each relationship (ESPVR, SWEDV, dP/dt EDV) was described by a slope (m) and a volume axis intercept (Vo) obtained from linear regression analysis. The principal test used to determine whether each of the three relationships varied in response to inotropic manipulation was analysis of covariance in which dummy variables coded for experiment number and the presence of a particular inotrope.7 P values were adjusted by the Bonferroni correction to account for multiple comparisons (C versus D, and C versus E). In addition, the effect of inotropic condition on m and Vo considered as independent variables was assessed by analysis of variance. The impact of inotropic drugs on standard haemodynamic variables was also assessed by analysis of variance. Bonferroni correction was applied to account for the fact that comparisons were made between multiple groups. In order to test linearity of some relationships, second order polynomials were fitted to the data; if the 95% confidence interval of the parameter of the squared term included zero, then the relationship was considered to be linear.
Results
Haemodynamic data measured at each inotropic state are presented in table II. Dobutamine caused increases in heart rate and cardiac output (P < 0.01, P < 0.05) as compared with baseline. Esmolol caused reductions in cardiac output, mean arterial pressure, and ejection fraction (P < 0.05) as compared with baseline.
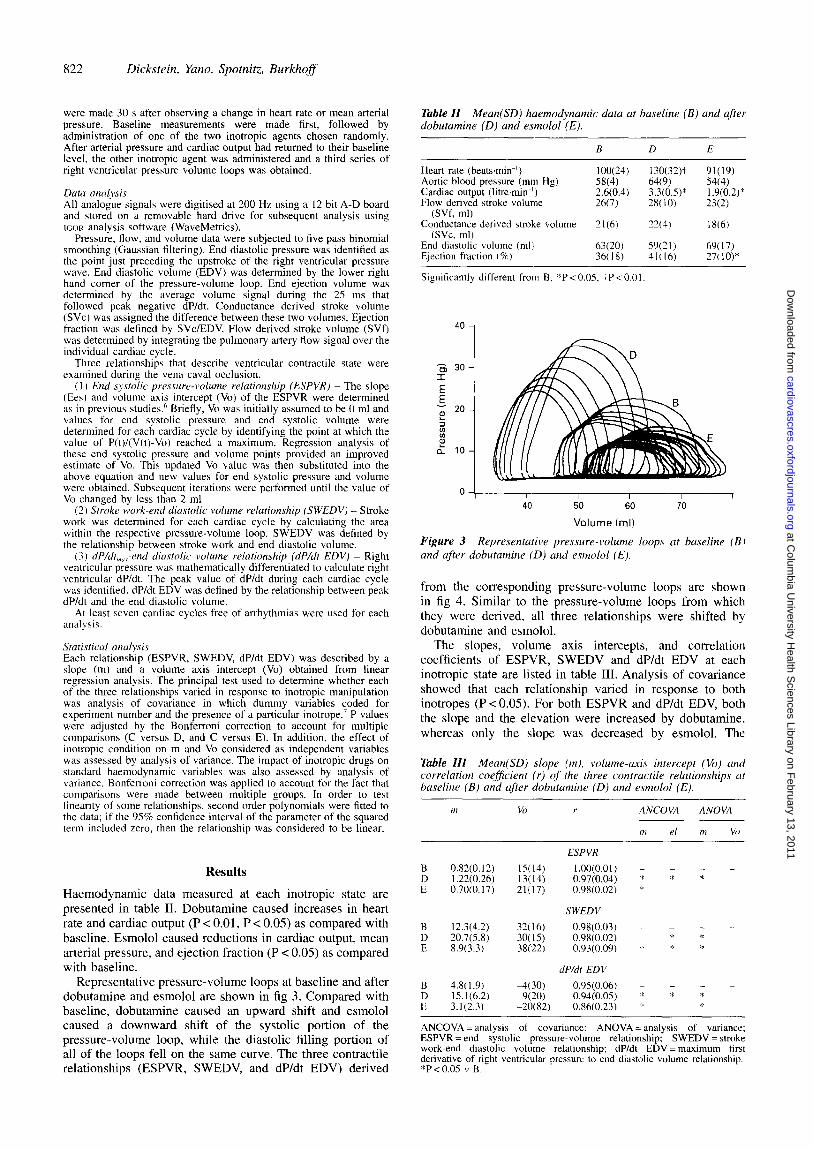
Representative pressure-volume loops at baseline and after dobutamine and esmolol are shown in fig 3. Compared with baseline, dobutamine caused an upward shift and esmolol caused a downward shift of the systolic portion of the pressure-volume loop, while the diastolic filling portion of all of the loops fell on the same curve. The three contractile relationships (ESPVR, SWEDV, and dP/dt EDV) derived
Table ZZ Mean haemodynamic data at baseline (B) and after dobutamine (D) and esmolol (E).
B D E
Heart rate (beats,min-‘) lOO(24) 130(32)t 91(19) Aortic blood pressure (mm Hg) 58(4) 64(9) 54(4) Cardiac output (litre.min?) 2.6(0.4) 3.3(0.5)* 1.9(0.2)* Flow derived stroke volume 2fO) 2X(10) 2X2)
(SVf, ml) Conductance derived stroke volume 21(6) 22(4) 1 X(6)
(SVc, ml) End diastolic volume (ml>’ 63(20) 59(21) 69(17) Ejection fraction (W) 36(18) 41(16) 27(10)*
Significantly different from B, *P < 0.05. +P < 0.0 I
4o 1
s 30- I
E 2
20 -
ii : & lo-
0 \ I I I 1 I 40 50 60 70
Volume (ml)
Figure 3 Representative pressure-volume loops at baseline (BI and qfter dobutamine (D) and esmolol (E).
from the corresponding pressure-volume loops are shown in fig 4. Similar to the pressure-volume loops from which they were derived, all three relationships were shifted by dobutamine and esmolol.
The slopes, volume axis intercepts, and correlation coefficients of ESPVR, SWEDV and dP/dt EDV at each inotropic state are listed in table III. Analysis of covariance showed that each relationship varied in response to both inotropes (P<O.O5). For both ESPVR and dP/dt EDV, both the slope and the elevation were increased by dobutamine, whereas only the slope was decreased by esmolol. The
Table ZZZ Mean slope (m), volume-axis intercept (Vo) and correlation coeficient (r) of the three contractile relationships ot baseline (B) and after dobutamine (0) and esmolol (E).
m VO r ANCOVA ANOVA ___ - I,, el m Vi)
ESPVR
B 0.82(0.12) 15(14) 1.00(0.01) - - - I .22(0.26) 13(14) 0.97(0.04) * * * 0.70(0.17) 21(17) 0.98(0.02) *
SWEDV
12.3(4.2) 32(16) 0.98(0.03) - - - - 20.7(X3) 30(15) 0.98(0.02) *
E 8.9(3.3) 38(22) 0.93(0.09) 4 z *
dP/dt EDV
B 4.8( 1.9) -4(30) 0.95(0.06) - - D 15.1(6.2) WQ 0.94(0.05) * * * E 3.1(2.3) -20(82) 0.86(0.23) * *
ANCOVA = analysis of covariance: ANOVA = analysis of variance; ESPVR = end systolic pressure-volume relationship; SWEDV = stroke work-end diastolic volume relationship; dP/dt EDV = maximum first derivative of right ventricular pressure to end diastolic volume relationship. *P < 0.05 17 B.
at Colum
bia University H
ealth Sciences Library on F
ebruary 13, 2011cardiovascres.oxfordjournals.org
Dow
nloaded from
Right ventricular contractility and conductance technique 823
50 - ESPVR
40 50 60
End systolic volume (ml)
SWEDV 800 -
z
40 50 60 70 80 90
End diastolic volume (ml)
_ IOOO- dP/dt EDV ‘i
40 50 60 70 80 90
End diastolic volume (ml)
Figure 4 Representative data measured at baseline (B), after dobutamine (D), and after esmolol (E). The top panel shows the effect of inotropic state on end systolic pressure-volume relation- ship (ESPVR), the middle panel shows stroke work-end diastolic volume relationship (SWEDV), and the bottom panel shows dP/dt- end diastolic volume relationship (dP/dt EDV).
elevation of SWEDV was increased by dobutamine, whereas both the slope and elevation were decreased by esmolol. When m and Vo were treated as statistically independent parameters, analysis of variance showed that the slopes of all three relationships were increased by dobutamine (P < 0.05), but only the slopes of SWEDV and dP/dt EDV were decreased by esmolol (PC 0.05); the slope of the ESPVR was not affected by esmolol. None of the changes in Vo achieved statistical significance.
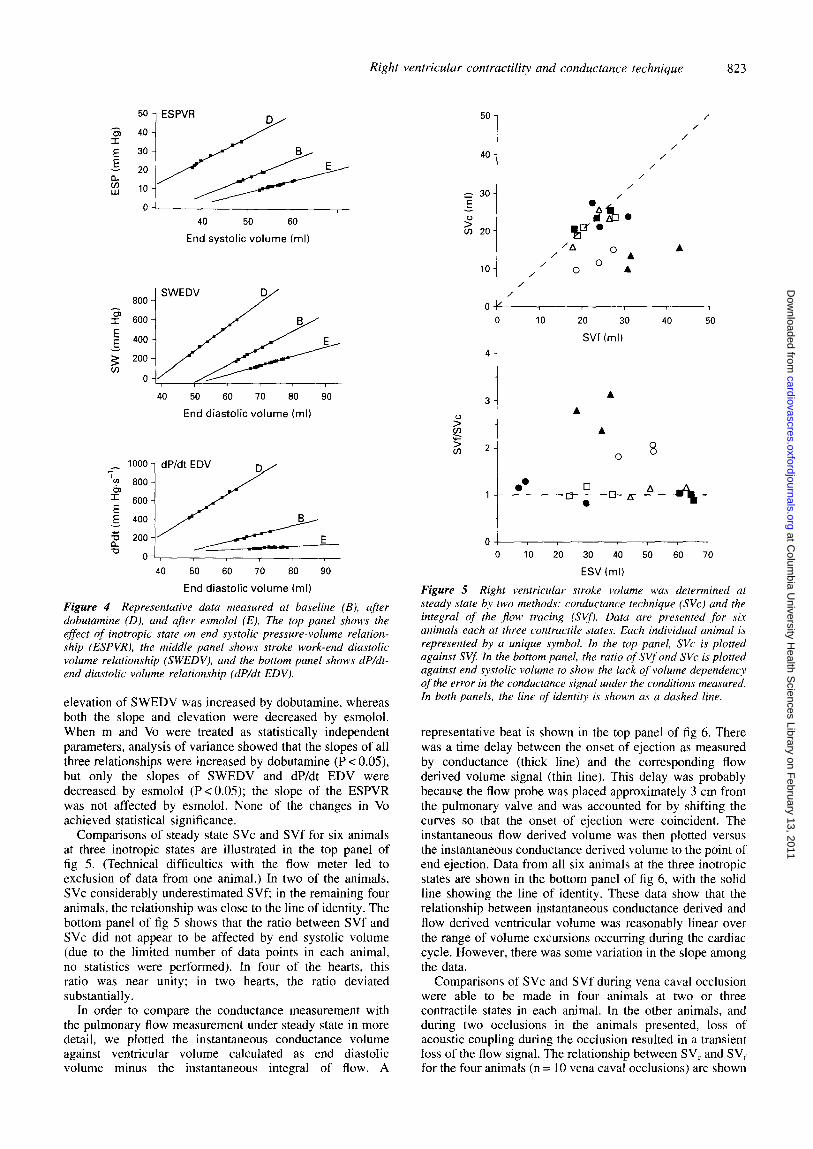
Comparisons of steady state SVc and SVf for six animals at three inotropic states are illustrated in the top panel of fig 5. (Technical difficulties with the flow meter led to exclusion of data from one animal.) In two of the animals, SVc considerably underestimated SVf; in the remaining four animals, the relationship was close to the line of identity. The bottom panel of fig 5 shows that the ratio between SVf and SVc did not appear to be affected by end systolic volume (due to the limited number of data points in each animal, no statistics were performed). In four of the hearts, this ratio was near unity; in two hearts, the ratio deviated substantially.
In order to compare the conductance measurement with the pulmonary flow measurement under steady state in more detail, we plotted the instantaneous conductance volume against ventricular volume calculated as end diastolic volume minus the instantaneous integral of flow. A
4-
3-
2-
0. I-- - -
A
A
A
0 8
Figure 5
Ok, 0 10 20 30 40 50 60 70
ESV (ml)
Right ventricular stroke volume was determined at steady state by two methods: conductance technique (NC) and the integral of the flow tracin,q (SVf). Data are presented for six animals each at three contractile states. Each individual animal is represented by a unique symbol. In the top panel, SVc is plotted against SVf: In the bottom panel, the ratio of SVf and SVc is plotted against end systolic volume to show the lack of volume dependency of the error in the conductance signal under the conditions measured. In both panels, the line of identitv is shown as a dashed line.
u. ?I 'A
/ OA A
10 / / 0 O A
/
0 IO 20 30 40 50
SW (ml)
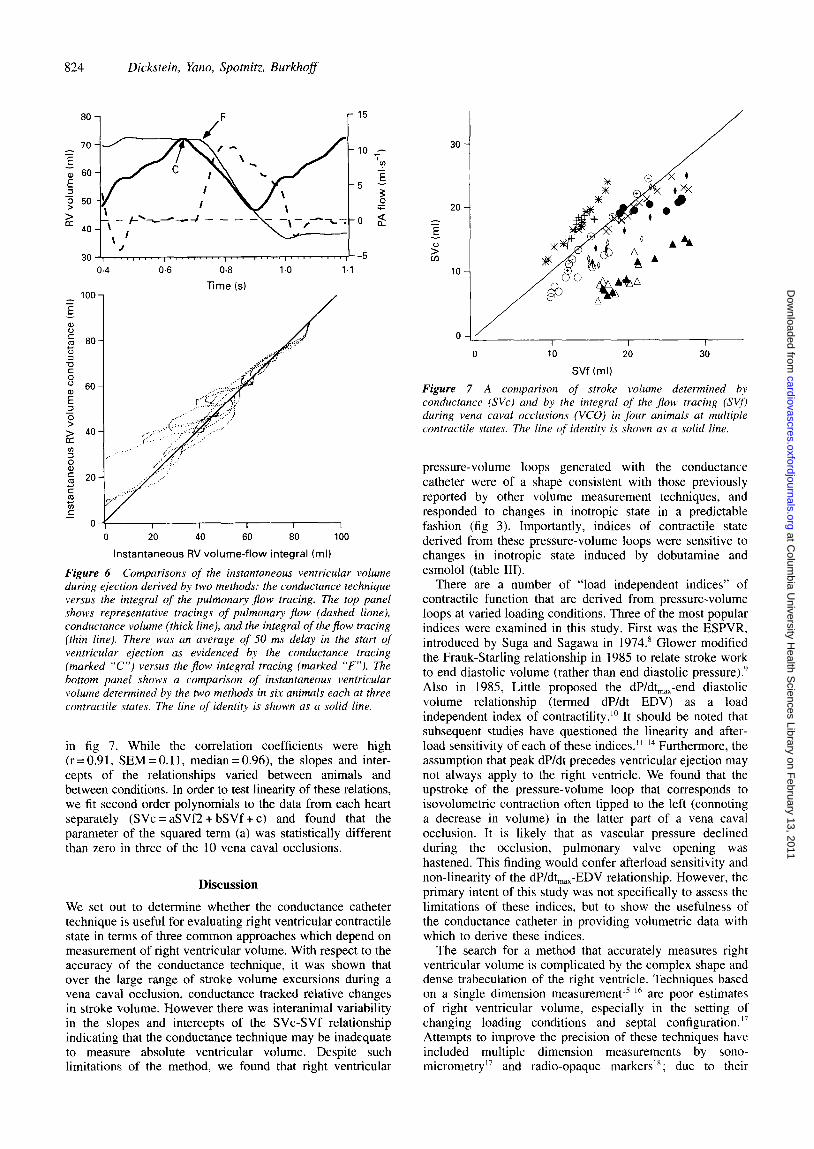
representative beat is shown in the top panel of fig 6. There was a time delay between the onset of ejection as measured by conductance (thick line) and the corresponding flow derived volume signal (thin line). This delay was probably because the flow probe was placed approximately 3 cm from the pulmonary valve and was accounted for by shifting the curves so that the onset of ejection were coincident. The instantaneous tlow derived volume was then plotted versus the instantaneous conductance derived volume to the point of end ejection. Data from all six animals at the three inotropic states are shown in the bottom panel of fig 6, with the solid line showing the line of identity. These data show that the relationship between instantaneous conductance derived and flow derived ventricular volume was reasonably linear over the range of volume excursions occurring during the cardiac cycle. However, there was some variation in the slope among the data.
Comparisons of SVc and SVf during vena caval occlusion were able to be made in four animals at two or three contractile states in each animal. In the other animals, and during two occlusions in the animals presented, loss of acoustic coupling during the occlusion resulted in a transient loss of the flow signal. The relationship between SV, and SVI- for the four animals (n = 10 vena caval occlusions) are shown
at Colum
bia University H
ealth Sciences Library on F
ebruary 13, 2011cardiovascres.oxfordjournals.org
Dow
nloaded from
824 Dickstein, Yano, Spotnitz, Burkhoff
r l5
0
0.6 0.8
Time (s)
I I I I I 0 20 40 60 80 100
Instantaneous RV volume-flow integral (ml)
Figure 6 Comparisons of the instantaneous ventricular volume during ejection derived by two methods: the conductance technique versus the integral of the pulmonary flow tracing. The top panel shows representative tracings of pulmonary flow {dashed hone), conductance volume {thick line), and the integral of theflow tracing (thin line). There was an average of 50 ms delay in the start of ventricular ejection as evidenced by the conductance tracing (marked “C”) versus the flow integral tracing (marked “F”). The bottom panel shows a comparison of instantaneous ventricular volume determined by the two methods in six animals each at three contractile states. The line of identity is shown as a solid line.
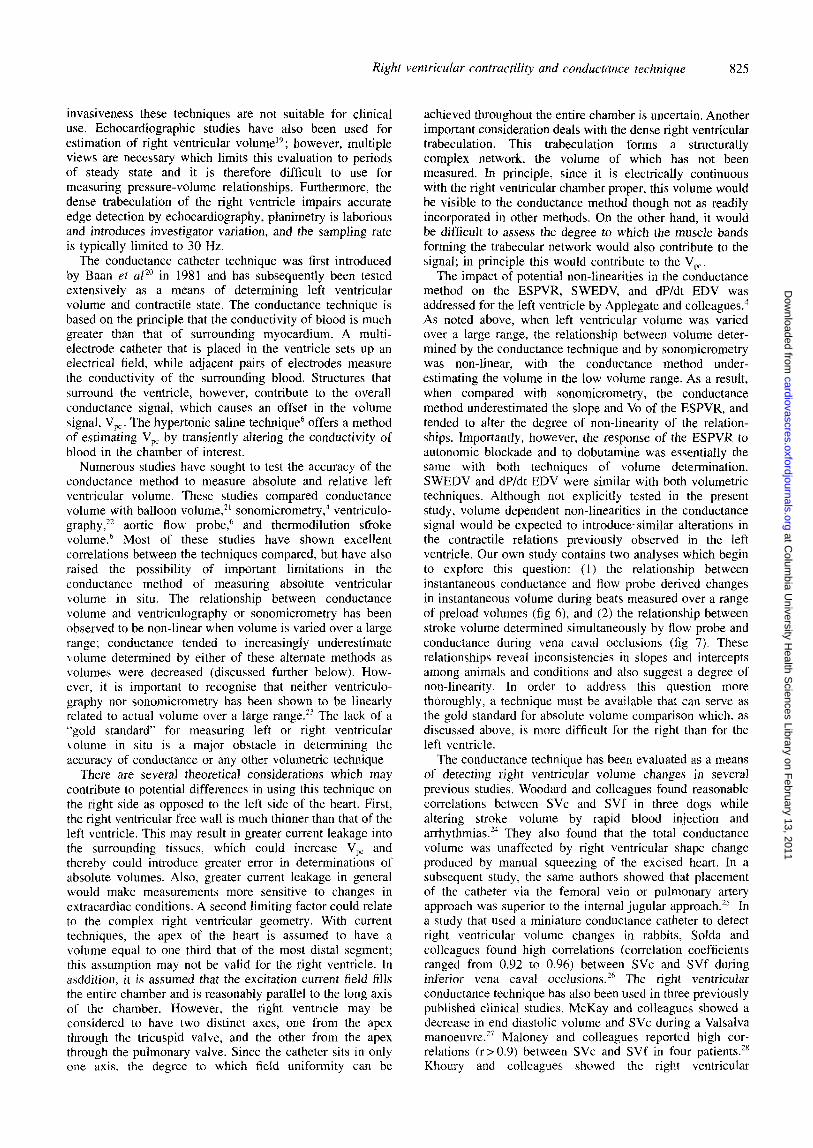
in fig 7. While the correlation coefficients were high (r = 0.9 1, SEM = 0.11, median = 0.96) the slopes and inter- cepts of the relationships varied between animals and between conditions. In order to test linearity of these relations, we fit second order polynomials to the data from each heart separately (SVc = aSVf2 + bSVf + c) and found that the parameter of the squared term (a) was statistically different than zero in three of the 10 vena caval occlusions.
Discussion
We set out to determine whether the conductance catheter technique is useful for evaluating right ventricular contractile state in terms of three common approaches which depend on measurement of right ventricular volume. With respect to the accuracy of the conductance technique, it was shown that over the large range of stroke volume excursions during a vena caval occlusion, conductance tracked relative changes in stroke volume. However there was interanimal variability in the slopes and intercepts of the SVc-SVf relationship indicating that the conductance technique may be inadequate to measure absolute ventricular volume. Despite such limitations of the method, we found that right ventricular
20
2
E 0
2 10
I
I I I 0 10 20 30
SW (ml)
Figure 7 A comparison of stroke volume determined bv conductance (SVc) and by the integral of the flow tracing (SV$ during vena caval occlusions (VCO) in four animals at multiple contractile states. The line of identity is shown as a solid line.
pressure-volume loops generated with the conductance catheter were of a shape consistent with those previously reported by other volume measurement techniques, and responded to changes in inotropic state in a predictable fashion (fig 3). Importantly, indices of contractile state derived from these pressure-volume loops were sensitive to changes in inotropic state induced by dobutamine and esmolol (table III).
There are a number of “load independent indices” of contractile function that are derived from pressure-volume loops at varied loading conditions. Three of the most popular indices were examined in this study. First was the ESPVR, introduced by Suga and Sagawa in 1974.” Glower modified the Frank-Starling relationship in 1985 to relate stroke work to end diastolic volume (rather than end diastolic pressure).’ Also in 1985, Little proposed the dP/dt,,,-end diastolic volume relationship (termed dP/dt EDV) as a load independent index of contractility.“’ It should be noted that subsequent studies have questioned the linearity and after- load sensitivity of each of these indices.‘“’ Furthermore, the assumption that peak dP/dt precedes ventricular ejection may not always apply to the right ventricle. We found that the upstroke of the pressure-volume loop that corresponds to isovolumetric contraction often tipped to the left (connoting a decrease in volume) in the latter part of a vena caval occlusion. It is likely that as vascular pressure declined during the occlusion, pulmonary valve opening was hastened. This finding would confer afterload sensitivity and non-linearity of the dP/dt,,,-EDV relationship. However, the primary intent of this study was not specifically to assess the limitations of these indices, but to show the usefulness of the conductance catheter in providing volumetric data with which to derive these indices.
The search for a method that accurately measures right ventricular volume is complicated by the complex shape and dense trabeculation of the right ventricle. Techniques based on a single dimension measurement” ” are poor estimates of right ventricular volume, especially in the setting of changing loading conditions and septal configuration.‘7 Attempts to improve the precision of these techniques have included multiple dimension measurements by sono- micrometry ” and radio-opaque markers’*; due to their
at Colum
bia University H
ealth Sciences Library on F
ebruary 13, 2011cardiovascres.oxfordjournals.org
Dow
nloaded from
Right ventricular contractility and conductance technique 825
invasiveness these techniques are not suitable for clinical use. Echocardiographic studies have also been used for estimation of right ventricular volumel”; however, multiple views are necessary which limits this evaluation to periods of steady state and it is therefore difficult to use for measuring pressure-volume relationships. Furthermore, the dense trabeculation of the right ventricle impairs accurate edge detection by echocardiography, planimetry is laborious and introduces investigator variation, and the sampling rate is typically limited to 30 Hz.
The conductance catheter technique was first introduced by Baan er al” in 1981 and has subsequently been tested extensively as a means of determining left ventricular volume and contractile state. The conductance technique is based on the principle that the conductivity of blood is much greater than that of surrounding myocardium. A multi- electrode catheter that is placed in the ventricle sets up an electrical field, while adjacent pairs of electrodes measure the conductivity of the surrounding blood. Structures that surround the ventricle, however, contribute to the overall conductance signal, which causes an offset in the volume signal, V,, . The hypertonic saline technique6 offers a method of estimating V,, by transiently altering the conductivity of blood in the chamber of interest.
Numerous studies have sought to test the accuracy of the conductance method to measure absolute and relative left ventricular volume. These studies compared conductance volume with balloon volume,” sonomicrometry,” ventriculo- graphy,12 aortic flow probe,’ and thermodilution st’roke volume.6 Most of these studies have shown excellent correlations between the techniques compared, but have also raised the possibility of important limitations in the conductance method of measuring absolute ventricular volume in situ. The relationship between conductance volume and ventriculography or sonomicrometry has been observed to be non-linear when volume is varied over a large range; conductance tended to increasingly underestimate volume determined by either of these alternate methods as volumes were decreased (discussed further below). How- ever, it is important to recognise that neither ventriculo- graphy nor sonomicrometry has been shown to be linearly related to actual volume over a large range.‘” The lack of a “gold standard’ for measuring left or right ventricular \,olume in situ is a major obstacle in determining the accuracy of conductance or any other volumetric technique
There are several theoretical considerations which may contribute to potential differences in using this technique on the right side as opposed to the left side of the heart. First, the right ventricular free wall is much thinner than that of the left ventricle. This may result in greater current leakage into the surrounding tissues, which could increase V,, and thereby could introduce greater error in determinations of absolute volumes. Also, greater current leakage in general would make measurements more sensitive to changes in extracardiac conditions. A second limiting factor could relate to the complex right ventricular geometry. With current techniques, the apex of the heart is assumed to have a volume equal to one third that of the most distal segment; this assumption may not be valid for the right ventricle. In asddition, it is assumed that the excitation current field fills the entire chamber and is reasonably parallel to the long axis of the chamber. However, the right ventricle may be considered to have two distinct axes, one from the apex through the tricuspid valve, and the other from the apex through the pulmonary valve. Since the catheter sits in only one axis. the degree to which field uniformity can be
achieved throughout the entire chamber is uncertain. Another important consideration deals with the dense right ventricular trabeculation. This trabeculation forms a structurally complex network, the volume of which has not been measured. In principle. since it is electrically continuous with the right ventricular chamber proper, this volume would be visible to the conductance method though not as readily incorporated in other methods. On the other hand, it would be difficult to assess the degree to which the muscle bands forming the trabecular network would also contribute to the signal; in principle this would contribute to the V,.
The impact of potential non-linearities in the conductance method on the ESPVR, SWEDV, and dP/dt EDV was addressed for the left ventricle by Applegate and colleagues.’ AS noted above, when left ventricular volume was varied over a large range, the relationship between volume deter- mined by the conductance technique and by sonomicrometry was non-linear, with the conductance method under- estimating the volume in the low volume range. As a result, when compared with sonomicrometry, the conductance method underestimated the slope and Vo of the ESPVR, and tended to alter the degree of non-linearity of the relation- ships. Importantly, however, the response of the ESPVR to autonomic blockade and to dobutamine was essentially the same with both techniques of volume determination. SWEDV and dP/dt EDV were similar with both volumetric techniques. Although not explicitly tested in the present study, volume dependent non-linearities in the conductance signal would be expected to introducesimilar alterations in the contractile relations prev.iously observed in the left ventricle. Our own study contains two analyses which begin to explore this question: (1) the relationship between instantaneous conductance and flow probe derived changes in instantaneous volume during beats measured over a range of preload volumes (fig 6) and (2) the relationship between stroke volume determined simultaneously by flow probe and conductance during vena caval occlusions (fig 7). These relationships reveal inconsistencies in slopes and intercepts among animals and conditions and also suggest a degree of non-linearity. In order to address this question more thoroughly, a technique must be available that can serve as the gold standard for absolute volume comparison which, as discussed above, is more difficult for the right than for the left ventricle.
The conductance technique has been evaluated as a means of detecting right ventricular volume changes in several previous studies. Woodard and colleagues found reasonable correlations between SVc and SVf in three dogs while altering stroke volume by rapid blood injection and arrhythmias.*” They also found that the total conductance volume was unaffected by right ventricular shape change produced by manual squeezing of the excised heart. In a subsequent study, the same authors showed that placement of the catheter via the femoral vein or pulmonary artery approach was superior to the internal jugular approach.” In a study that used a miniature conductance catheter to detect right ventricular volume changes in rabbits, Solda and colleagues found high correlations (correlation coefficients ranged from 0.92 to 0.96) between SVc and SVf during inferior vena caval occlusionsZ6 The right ventricular conductance technique has also been used in three previously published clinical studies. McKay and colleagues showed a decrease in end diastolic volume and SVc during a Valsalva manoeuvre.27 Maloney and colleagues reported high cor- relations (r> 0.9) between SVc and SVf in four patients.2” Khoury and colleagues showed the right ventricular
at Colum
bia University H
ealth Sciences Library on F
ebruary 13, 2011cardiovascres.oxfordjournals.org
Dow
nloaded from
826 Dickstein, Yano, Spotnitz, Burkhoff
conductance technique to be useful in distinguishing haemo- dynamically stable from unstable arrhythmias.29
Right ventricular performance has been evaluated by pressure-volume loops in the isolated canine heart,30 in conscious dogs3’ and in the human heart3* Karunanithi et a13’ determined right ventricular volume by the ellipsoidal shell subtraction method and looked at the effect of calcium on the same three contractile relationships examined in the present study. They found that the slope of the SWEDV relationship increased in response to calcium administration, while the Vo of both ESPVR and dP/dt EDV was shifted to the left. These results are consistent with the present study in that all three relationships could reflect changes in contractile state. The present study additionally shows that these relationships are adequate to reflect pharmacologically induced depression of contractile state.
In conclusion, we have shown that the conductance catheter provides a continuous signal which varies with right ventricular volume and which may be used to detect changes in right ventricular pressure-volume relationships in response to both positive and negative inotropic agents. There was a strong correlation between SVf and SVc over a broad range of preload conditions. However, further work is needed to test the ability of this technique to measure absolute volume. Even if proven to be inadequate for absolute volume determinations, the ability to detect acute changes in contractile state with reasonable accuracy could prove useful in a number of clinical settings. As such, the conductance catheter represents a promising and much needed method for the clinical evaluation of right ventricular function. In view of these findings, the difficult task of further testing the accuracy and utility of conductance catheter based assessment of right ventricular volume and contractile state in the clinical setting seems warranted.
This work was supported in part by an NIH ROI award HL48109-03.
Key terms: contractility; right heart; contracility measurements; ventricular performance; volume.
Received 10 August 1994; accepted 25 January 1995. Time for primary review 21 days.
1
2
3
4
5
6
7
8
9
10
Addonizio LJ, Gersony WM, Robbins RC, et al. Elevated pulmonary vascular resistance and cardiac transplantation. Circulation 1987;76:V52-5. Kormos RL, Borovetz HS, Gasior T, et al. Experience with univentricular suouort in mortallv ill cardiac transulant candidates. Ann Thorac Surg’l990;49:261-52.
1
Kirklin JK, Naftel DC, McGiffin DC, McVay RF, Blackstone EH, Karp RB. Analysis of morbid events and risk factors for death after cardiac transnlantation. J Am Coil Cardiol 1988:2:917-24. Applegate RJ, Chkng CP, Little WC. Simultaneous conductance catheter and dimension assessment of left ventricular volume in the intact animal. Circulation 1990;81:638-48. Kass DA, Midie M, Graves W, Brinker JA, Maughan WL. Use of a conductance tvolumel catheter and transient inferior vena caval occlusion for rapid dete’rmination of pressure-volume relationships in man. Cathet Cardiovasc Diaan 1988:15:192-202. Baan J, Enno T, Van Der Velde ET, et al. Continuous measurement of left ventricular volume in animals and humans by conductance catheter. Circulation 1984;70:812-23. Slinker BK, Glantz SA. Multiple linear regression is a useful alternative to traditional analysis of variance. Am J Physiol 1988;255:R353-67. Suga H, Sagawa K. Instantaneous pressure-volume relationships and their ratio in the excised, supported canine left ventricle. Circ Res 1974;35: 117-26. Glower DD. Suratt JA. Snow ND. et al. Linearitv of the Frank- Starling relationship in the intact heart: the concept of preload recruitable stroke work. Circulation 1985;71:994-1009. Little WC. The left ventricular dP/dt-max-end-diastolic volume relation in closed chest dogs. Circ Res 1985;56:808-15.
11
12
13
14
15
16
17
18
19
20
21
22
23
24
25
26
27
28
29
30
31
32
Burkhoff D, Sugiura S, Yue D, Sagawa K. Contractility-dependent curvilinear&y of end-systolic pressure-volume relations. Am J Physiol 1987;252:H1218-27. Maughan WLM, Sunagawa K, Burkhoff D, Sagawa K. Effect of arterial impedance changes on the end-systolic pressure volume relation. Circ Res 1984;54:595-602. Kass DA, Maughan WL, Guo ZM, Kono A, Sunagawa K, Sagawa K. Comparative influence of load versus inotropic states on indexes of ventricular contractility: experimental and theoretical analysis based on pressure-volume relationships. Circulation 1987;76:1422-36. Little WC, Cheng C-P, Mumma M, Igarashi Y, Vinten-Johansen J, Johnston WE. Comparison of measures of left ventricular contractile nerformance derived from oressure-volume 100~s in conscious dogs. Circulation 1989;80: 1378-87.
L
Hamm DP, Everson CT, Freedman BM, Pellom GL, Christian C, Wechsler AS. The passive right ventricular volume-dimension relationship in the isolated canine heart. Sure Forum 1984; 35:266-8. _ Morris JJI, Pellom CL, Hamm DP, Everson CT, Wechsler AS. Dynamic tight ventricular dimension: relation to chamber volume during the cardiac cycle. J Thorac Cardiovasc Surg 1986;91: 879-87. Feneley MP, Elbeery JR, Gaynor JW, Gall SAJ, Davis JW. Rankin JS. Ellipsoidal shell subtraction model of right ventricular volume: comparison with regional free wall dimensions as indexes of right ventricular function. Circ Res 1990:67:1427-36. Schwiep F, Cassidy SS, Ramanathan M, Johnson RLJ. Rapid in vivo determinations of instantaneous right ventricular pressure and volume in dogs. Am J Physiol 1988;254:H622-30. _ Tomita M, Masuda H, Sumi T, et al. Estimation of right ventricular volume by modified echocardiographic subtract& method. Am Heart J 1992;123:1011-22. Baan J. Aouw Jonn ‘FT. Kerkhof PLM. et al. Continuous stroke volume and cardiac&m&t from intraventricular dimensions obtained with impedance catheter. Cardiovasc Res 1981:15:328-34. Burkhoff D, Van der Velde ET, Kass D, Baan J, Maughan WL. Sagawa K. Accuracy of volume measurement by conductance catheter in isolated, ejecting canine hearts. Circulation 1985;72: 440-7. Boltwood CM, Appleyard RF, Glantz SA. Left ventricular volume measurement by conductance catheter in intact dogs. Circulation 1989;1990:63848. Burkhoff D. The conductance method of left ventricular volume estimation: methodologic limitations put into perspective Circulation 1990;81:703-6. Woodard JC, Bertram CD. Gow BS. Right ventricular volumetn by catheter measurement of conductance-PACE 1987;10:862-70.’ Woodard JC, Bertram CD, Gow BS. Detecting right ventriculat volume changes using the conductance catheter. &CE 1992;15: 2283-94. Solda PL. Pantaleo I’. Perlini S. et al. Continuous monitoring of right ventricular volume changes using a conductance cathe& in the rabbit. J AppZ Phvsiol 1992:73:1770-5. McKay RG, Spears JR, Aroesty JM, et al. Instantaneous measure- ment of left and right ventricular stroke volume and pressure- volume relationships with an impedance catheter. Circulation 1984;69:703-10. Maloney J, Khoury D, Simmons T, et al. Effect of atrioventricular synchrony on stroke volume during ventricular tachycardia in man. Am Heart J 1992:123:1561-g. Khoury D, McAlister H, Wilkoff B, et al. Continuous right ven- tricular volume assessment bv catheter measurement of imuedance for antitachycardia system control. PACE 1989;12:1918-26. Maughan WL, Shoukas AA, Sagawa K, Weisfeldt ML. Instantaneous pressure-volume relation of the canine right ventricle. Circ Res 1979;44:309-15. Karunanithi MK, Michniewicz J, Copeland SE, Feneley MP. Right ventricular preload recruitable stroke work, end-systolic pressure- volume, and dp/dt max-end-diastolic volume relations comnared as indexes oi right ventricular contractile performance in conscious dogs. Circ Res 1992;70: 1169-79. Brown KA, Sitchey RV. Human right ventricular end-systolic pressure-volume relation defined by maximal elastance. Circulation 1988;78:81-91.
at Colum
bia University H
ealth Sciences Library on F
ebruary 13, 2011cardiovascres.oxfordjournals.org
Dow
nloaded from