assessment of provincial social vulnerability to natural disasters in china
TRANSCRIPT

ORI GIN AL PA PER
Assessment of provincial social vulnerability to naturaldisasters in China
Yang Zhou • Ning Li • Wenxiang Wu • Jidong Wu
Received: 17 June 2013 / Accepted: 10 December 2013 / Published online: 24 December 2013� Springer Science+Business Media Dordrecht 2013
Abstract Assessment of social vulnerability has been recognized as a critical step to
understand natural hazard risks and to enhance effective response capabilities. Although
significant achievements have been made in social vulnerability researches, little is know
about the comprehensive profile of regional social vulnerability in China. In this study, the
social vulnerability to natural hazards was firstly divided into socioeconomic and built
environmental vulnerability. Then, using factor analysis, we identified the dominant factors
that influence the provincial social vulnerability in China to natural hazards based on the
socioeconomic and built environmental variables in 2000 and 2010 and explored the
spatial patterns of social vulnerability. The results indicated that the provincial social
vulnerability in China showed significant regional differences. The social vulnerability in
the southeastern and eastern regions of China was greater than its northern and central parts
over the past decade. Economic status, rural (proportion of agricultural population and
percentage of workers employed in primary industries), urbanization, and age structure
(children) were the dominant driving forces of variations in provincial socioeconomic
vulnerability in two studied years, while lifelines and housing age could explain most of
changes in built environmental vulnerability in 2000 and 2010. There were no statistically
significant correlations between social vulnerability and disaster losses (p [ 0.05), indi-
cating the impact of disasters was also related to the intensity of hazards and exposure.
Disaster relief funds allocated to each province of China depended more on its disaster
Y. Zhou � N. Li (&) � J. WuState Key Laboratory of Earth Surface Processes and Resource Ecology, Key Laboratory ofEnvironmental Change and Natural Disaster, MOE, Academy of Disaster Reduction and EmergencyManagement, Ministry of Civil Affairs and Ministry of Education, Beijing Normal University, Beijing100875, Chinae-mail: [email protected]
Y. Zhoue-mail: [email protected]
W. WuInstitute of Geographical Sciences and Natural Resources Research, Chinese Academy of Sciences,Beijing 100101, Chinae-mail: [email protected]
123
Nat Hazards (2014) 71:2165–2186DOI 10.1007/s11069-013-1003-5
severity than the regional integrated social vulnerability over the past decade. These
findings would provide a scientific base for the policy making and implementation of
disaster prevention and mitigation in China.
Keywords Natural hazards � Socioeconomic vulnerability � Built environmental
vulnerability � Social vulnerability � Factor analysis (FA) � China
1 Introduction
Disaster risk is described as a function of the hazard, exposure, and vulnerability (Alliance
Development Works 2012; IPCC 2012). Population growth and asset accumulation are
likely to increase exposure to disaster risk, so reducing vulnerability is and will continue to
be an important component of managing or reducing this risk (Bouwer et al. 2007;
Schumacher and Strobl 2011; IPCC 2012). Therefore, better understanding the multi-
faceted nature of vulnerability is a prerequisite for designing and implementing effective
adaptation and disaster risk management strategies (IPCC 2012). Presently, although there
have been several attempts at defining and capturing what is meant by vulnerability, the
use of the term varies among disciplines and research areas (Dow and Downing 1995;
Cutter 1996; Janssen et al. 2006). According to the IPCC (2012), vulnerability is defined
generically as the propensity or predisposition to be adversely affected, and it is a result of
diverse historical, social, economic, political, institutional, environmental conditions and
processes. In the disaster risk field, vulnerability is defined as the conditions determined by
physical, social, economic, and environmental factors or processes, which increase the
susceptibility of a community to the impact of hazards (UN/ISDR 2009). Vulnerability can
be divided into two broad categories: biophysical vulnerability and social vulnerability
(Cutter 1996; Schmidtlein et al. 2008). Biophysical vulnerability is a function of the
frequency and severity (or probability of occurrence) of a given type of hazard, while
social or inherent vulnerability is not (Brooks 2003). Social vulnerability was defined as
the characteristics of a person or group in terms of their capacity to anticipate, cope with,
resist, and recover from the impacts of a natural hazard (Wisner et al. 2004). The social and
biophysical vulnerability interact to produce the overall place vulnerability (Cutter 1996).
Considerable research attention in the past has focused primarily on components related to
biophysical vulnerability, probably due to the fact that they are relatively less complex than
those related to social vulnerability (Mileti 1999; Schmidtlein et al. 2008). However, the
devastating impacts of some recent catastrophes, such as European heat wave (2003),
Indian Ocean Tsunami (2004), Hurricane Katrina (2005), Wenchuan earthquake (2008),
and Japan 3.11 earthquake (2011), rekindled the academic domain to re-evaluate about the
role of social vulnerability in the occurrence of severity of disasters. And they began to
accept the fact that simply understanding the characteristics of biophysical vulnerability is
not enough to curb the escalating losses and casualties from natural disasters. Social
characteristics interact with physical events to produce disasters. In some sense, social
vulnerability can be considered as the synthetically impacts of these characteristics on the
likelihood for losses or the ability to recover from disaster shocks (Schmidtlein et al. 2008).
Thus, studies are increasingly focusing on the social vulnerability to natural hazards
(Cutter et al. 2003; Cutter and Finch 2008; Schmidtlein et al. 2008). Social vulnerability
evaluation is recognized as being integral to understanding the risk to natural hazards
2166 Nat Hazards (2014) 71:2165–2186
123
(Wisner et al. 2004; Cutter and Finch 2008). Social vulnerability analysis aims to identify
appropriate actions that can be taken to reduce the vulnerability before the potential
damages occurred (Olga and Donald 2002). It is thus of great importance to analyze the
vulnerability of different regions to enable the government to make policies for distributing
relief funds and assist the regions to improve their capabilities against disasters (Wei et al.
2004). Over the past decades, significant advancements have been made in both bio-
physical and social vulnerability assessments across different spatial and temporal scales
(Klein and Nicholls 1999; Cutter et al. 2000; Cutter and Finch 2008), in different states and
regions (Dwyer et al. 2004; Fekete 2009; Tapsell et al. 2010; Holand et al. 2011), and on
the comprehensive natural disasters and specific disaster events (Tapsell et al. 2002; Myers
et al. 2008; Kuhlicke et al. 2011; Wilhelmi and Morss 2013). However, social vulnerability
of China is still poorly understood until now.
China is one of the few countries suffering from frequent natural disaster. Over the past
decades, natural hazards have had far-reaching impacts on the sustainable development of
China’s economy and society, thus being a particular domestic and international concern.
The 1998 Yangtze River floods killed 1,320 people and resulted in $20 billion of direct
economic loss (Zong and Chen 2000). The great 2008 Wenchuan earthquake in Sichuan
province caused 69,225 deaths and approximately 100 billion US of economic loss (Yuan
2008). During the period 1983–2006, the landfalling tropical cyclones caused 472 deaths
and 28.7 billion yuan economic losses annually (Zhang et al. 2009). The 2008 Chinese ice
storm struck the most populated and economically developed regions of China and caused
129 dead and 1.7 million displaced, resulting in more than $22.3 billion of indirect eco-
nomic loss (Zhou et al. 2011). The Beijing storm of 21 July was claimed to have killed
more than 77 lives and caused great economic losses of approximately $1.6 billion (Qiu
2012; Sang et al. 2013). More recently, the 2013 Ya’an earthquake in Sichuan killed 193
people, with 12,211 people injured and 25 missing (Qiu 2013). Although many scholars
have studied the vulnerability to natural disasters in China, there are few studies investi-
gated systematically the causes of these disasters from the perspective of social vulnera-
bility. However, there are yet only few attempts in China that either capture a certain
region or capture social vulnerability by very few variables. For example, Wei et al. (2004)
built a data envelopment analysis model for the provincial vulnerability analysis of natural
disasters. Based on the same method, the vulnerability of integrated natural hazards and
hazard-specific (such as flood) at the provincial scale of China was also assessed (Huang
et al. 2013). Using the structural equation model, Zou (2012) identified that the allocation
of income is important in determining China’s provincial vulnerability. Recently, Ge et al.
(2013) identified regional per capita gross domestic product (GDP) and income as the
major factors of social vulnerability in the Yangtze River Delta, China. These studies
provided valuable insights into scientific reference for guiding the disaster prevention and
mitigation in China. Social vulnerability is determined by a complex range of social
factors, and these multi-faceted elements range from the attributes of individuals (age,
health, income, housing, security, employment, and education) to characteristics of com-
munities or regions (population growth, economic status, urbanization, built environment,
lifelines, and infrastructure) (Cutter 1996; Wu et al. 2002; Cutter et al. 2003; Myers et al.
2008; Cutter and Finch 2008; Cutter 2010). However, most studies on vulnerability in
China did not fully take into account the social factors of vulnerability, such as age, gender,
education, employment, infrastructure, lifelines as well as the built environment. The
vulnerability of China’s provinces to natural hazards and their factors that produce their
susceptibility to suffer losses have not yet been identified or studied systematically.
Nat Hazards (2014) 71:2165–2186 2167
123

Disaster risks cannot fully be eliminated because natural hazards are beyond our con-
trol. Development of human society would inevitably increase the degree of exposure.
Climate change is likely to lead to an increase in the frequency and intensity of certain
types of natural hazards in certain regions (IPCC 2012). China’s population will likely
continue to increase, and its rapidly socioeconomic development will accelerate the pro-
cess of urbanization, which makes more people and assets exposed to natural hazards.
Assessment of vulnerability and identification of influencing factors would provide a
scientific basis for disaster risk mitigation. Therefore, based on the social vulnerability
index (SVI) framework pioneered by Cutter et al. (2003) and further elaborated by Borden
et al. (2007), this study investigated the socioeconomic and built environmental charac-
teristics that contribute to the natural hazard vulnerability of provinces in China and
influence the ability to recover from them. The SVI approach may be best viewed as an
algorithm for quantifying social vulnerability and has been replicated in a number of
studies at different spatial and temporal scales (Borden et al. 2007; Schmidtlein et al. 2008;
Cutter and Finch 2008). Socioeconomic factors hinder or enable a place’s ability to
respond to and recover from disaster shocks, and built environmental factors amplify or
attenuate the adverse effects of natural hazards (Borden et al. 2007). Firstly, factor analysis
(FA) was applied to identify the dominant contributors to vulnerability using the 20
socioeconomic and 10 built environmental variables of 31 provinces (municipalities,
autonomous regions) in China. Secondly, socioeconomic index (SeVI) and built envi-
ronmental vulnerability index (BeVI) were developed for 31 provinces. Thirdly, the spatial
pattern of social vulnerability was explored over the last decade based on the constructed
SVI.
2 Materials and methodology
2.1 Data
Using provinces as our study unit, the data were categorized into two subgroups
according to the type of vulnerability they represented: socioeconomic and built envi-
ronmental vulnerability. Specific variables were selected based on the existing studies
that could best represent social vulnerability (Cutter 1996; Cutter et al. 2003; Borden
et al. 2007; Cutter and Finch 2008). Table 1 lists the datasets used in this study and its
sources. The socioeconomic data in 2010 and 2000 were obtained from the Chinese
Socioeconomic Development Statistical Database (CSDSD, www.tongji.cnki.net). The
SeVI metrics, including housing age, buildings heights, and types of building structures
were collected from the Tabulation on the 2010 and 2000 Population Censuses of China
(www.stats.gov.cn/tjsj/pcsj). These variables include GDP, population density, savings,
gender, age structure, education, unemployment, employment structure (primary, sec-
ondary, and tertiary industries), urbanization (rate), medical services, transportations, and
lifelines, which are available from the CSDSD and the most recent two population
censuses (2000 and 2010) for 31 provinces in China in addition to Taiwan, Hong Kong,
and Macau. To compare the data from year to year, the per capita GDP, savings and total
investment in fixed assets for all provinces are adjusted to their 2000 values based on the
provincial GDP deflators, which are downloaded from the World Bank Development
Dataset (www.econstats.com). All variables were normalized as percentages, per capita
values, or density functions.
2168 Nat Hazards (2014) 71:2165–2186
123

Ta
ble
1V
aria
ble
san
dd
ata
sou
rces
inth
eS
eVI
and
BeV
Im
od
els
Conce
pt
Var
iable
sS
ourc
esR
efer
ence
s
SeV
Im
od
el
Eco
nom
icst
atu
sG
DP
per
cap
ita
CS
DS
DA
dg
er(1
99
9)
Eco
nom
icst
atu
sA
ver
age
wag
eo
fem
plo
yed
per
son
sC
SD
SD
Cu
tter
etal
.(2
00
3)
Eco
nom
icst
atu
sP
erca
pit
an
etin
com
eo
fru
ral
ho
use
ho
lds
CS
DS
DA
dg
er(1
99
9);
Cutt
eret
al.
(20
03)
Eco
nom
icst
atu
sS
avin
gs
dep
osi
to
fu
rban
and
rura
lh
ou
seh
old
sC
SD
SD
Dw
yer
etal
.(2
00
4)
Eco
nom
icst
atu
sT
ota
lin
ves
tmen
tin
fix
edas
sets
CS
DS
DG
eet
al.
(20
13)
Dev
elo
pm
ent
Po
pu
lati
on
den
sity
CS
DS
DC
utt
eran
dF
inch
(20
08);
Cutt
eret
al.
(20
00)
Po
pu
lati
on
chan
ge
(%)
Nat
ura
lp
op
ula
tio
ng
row
thra
teC
SD
SD
Cu
tter
and
Fin
ch(2
00
8)
Gen
der
Sex
rati
o(f
emal
e=
10
0)
CS
DS
DA
dg
er(1
99
9);
Cutt
eret
al.
(20
03)
Age
(%)
Old
-age
dep
enden
cyra
tio
aC
SD
SD
All
ian
ceD
evel
op
men
tW
ork
s(2
01
2)
Ag
e(%
)C
hil
d-a
ge
dep
enden
cyra
tio
bC
SD
SD
All
ian
ceD
evel
op
men
tW
ork
s(2
01
2)
Ed
uca
tio
n(%
)Il
lite
racy
rate
CS
DS
DB
roo
ks
etal
.(2
00
5)
Em
plo
ym
ent
(%)
Un
emp
loy
men
tra
te(%
)C
SD
SD
Cu
tter
etal
.(2
00
0,
20
03)
Rura
l(%
)P
erce
nta
ge
of
wo
rker
sem
plo
yed
inp
rim
ary
indu
stri
esC
SD
SD
Cu
tter
and
Fin
ch(2
00
8)
Dev
elo
pm
ent
(%)
Per
cen
tag
eo
fw
ork
ers
emp
loyed
inse
con
dar
yin
du
stri
esC
SD
SD
Cu
tter
etal
.(2
00
3);
My
ers
etal
.(2
00
8)
Dev
elo
pm
ent
(%)
Per
cen
tag
eo
fw
ork
ers
emp
loyed
inte
rtia
ryin
du
stri
esC
SD
SD
Cu
tter
etal
.(2
00
3);
Sch
mid
tlei
net
al.
(20
08)
Urb
aniz
atio
n(%
)U
rban
izat
ion
rate
CS
DS
DC
utt
eret
al.
(20
00,
20
03)
Rura
l(%
)P
rop
ort
ion
of
agri
cult
ura
lp
op
ula
tio
nC
SD
SD
Sch
mid
tlei
net
al.
(20
08)
Med
ical
serv
ice
Nu
mb
ero
fb
eds
per
10
,00
0p
eop
leC
SD
SD
Bo
rden
etal
.(2
00
7);
Fek
ete
(20
09)
Med
ical
serv
ice
Num
ber
of
physi
cian
sper
10,0
00
peo
ple
CS
DS
DS
chm
idtl
ein
etal
.(2
00
8)
Med
ical
serv
ice
Nu
mb
ero
fh
ealt
hin
stit
uti
on
sC
SD
SD
Cu
tter
etal
.(2
00
3)
BeV
Im
od
el
Infr
astr
uct
ure
Nu
mb
ero
fp
ub
lic
tran
spo
rtat
ion
veh
icle
sp
er1
0,0
00
peo
ple
CS
DS
DZ
ahra
net
al.
(20
08);
Fla
nag
anet
al.
(20
11)
Lif
elin
esL
eng
tho
fra
ilw
ayC
SD
SD
Cu
tter
(19
96);
Cu
tter
etal
.(2
00
3)
Lif
elin
esL
eng
tho
fw
ater
way
CS
DS
DB
ord
enet
al.
(20
07)
Lif
elin
esL
eng
tho
fro
ads
CS
DS
DC
utt
er(1
99
6);
Cu
tter
etal
.(2
00
3)
Nat Hazards (2014) 71:2165–2186 2169
123

Ta
ble
1co
nti
nued
Conce
pt
Var
iable
sS
ourc
esR
efer
ence
s
Lif
elin
esL
eng
tho
fw
ater
sup
ply
pip
elin
esC
SD
SD
Bo
rden
etal
.(2
00
7)
Lif
elin
esP
roduct
ion
capac
ity
of
tap
wat
erC
SD
SD
Cutt
er(1
99
6);
Bo
rden
etal
.(2
00
7)
Ho
usi
ng
agec
Nu
mb
ero
fre
sid
enti
alh
ou
ses
bu
ild
ing
bef
ore
19
49
Cen
sus
Cu
tter
etal
.(2
00
3);
Bord
enet
al.
(20
07);
Ho
land
etal
.(2
01
1)
Buil
din
gag
eA
rea
of
resi
den
tial
ho
use
sb
uil
din
gb
efo
re1
94
9C
ensu
sB
ord
enet
al.
(20
07);
Ho
land
etal
.(2
01
1)
Buil
din
gh
eigh
tsN
um
ber
of
ho
use
ho
lds
of
liv
ing
inse
ven
and
mo
reth
anse
ven
flo
ors
Cen
sus
Cu
tter
etal
.(2
00
3)
Buil
din
gst
ruct
ure
sN
um
ber
of
ho
use
ho
lds
of
liv
ing
inre
info
rced
con
cret
est
ruct
ure
sC
ensu
sC
hak
rab
ort
yet
al.
(20
05)
aT
he
old
-ag
ed
epen
den
cyra
tio
isth
era
tio
of
the
po
pula
tio
nag
ed6
5y
ears
or
ov
erto
the
po
pula
tio
nag
ed1
5–
64
bT
he
chil
d-a
ge
dep
enden
cyra
tio
isth
era
tio
of
the
po
pu
lati
on
aged
0–
14
yea
rsto
the
po
pu
lati
on
aged
15
–6
4.
Th
ed
epen
den
cyra
tio
of
ag
iven
po
pula
tio
nca
nth
us
ind
icat
eso
ciet
alv
uln
erab
ilit
y,
asd
epen
den
tsar
em
ore
susc
epti
ble
toh
arm
fro
md
isas
ters
(Cu
tter
etal
.2
00
3)
cS
ofa
r,w
eo
nly
ob
tain
edth
e2
-yea
rb
uil
ten
vir
on
men
tal
dat
a(h
ou
sin
gag
e,b
uil
din
gh
eigh
t,an
dst
ruct
ure
)fr
om
the
mo
stre
cen
ttw
oP
op
ula
tio
nC
ensu
ses
(20
00
and
20
10
)in
Ch
ina
2170 Nat Hazards (2014) 71:2165–2186
123

2.2 Methods
2.2.1 Factor analysis
Since there are a large set of measurable variables, each of which indicates one fact of
vulnerability only, an FA was performed to identify the factors that make Chinese prov-
inces socially vulnerable to natural hazards. FA is a multivariate technique that allows one
to explore the interrelationships among variables in a dataset (Bernard 2006). Factors were
identified through optimally weighted linear combinations of observed variables that
maximize the amount of explained variance. Factor loadings represent the degree of
correlation between the original variables and the factors. The principal component
approach to FA was adopted, with varimax rotation with Kaiser normalization to fine-tune
the model. A factor score can be obtained as a linear combination of the vulnerability
indicators as the following formula:
Fi ¼Xn
k¼1
CiHiWi
where Fi refers the socioeconomic vulnerability index (SeVI) or built environmental
vulnerability index (BeVI) on the ith province, Ci represents the factor score coefficient, Hi
is the vulnerability (SeVI, BeVI) indicators, W is the weight of factors, and k represents the
number of factors.
2.2.2 Vulnerability index creation
This study considers that the social vulnerability consists of two distinct parts: socioeco-
nomic and built environmental vulnerability. To gain a better understanding of the
underlying dimensions of vulnerability, we firstly employed factor analytic (FA) tech-
niques to identify the latent factors that contribute to Chinese socioeconomic and built
environment vulnerable to natural hazards and then to calculate socioeconomic vulnera-
bility index (SeVI) and built environmental vulnerability index (BeVI) scores for each
province. Lastly, we used a simple algorithm to aggregate into a SVI, where SVI = Se-
VI ? BeVI. The detailed computations are carried out using the following steps:
• Step 1: Normalize the input variables to z-scores, each with mean 0 and standard
deviation 1.
• Step 2: Determine whether these variables are applicable to FA. In this step, Bartlett’s
test of sphericity and the Kaiser–Meyer–Olkin (KMO) measure were performed to
examine the suitability of the data for FA. The KMO statistic varies between 0 and 1.
Kaiser (1974) suggests that values greater than 0.5 are acceptable, values between 0.5
and 0.7 are mediocre, values between 0.7 and 0.8 are good, and values between 0.8 and
0.9 are superb.
• Step 3: Perform FA with the standardized input variables and select the number of
components representing socioeconomic and built environmental vulnerability. These
normalized variables were entered into a FA using a varimax rotation and the Kaiser
criterion (eigenvalues [1) to extract a set of components representing social
vulnerability. The latent variables related to vulnerability for each selected component
were determined by examining the component loading scores (Table 1).
• Step 4: Name the component groups and adjust the direction of the factor. For this step,
the component groups were named via the choosing of variables with significant factor
Nat Hazards (2014) 71:2165–2186 2171
123

loading and assigned a cardinal direction to ensure that the signs of the subsequent
defining variables appropriately describe the tendency of increase or decrease
vulnerability. A positive sign was assigned when the resulting factor in question
increases the total vulnerability, and a negative score was assigned when it decreases
the vulnerability. In cases in which there is no clear negative or positive effect on the
overall vulnerability, the absolute value of the factor score was used (Cutter et al. 2003;
Holand et al. 2011).
• Step 5: Calculate the factor scores using a predetermined weighting scheme. The SeVI
and BeVI scores were created by summing all of the independent component loadings
for each province. Due to the lack of a theoretical basis for assuming the relative
importance of one factor over another in the construction of the index, following Cutter
et al. (2003), the factors were equally weighted to produce the SeVI and BeVI scores in
this study.
2.2.3 Spatial patterns in vulnerability
To investigate the spatial distribution patterns in provincial vulnerability (including SeVI,
BeVI, and SVI) in China, we classified the visualization of mapped scores using standard
deviations from the mean for each year. We define high and low vulnerability as those
provinces with SVI (including SeVI and BeVI) scores greater than 1.5 standard deviations
from the mean (high vulnerability C1.5 SD; low vulnerability B-1.5 SD). High SVI
scores indicate high social vulnerability and vice versa.
3 Results
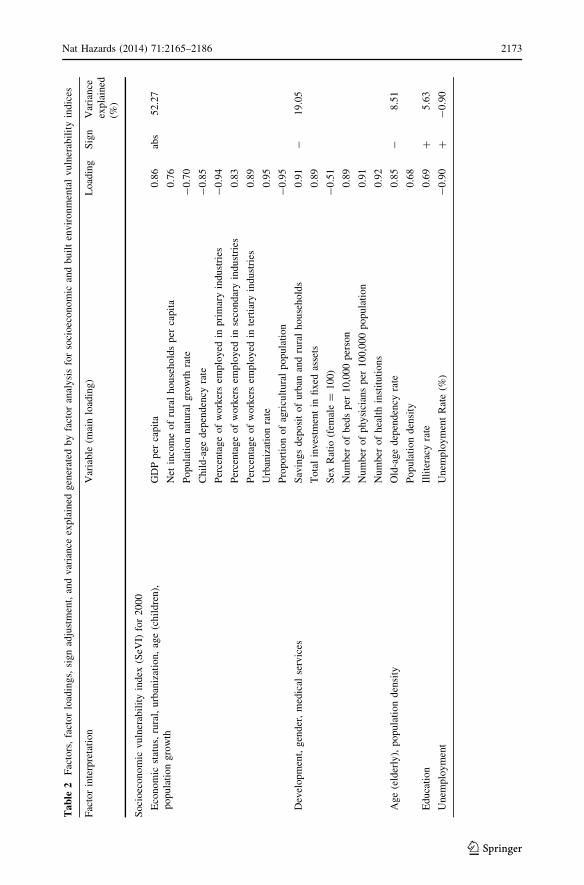
3.1 Dominant components of vulnerability
Some relevant metrics were excluded due to multi-collinearity problems. Therefore, we
included 20 and 10 variables in our SeVI and BeVI models for each year, respectively.
Usually, a perfect aggregation would result in a Kaiser–Meyer–Olkin (KMO) measure
accuracy of 1 (Kaiser 1974). In the present study, the values of KMO of the overall matrix
in 2000 and 2010 are [0.65, and the results of Bartlett’s test of sphericity for SeVI and
BeVI indices are significant (p \ 0.01). These results indicate that the data used in our
study are appropriate for FA. Five and four dominant components in 2000 and 2010 were
extracted using Kaiser’s criterion from the computed socioeconomic vulnerability index
(SeVI) for the 31 provinces, which explain 90.61 % in 2000 and 79.92 % in 2010 of the
variance in the input data, respectively (Table 2). Both in 2000 and 2010, the most
dominant components for socioeconomic vulnerability were economic status, rural,
urbanization, and age (children). The remaining potential dimensions of social vulnera-
bility remain broadly consistent both in 2000 and 2010. Specifically, the socioeconomic
vulnerability of 31 provinces in 2000 could be characterized as a function of economic
status, rural (proportion of agricultural population and percentage of workers employed in
primary industries), urbanization, population growth, gender, age structure, education, and
employment. Of those components, economic status, rural, urbanization, age (children),
and population growth were identified as the most dominant driving forces of variations in
socioeconomic vulnerability in 2000, which explain 52.27 % of the variance among pro-
vincial vulnerability. Development, gender, and medical services were identified as the
2172 Nat Hazards (2014) 71:2165–2186
123
Ta
ble
2F
acto
rs,
fact
or
load
ing
s,si
gn
adju
stm
ent,
and
var
ian
ceex
pla
ined
gen
erat
edb
yfa
cto
ran
alysi
sfo
rso
cioec
on
om
ican
db
uil
ten
vir
on
men
tal
vu
lner
abil
ity
ind
ices
Fac
tor
inte
rpre
tati
on
Var
iable
(mai
nlo
adin
g)
Load
ing
Sig
nV
aria
nce
exp
lain
ed(%
)
So
cio
eco
no
mic
vu
lner
abil
ity
ind
ex(S
eVI)
for
20
00
Eco
nom
icst
atu
s,ru
ral,
urb
aniz
atio
n,
age
(ch
ild
ren
),p
op
ula
tio
ng
row
thG
DP
per
cap
ita
0.8
6ab
s5
2.2
7
Net
inco
me
of
rura
lh
ou
seh
old
sp
erca
pit
a0
.76
Po
pu
lati
on
nat
ura
lg
row
thra
te-
0.7
0
Ch
ild
-ag
ed
epen
den
cyra
te-
0.8
5
Per
cen
tag
eo
fw
ork
ers
emp
loyed
inp
rim
ary
indu
stri
es-
0.9
4
Per
centa
ge
of
work
ers
emplo
yed
inse
condar
yin
dust
ries
0.8
3
Per
cen
tag
eo
fw
ork
ers
emp
loyed
inte
rtia
ryin
du
stri
es0
.89
Urb
aniz
atio
nra
te0
.95
Pro
po
rtio
no
fag
ricu
ltu
ral
po
pu
lati
on
-0
.95
Dev
elo
pm
ent,
gen
der
,m
edic
alse
rvic
esS
avin
gs
dep
osi
to
fu
rban
and
rura
lh
ou
seh
old
s0
.91
-1
9.0
5
To
tal
inves
tmen
tin
fix
edas
sets
0.8
9
Sex
Rat
io(f
emal
e=
10
0)
-0
.51
Nu
mb
ero
fb
eds
per
10
,00
0p
erso
n0
.89
Num
ber
of
physi
cian
sper
100,0
00
popula
tion
0.9
1
Nu
mb
ero
fh
ealt
hin
stit
uti
on
s0
.92
Age
(eld
erly
),popula
tion
den
sity
Old
-age
dep
enden
cyra
te0.8
5-
8.5
1
Po
pu
lati
on
den
sity
0.6
8
Ed
uca
tio
nIl
lite
racy
rate
0.6
9?
5.6
3
Un
emp
loy
men
tU
nem
plo
ym
ent
Rat
e(%
)-
0.9
0?
-0
.90
Nat Hazards (2014) 71:2165–2186 2173
123

Tab
le2
con
tin
ued
Fac
tor
inte
rpre
tati
on
Var
iable
(mai
nlo
adin
g)
Load
ing
Sig
nV
aria
nce
exp
lain
ed(%
)
So
cio
eco
no
mic
vu
lner
abil
ity
ind
ex(S
eVI)
for
20
10
Eco
nom
icst
atu
s,ru
ral,
urb
aniz
atio
n,em
plo
ym
ent
stru
ctu
re,ag
e(c
hil
dre
n)
GD
Pp
erca
pit
a0
.65
abs
43
.69
Av
erag
ew
age
of
emplo
yed
per
son
s0
.91
Net
inco
me
of
rura
lh
ou
seh
old
sp
erca
pit
a0
.90
Po
pu
lati
on
den
sity
0.8
3
Ch
ild
-ag
ed
epen
den
cyra
te-
0.6
8
Per
cen
tag
eo
fw
ork
ers
emp
loyed
inp
rim
ary
indu
stri
es-
0.8
8
Per
cen
tag
eo
fw
ork
ers
emp
loyed
inte
rtia
ryin
du
stri
es0
.86
Urb
aniz
atio
nra
te0
.86
Pro
po
rtio
no
fag
ricu
ltu
ral
po
pu
lati
on
-0
.85
Dev
elo
pm
ent,
med
ical
serv
ice
Sav
ings
dep
osi
to
fu
rban
and
rura
lh
ou
seh
old
s0
.90
-2
3.0
3
To
tal
inves
tmen
tin
fix
edas
sets
0.8
5
Per
centa
ge
of
work
ers
emplo
yed
inse
condar
yin
dust
ries
0.5
7
Nu
mb
ero
fb
eds
per
10
,00
0p
erso
n0
.85
Num
ber
of
physi
cian
sper
10,0
000
popula
tion
0.8
3
Nu
mb
ero
fh
ealt
hin
stit
uti
on
s0
.89
Po
pu
lati
on
gro
wth
,g
end
er,
age
(eld
erly
)P
op
ula
tio
nn
atura
lg
row
thra
te-
0.5
4?
7.7
2
Sex
rati
o(f
emal
e=
10
0)
-0
.79
Old
-age
dep
enden
cyra
te0.7
2
Nu
mb
ero
fre
sid
enti
alb
uil
din
gs
bu
ilt
bef
ore
19
49
0.9
3
Are
ao
fb
uil
din
gs
bu
ild
bef
ore
19
49
0.9
4
2174 Nat Hazards (2014) 71:2165–2186
123
Ta
ble
2co
nti
nued
Fac
tor
inte
rpre
tati
on
Var
iable
(mai
nlo
adin
g)
Load
ing
Sig
nV
aria
nce
exp
lain
ed(%
)
Un
emp
loy
men
tU
nem
plo
ym
ent
Rat
e(%
)0
.88
?5
.48
Bu
ilt
env
iro
nm
enta
lv
uln
erab
ilit
yin
dex
(BeV
I)fo
r2
00
0
Lif
elin
es,
bu
ild
ing
age
Len
gth
of
road
s0
.61
abs
45
.45
Pro
duct
ion
capac
ity
of
tap
wat
er0.7
4
Nu
mb
ero
fre
sid
enti
alb
uil
din
gs
bu
ilt
bef
ore
19
49
0.9
3
Are
ao
fb
uil
din
gs
bu
ild
bef
ore
19
49
0.9
4
Lif
elin
es,
bu
ild
ing
hei
gh
ts,
bu
ild
ing
stru
ctu
res
Len
gth
of
wat
erw
ay0
.74
?1
7.2
4
Len
gth
of
wat
ersu
pply
pip
elin
es0
.94
Nu
mb
ero
fh
ou
seh
old
so
fli
vin
gin
C7
flo
ors
0.7
9
Nu
mb
ero
fh
ou
seh
old
so
fli
vin
gin
rein
forc
edco
ncr
ete
stru
ctu
res
0.7
5
Infr
astr
uct
ure
,li
feli
nes
(rai
lway
)N
um
ber
of
pu
bli
ctr
ansp
ort
atio
nv
ehic
les
per
10
,00
0p
op
ula
tio
n-
0.7
9-
13
.89
Len
gth
of
rail
way
0.9
1
Bu
ilt
env
iro
nm
enta
lv
uln
erab
ilit
yin
dex
(BeV
I)fo
r2
01
0
Lif
elin
es,
bu
ild
ing
hei
gh
ts,
bu
ild
ing
stru
ctu
res
Len
gth
of
wat
erw
ay0
.67
abs
46
.86
Len
gth
of
wat
ersu
pply
pip
elin
es0
.95
Nu
mb
ero
fh
ou
seh
old
so
fli
vin
gin
C7
flo
ors
0.8
4
Nu
mb
ero
fh
ou
seh
old
so
fli
vin
gin
rein
forc
edco
ncr
ete
stru
ctu
res
0.8
3
Infr
astr
uct
ure
,li
feli
nes
Nu
mb
ero
fp
ub
lic
tran
spo
rtat
ion
veh
icle
sp
er1
0,0
00
po
pula
tio
n-
0.5
9-
18
.57
Len
gth
of
rail
way
0.8
7
Len
gth
of
road
s0
.80
Pro
duct
ion
capac
ity
of
tap
wat
er0.7
7
Buil
din
gag
eN
um
ber
of
resi
den
tial
bu
ild
ings
bu
ilt
bef
ore
19
49
0.9
3?
12
.61
Are
ao
fb
uil
din
gs
bu
ild
bef
ore
19
49
0.9
4
Nat Hazards (2014) 71:2165–2186 2175
123

second most dominant factors, capturing 19.05 % of the changes of socioeconomic vul-
nerability. Age (elderly), population density, and education level were identified as the
third and fourth most dominant factors, explaining 8.51 and 5.63 % of the variance,
respectively. Unemployment, as the last dominant component, assumed importance in
2000, explaining 5.15 % of the variability in socioeconomic vulnerability.
Compared with 2000, the four major dominant components, including economic status,
rural, urbanization, age (children), development, medical service, population growth,
gender, and age (elderly), captured approximately 80 % of changes in socioeconomic
vulnerability in 2010 (Table 2). Among these primary components, economic status, rural,
urbanization, and age (children) were still the dominant driving forces of changes in
provincial socioeconomic vulnerability, which explain 43.69 % of the variation among
provincial vulnerability. Meanwhile, the employment structure also played a vital role in
the socioeconomic vulnerability variability among provinces (Table 2). Followed by
development and medical service, it explained exceeding 23 % of the changes of socio-
economic vulnerability. Population change (natural population growth), gender, and age
(elderly) served as the third dominant factors and accounted for 7.72 % of the variance of
socioeconomic vulnerability. Similar to 2000, unemployment assumed more importance as
a unique component and explained 5.48 % of variance in socioeconomic vulnerability in
2010.
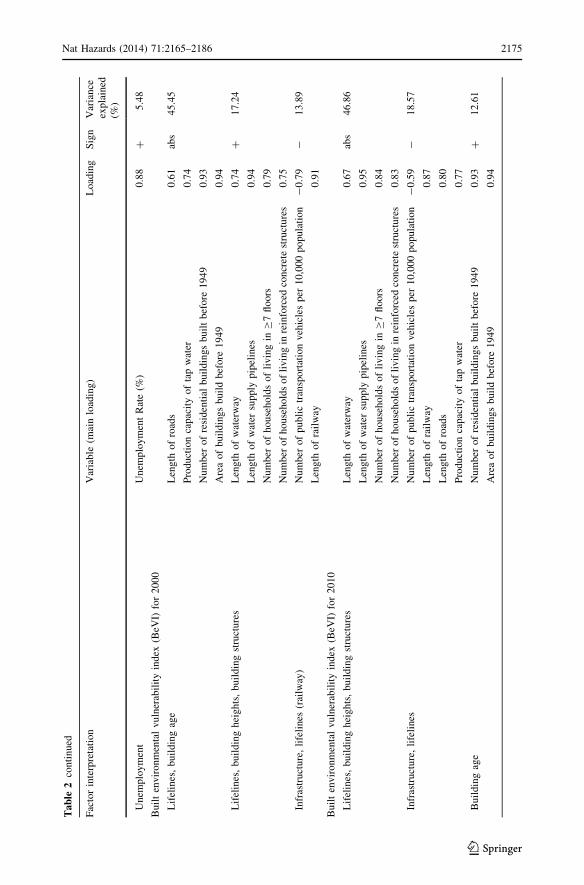
The built environmental vulnerability index (SeVI) measured the relative contribution
of characteristics of the built environmental variables, such as public infrastructure,
housing age, building heights, and lifelines to vulnerability. Of the 10 original variables in
the built environmental dataset, three dominant components were generated from the FA,
explaining 76.58 and 78.04 % of the variation in the data both in 2000 and 2010,
respectively. Specifically, in 2000, lifelines (the production capacity of tap water and
length of roads) and housing age captured the majority of the variation in BeVI scores,
representing 45.45 % of the variance of the data (Table 2). Followed by building heights
and structures, it accounted for 17.32 % of the variation of the built environmental vul-
nerability. Infrastructure (number of public transportation vehicles per 10,000 population)
and lifelines (length of railway and roads) were identified as the third contributors to built
environmental vulnerability. By 2010, three components explained 78.04 % of the vari-
ability in built environmental vulnerability among 31 provinces in China. The most sig-
nificant components were lifelines (water), building heights, and structures, explaining
46.86 % the variation in built environmental vulnerability in 2010. Followed by the
infrastructures and lifelines (transportation), it explained 18.57 % of the changes in the
built environmental vulnerability among provinces. Housing age served as the third
dominant contributor to the built environmental vulnerability, which explains 12.61 % of
variation in vulnerability.
3.2 Spatial distribution of provincial vulnerability in China
The social vulnerability to natural hazards for 31 provinces of China in 2000 and
2010 is shown in Fig. 1. In 2000, Shanghai, Beijing, and Tibet were the most
socioeconomic vulnerable provinces, followed by Qinghai, Yunnan, Guizhou, Guangxi,
Henan, and Tianjin. The least socioeconomic vulnerable province was Xinjiang
(Fig. 1a). High socioeconomic vulnerability in Beijing and Shanghai could be attrib-
uted to their rapid urbanization and high economy development levels, which could
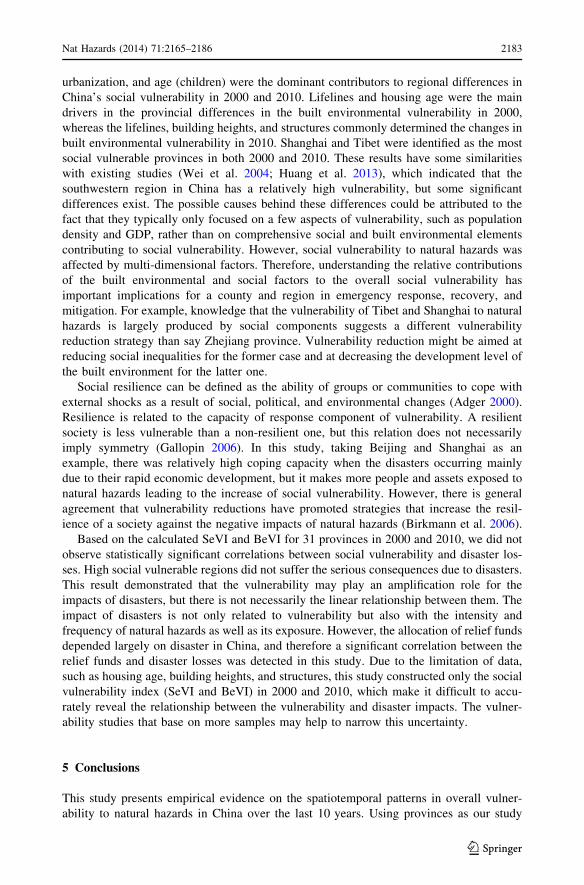
make more assets exposed to natural hazards (Fig. 2a). While in Tibet, its high
vulnerability could be ascribed to the combined effects of multi-faceted factors, such
2176 Nat Hazards (2014) 71:2165–2186
123

Fig
.1
So
cio
eco
no
mic
vu
lner
abil
ity
ind
ex(S
eVI)
,b
uil
ten
vir
on
men
tal
vu
lner
abil
ity
ind
ex(B
eVI)
,an
do
ver
all
soci
alv
uln
erab
ilit
yin
dex
(SV
I)in
20
00
and
20
10
for
31
pro
vin
ces
of
Ch
ina
mai
nla
nd
Nat Hazards (2014) 71:2165–2186 2177
123

as its low level of socioeconomic development, rapid population growth, high pro-
portion of rural farm population, and high child-age dependency ratio (Fig. 2a). These
vulnerable elements in Tibet could result in its low coping and adaptive capacities in
the event of disasters.
In terms of the built environmental vulnerability, in 2000, four provinces including
Guangdong, Jiangsu, Sichuan, and Shanghai had a relatively high vulnerability to natural
hazards due to their larger residential buildings (built before 1949) and larger households
who live in seven and more than seven floors. The built environmental vulnerability in
Inner Mongolia was the lowest (Fig. 1b). Interestingly, high social vulnerability in
Fig. 2 Standardization values of SeVI and its main variables correlating significantly with the firstcomponent (correlation coefficient [0.6; Table 2) for 2000 (a) and 2010 (b). GDP (-): per capita GDP;Income (-): per capita income; Child (?): child-age dependency ratio; PTIP (-): proportion of tertiaryindustry population; PSIP (-): proportion of secondary industry population; URBAN (?): urbanization;PPIP (?): proportion of primary industry population; AGRP (?): agricultural population; NGR (?): naturalpopulation growth rate; Density (?): population density. Positive (?) indicates increasing socioeconomicvulnerability and vice versa
2178 Nat Hazards (2014) 71:2165–2186
123
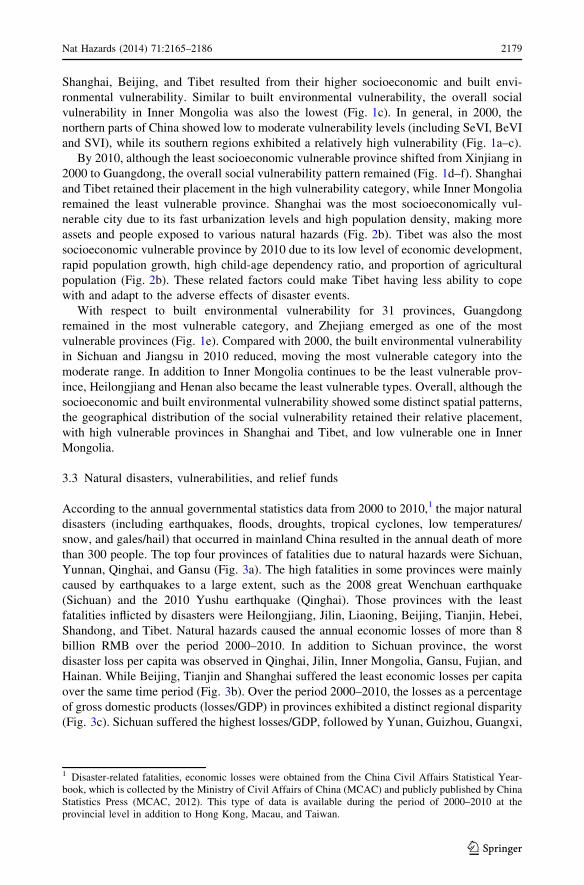
Shanghai, Beijing, and Tibet resulted from their higher socioeconomic and built envi-
ronmental vulnerability. Similar to built environmental vulnerability, the overall social
vulnerability in Inner Mongolia was also the lowest (Fig. 1c). In general, in 2000, the
northern parts of China showed low to moderate vulnerability levels (including SeVI, BeVI
and SVI), while its southern regions exhibited a relatively high vulnerability (Fig. 1a–c).
By 2010, although the least socioeconomic vulnerable province shifted from Xinjiang in
2000 to Guangdong, the overall social vulnerability pattern remained (Fig. 1d–f). Shanghai
and Tibet retained their placement in the high vulnerability category, while Inner Mongolia
remained the least vulnerable province. Shanghai was the most socioeconomically vul-
nerable city due to its fast urbanization levels and high population density, making more
assets and people exposed to various natural hazards (Fig. 2b). Tibet was also the most
socioeconomic vulnerable province by 2010 due to its low level of economic development,
rapid population growth, high child-age dependency ratio, and proportion of agricultural
population (Fig. 2b). These related factors could make Tibet having less ability to cope
with and adapt to the adverse effects of disaster events.
With respect to built environmental vulnerability for 31 provinces, Guangdong
remained in the most vulnerable category, and Zhejiang emerged as one of the most
vulnerable provinces (Fig. 1e). Compared with 2000, the built environmental vulnerability
in Sichuan and Jiangsu in 2010 reduced, moving the most vulnerable category into the
moderate range. In addition to Inner Mongolia continues to be the least vulnerable prov-
ince, Heilongjiang and Henan also became the least vulnerable types. Overall, although the
socioeconomic and built environmental vulnerability showed some distinct spatial patterns,
the geographical distribution of the social vulnerability retained their relative placement,
with high vulnerable provinces in Shanghai and Tibet, and low vulnerable one in Inner
Mongolia.
3.3 Natural disasters, vulnerabilities, and relief funds
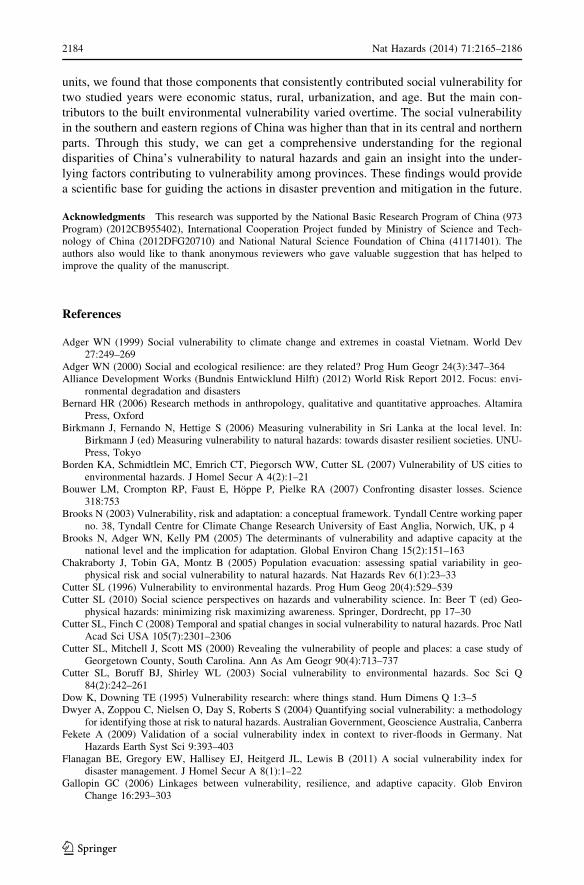
According to the annual governmental statistics data from 2000 to 2010,1 the major natural
disasters (including earthquakes, floods, droughts, tropical cyclones, low temperatures/
snow, and gales/hail) that occurred in mainland China resulted in the annual death of more
than 300 people. The top four provinces of fatalities due to natural hazards were Sichuan,
Yunnan, Qinghai, and Gansu (Fig. 3a). The high fatalities in some provinces were mainly
caused by earthquakes to a large extent, such as the 2008 great Wenchuan earthquake
(Sichuan) and the 2010 Yushu earthquake (Qinghai). Those provinces with the least
fatalities inflicted by disasters were Heilongjiang, Jilin, Liaoning, Beijing, Tianjin, Hebei,
Shandong, and Tibet. Natural hazards caused the annual economic losses of more than 8
billion RMB over the period 2000–2010. In addition to Sichuan province, the worst
disaster loss per capita was observed in Qinghai, Jilin, Inner Mongolia, Gansu, Fujian, and
Hainan. While Beijing, Tianjin and Shanghai suffered the least economic losses per capita
over the same time period (Fig. 3b). Over the period 2000–2010, the losses as a percentage
of gross domestic products (losses/GDP) in provinces exhibited a distinct regional disparity
(Fig. 3c). Sichuan suffered the highest losses/GDP, followed by Yunan, Guizhou, Guangxi,
1 Disaster-related fatalities, economic losses were obtained from the China Civil Affairs Statistical Year-book, which is collected by the Ministry of Civil Affairs of China (MCAC) and publicly published by ChinaStatistics Press (MCAC, 2012). This type of data is available during the period of 2000–2010 at theprovincial level in addition to Hong Kong, Macau, and Taiwan.
Nat Hazards (2014) 71:2165–2186 2179
123

Qinghai, Gansu, Inner Mongolia, Jiangxi, and Hainan. Developed regions such as Tianjin,
Shanghai, Jiangsu, and Guangdong suffered the relatively low in their losses/GDP.
Over the past decade, China invested the annual disaster relief funds in rural areas of
exceeding 50,000 yuan each year.2 Figure 3d exhibits the geographic distribution of the
annual disaster relief fund per capita in rural regions of China during the period from 2000
to 2010. The relief fund per capita allocated to Sichuan, Tibet, Qinghai, and Gansu was the
largest, followed by Yunnan, Xinjiang, and Shanxi. Due to the relatively fewer disasters
and higher population density, the per capita relief funds allocated to Beijing, Shanghai,
Jiangsu, and Shandong were the least. Overall, the per capita relief funds allocated to the
eastern and southern regions of China were lower than that to its western over the period
2000–2010 (Fig. 3d). The higher per capita relief funds allocated to the western of China
could be attributed to the recently frequent catastrophes that occurred in the region, such as
the great 2008 Wenchuan earthquake and 2008 ice storm in South China.
Additionally, we further tried to investigate the relationships between vulnerability
(including socioeconomic and built environmental vulnerability) and disaster-related
economic losses, as well as the relief funds allocated to each province of China in the 2000
and 2010 (Table 3). The results showed that both in 2000 and 2010, there were not
discernible correlations between vulnerability (including socioeconomic, built-environ-
mental and social vulnerability) and disaster losses at the 5 % level of significance. The
Fig. 3 Annual average fatalities, direct economic losses and losses as a percentage of GDP, and disasterrelief fund per capita for each province in China during the period from 2000 to 2010
2 Data on the total disaster relief funds allocated to each province in China are currently unavailable, but theChina Rural Statistical Yearbook, which is published by Chinese Statistics Press, records the disaster relieffunds in rural areas for each province since 1980. Therefore, the disaster relief funds allocated to cities arebeyond the scope of the present study.
2180 Nat Hazards (2014) 71:2165–2186
123

Ta
ble
3P
ears
on
corr
elat
ions
bet
wee
nvuln
erab
ilit
yin
dex
and
annual
econom
iclo
sses
,as
wel
las
annual
reli
effu
nds
SeV
IB
eVI
SV
IL
oss
20
10
20
00
20
10
20
00
20
10
20
00
20
10
20
00
Lo
ss-
0.0
3(0
.85
)-
0.2
8(0
.13
)0
.03
(0.8
9)
0.2
6(0
.16
)-
0.0
1(0
.96
)-
0.1
0(0
.63
)–
–
Rel
ief
fun
d0
.32
(0.0
7)
0.0
2(0
.92
)0
.11
(0.5
5)
0.0
4(0
.85
)0
.32
(0.0
8)
0.0
3(0
.87
)0
.50*
*(0
.00
)0
.51*
*(0
.00
)
**
Sig
nifi
can
tat
p\
0.0
1;
the
pv
alues
are
inp
aren
thes
es
Nat Hazards (2014) 71:2165–2186 2181
123

relationship between the vulnerability and disaster-related deaths was also not significant
in 2000 and 2010 (p [ 0.05). These results indicated that the vulnerability index we
calculate is only an integral metric, and it may be insufficient to measure the impact of
natural disasters. Using natural hazard losses as validation of vulnerability is an oft-
suggested approach, yet it assumes that the most socially vulnerable populations have the
most to loss, and the losses are evenly distributed throughout the nation, but that was not
the case (Cutter and Finch 2008). The occurrence of natural disasters and their impacts on
human society in China have distinct regional characteristics due to its complex geo-
graphical environment and varied climate. Influenced by the frequency and intensity of
natural hazards, disaster-related economic losses and casualties occurred in China during
the past decades were not evenly distributed (Zhou et al. 2013). Therefore, as revealed by
this study, the impacts of natural disasters on high socially vulnerable regions were not
necessarily obvious, such as Tibet (Figs. 1, 3). On the other hand, the relief funds allocated
to each province were positively correlated with economic losses in 2010 and 2000
(p \ 0.01), but the correlations between the relief funds and vulnerability were not sig-
nificant (Table 3, p [ 0.05). These findings demonstrated that the relief funds allocated to
each province in China depended more on its disaster severity that occurred in a certain
area rather than a comprehensive vulnerability profile that includes the susceptibility of
individuals and social groups.
4 Discussion
There is still no uniform definition for vulnerability in academic community due to its
complexity. It is thus difficult to establish a common set of viable socioeconomic–
demographic metrics to measure the vulnerability at different scales (Cutter and Finch
2008; Kuhlicke et al. 2011). Data availability is often the most crucial factor influencing
indicator selection and can lead to reliance on easily measurable variables that may not be
the most accurate indicators of vulnerability (Tapsell et al. 2010). Due to the limitations of
available data, some important factors influencing social vulnerability, such as a lack of
access to resources (including information, political power), building stock, individual
health status, and risk awareness levels, were beyond the scope of the present study. The
level of built environment development and urbanization also plays a vital important role
in understanding vulnerability (Cutter et al. 2003; Borden et al. 2007; Cutter and Finch
2008; Zahran et al. 2008). This study used 30 variables, including wealth, age, gender,
education, employment, population growth, lifelines, infrastructure, housing age, building
heights, and building structures, as proxy indicators to measure the vulnerability. The
identified critical factors are consistent with the broader hazards literature, which reveal
not only the geographic distribution in social vulnerability but also the possible mechanism
behind the variation in vulnerability. To our knowledge, this is the first comprehensive
attempt to compare the spatial distribution of regional vulnerability overtime.
Within the context of natural hazards, the SVI helps to determine which places may
need specialized attention during immediate response and long-term recovery after a
natural hazard event, given the sensitivity of the populations and the lowered capacity to
respond (Cutter and Finch 2008). In the present study, based on the FA technique, two
indices (SeVI and BeVI) were constructed to measure the relative social vulnerability
among provinces that may affect people’s and communities’ ability to respond and recover
from disaster events and shocks. Our results indicated that economic status, rural (per-
centage of workers employed in primary industries and agricultural population),
2182 Nat Hazards (2014) 71:2165–2186
123
urbanization, and age (children) were the dominant contributors to regional differences in
China’s social vulnerability in 2000 and 2010. Lifelines and housing age were the main
drivers in the provincial differences in the built environmental vulnerability in 2000,
whereas the lifelines, building heights, and structures commonly determined the changes in
built environmental vulnerability in 2010. Shanghai and Tibet were identified as the most
social vulnerable provinces in both 2000 and 2010. These results have some similarities
with existing studies (Wei et al. 2004; Huang et al. 2013), which indicated that the
southwestern region in China has a relatively high vulnerability, but some significant
differences exist. The possible causes behind these differences could be attributed to the
fact that they typically only focused on a few aspects of vulnerability, such as population
density and GDP, rather than on comprehensive social and built environmental elements
contributing to social vulnerability. However, social vulnerability to natural hazards was
affected by multi-dimensional factors. Therefore, understanding the relative contributions
of the built environmental and social factors to the overall social vulnerability has
important implications for a county and region in emergency response, recovery, and
mitigation. For example, knowledge that the vulnerability of Tibet and Shanghai to natural
hazards is largely produced by social components suggests a different vulnerability
reduction strategy than say Zhejiang province. Vulnerability reduction might be aimed at
reducing social inequalities for the former case and at decreasing the development level of
the built environment for the latter one.
Social resilience can be defined as the ability of groups or communities to cope with
external shocks as a result of social, political, and environmental changes (Adger 2000).
Resilience is related to the capacity of response component of vulnerability. A resilient
society is less vulnerable than a non-resilient one, but this relation does not necessarily
imply symmetry (Gallopin 2006). In this study, taking Beijing and Shanghai as an
example, there was relatively high coping capacity when the disasters occurring mainly
due to their rapid economic development, but it makes more people and assets exposed to
natural hazards leading to the increase of social vulnerability. However, there is general
agreement that vulnerability reductions have promoted strategies that increase the resil-
ience of a society against the negative impacts of natural hazards (Birkmann et al. 2006).
Based on the calculated SeVI and BeVI for 31 provinces in 2000 and 2010, we did not
observe statistically significant correlations between social vulnerability and disaster los-
ses. High social vulnerable regions did not suffer the serious consequences due to disasters.
This result demonstrated that the vulnerability may play an amplification role for the
impacts of disasters, but there is not necessarily the linear relationship between them. The
impact of disasters is not only related to vulnerability but also with the intensity and
frequency of natural hazards as well as its exposure. However, the allocation of relief funds
depended largely on disaster in China, and therefore a significant correlation between the
relief funds and disaster losses was detected in this study. Due to the limitation of data,
such as housing age, building heights, and structures, this study constructed only the social
vulnerability index (SeVI and BeVI) in 2000 and 2010, which make it difficult to accu-
rately reveal the relationship between the vulnerability and disaster impacts. The vulner-
ability studies that base on more samples may help to narrow this uncertainty.
5 Conclusions
This study presents empirical evidence on the spatiotemporal patterns in overall vulner-
ability to natural hazards in China over the last 10 years. Using provinces as our study
Nat Hazards (2014) 71:2165–2186 2183
123
units, we found that those components that consistently contributed social vulnerability for
two studied years were economic status, rural, urbanization, and age. But the main con-
tributors to the built environmental vulnerability varied overtime. The social vulnerability
in the southern and eastern regions of China was higher than that in its central and northern
parts. Through this study, we can get a comprehensive understanding for the regional
disparities of China’s vulnerability to natural hazards and gain an insight into the under-
lying factors contributing to vulnerability among provinces. These findings would provide
a scientific base for guiding the actions in disaster prevention and mitigation in the future.
Acknowledgments This research was supported by the National Basic Research Program of China (973Program) (2012CB955402), International Cooperation Project funded by Ministry of Science and Tech-nology of China (2012DFG20710) and National Natural Science Foundation of China (41171401). Theauthors also would like to thank anonymous reviewers who gave valuable suggestion that has helped toimprove the quality of the manuscript.
References
Adger WN (1999) Social vulnerability to climate change and extremes in coastal Vietnam. World Dev27:249–269
Adger WN (2000) Social and ecological resilience: are they related? Prog Hum Geogr 24(3):347–364Alliance Development Works (Bundnis Entwicklund Hilft) (2012) World Risk Report 2012. Focus: envi-
ronmental degradation and disastersBernard HR (2006) Research methods in anthropology, qualitative and quantitative approaches. Altamira
Press, OxfordBirkmann J, Fernando N, Hettige S (2006) Measuring vulnerability in Sri Lanka at the local level. In:
Birkmann J (ed) Measuring vulnerability to natural hazards: towards disaster resilient societies. UNU-Press, Tokyo
Borden KA, Schmidtlein MC, Emrich CT, Piegorsch WW, Cutter SL (2007) Vulnerability of US cities toenvironmental hazards. J Homel Secur A 4(2):1–21
Bouwer LM, Crompton RP, Faust E, Hoppe P, Pielke RA (2007) Confronting disaster losses. Science318:753
Brooks N (2003) Vulnerability, risk and adaptation: a conceptual framework. Tyndall Centre working paperno. 38, Tyndall Centre for Climate Change Research University of East Anglia, Norwich, UK, p 4
Brooks N, Adger WN, Kelly PM (2005) The determinants of vulnerability and adaptive capacity at thenational level and the implication for adaptation. Global Environ Chang 15(2):151–163
Chakraborty J, Tobin GA, Montz B (2005) Population evacuation: assessing spatial variability in geo-physical risk and social vulnerability to natural hazards. Nat Hazards Rev 6(1):23–33
Cutter SL (1996) Vulnerability to environmental hazards. Prog Hum Geog 20(4):529–539Cutter SL (2010) Social science perspectives on hazards and vulnerability science. In: Beer T (ed) Geo-
physical hazards: minimizing risk maximizing awareness. Springer, Dordrecht, pp 17–30Cutter SL, Finch C (2008) Temporal and spatial changes in social vulnerability to natural hazards. Proc Natl
Acad Sci USA 105(7):2301–2306Cutter SL, Mitchell J, Scott MS (2000) Revealing the vulnerability of people and places: a case study of
Georgetown County, South Carolina. Ann As Am Geogr 90(4):713–737Cutter SL, Boruff BJ, Shirley WL (2003) Social vulnerability to environmental hazards. Soc Sci Q
84(2):242–261Dow K, Downing TE (1995) Vulnerability research: where things stand. Hum Dimens Q 1:3–5Dwyer A, Zoppou C, Nielsen O, Day S, Roberts S (2004) Quantifying social vulnerability: a methodology
for identifying those at risk to natural hazards. Australian Government, Geoscience Australia, CanberraFekete A (2009) Validation of a social vulnerability index in context to river-floods in Germany. Nat
Hazards Earth Syst Sci 9:393–403Flanagan BE, Gregory EW, Hallisey EJ, Heitgerd JL, Lewis B (2011) A social vulnerability index for
disaster management. J Homel Secur A 8(1):1–22Gallopin GC (2006) Linkages between vulnerability, resilience, and adaptive capacity. Glob Environ
Change 16:293–303
2184 Nat Hazards (2014) 71:2165–2186
123
Ge Y, Dou W, Gu Z, Qian X, Wang J, Xu W, Shi P, Ming X, Zhou X, Chen Y (2013) Assessment of socialvulnerability to natural hazards in the Yangtze River Delta, China. Stoch Environ Res Risk Assess27(8):1899–1908
Holand IS, Lujala P, Rod JK (2011) Social vulnerability assessment for Norway: a quantitative approach.Nor Geogr Tidsskr 65:1–17
Huang J, Liu Y, Ma L, Sun F (2013) Methodology for the assessment and classification of regionalvulnerability to natural hazards in China: the application of a DEA model. Nat Hazards 65:115–134
IPCC (2012) Managing the risks of extreme events and disasters to advance climate change adaptation: aspecial report of working groups I and II of the intergovernmental panel on climate change. CambridgeUniversity Press, Cambridge
Janssen MA, Schoon MK, Weimao BK (2006) Scholarly networks on resilience, vulnerability and adap-tation within the human dimensions of global environmental change. Glob Environ Change16(3):240–252
Kaiser W (1974) The spectral sensitivity of the honeybee’s optomotor walking response. J Comp Physiol A90:405–408
Klein RJT, Nicholls RJ (1999) Assessment of coastal vulnerability to climate change. Ambio 28:182–187Kuhlicke C, Scolobig A, Tapsell S, Steinfuhrer A, Marchi BD (2011) Contextualizing social vulnerability:
findings from case studies across Europe. Nat Hazards 58:789–810Mileti D (1999) Disasters by design: a reassessment of natural hazards in the United States. Joseph Henry
Press, WashingtonMyers C, Slack T, Singelmann J (2008) Social vulnerability and migration in the wake of disaster: the case
of Hurricanes Katrina and Rita. Popul Environ 29:271–291Olga VW, Donald AW (2002) Assessing vulnerability to agricultural drought: a Nebraska case study. Nat
Hazards 25(1):37–58Qiu J (2012) Urbanization contributed to Beijing storms. Nature. doi:10.1038/nature.2012.11086Qiu J (2013) China earthquake points to future risk sites. Nature. doi:10.1038/nature.2013.12833Sang YF, Wang ZG, Liu CM (2013) What factors are responsible for the Beijing storm? Nat Hazards
65(3):2399–2400Schmidtlein MC, Deutsch RC, Cutter SL, Piegorsch WW (2008) A sensitivity analysis of ht social vul-
nerability index. Risk Anal 28:1099–1114Schumacher I, Strobl E (2011) Economic development and losses due to natural disasters: the role of hazard
exposure. Ecol Econ 72:97–105Tapsell SM, Penning-Rowsell EC, Tunstall SM, Wilson TL (2002) Vulnerability to flooding: health and
social dimensions. Phil Trans R Soc Lond A 360:1511–1525Tapsell S, McCarthy S, Faulkner H, Alexander M (2010) Social vulnerability and natural hazards. CapHaz-
Net WP4 Report, Flood Hazard Research Centre, Middlesex University, London. http://caphaz-net.org/outcomes-results/CapHaz-Net_WP4_Social-Vulnerability.pdf
UN-ISDR (2009) Risk and poverty in a changing climate: invest today for a safer tomorrow. United NationsInternational Strategy for Natural Disaster Reduction Global Assessment Report on Disaster RiskReduction, pp 207
Wei Y, Fan Y, Lu C, Tsai HT (2004) The assessment of vulnerability to natural disasters in China by usingthe DEA method. Environ Impact Assess Rev 24(4):427–439
Wilhelmi OV, Morss RE (2013) Integrated analysis of societal vulnerability in an extreme precipitationevent: a Fort Collins case study. Environ Sci Policy 26:49–62
Wisner B, Blaikie P, Cannon T, Davis I (2004) At risk: natural hazards, people’s vulnerability, and disasters.Routledge, London, p 11
Wu SY, Yarnal B, Fisher A (2002) Vulnerability of coastal communities to sea-level rise: a case study ofCape May County, New Jersey, USA. Clim Res 22:255–270
Yuan Y (2008) Impact of intensity and loss assessment following the great Wenchuan Earthquake. EarthqEng Eng Vib 7:247–254. doi:10.1007/s11803-008-0893-9
Zahran S, Brody SD, Peacock WG, Vedlitz A, Grover H (2008) Social vulnerability and the natural and builtenvironment: a model of flood causalities in Texas. Disaster 32(4):537–560
Zhang Q, Wu L, Liu Q (2009) Tropical cyclone damages in China 1983–2006. B Am Meteorol Soc90:489–495
Zhou BZ, Gu LH, Ding YH, Shao L, Wu ZM, Yang XS, Li GZ, Li ZC, Wang XM, Cao BS, Yu MK, WangMY, Wang SK, Sun HG, Duan AG, An YF, Wang X, Kong WJ (2011) The great 2008 Chinese icestorm its socioeconomic ecological impact and sustainability lessons learned. BB Am Meteorol Soc92(1):48–60
Zhou Y, Li N, Wu W, Wu J, Gu X, Ji Z (2013) Exploring the characteristics of major natural disasters inChina and their impacts during the past decades. Nat Hazards 69(1):829–843
Nat Hazards (2014) 71:2165–2186 2185
123

Zong YQ, Chen X (2000) The 1998 flood on the Yangtze, China. Nat Hazards 22:165–184Zou LL (2012) The impacting factors of vulnerability to natural hazards in China: an analysis based on
structural equation model. Nat Hazards 62:57–70
2186 Nat Hazards (2014) 71:2165–2186
123