assessment of perceived injury risks and priorities among truck drivers and trucking companies in...
TRANSCRIPT
Journal of Safety Research 39 (2008) 569–576
Contents lists available at ScienceDirect
Journal of Safety Research
j ourna l homepage: www.e lsev ie r.com/ locate / j s r
Assessment of perceived injury risks and priorities among truck drivers and truckingcompanies in Washington State
Peregrin Spielholz a,⁎, Jennifer Cullen b, Caroline Smith c, Ninica Howard c,Barbara Silverstein c, David Bonauto c
a Sound Transit, 401 South Jackson Street, Seattle, WA 98104, USAb County of Sacramento, Employment Office, 609 9th Street, Sacramento, CA 95814, USAc SHARP Program, Washington State Department of Labor and Industries, Olympia, WA 98504-4330, USA
⁎ Corresponding author.E-mail address: [email protected] (P
0022-4375/$ – see front matter © 2008 National Safetydoi:10.1016/j.jsr.2008.09.005
a b s t r a c t
a r t i c l e i n f oArticle history:
Problem: The trucking indus Received 20 December 2007Received in revised form 4 August 2008Accepted 17 September 2008Available online 5 November 2008Keywords:TruckingSurveyWork-related InjuriesNeeds AssessmentIntervention
try experiences one of the highest work-related injury rates. Little work has beenconductedpreviously in theUnited States to assess thehazards, needs, and injury preventionpriorities in trucking.Method: Two separate industry-wide surveys of 359 trucking companies and 397 commercial truck drivers wereconducted in Washington State. Results: Trucking companies and drivers both ranked musculoskeletal and slip,trip, fall injuries as the top two priorities. Controlling heavy lifting, using appropriate equipment, and addressingslippery surfaces were frequently listed as solutions. There appears to be a gap in safety climate perceptionbetween workers and employers. However, driver and company priorities agreed with industry workers'compensation claims. There is room for safety program management improvement in the industry. The studyfindingsdetail opportunities for prioritizing andreducing injuries. Impact on Industry:This information canbeusedto focus and design interventions for the prevention of work-related injuries while improving industrycompetitiveness.
© 2008 National Safety Council and Elsevier Ltd. All rights reserved.
1. Problem
Industry sub-sectors that comprise the trucking industry experiencesome of the highest incident and prevalence of work-related injuriescompared to other industries (Bonauto, Silverstein, Adams, & Foley,2006; Leigh, Waehrer, Miller, & Keenan, 2004). Yet relatively few re-sources have been invested in the research and development of pre-vention strategies. This is changing with the implementation of thesecondNationalOccupationalResearchAgenda (NORA II)by theNationalInstitute for Occupational Safety and Health (NIOSH). This sector-basedapproach to identifying research priorities includes Transportation,Warehousing and Utilities as one of the eight industry sectors.
The Bureau of Labor Statistics Census of Fatal Occupational Injuries(BLS, 2007a) reported 555 fatalities in truck transportation in 2006 and arate of 27.3 per 100,000 workers, which accounts for nearly 10% of allwork-related fatalities and at an incidence much higher than that for allindustries (4.0 per 100,000 workers). The non-fatal injury rate in 2006was 5.8 per 100 full-timeworkers for Truck Transportation, and 10.5 per100 full-time workers for Couriers and Messengers, compared to a rateof 4.4 for all private industry (BLS, 2007b). With an employment of over2 million workers, this sub-sector of U.S. industry experiences some ofthe highest numbers and rates of fatal and non-fatal injuries.
. Spielholz).
Council and Elsevier Ltd. All rights
Previous research surveys of truck drivers have been conducted inthe United States, however most of this work has focused on hours ofservice, driver fatigue, and motor-vehicle crash factors (Beilock, 1995;Braver et al., 1992; Monaco & Williams, 2000). A NIOSH conference in2003 generated a report that identified many potential occupationalhealth risks to truck drivers and research needs in this area (Saltzman& Belzer, 2007). Other research by Belzer, Rodriguez, and Sedo (2002)assessed specifically the impact of economics and other factors ontruck driver safety as it pertained to crashes. However, very littlesurvey research has focused on the assessment of the risk factors andperceived conditions that may promote injuries within trucking in theUnited States.
A survey in Australia byMayhewandQuinlan (2000) assessed healthand safety perceptions of truck drivers in New South Wales. This studyfound that 51%of truckdrivershadexperienced a chronic injuryor illnessin the previous 12 months, and 31% reported chronic back injuries. Ameasurement of mental health status was used and nearly all driverswere above “normal” stress levels according to the General HealthQuestion (GHQ) with factors of financial stress, long hours, interstatedriving, and overnight driving associated with higher stress scores.Another survey by Robb and Mansfield (2007) of self-reportedmusculoskeletal problems among truck drivers in the United Kingdomfound that over 80% reported somemusculoskeletal pain in the previous12 months. Manual material handling and subjective ratings of seatdiscomfort were associatedwith the self-reportedmusculoskeletal pain.
reserved.
Table 1Survey Responses for Truck Driver and Employer Surveys by NAICS and Reported FleetSize
Industry Sub-Sector (NAICS) Truck DriverRespondents
EmployerRespondents
b25Trucks
≥25Trucks
b25Trucks
≥25Trucks
General Freight (4841) 60 84 99 56Specialized Freight (4842 excl 48421) 49 49 53 19Waste Collection (5621) 19 21 19 6Couriers & Messengers (492) 11 25 14 6Used Household & Office Goods (48421) 35 13 43 9Total 176 193 228 96
570 P. Spielholz et al. / Journal of Safety Research 39 (2008) 569–576
The Safety and Health Assessment and Research for Prevention(SHARP) Program initiated a project inpartnershipwith theWashingtonState trucking industry called the Trucking Injury Reduction Emphasis(TIRES) Program. The goals of this programare to systematically identifyand prioritize the types of injuries, identify root-cause hazards, anddevelop practical solutions to help the industry reduce the burden oflost-time injuries. As part of the first phase of the TIRES program, ananalysis of Washington State workers' compensation data identifiedtrucking industry groups as having some of the highest compensableworkers' compensation claims rates inWashington State (Bonauto et al.,2006). Industry assignment was defined by the North AmericanIndustrial Classification System (NAICS) code assigned to the workers'compensation insurance account for each company. In WashingtonState, General Freight Trucking (NAICS 4841), Couriers (NAICS 4921),Specialized Freight Trucking (NAICS 4842), andWaste Collection (NAICS5621) each ranked in the top eight industries for compensable workers'compensation claims from 1999-2003. A sub-set of this analysis alsoshowed thatmost (at least 70%) of injuries in truckingwereof four types:(a) upper extremity and back work-related musculoskeletal disorders(WMSDs); (b) slips, trips and falls; (c) struck-by injuries; and (d) motor-vehicle crashes.
The second phase of the TIRES Project was to conduct industry-wide surveys of both trucking employers and truck drivers to assessperceptions of hazards, needs, and priorities within Washington Statetrucking companies. The goals of the surveys were to: (a) obtaindemographic information not available from administrative databasesto better describe the work and organization of trucking companies,and the population of truck drivers; (b) assess worker and companypriorities to better target educational needs and interventions; and(c) identify risk factors, solution strategies, and barriers to preventingoccupational injuries from both the company and driver perspectives.The following presents results of these two surveys summarizingresponses from trucking employers and truck drivers.
2. Methods
Two state-wide surveys were administered to employers andemployees with commercial drivers licenses in the trucking industry.The employer survey, sent to Washington State trucking companies,assessed: (a) needs and priorities in the trucking industry, (b) reportedcauses of injuries with associated solutions and barriers to imple-mentation, and (c) safety climate from the employer perspective. Theemployee survey asked truck drivers to assess their perceptions of:(a) the level of exposure to injury risk factors, (b) prevalence of pain/injury, (c) causes of injuries with associated solutions and barriers toimplementation, and (d) safety climate.
Questions were developed through inclusion of questions fromprevious trucking survey research (Monaco &Williams, 2000; Mayhew& Quinlan, 2000) and through 12 months of structured interviews andfocus groups with companies, labor unions, truck drivers, and industryassociations in Washington State. The survey instruments werereviewed and pilot-tested by industry and labor partners for relevance,accuracy, and completeness of content.
2.1. Truck Driver Survey
A random sample of 2,189 drivers distributed across the truckingsector was taken from a database population of 18,988 current com-mercial drivers license (CDL) holders employed in trucking companies.The current CDL holders from the Washington State Department ofLicensing were cross-referenced against a database from the Wash-ington State Employment Securities Department to identify thoseemployed by a company within the trucking industry North AmericanIndustry Classification System (NAICS) codes (NAICS 484, 492 and 5621).Phone numbers were not included in the data and were obtained by adirectory look-up. Data-sharing agreement contracts were in place
between agencies to assure integrity and security of any confidentialdata.
A total of 397 complete surveyswere received from700qualified truckdrivers, for a response-rate of 57%. There were 300 completed mail, 83phone, and 14 web surveys. Out of the total sample, 1,489 were dis-qualified, 241 were unreachable, and 64 refused the survey. Of the dis-qualified sample, 1,071 either had a bad address or no listed phonenumber and 186 had a phone number that was either wrong ordisconnected.
A survey with questions relating the type of work and truckingnormally conducted, exposure to injury risk factors, reported pain/injury,risk prioritization (ranking from “most important to “least important”),safety climate (Dedobbeleer & Beland, 1991), and perceptions of injurycauses (qualitative response), solutions (qualitative response) and barriers(qualitative response) was mailed to each truck driver in the spring of2006. Postcard reminders were mailed 10-14 days after the first mailing,and telephone follow-up with standard protocol was initiated with non-responders after an additional seven days. A web survey formwas inclu-ded as a response method option on the mailed survey and the postcardfollow-up.
2.2. Employer Survey
A total of 926 trucking companies were identified through Em-ployment Security data within one of the associated trucking industryNAICS having at least five full-time-equivalent employees during eachquarter in 2004. Surveysweremailed to each company in the spring of2005, and 359 surveys were completed after postcard reminders andtelephone follow-up protocols identical to that of the driver surveyfrom 690 qualified companies (52% response). Out of the total sample236 were disqualified, 240 were not reachable or did not respond, and91 refused the survey.
Questions relating to company priorities and procedures were in-cluded in addition to applicable driver survey items. Injury types andprofitability concerns were ranked from biggest concern or problem(score=1) to smallest concern.Weighted ranking scoreswere calculatedbymultiplying each of the rank scores by the number of respondents foreach category and then adding each category score together. The lowerthe weighted ranking score, the higher the problemwas ranked overallby respondents.
Interviewswith industry associations inWashington State identified atruck fleet size of 25 trucks as a cut-point definition for small and largecompanies in the survey, with the goal of obtaining a representativesample of both segments (Table 1). A descriptive analysis of all surveyvariables was conducted and relationships were explored between allvariableswhere aplausible hypothesis existed for a comparison. Statisticaldifferences were evaluated using the chi-square test statistic for ordinaldata, and using independent samples t-tests for continuous data, with asignificance level of 0.05. Significant differences by measure were eva-luated by sub-sector, fleet size, and survey when applicable for eachmeasure. Survey instruments and research methods involving human
571P. Spielholz et al. / Journal of Safety Research 39 (2008) 569–576
subjects were approved by the Washington State Institutional ReviewBoard.
3. Results
3.1. Truck Driver Survey Response Summary
Of those reporting personal information (n=362), 98% were male,19% were less than 40 years old, 45% were between 50 and 55 yearsold, and 36% were over 55. The most common method of compensa-tion was by the hour at 70%, with 15% paid by the mile, 8% by the trip,and 7% as a percentage of revenue. A total of 35% each reported drivingbetween 76-100% of the time and between 51-75% of the time, while18% drove between 25-50% of the time, and 12% drove less than 25% ofthe time. A total of 19% of drivers reported handling cargo or materialbetween 25-50% of the day, and 17% handled cargo 51-100% of thetime, while 46% reported handling cargo between 0-25% of the time.The majority (85%) of drivers reported sitting idle less than 25% ofthe day.
Survey respondents most frequently (n=141) ranked back, shoulderor arm/hand overexertions/strains as the most important type ofinjuries, with lifting heavy objects as the number one cause of theseinjuries. Getting help, using equipment, equipment upgrades, andmaintenancewere the most frequently listed solutions. Repetitive handor arm movements was most frequently (n=195) rated as a high injuryrisk. This was followed closely (n=185) by “activities that require veryhard pulling, pushing or gripping.”
3.2. Trucking Employer Survey Response Summary
The majority of respondents were either the owner, president, orvice-president of the company (n=146) or the personnel, safety andhealth, or other type ofmanager (n=145). Another 23 respondentswereadministrative assistants. Responding companies reported having anaverage fleet size of 35 (±143 std dev, median 12) trucks.
Trucking companies estimated that on average 17% (±17% std dev,median 10%) of their driving was done at night, non-driver employeesworked an average of 36 (±14 std dev, median 40) hours per week, anddrivers worked an average of 44 (±10 std dev, median 40) hours perweek.
Trucking industry employers also prioritized sprains/strains andoverexertions as the most important injury type. Awkward lifting andhandling freight were reported as the primary cause of these types of
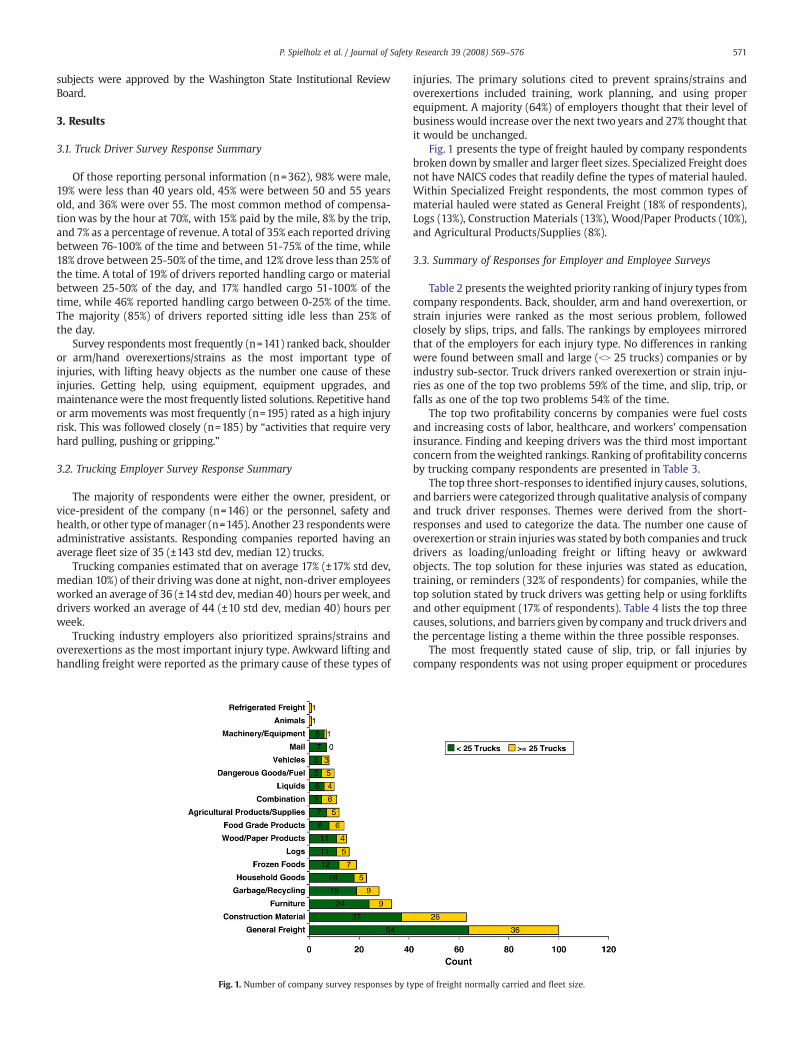
Fig. 1. Number of company survey responses by ty
injuries. The primary solutions cited to prevent sprains/strains andoverexertions included training, work planning, and using properequipment. A majority (64%) of employers thought that their level ofbusiness would increase over the next two years and 27% thought thatit would be unchanged.
Fig. 1 presents the type of freight hauled by company respondentsbroken down by smaller and larger fleet sizes. Specialized Freight doesnot have NAICS codes that readily define the types of material hauled.Within Specialized Freight respondents, the most common types ofmaterial hauled were stated as General Freight (18% of respondents),Logs (13%), Construction Materials (13%), Wood/Paper Products (10%),and Agricultural Products/Supplies (8%).
3.3. Summary of Responses for Employer and Employee Surveys
Table 2 presents the weighted priority ranking of injury types fromcompany respondents. Back, shoulder, arm and hand overexertion, orstrain injuries were ranked as the most serious problem, followedclosely by slips, trips, and falls. The rankings by employees mirroredthat of the employers for each injury type. No differences in rankingwere found between small and large (bN 25 trucks) companies or byindustry sub-sector. Truck drivers ranked overexertion or strain inju-ries as one of the top two problems 59% of the time, and slip, trip, orfalls as one of the top two problems 54% of the time.
The top two profitability concerns by companies were fuel costsand increasing costs of labor, healthcare, and workers' compensationinsurance. Finding and keeping drivers was the third most importantconcern from theweighted rankings. Ranking of profitability concernsby trucking company respondents are presented in Table 3.
The top three short-responses to identified injury causes, solutions,and barriers were categorized through qualitative analysis of companyand truck driver responses. Themes were derived from the short-responses and used to categorize the data. The number one cause ofoverexertion or strain injuries was stated by both companies and truckdrivers as loading/unloading freight or lifting heavy or awkwardobjects. The top solution for these injuries was stated as education,training, or reminders (32% of respondents) for companies, while thetop solution stated by truck drivers was getting help or using forkliftsand other equipment (17% of respondents). Table 4 lists the top threecauses, solutions, and barriers given by company and truck drivers andthe percentage listing a theme within the three possible responses.
The most frequently stated cause of slip, trip, or fall injuries bycompany respondents was not using proper equipment or procedures
pe of freight normally carried and fleet size.
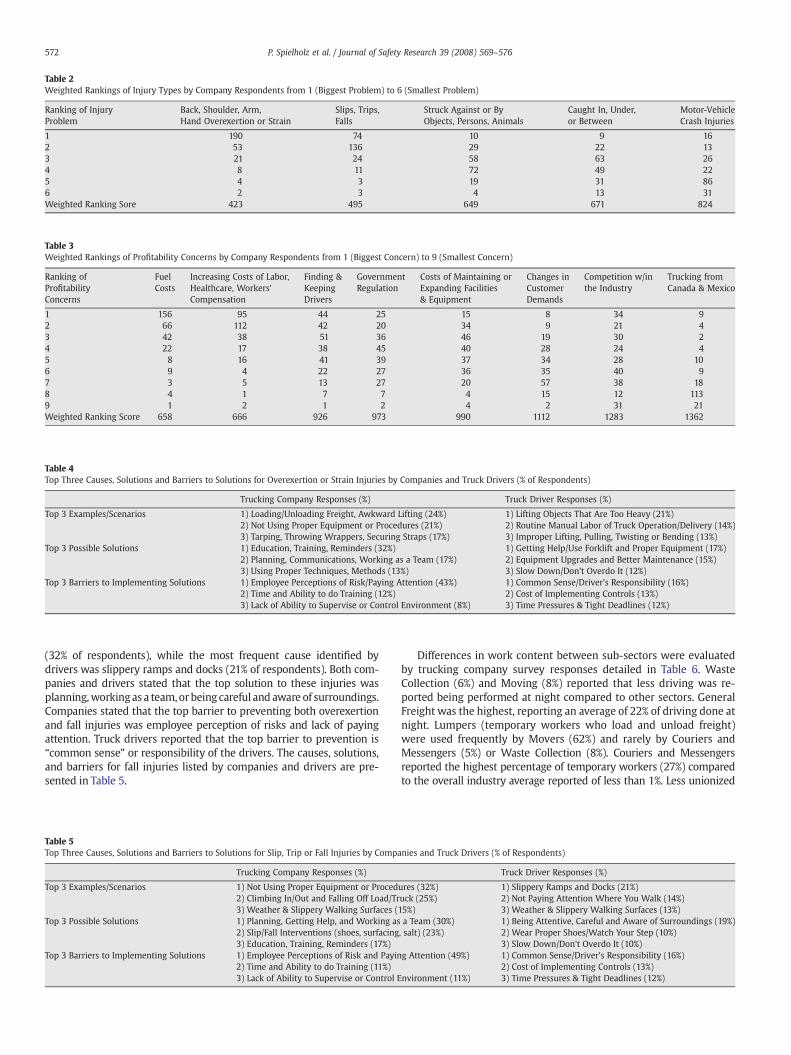
Table 3Weighted Rankings of Profitability Concerns by Company Respondents from 1 (Biggest Concern) to 9 (Smallest Concern)
Ranking ofProfitabilityConcerns
FuelCosts
Increasing Costs of Labor,Healthcare, Workers'Compensation
Finding &KeepingDrivers
GovernmentRegulation
Costs of Maintaining orExpanding Facilities& Equipment
Changes inCustomerDemands
Competition w/inthe Industry
Trucking fromCanada & Mexico
1 156 95 44 25 15 8 34 92 66 112 42 20 34 9 21 43 42 38 51 36 46 19 30 24 22 17 38 45 40 28 24 45 8 16 41 39 37 34 28 106 9 4 22 27 36 35 40 97 3 5 13 27 20 57 38 188 4 1 7 7 4 15 12 1139 1 2 1 2 4 2 31 21Weighted Ranking Score 658 666 926 973 990 1112 1283 1362
Table 2Weighted Rankings of Injury Types by Company Respondents from 1 (Biggest Problem) to 6 (Smallest Problem)
Ranking of InjuryProblem
Back, Shoulder, Arm,Hand Overexertion or Strain
Slips, Trips,Falls
Struck Against or ByObjects, Persons, Animals
Caught In, Under,or Between
Motor-VehicleCrash Injuries
1 190 74 10 9 162 53 136 29 22 133 21 24 58 63 264 8 11 72 49 225 4 3 19 31 866 2 3 4 13 31Weighted Ranking Sore 423 495 649 671 824
Table 4Top Three Causes, Solutions and Barriers to Solutions for Overexertion or Strain Injuries by Companies and Truck Drivers (% of Respondents)
Trucking Company Responses (%) Truck Driver Responses (%)
Top 3 Examples/Scenarios 1) Loading/Unloading Freight, Awkward Lifting (24%) 1) Lifting Objects That Are Too Heavy (21%)2) Not Using Proper Equipment or Procedures (21%) 2) Routine Manual Labor of Truck Operation/Delivery (14%)3) Tarping, Throwing Wrappers, Securing Straps (17%) 3) Improper Lifting, Pulling, Twisting or Bending (13%)
Top 3 Possible Solutions 1) Education, Training, Reminders (32%) 1) Getting Help/Use Forklift and Proper Equipment (17%)2) Planning, Communications, Working as a Team (17%) 2) Equipment Upgrades and Better Maintenance (15%)3) Using Proper Techniques, Methods (13%) 3) Slow Down/Don't Overdo It (12%)
Top 3 Barriers to Implementing Solutions 1) Employee Perceptions of Risk/Paying Attention (43%) 1) Common Sense/Driver's Responsibility (16%)2) Time and Ability to do Training (12%) 2) Cost of Implementing Controls (13%)3) Lack of Ability to Supervise or Control Environment (8%) 3) Time Pressures & Tight Deadlines (12%)
572 P. Spielholz et al. / Journal of Safety Research 39 (2008) 569–576
(32% of respondents), while the most frequent cause identified bydrivers was slippery ramps and docks (21% of respondents). Both com-panies and drivers stated that the top solution to these injuries wasplanning,workingas a team,or being careful and aware of surroundings.Companies stated that the top barrier to preventing both overexertionand fall injuries was employee perception of risks and lack of payingattention. Truck drivers reported that the top barrier to prevention is“common sense” or responsibility of the drivers. The causes, solutions,and barriers for fall injuries listed by companies and drivers are pre-sented in Table 5.
Table 5Top Three Causes, Solutions and Barriers to Solutions for Slip, Trip or Fall Injuries by Compa
Trucking Company Responses (%)
Top 3 Examples/Scenarios 1) Not Using Proper Equipment or Proced2) Climbing In/Out and Falling Off Load/Tr3) Weather & Slippery Walking Surfaces (
Top 3 Possible Solutions 1) Planning, Getting Help, and Working as2) Slip/Fall Interventions (shoes, surfacing3) Education, Training, Reminders (17%)
Top 3 Barriers to Implementing Solutions 1) Employee Perceptions of Risk and Payin2) Time and Ability to do Training (11%)3) Lack of Ability to Supervise or Control E
Differences in work content between sub-sectors were evaluatedby trucking company survey responses detailed in Table 6. WasteCollection (6%) and Moving (8%) reported that less driving was re-ported being performed at night compared to other sectors. GeneralFreight was the highest, reporting an average of 22% of driving done atnight. Lumpers (temporary workers who load and unload freight)were used frequently by Movers (62%) and rarely by Couriers andMessengers (5%) or Waste Collection (8%). Couriers and Messengersreported the highest percentage of temporary workers (27%) comparedto the overall industry average reported of less than 1%. Less unionized
nies and Truck Drivers (% of Respondents)
Truck Driver Responses (%)
ures (32%) 1) Slippery Ramps and Docks (21%)uck (25%) 2) Not Paying Attention Where You Walk (14%)15%) 3) Weather & Slippery Walking Surfaces (13%)a Team (30%) 1) Being Attentive, Careful and Aware of Surroundings (19%), salt) (23%) 2) Wear Proper Shoes/Watch Your Step (10%)
3) Slow Down/Don't Overdo It (10%)g Attention (49%) 1) Common Sense/Driver's Responsibility (16%)
2) Cost of Implementing Controls (13%)nvironment (11%) 3) Time Pressures & Tight Deadlines (12%)
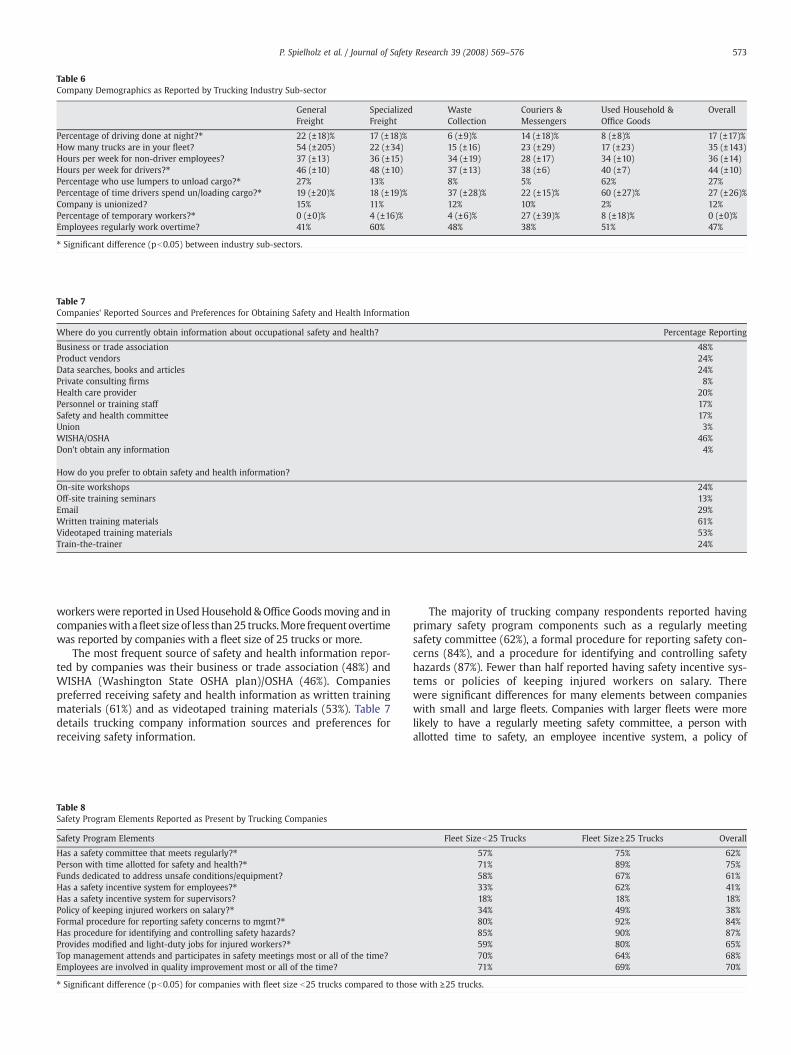
Table 6Company Demographics as Reported by Trucking Industry Sub-sector
GeneralFreight
SpecializedFreight
WasteCollection
Couriers &Messengers
Used Household &Office Goods
Overall
Percentage of driving done at night?⁎ 22 (±18)% 17 (±18)% 6 (±9)% 14 (±18)% 8 (±8)% 17 (±17)%How many trucks are in your fleet? 54 (±205) 22 (±34) 15 (±16) 23 (±29) 17 (±23) 35 (±143)Hours per week for non-driver employees? 37 (±13) 36 (±15) 34 (±19) 28 (±17) 34 (±10) 36 (±14)Hours per week for drivers?⁎ 46 (±10) 48 (±10) 37 (±13) 38 (±6) 40 (±7) 44 (±10)Percentage who use lumpers to unload cargo?⁎ 27% 13% 8% 5% 62% 27%Percentage of time drivers spend un/loading cargo?⁎ 19 (±20)% 18 (±19)% 37 (±28)% 22 (±15)% 60 (±27)% 27 (±26)%Company is unionized? 15% 11% 12% 10% 2% 12%Percentage of temporary workers?⁎ 0 (±0)% 4 (±16)% 4 (±6)% 27 (±39)% 8 (±18)% 0 (±0)%Employees regularly work overtime? 41% 60% 48% 38% 51% 47%
⁎ Significant difference (pb0.05) between industry sub-sectors.
Table 7Companies' Reported Sources and Preferences for Obtaining Safety and Health Information
Where do you currently obtain information about occupational safety and health? Percentage Reporting
Business or trade association 48%Product vendors 24%Data searches, books and articles 24%Private consulting firms 8%Health care provider 20%Personnel or training staff 17%Safety and health committee 17%Union 3%WISHA/OSHA 46%Don't obtain any information 4%
How do you prefer to obtain safety and health information?
On-site workshops 24%Off-site training seminars 13%Email 29%Written training materials 61%Videotaped training materials 53%Train-the-trainer 24%
573P. Spielholz et al. / Journal of Safety Research 39 (2008) 569–576
workerswere reported in UsedHousehold &Office Goodsmoving and incompanieswith afleet size of less than25 trucks.More frequentovertimewas reported by companies with a fleet size of 25 trucks or more.
The most frequent source of safety and health information repor-ted by companies was their business or trade association (48%) andWISHA (Washington State OSHA plan)/OSHA (46%). Companiespreferred receiving safety and health information as written trainingmaterials (61%) and as videotaped training materials (53%). Table 7details trucking company information sources and preferences forreceiving safety information.
Table 8Safety Program Elements Reported as Present by Trucking Companies
Safety Program Elements
Has a safety committee that meets regularly?⁎Person with time allotted for safety and health?⁎Funds dedicated to address unsafe conditions/equipment?Has a safety incentive system for employees?⁎Has a safety incentive system for supervisors?Policy of keeping injured workers on salary?⁎Formal procedure for reporting safety concerns to mgmt?⁎Has procedure for identifying and controlling safety hazards?Provides modified and light-duty jobs for injured workers?⁎Top management attends and participates in safety meetings most or all of the time?Employees are involved in quality improvement most or all of the time?
⁎ Significant difference (pb0.05) for companies with fleet size b25 trucks compared to thos
The majority of trucking company respondents reported havingprimary safety program components such as a regularly meetingsafety committee (62%), a formal procedure for reporting safety con-cerns (84%), and a procedure for identifying and controlling safetyhazards (87%). Fewer than half reported having safety incentive sys-tems or policies of keeping injured workers on salary. Therewere significant differences for many elements between companieswith small and large fleets. Companies with larger fleets were morelikely to have a regularly meeting safety committee, a person withallotted time to safety, an employee incentive system, a policy of
Fleet Sizeb25 Trucks Fleet Size≥25 Trucks Overall
57% 75% 62%71% 89% 75%58% 67% 61%33% 62% 41%18% 18% 18%34% 49% 38%80% 92% 84%85% 90% 87%59% 80% 65%70% 64% 68%71% 69% 70%
e with ≥25 trucks.
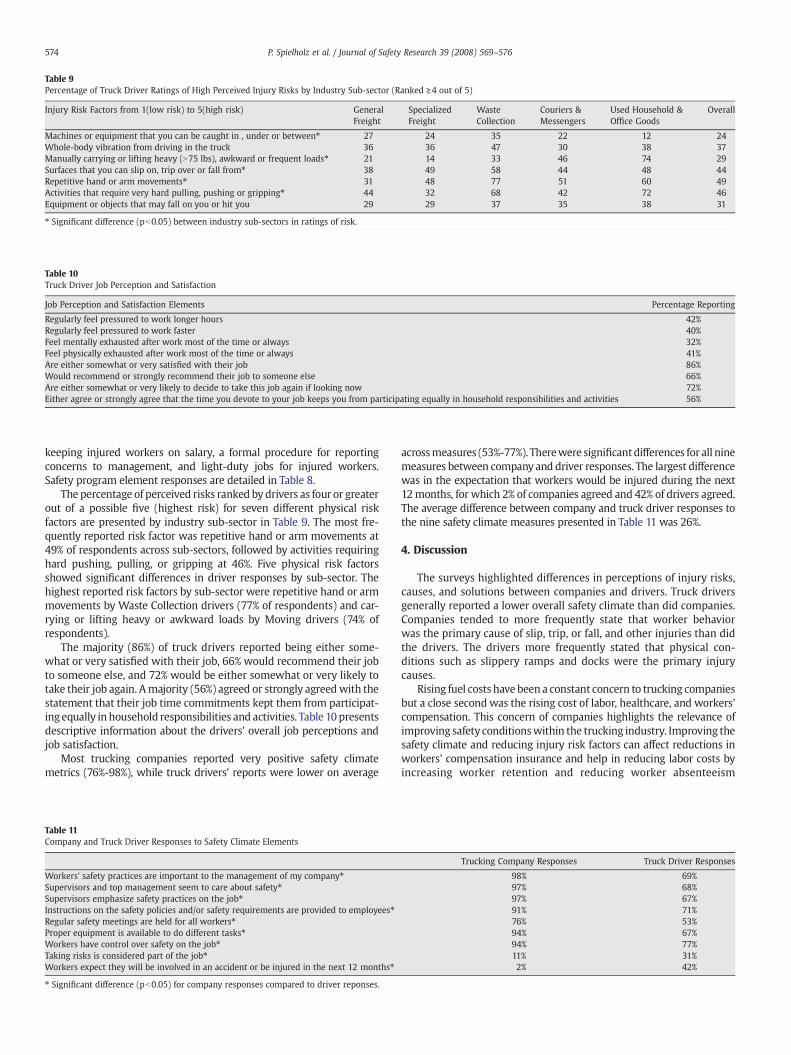
Table 9Percentage of Truck Driver Ratings of High Perceived Injury Risks by Industry Sub-sector (Ranked ≥4 out of 5)
Injury Risk Factors from 1(low risk) to 5(high risk) GeneralFreight
SpecializedFreight
WasteCollection
Couriers &Messengers
Used Household &Office Goods
Overall
Machines or equipment that you can be caught in , under or between⁎ 27 24 35 22 12 24Whole-body vibration from driving in the truck 36 36 47 30 38 37Manually carrying or lifting heavy (N75 lbs), awkward or frequent loads⁎ 21 14 33 46 74 29Surfaces that you can slip on, trip over or fall from⁎ 38 49 58 44 48 44Repetitive hand or arm movements⁎ 31 48 77 51 60 49Activities that require very hard pulling, pushing or gripping⁎ 44 32 68 42 72 46Equipment or objects that may fall on you or hit you 29 29 37 35 38 31
⁎ Significant difference (pb0.05) between industry sub-sectors in ratings of risk.
Table 10Truck Driver Job Perception and Satisfaction
Job Perception and Satisfaction Elements Percentage Reporting
Regularly feel pressured to work longer hours 42%Regularly feel pressured to work faster 40%Feel mentally exhausted after work most of the time or always 32%Feel physically exhausted after work most of the time or always 41%Are either somewhat or very satisfied with their job 86%Would recommend or strongly recommend their job to someone else 66%Are either somewhat or very likely to decide to take this job again if looking now 72%Either agree or strongly agree that the time you devote to your job keeps you from participating equally in household responsibilities and activities 56%
574 P. Spielholz et al. / Journal of Safety Research 39 (2008) 569–576
keeping injured workers on salary, a formal procedure for reportingconcerns to management, and light-duty jobs for injured workers.Safety program element responses are detailed in Table 8.
The percentage of perceived risks ranked by drivers as four or greaterout of a possible five (highest risk) for seven different physical riskfactors are presented by industry sub-sector in Table 9. The most fre-quently reported risk factor was repetitive hand or arm movements at49% of respondents across sub-sectors, followed by activities requiringhard pushing, pulling, or gripping at 46%. Five physical risk factorsshowed significant differences in driver responses by sub-sector. Thehighest reported risk factors by sub-sector were repetitive hand or armmovements by Waste Collection drivers (77% of respondents) and car-rying or lifting heavy or awkward loads by Moving drivers (74% ofrespondents).
The majority (86%) of truck drivers reported being either some-what or very satisfied with their job, 66% would recommend their jobto someone else, and 72% would be either somewhat or very likely totake their job again. Amajority (56%) agreed or strongly agreedwith thestatement that their job time commitments kept them from participat-ingequally in household responsibilities and activities. Table 10presentsdescriptive information about the drivers' overall job perceptions andjob satisfaction.
Most trucking companies reported very positive safety climatemetrics (76%-98%), while truck drivers' reports were lower on average
Table 11Company and Truck Driver Responses to Safety Climate Elements
Workers' safety practices are important to the management of my company⁎Supervisors and top management seem to care about safety⁎Supervisors emphasize safety practices on the job⁎Instructions on the safety policies and/or safety requirements are provided to employees⁎Regular safety meetings are held for all workers⁎Proper equipment is available to do different tasks⁎Workers have control over safety on the job⁎Taking risks is considered part of the job⁎Workers expect they will be involved in an accident or be injured in the next 12 months⁎
⁎ Significant difference (pb0.05) for company responses compared to driver reponses.
acrossmeasures (53%-77%). Therewere significantdifferences for all ninemeasures between company and driver responses. The largest differencewas in the expectation that workers would be injured during the next12months, for which 2% of companies agreed and 42% of drivers agreed.The average difference between company and truck driver responses tothe nine safety climate measures presented in Table 11 was 26%.
4. Discussion
The surveys highlighted differences in perceptions of injury risks,causes, and solutions between companies and drivers. Truck driversgenerally reported a lower overall safety climate than did companies.Companies tended to more frequently state that worker behaviorwas the primary cause of slip, trip, or fall, and other injuries than didthe drivers. The drivers more frequently stated that physical con-ditions such as slippery ramps and docks were the primary injurycauses.
Rising fuel costs have been a constant concern to trucking companiesbut a close second was the rising cost of labor, healthcare, and workers'compensation. This concern of companies highlights the relevance ofimproving safety conditionswithin the trucking industry. Improving thesafety climate and reducing injury risk factors can affect reductions inworkers' compensation insurance and help in reducing labor costs byincreasing worker retention and reducing worker absenteeism
Trucking Company Responses Truck Driver Responses
98% 69%97% 68%97% 67%91% 71%76% 53%94% 67%94% 77%11% 31%2% 42%
575P. Spielholz et al. / Journal of Safety Research 39 (2008) 569–576
(Goggins, Spielholz, & Nothstein, 2008). Company responses to thesurveys indicated there is a potential need for innovative and improvededucational programs topromote safebehavior and toproperly calibraterisk perceptions by drivers. Addressing these issues could have notice-able impacts on trucking companies' productivityand ability to competein a tightening market.
There were several notable differences in work organization anddemographics by sub-sector and fleet size. Factors such as union-ization, amount of overtime, use of temporary workers, drivers' res-ponsibilities for unloading cargo, and others can vary significantlybetween types of trucking companies. Drivers also reported signifi-cant differences in perceived exposure to physical risk factors betweensub-sectors. This points out the sometimes large differences in workcontent between types of trucking. These issues should be consideredwhen developing assessment and control strategies in the truckingindustry.
There are relatively large differences overall between companies'and drivers' perceptions of safety climate elements. This could point tosafety program elements and communication strategies to help theindustry improve employee perception of safety. The majority ofdrivers did report positive job satisfaction, however, a large percen-tage of workers reported issues or work-related stress and work-family conflict. These results highlight important possible contribut-ing and confounding factors to consider within the sector.
The survey findings do appear generalizable to the WashingtonState trucking industry, and likely much of the U.S. sub-sector, how-ever there were several limitations in the current study. Obtaining avalid sample of truck drivers using standard survey techniques waschallenging. The majority of the sample obtained from current licenseinformation was disqualified because of either an invalid address orphone number. This may be in part due to the increase in use ofcellular phones, which are not associated with the address in adirectory look-up. This was a known challenge, though therewas not asystematic difference in the employer NAICS distribution betweentruck drivers who responded and those disqualified. The survey res-pondents are likely a representative sample of truck drivers in theWashington State trucking industry.
Another limitation was that the survey of trucking companiesexcluded those with less than 5 FTE, which eliminated the smallestemployers, and potentially largest proportion of trucking companiesin Washington State. This was a decision made to increase the qualityof the administrative data used to generate the survey sample. It wasfelt that this was necessary, based on previous survey experience, toobtain valid company information. The population of companies intrucking with one or two employees is a large and important part ofthe small businesses within the industry and should be considered forfuture assessment of their specific needs.
A further limitation that must be recognized is the lack of abilityto match employees with specific employers. It is possible, thoughhighly unlikely, that the respondents of both surveys representedlargely the same population of organizations. Identifying specificcompany employment for drivers was not possible because thesample of survey recipients was taken from a database of commercialdrivers license holders, which did not contain that data.
Thefindings from thiswork are being used by SHARP to help providethe Washington State trucking industry with resources to decreasehazards associated with common occupational injuries. Research onthe national level is needed to determine regional differences in needsand to further differentiate the needs of long-haul drivers, loading dock,and other workers within the industry. Development and evaluationof both physical and organizational interventions to reduce injuries intrucking may help to decrease work-related morbidity in this high-riskindustry.
The survey findings point to the need for systematic interventionsto control the risks of work-related musculoskeletal disorders(WMSDs) and slip, trip, or fall injuries in the trucking industry. These
were ranked as the top two types of injuries by both employers anddrivers, which matches the history of compensable workers' compen-sation claims inWashington State (Bonauto et al., 2006). Implementa-tion of engineering controls for material handling would address themost frequently reported cause of WMSDs. Regular hazard identifica-tion and control are also needed to address slip, trip, and fall injuries intrucking. Implementation of organizational-level changes addressingcompany processes may also provide an opportunity for improve-ments in the industry.
Acknowledgements
The authors wish to thank Michael Foley, Darrin Adams, EdmundRauser, Randy Clark and Scott Edwards of the SHARP Program for theircontributions to the development and implementation of the surveys.This work was supported by the Washington State Department ofLabor & Industries and by grant 3 U60 OH008487 from the Centers forDisease Control and Prevention's National Institute for OccupationalSafety and Health. The contents are solely the authors responsibilityand do not necessarily reflect the official views of the WashingtonState Department of Labor & Industries or NIOSH.
References
Beilock, R. (1995). Schedule-induced hours-of-service and speed limit violations amongtractor-trailer drivers. Accident Analysis and Prevention, 27(1), 33−42.
Braver, E. R., Preusser, C. W., Preusser, D. F., Baum, H. M., Beilock, R., & Ulmer, R. (1992).Long hours and fatigue: a survey of tractor-trailer drivers. Journal of Public HealthPolicy, 13(3), 341−366.
Belzer, M., Rodriguez, D., & Sedo, S. (2002). Paying for Safety: An Economic Analysis ofthe Effect of Compensation on Truck Driver Safety. Final Report, Federal HighwayAdministration/Federal Motor Carrier Safety Administration Prime Contract NumberDTFH 61-98-C-0061.
Bonauto, D., Silverstein, B., Adams, D., & Foley, M. (2006). Prioritizing industries foroccupational injury and illness prevention and research, Washington State workers'compensation claims, 1999-2003. Journal of Occupational and Environmental Medicine,48(8), 840−851.
Dedobbeleer, N., & Beland, F. (1991). A safety climate measure for construction sites.Journal of Safety Research, 22, 97−103.
Goggins, R., Spielholz, P., & Nothstein, G. (2008). Estimating the effectiveness ofergonomics interventions through case studies: implications for predictive cost-benefit analysis. Journal of Safety Research, 39(3), 339−344.
Leigh, J., Waehrer, G., Miller, T., & Keenan, C. (2004). Costs of occupational injury andillness across industries. Scandinavian Journal of Work Environment and Health, 30,199−205.
Mayhew, C., & Quinlan, M. (2000). Occupational health and safety Amongst 300 longdistance truck drivers: results of an interview-based survey. In Safety Inquiry intoLong Haul Trucking Industry New SouthWales, Australia: Motor Vehicle Authority ofNew South Wales.
Monaco, K., & Williams, E. (2000). Assessing the determinants of safety in the truckingindustry. Journal of Transportation and Statistics, 3(1), 1−11.
Robb, M., & Mansfield, N. (2007). Self-reported musculoskeletal problems amongstprofessional truck drivers. Ergonomics, 50(6), 814−827.
Saltzman, G., & Belzer, M. (2007). Truck Driver Occupational Safety and Health: 2003Conference Report and Selective Literature Review. U.S. Centers for Disease Controland Prevention, National Institute for Occupational Safety and Health, DHHS (NIOSH)Publication No. 2007-120 Washington, DC: NIOSH.
U.S. Bureau of Labor Statistics, Census of Fatal Occupational Injuries (BLS). (2007). 2006Annual Summary of Fatal Occupational Injuries. Washington, DC: Author.
U.S. Bureau of Labor Statistics, Survey of Occupational Injuries and Illnesses (BLS).(2007). 2006 Summary of Non-Fatal Occupational Injuries and Illnesses. Washington,DC: Author.
Peregrin Spielholz received his PhD in Occupational and Environmental Health from theUniversity of Washington and BSE and MSE degrees in Industrial and OperationsEngineering from the University ofMichigan. Dr. Spielholz is currently Chief Safety Officerat Sound Transit. Previously, he was principal investigator for the Washington FatalityAssessment and Control Evaluation program and for the Washington Trucking InjuryReduction Emphasis program. Dr. Spielholz's research interests are in interventiondevelopment, dissemination strategies, impact assessment, exposure assessment, andhuman-centered design.
Jennifer Cullen received her PhD in Industrial and Organizational Psychology fromPortland StateUniversity. Dr. Cullen is nowworking at theSacramentoCounty EmploymentOffice. Her research interests include work-life balance, occupational stress, and studyingthe impact of organizational-level interventions on employee health and perceptions ofsafety climate.
fety Research 39 (2008) 569–576
Caroline Smith received her Masters' in Public Health from the University of Washington.
Ms. Smith is an epidemiologist at the SHARP research program in the Washington StateDepartment of Labor & Industries. Her research interests include musculoskeletal disorders,work-life balance, contingent workers and other special populations such as older workersand immigrant populations. Ms. Smith is also interested in the areas of social epidemiology,health communication and program evaluation.Ninica Howard received her bachelor of science degree in kinesiology from Simon FraserUniversity in Burnaby, British Columbia and her MS in occupational ergonomics from theUniversity ofMassachusetts. Ms. Howard is an ergonomist at the SHARP research program intheWashington State Department of Labor & Industries. She has been involved in research invarious industries including construction, dairy farming, nursing homes and tree nurseries.Ms. Howard's interests lie in the development and application of ergonomic exposureassessment, macro-ergonomics, and musculoskeletal epidemiology.
Barbara Silverstein received her MS degree in nursing from the University of California SanFrancisco, her MPH in Epidemiology and Environmental and Industrial Health from theUniversity of Michigan, and her Ph.D. in Epidemiologic Science from the University ofMichigan. Dr. Silverstein is the research director at the SHARP research program in theWashington State Department of Labor & Industries. She has worked on ergonomics-relatedissues at OSHA, the University of Michigan Center for Ergonomics, the Finnish Institute ofOccupational Health, and the California Department of Health Services. Her major areas ofresearch have been identification and control of work-related musculoskeletal disorders,comparison of surveillance methods and intervention studies to control these disorders.
576 P. Spielholz et al. / Journal of Sa
DavidBonauto receivedanundergraduatedegree fromBowdoinCollege, anMDdegree fromColumbia University College of Physicians and Surgeons, and anMPH from the University ofWashington. Dr. Bonauto is the occupational medicine physician at the SHARP researchprogram in the Washington State Department of Labor & Industries. He is a board certifiedinternal medicine and occupational medicine physician. He is a clinical assistant professor inOccupational Medicine in the Department of General Internal Medicine at the University ofWashington. Dr. Bonauto's interests are chemically and biologically-related illness as well asmusculoskeletal disorders.