assessment of nutritional status in the … of nutritional status in the healthcare setting in spain...
TRANSCRIPT
196
Nutr Hosp. 2015;31(Supl. 3):196-208ISSN 0212-1611 • CODEN NUHOEQ
S.V.R. 318
Assessment of nutritional status in the healthcare setting in Spain Rocío Campos del Portillo1, Samara Palma MiIla1, Natalia García Váquez2, Bricia Plaza López1, Laura Bermejo López1, Pilar Riobó Serván3, Pedro Pablo García-Luna4 and Carmen Gómez-Candela1
1Nutrition Department. Hospital Universitario La Paz (IdiPAZ Health Research Institute). Universidad Autónoma de Madrid. 2Pharmacy Department. Hospital Universitario La Paz, Madrid. 3Endocrinology Department. Fundación Jiménez Díaz, Madrid. 4Nutrition Department . Hospital Virgen del Rocío, Sevilla. Spain.
Abstract
Early identification of undernourished patients in the healthcare setting, and their nutritional treatment, are essential if the harmful effects of poor nourishment are to be avoided and care costs kept down.
The aim of assessing nutritional status is to deter-mine the general health of a patient from a nutritional viewpoint. All hospitalised patients should undergo nutri-tional screening within 24-48 h of admission, as should any patient who shows signs of being malnourished when visiting any healthcare centre. The infrastructure and resources available, the possibilities of automisation, and the healthcare setting in which such assessment must be performed, etc., determine which method can be used. The European Society of Parenteral and Enteral Nutri-tion (ESPEN) recommends the use of the Nutritional Risk Screening–2002 (NRS-2002) method for hospitalised pa-tients, the Malnutrition Universal Screening Tool (MUST) in the community healthcare setting, and the first part of the Mini-Nutritional Assessment (MNA) for elderly pa-tients. In centres where screening can be computerised, the CONUT® or INFORNUT® methods can be used.
A nutritional diagnosis is arrived at using the patient’s medical history, a physical examination (including an-thropometric assessment), biochemical analysis, and functional tests. No single variable allows a diagnosis to be made. The Subjective Global Assessment (SGA) and MNA tests are useful in nutritional assessment, but they are not universally regarded as the gold standard. At our hospital, and at many other centres in the Spanish health system, the Nutritional Status Assessment (NSA) method (in Spanish Valoración del Estado Nutricional) is used, which involves the SGA method, the taking of anthropo-metric measurements, and biochemical analysis.
After making a nutritional diagnosis, which should be included in the patient’s medical history adhering to International Classification of Diseases code 9 (ICD-9), and prescribing a nutritional treatment, the patient should be followed up. No single marker can be used to monitor progress; interpretations will once again require examination of the patient’s medical history, the taking of anthropometric measurements and laboratory tests. Depending on whether a patient is ambulatory or hos-
VALORACIÓN DEL ESTADO NUTRICIONAL EN EL ENTORNO ASISTENCIAL EN ESPAÑA
Resumen
La identificación precoz del paciente malnutrido en el entorno asistencial y su abordaje nutricional es esencial para minimizar los efectos deletéreos de la desnutrición así como para disminuir el gasto sanitario.
La valoración nutricional tiene como objetivo deter-minar el grado de salud desde el punto de vista de la nu-trición y debe realizarse en todo paciente hospitalizado en las primeras 24-48 horas, y en el ámbito ambulatorio, ante cualquier paciente que presente sospecha de des-nutrición. La elección del método de cribaje depende de la infraestructura y recursos disponibles, posibilidad de automatización y ámbito asistencial, entre otros. Así, la European Society of Parenteral and Enteral Nutrition (ESPEN) recomienda el uso del Nutritional Risk Scree-ning–2002 (NRS-2002) en el paciente hospitalizado, el Malnutrition Universal Screening Tool (MUST) a nivel co-munitario y la primera parte del Mini-Nutritional Assess-ment (MNA) en población anciana. En aquellos centros en los que exista posibilidad de informatizar el screening pueden implantarse el CONUT® (Control Nutricional) o el INFORNUT®.
El diagnóstico nutricional se realiza a través de la his-toria clínica y dietética, exploración física que incluya an-tropometría, análisis bioquímico y pruebas funcionales. No existe un único parámetro que per sé, que permita el diagnóstico nutricional. La Valoración Global Subjetiva (VGS) y el MNA son herramientas útiles para la valora-ción nutricional, aunque no se cuenta con ellas como el “gold estándar” de forma universal. En algunos de nues-tros centros (e.j. el Hospital La Paz) y en muchos otros, nos servimos de lo que llamamos “Valoración del Estado Nutricional”, que resulta de la integración de la VGS, an-tropometría y bioquímica.
Tras un adecuado diagnóstico nutricional, que, ideal-mente, debería recogerse en la historia según la codifica-ción CIE-9, y una vez hecha la prescripción nutricional, se es necesario un seguimiento para evaluar la adecua-ción de la misma. Tampoco en el seguimiento nutricional existe un marcador único, basándose de nuevo en la in-terpretación de un conjunto de datos de historia clínica, antropometría y laboratorio. Según el entorno asistencial en el que nos encontremos (ambulante u hospitalario) Correspondence: Carmen Gómez Candela.
Nutrition Department. Hospital U La Paz. Madrid. Spain. IdiPAZ. University Autonoma of Madrid. Paseo de la Castellana 261, 28046 Madrid. España. E-mail: [email protected]
022_Evaluación del estado nutricional en el entorno asistencial.indd 196 12/02/15 14:18
Assessment of Nutritional Status in the Healthcare Setting in Spain 197
ABBREVIATIONS
AC: Arm circumference.APACHE II: Acute Physiology and Chronic Health
Evaluation II.ASPEN: American Society of Parenteral and Ente-
ral Nutrition.BAPEN: British Association of Parenteral and En-
teral Nutrition.BEI: Bioelectrical impedance.CONUT®: Control Nutricional (Nutritional Con-
trol).CRP: C-reactive protein.DXA: Dual X-ray absorptiometry.ESPEN: European Society of Parenteral and Enteral
Nutrition.EWGSOP: European Working Group on Sarcopenia
in Older People.FAACT: Functional Assessment of Anorexia/Ca-
chexia Therapy.FM: Fat mass.FFM: Fat free mass.GNRI: Geriatric Nutritional Risk Index.ICD: International classification of Diseases.IL-6: Interleukin 6.MNA: Mini-Nutritional Assessment.MQ-SGA: Modified Quantitative Subjective Global
Assessment.MR: Magnetic Resonance.MST: Malnutrition Screening Tool.MUST: Malnutrition Universal Screening Tool.ND: Nutritional diagnosis.NRI: Nutritional Risk Index.NRS-2002: Nutritional Risk Screening - 2002.NSA: Nutritional Status Assessment.PG-SGA: Patient-Generated Subjective Global As-
sessment.RBP: Retinol binding protein.SGA: Subjective Global Assessment.SOFA-score: Sequential Organ Failure Assessment
score.TST: triceps skin fold thickness.
Introduction
Undernourishment in the healthcare setting is a serious problem that affects some 30-50% of all hospitalised pa-tients at the time of admission. It has a negative influen-
ce on their progress and is associated with an increased number of hospital-acquired infections, a longer hospital stay, and a higher rate of mortality1. The early identifica-tion of undernourished patients, and their correct nutritio-nal treatment, are essential if the harmful effects of poor nourishment are to be avoided and care costs kept down2.
The aim of a nutritional diagnosis (ND) is to deter-mine the general health of the patient from a nutritio-nal viewpoint. This allows the identification of those who are undernourished, or who, because of their me-dical condition or associated treatment, are at risk of becoming undernourished; appropriate treatment can then be prescribed and follow-up initiated2,3.
Nutritional screening methods
Nutritional screening allows the identification of sub-jects at risk of undernutrition, as well as those who need a more exhaustive study and an ND. The guides produ-ced by the European Society of Parenteral and Enteral Nutrition (ESPEN) refer to nutritional risk as a situation in which the outcome is related to nutritional factors, and which is improvable by nutritional intervention4.
Nutritional screening should be included in the initial assessment of all hospitalised patients, thus allowing the early detection of those at risk3,5; it should be perfor-med within 24-48 of admission6. Nutritional assessment should also be performed in the ambulatory setting whe-never a patient presents with anorexia, weight loss, per-sistent vomiting or diarrhoea, dysphagia, loss of muscle mass, or loss of subcutaneous fat, etc.6.
Several validated screening methods can be used, the choice of which will depend on the type of popu-lation in question, the availability of personnel trained in nutrition, and the possibility of automisation, etc. The most commonly used include the Malnutrition Screening Tool (MST), the Nutritional Risk Scree-ning (NRS-2002) method, the Malnutrition Univer-sal Screening Tool (MUST), and the first part of the Mini-Nutritional Assessment (MNA) method. The guides produced by the ESPEN recommend the NRS-2002 method for use with hospitalised patients, MUST in the community healthcare setting, and the MNA me-thod when dealing with elderly people7. In the Spanish region of Andalusia, MUST is regularly used.
In recent years, two automated methods were de-veloped and validated in Spain: the CONUT®8 and INFORNUT® methods9. The CONUT® method can
pitalised, the follow-up assessment times and variables measured will differ.
(Nutr Hosp 2015;31(Supl. 3):196-208)
DOI:10.3305/nh.2015.31.sup3.8767Key words: Nutritional screening. Subjective Global As-
sessment (SGA). Nutritional Status Assessment (NSA). Un-dernutrition.
existirán unos tiempos de evaluación y parámetros de elección distintos.
(Nutr Hosp 2015;31(Supl. 3):196-208)
DOI:10.3305/nh.2015.31.sup3.8767Palabras clave: Cribado nutricional. Valoración Global
Subjetiva (VSG). Valoración del Estado Nutricional (VEN). Desnutrición.
022_Evaluación del estado nutricional en el entorno asistencial.indd 197 12/02/15 14:18
198 ESTIMATE OF ENERGY AND NUTRIENT INTAKE, BIOMARKERS AND VALUES OF REFERENCE
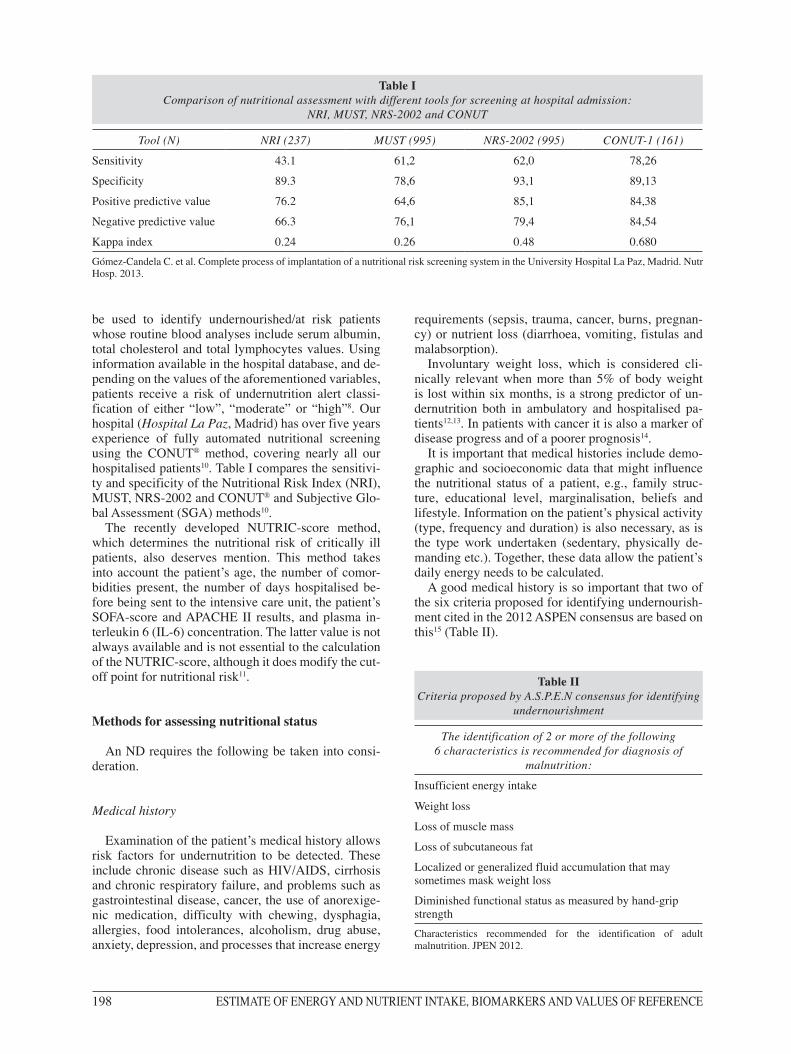
be used to identify undernourished/at risk patients whose routine blood analyses include serum albumin, total cholesterol and total lymphocytes values. Using information available in the hospital database, and de-pending on the values of the aforementioned variables, patients receive a risk of undernutrition alert classi-fication of either “low”, “moderate” or “high”8. Our hospital (Hospital La Paz, Madrid) has over five years experience of fully automated nutritional screening using the CONUT® method, covering nearly all our hospitalised patients10. Table I compares the sensitivi-ty and specificity of the Nutritional Risk Index (NRI), MUST, NRS-2002 and CONUT® and Subjective Glo-bal Assessment (SGA) methods10.
The recently developed NUTRIC-score method, which determines the nutritional risk of critically ill patients, also deserves mention. This method takes into account the patient’s age, the number of comor-bidities present, the number of days hospitalised be-fore being sent to the intensive care unit, the patient’s SOFA-score and APACHE II results, and plasma in-terleukin 6 (IL-6) concentration. The latter value is not always available and is not essential to the calculation of the NUTRIC-score, although it does modify the cut-off point for nutritional risk11.
Methods for assessing nutritional status
An ND requires the following be taken into consi-deration.
Medical history
Examination of the patient’s medical history allows risk factors for undernutrition to be detected. These include chronic disease such as HIV/AIDS, cirrhosis and chronic respiratory failure, and problems such as gastrointestinal disease, cancer, the use of anorexige-nic medication, difficulty with chewing, dysphagia, allergies, food intolerances, alcoholism, drug abuse, anxiety, depression, and processes that increase energy
requirements (sepsis, trauma, cancer, burns, pregnan-cy) or nutrient loss (diarrhoea, vomiting, fistulas and malabsorption).
Involuntary weight loss, which is considered cli-nically relevant when more than 5% of body weight is lost within six months, is a strong predictor of un-dernutrition both in ambulatory and hospitalised pa-tients12,13. In patients with cancer it is also a marker of disease progress and of a poorer prognosis14.
It is important that medical histories include demo-graphic and socioeconomic data that might influence the nutritional status of a patient, e.g., family struc-ture, educational level, marginalisation, beliefs and lifestyle. Information on the patient’s physical activity (type, frequency and duration) is also necessary, as is the type work undertaken (sedentary, physically de-manding etc.). Together, these data allow the patient’s daily energy needs to be calculated.
A good medical history is so important that two of the six criteria proposed for identifying undernourish-ment cited in the 2012 ASPEN consensus are based on this15 (Table II).
Table I Comparison of nutritional assessment with different tools for screening at hospital admission:
NRI, MUST, NRS-2002 and CONUT
Tool (N) NRI (237) MUST (995) NRS-2002 (995) CONUT-1 (161)
Sensitivity 43.1 61,2 62,0 78,26
Specificity 89.3 78,6 93,1 89,13
Positive predictive value 76.2 64,6 85,1 84,38
Negative predictive value 66.3 76,1 79,4 84,54
Kappa index 0.24 0.26 0.48 0.680Gómez-Candela C. et al. Complete process of implantation of a nutritional risk screening system in the University Hospital La Paz, Madrid. Nutr Hosp. 2013.
Table II Criteria proposed by A.S.P.E.N consensus for identifying
undernourishment
The identification of 2 or more of the following 6 characteristics is recommended for diagnosis of
malnutrition:
Insufficient energy intake
Weight loss
Loss of muscle mass
Loss of subcutaneous fat
Localized or generalized fluid accumulation that may sometimes mask weight loss
Diminished functional status as measured by hand-grip strengthCharacteristics recommended for the identification of adult malnutrition. JPEN 2012.
022_Evaluación del estado nutricional en el entorno asistencial.indd 198 12/02/15 14:18
Assessment of Nutritional Status in the Healthcare Setting in Spain 199
Physical examination
A physical examination should pay special atten-tion to signs that indicate a nutritional deficit, e.g., muscular atrophy (the deltoid and quadriceps should be inspected for this), a loss of subcutaneous fat (checked by ‘pinching’ the skin of the upper torso), the state of hydration, the existence of oedema, and the presence of conjunctival xerosis, Bitot’s spots, dry and scaly skin, stomatitis, glositis, discoloured hair, and follicular hyperkeratosis, etc.
Dietary history
This requires qualitative and qualitative information be gathered via questioning regarding the patient’s normal food intake. It allows an idea to be formed of the patient’s energy intake, and the detection of die-tary imbalances. Patients commonly overestimate their food intake16. Information should be collected on the type of food consumed, meal frequency, anoma-lies in nutritional behaviour, problems in chewing or swallowing, and level of autonomy in terms of buying, cooking and eating food. When putting together a die-tary history, patients should be asked about their eating patterns for (normally) the past month, along with their intake for the last three days, and the frequency with which they take different foods16. In the hospital set-ting it is very useful to reflect the patient’s food intake in the previous 24 h as a percentage of the food provi-ded (<25%, about 50%, about 75% or 100%).
Anthropometric measurements
Such measurements allow body size and propor-tions to be determined easily and non-invasively. The results are easily reproducible by trained personnel. They allow the comparison with standard figures for the population and can detect changes over time in the same individual.
The anthropometric measurements of greatest use in the assessment of nutritional status are:
Height. This is obtained either directly using a hei-ght meter and with the patient standing, or indirectly via, for example, the measurement of the leg or the outstretched arms. The British Association of Parente-ral and Enteral Nutrition (BAPEN) recommends me-asuring the ulna for estimating the height of adults17.
Body weight. This should be measured using a ca-librated balance. The presence of factors that might affect the result, e.g., ascites or oedema, should be taken into account. The following weight-associated variables may need to be determined or calculated:
– Current body weight or weight at the time of as-sessment.
– Normal body weight or healthy body weight. – Ideal body weight, calculated taking into account
age, sex and patient constitution. Reference can be made to standard tables.
– Adjusted weight. This is the intermediate weight between the real and the ideal weight. It can be useful for calculating energy requirements in obe-se and in very undernourished patients: adjusted weight = [(real weight – ideal weight) x correc-tion factor] + ideal weight. The correction factor is 0.25 for grade or I or II obesity, and 0.5 for grade III; no correction factor is used when the patient is undernourished.
– Percentage weight loss. This is the variation in body weight with respect to the normal body wei-ght and time. A 2% loss per week is considered serious, as is a 5% loss in one month, 7.5% in three months, or 10% in six months. The greater the weight loss, and the shorter the time within which this occurs, the more severe a situation16.
Body mass index (BMI). This is a ratio between wei-ght and body height squared. For the non-elderly po-pulation, a normal BMI lies between 18.5 and 25 kg/m2. In adults, a BMI of <16 kg/m2 is associated with increased mortality, while in elderly people a BMI of <25 kg/m2 is associated with increased mortality18.
Body composition analysis
The body composition is the sum of the different tis-sues and systems that form the human organism. There are two models of body composition: the bicompart-mental and multicompartmental models. The former is the most commonly used in clinical practice. This divides the body into fat mass (FM) and fat-free mass (FFM). About 50% of the FM is subcutaneous; it can therefore easily be determined by measuring skin fold thickness. Different skin fold thicknesses can be me-asured, e.g., the triceps (TST), subscapular, bicipital, and abdominal skin fold thicknesses. The TST is per-haps the most useful given its accessibility and its good relationship with the FM. It is measured on the back of the non-dominant arm midway between the acromion and olecranon processes, with the outstretched arm re-laxed, using a Lange- or Harpenden-type lipocaliper. The mean of three consecutive measurements (mm) is taken and compared against normal reference values according to the patient’s age and sex.
The somatic protein component of the body is nor-mally measured via the muscular circumference of the arm (MCA), which is determined from the TST and the arm circumference (AC) measured in cen-timetres midway between the acromion and olecra-non processes: CMB MCA = AC - (TST x 0.314). Its value is related to the quantity of muscular protein possessed; values below the 5th percentile represent severe undernourishment.
Body composition can also be determined using more complex (though not always available) techniques such
022_Evaluación del estado nutricional en el entorno asistencial.indd 199 12/02/15 14:18

200 ESTIMATE OF ENERGY AND NUTRIENT INTAKE, BIOMARKERS AND VALUES OF REFERENCE
as bioelectrical impedance (BEI), dual X-ray absorptio-metry (DXA) or magnetic resonance (MR). Although DXA provides quite accurate estimates of the FM, FFM and bone mass, it exposes patients to X-rays; it cannot, therefore, be repeatedly used. In contrast, BEI is cheap, innocuous, and can be repeated over and again without harm to the patient. It is based on the resistance of body tissues to the passage of an electrical current. The FFM offer little resistance compared to the FM. It can be used with both healthy persons and patients who are stably hydrated, and its use in the assessment of sarcopenia has been evaluated19. However, BEI is not recommen-ded when patients are at the extreme of the BMI range or when they show oedema20.
Biochemical variables
The plasma concentrations of different protein, vita-min and trace element markers are measured.
Plasma proteins reflect the visceral protein con-dition. They are synthesised in the liver, and from a clinical standpoint are differentiated according to their half life. They behave as inverse acute phase reactants; their concentration can therefore be reduced indepen-dent of the nutritional status if the patient has suffered some severe aggression21,22. It can therefore also be important to determine the C-reactive protein (CRP) concentration so that the inflammatory status is known and can be taken into account. The most common plas-ma proteins analysed are:
– Albumin. This is the main protein synthesised in the liver. It has a half life of about 21 days. The body has a large functional reserve of this protein. Low albumin is a good predictor of mortality in hospitalised patients23, but it is not very useful for monitoring nutritional status. In addition, hypoal-buminaemia can affect plasma calcium, zinc and magnesium levels; this should be taken into ac-count when treating possible deficits24.
– Transferrin. This protein transports iron in the plasma and has a half life of 8-10 days. Its plas-ma concentration is strongly associated with liver function and the presence of anaemia or infec-tions25. Its usefulness is therefore reduced.
– Prealbumin. This has a half life of two days. It transports thyroid hormone and, like other plasma proteins, its concentration is conditioned by in-fections, and other disease processes26. However, it is the best protein marker of nutritional status16. Unlike albumin, prealbumin is not affected by the state of hydration. High concentrations of preal-bumin can be encountered in patients suffering from acute alcohol poisoning and those being treated with corticoids27.
– Retinol binding protein (RBP). This has a half life of just 10 h. Like prealbumin, it can therefore ra-pidly reflect changes in nutritional status. Howe-
ver, its level is frequently affected by kidney func-tion, or in patients showing signs of stress (it is, therefore, not so useful in hospitalised patients).
A low cholesterol level is a classic sign of undernu-trition and is taken into account by automatic scree-ning methods such as CONUT®. However, given the extended use of cholesterol-lowering drugs, even by elderly people, its interpretation in arriving at an ND is limited.
Serum vitamin and mineral concentrations can also provide clues on nutritional status. Concentrations should always be determined when deficits are sus-pected, and should always be tested in patients with moderate to severe undernutrition.
The creatinine-height index
The creatinine height index is used to assess somatic protein levels and requires all urine be collected over a 24 h period. The values obtained can be affected by kidney failure.
Nitrogenated balance
The nitrogenated balance measures the relationship between the nitrogen provided and that catabolised. The first is determined from the quantity of protein taken in, and the second from the amount of urea ex-creted at 24 h, the loss of nitrogen in the faeces and sweat, and losses through aspiration tubes, drainages and fistulas.
Functional tests
The functional tests most commonly used in nu-tritional status testing are dynamometry and immune system function studies.
Undernutrition leads to a fall in the number of T lymphocytes, and counting these cells provides a re-latively cheap way of examining nutritional status. Immune function can also be measured via delayed hypersensitivity tests22. However, since immune func-tion can be altered by drugs (e.g., corticoids, chemo-therapeutic agents, etc.), surgery, or advanced age, it is not always a useful marker, especially in the elderly28.
Dynamometry is widely used and has been vali-dated for the assessment of muscular strength in the hospital setting29. It is a good marker of nutritional status and can be used in nutritional intervention studies30. Further, it is easy to perform and provides quantitative data that can be used in the diagnosis of sarcopenia; one diagnostic criterion is a manual compressive force of <30 kg in men and <20 kg in women19. Muscular strength is affected early by nu-tritional depravation, but recovers quickly with nu-
022_Evaluación del estado nutricional en el entorno asistencial.indd 200 12/02/15 14:18
Assessment of Nutritional Status in the Healthcare Setting in Spain 201
tritional restoration – much more so than muscular mass (whether measured anthropometrically or via BEI, DXA or RM). It is therefore very useful for detecting undernourishment early, and in nutritional monitoring29. Flood et al. report an increase in ma-nual compressive strength just 15 days after nutri-tional intervention in undernourished patients31. The measurement of manual compressive strength is that most commonly used to determine muscular streng-th in clinical practice. An inverse relationship exists between the pressure that can be produced and the number of postoperative complications, the length of hospital stay, and hospital readmission rate30. The ASPEN consensus includes this method as a means of identifying undernutrition15 (Table II). In healthy people, age and sex are the most useful predictors of muscular strength, with no significant differences seen between obese and normal weight subjects. This renders the measurement of this variable of interest in obese patients who become undernourished; in such patients, skin fold thickness measurements and the BMI are of little use. In patients with acute or chronic disease, who are immobilised, who need to take certain medications (corticosteroids), who have comorbidities such as fibromyalgia30, or in elderly, the use of this variable in monitoring nutritional in-terventions is somewhat controversial32.
Matos et al. performed a cross-sectional study to determine the usefulness of dynamometry, employing the manual compressive test as a nutritional screening tool. They concluded it might be of use, but that more work was needed to define cut-off points33.
Subjective global assessment
The SGA method, which was first described by Detsky over 20 years ago, allows an ND to be arrived at via the examination and complementation of a pa-tient’s medical history and a physical examination34.
SGA can be used with all patients and in all clinical settings. It can be performed quickly and is reprodu-cible, and shows little inter-observer variation when performed by trained personnel35. It requires:
– The medical history be complemented to inclu-de information of changes in body weight, cu-rrent food intake be compared to normal food intake, any digestive symptoms in the previous two weeks be recorded, and the patient’s func-tional capacity and metabolic requirements be determined.
– A physical examination, including manual explo-ration of subcutaneous fat and muscle loss, and checking for oedema and ascites.
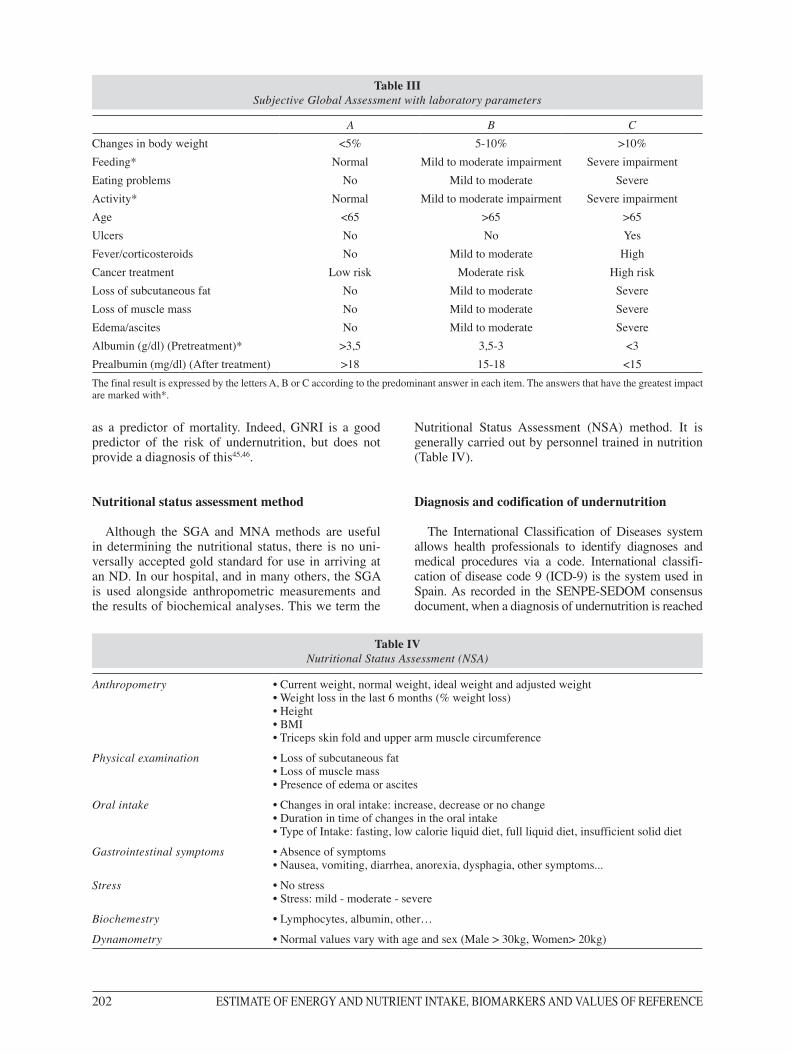
Each of the above variables is measured on a quali-tative three-point scale. Using these results, patients can then be classified as “A” or well nourished, “B” showing
moderate undernourishment or at risk of undernutrition, and “C” undernourished. Weight loss, a low food in-take, and the loss of muscular or subcutaneous fat have a greater weighting in the final classification (Table III).
Variations of the SGA method exist, such as Pa-tient Generated Subjective global assessment (PG-SGA), which is used in the oncological setting36, and the Modified Quantitative Subjective Global Assessment (MQ-SGA) method, which is widely used to monitor patients undergoing dialysis38. Both quantify the degree of malnutrition using a points system.
Mini mutritional assessment
The MNA method is the method of choice for use with the elderly. It has been validated for use with both institutionalised39 and hospitalised40 elderly persons, and is especially useful for detecting risks before weight loss or hypoptreinaemia occurs. It is a simple, relatively quick test, that reflects food intake and anthropometric measurements well. The score is also correlated with the length of hospital stay and the risk of mortality4,41,4. Its sensitivity is 96% and its specificity 98%41. It can also be used for nutritional monitoring4,43.
The method has a screening and a scoring compo-nent4 with a total of 18 sections that cover 30 awarded points. The screening component covers six of these 18 sections, and when these return a total under 12 points the patient can be said to be at nutritional risk. When this is the case, the next 12 sections need to be taken into account. The final score of those who originally scored under 12 points in screening, suggests the type of nutritional intervention that should be followed44.
– Over 23.5 points: patient well nourished. The MNA should be repeated in the future and nu-tritional education given regarding healthy ea-ting.
– From 17 to 23.5 points: patient at risk of under-nutrition. The causes of this risk should be deter-mined and education given to enrich the diet, with supplements prescribed in some cases.
– Under 17 points: clear undernutrition. Nutritional intervention is needed, the type depending on the cause of the patient’s condition.
The MNA is of limited use in elderly persons with dementia, who are in a confused state, or who suffer aphasia or apraxia. In such patients, and when no body weight is available, the Geriatric Nutritional Risk In-dex (GNRI) can be used instead, or in a complemen-tary fashion. The latter is an adaptation of the NRI, which instead of the true weight of the patient uses the ideal weight (according to the Lorenz formula). GNRI gives greater weight to the plasma albumin concentra-tion than does the NRI, rendering the former useful
022_Evaluación del estado nutricional en el entorno asistencial.indd 201 12/02/15 14:18
202 ESTIMATE OF ENERGY AND NUTRIENT INTAKE, BIOMARKERS AND VALUES OF REFERENCE
as a predictor of mortality. Indeed, GNRI is a good predictor of the risk of undernutrition, but does not provide a diagnosis of this45,46.
Nutritional status assessment method
Although the SGA and MNA methods are useful in determining the nutritional status, there is no uni-versally accepted gold standard for use in arriving at an ND. In our hospital, and in many others, the SGA is used alongside anthropometric measurements and the results of biochemical analyses. This we term the
Table III Subjective Global Assessment with laboratory parameters
A B CChanges in body weight <5% 5-10% >10%Feeding* Normal Mild to moderate impairment Severe impairmentEating problems No Mild to moderate SevereActivity* Normal Mild to moderate impairment Severe impairmentAge <65 >65 >65Ulcers No No YesFever/corticosteroids No Mild to moderate HighCancer treatment Low risk Moderate risk High riskLoss of subcutaneous fat No Mild to moderate SevereLoss of muscle mass No Mild to moderate SevereEdema/ascites No Mild to moderate SevereAlbumin (g/dl) (Pretreatment)* >3,5 3,5-3 <3Prealbumin (mg/dl) (After treatment) >18 15-18 <15The final result is expressed by the letters A, B or C according to the predominant answer in each item. The answers that have the greatest impact are marked with*.
Table IV Nutritional Status Assessment (NSA)
Anthropometry • Current weight, normal weight, ideal weight and adjusted weight• Weight loss in the last 6 months (% weight loss)• Height • BMI• Triceps skin fold and upper arm muscle circumference
Physical examination • Loss of subcutaneous fat• Loss of muscle mass• Presence of edema or ascites
Oral intake • Changes in oral intake: increase, decrease or no change• Duration in time of changes in the oral intake• Type of Intake: fasting, low calorie liquid diet, full liquid diet, insufficient solid diet
Gastrointestinal symptoms • Absence of symptoms • Nausea, vomiting, diarrhea, anorexia, dysphagia, other symptoms...
Stress • No stress • Stress: mild - moderate - severe
Biochemestry • Lymphocytes, albumin, other…
Dynamometry • Normal values vary with age and sex (Male > 30kg, Women> 20kg)
Nutritional Status Assessment (NSA) method. It is generally carried out by personnel trained in nutrition (Table IV).
Diagnosis and codification of undernutrition
The International Classification of Diseases system allows health professionals to identify diagnoses and medical procedures via a code. International classifi-cation of disease code 9 (ICD-9) is the system used in Spain. As recorded in the SENPE-SEDOM consensus document, when a diagnosis of undernutrition is reached
022_Evaluación del estado nutricional en el entorno asistencial.indd 202 12/02/15 14:18
Assessment of Nutritional Status in the Healthcare Setting in Spain 203
in the hospital setting it is essential that the medical pro-fessional responsible for discharging the patient include an ND at that time, accompanied by its ICD-9 code.
The ICD-9 classification codes for undernutrition in the hospital setting are47:
– Energy undernutrition:• Mild (ICD-9: 263,1).• Moderate (ICD-9: 263,0).• Serious/severe (ICD-9: 261).• Not specified (ICD-9: 263,9).
– Protein undernutrition: any grade (ICD-9: 260). – Mixed or energy-protein undernutrition:• Mild (ICD-9: 263,8).• Moderate (ICD-9: 263,8).• Serious/severe (ICD-9: 262).• Not specified (ICD-9: 263,9).
– Non-specified undernutrition:• Mild (ICD-9: 263,1).• Moderate (ICD-9: 263,0).• Serious/severe (ICD-9: 261).• Not specified (ICD-9: 263,9).
– Excess weight:• Overweight (ICD-9: 278.02).• Non-specified obesity (ICD-9: 278.00).• Morbid obesity (ICD-9: 278.01).
In addition, in patients who have received nutritional support, the therapy followed should receive an ICD-9 code:
– Parenteral nutrition (ICD-9: 99.15). – Enteral nutrition at >1000 kcal/day (ICD-9: 96,6).
A more recent version of the coding system is known as ICD-10. However, its Spanish adaptation, known as ICD-10-ES, does not come into force until 2016. Until this time, ICD-9 is the accepted coding system48.
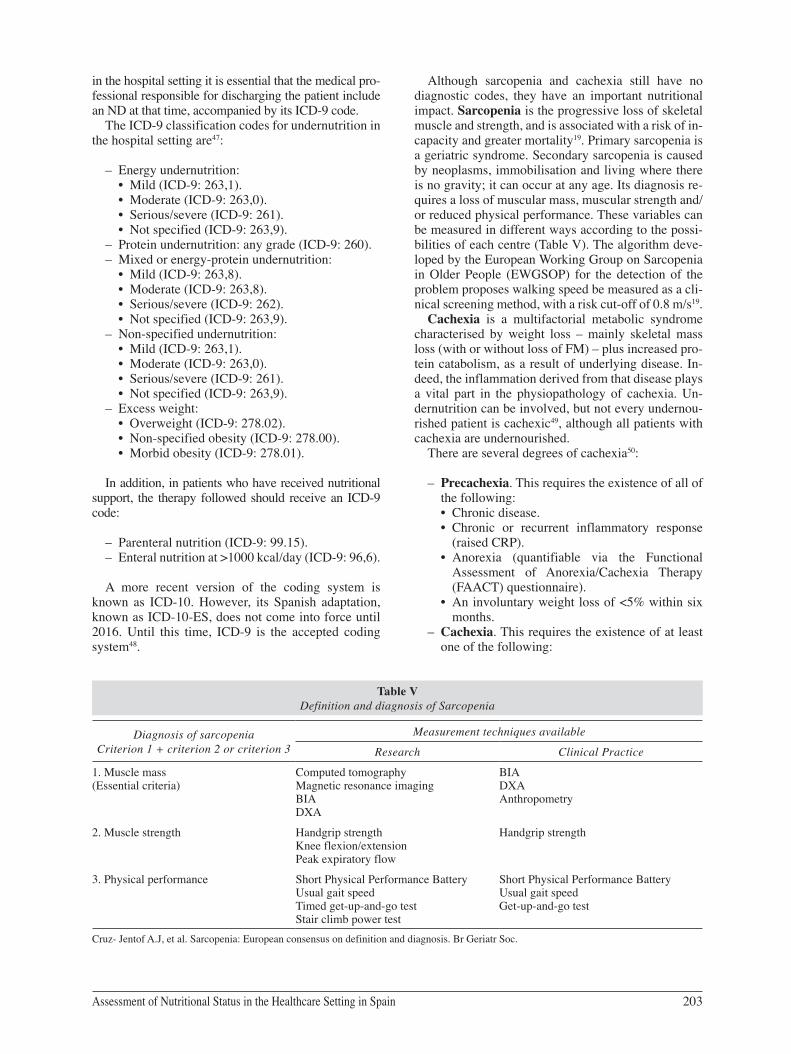
Although sarcopenia and cachexia still have no diagnostic codes, they have an important nutritional impact. Sarcopenia is the progressive loss of skeletal muscle and strength, and is associated with a risk of in-capacity and greater mortality19. Primary sarcopenia is a geriatric syndrome. Secondary sarcopenia is caused by neoplasms, immobilisation and living where there is no gravity; it can occur at any age. Its diagnosis re-quires a loss of muscular mass, muscular strength and/or reduced physical performance. These variables can be measured in different ways according to the possi-bilities of each centre (Table V). The algorithm deve-loped by the European Working Group on Sarcopenia in Older People (EWGSOP) for the detection of the problem proposes walking speed be measured as a cli-nical screening method, with a risk cut-off of 0.8 m/s19.
Cachexia is a multifactorial metabolic syndrome characterised by weight loss – mainly skeletal mass loss (with or without loss of FM) – plus increased pro-tein catabolism, as a result of underlying disease. In-deed, the inflammation derived from that disease plays a vital part in the physiopathology of cachexia. Un-dernutrition can be involved, but not every undernou-rished patient is cachexic49, although all patients with cachexia are undernourished.
There are several degrees of cachexia50:
– Precachexia. This requires the existence of all of the following:• Chronic disease.• Chronic or recurrent inflammatory response
(raised CRP).• Anorexia (quantifiable via the Functional
Assessment of Anorexia/Cachexia Therapy (FAACT) questionnaire).
• An involuntary weight loss of <5% within six months.
– Cachexia. This requires the existence of at least one of the following:
Table V Definition and diagnosis of Sarcopenia
Diagnosis of sarcopeniaCriterion 1 + criterion 2 or criterion 3
Measurement techniques available
Research Clinical Practice
1. Muscle mass (Essential criteria)
Computed tomographyMagnetic resonance imagingBIADXA
BIADXAAnthropometry
2. Muscle strength Handgrip strengthKnee flexion/extensionPeak expiratory flow
Handgrip strength
3. Physical performance Short Physical Performance BatteryUsual gait speedTimed get-up-and-go testStair climb power test
Short Physical Performance BatteryUsual gait speedGet-up-and-go test
Cruz- Jentof A.J, et al. Sarcopenia: European consensus on definition and diagnosis. Br Geriatr Soc.
022_Evaluación del estado nutricional en el entorno asistencial.indd 203 12/02/15 14:18
204 ESTIMATE OF ENERGY AND NUTRIENT INTAKE, BIOMARKERS AND VALUES OF REFERENCE
Nutrition Assessment strategies
Nutritional Support
Community
Patient at nutritional risk
If negative: repeat in 3-6 months
All patients within the first 24h after admission
Nutritional Status Assessment (NSA)
If negative: repeat weekly
Hospitalized
Intensive Care Units
Follow up
Large and computing resources Hospital Other centers
Intensive Care Units
MUST
NUTRIC-score
Automatic screening system NRS-2002 or MSTMNA
High risk of malnutrition or need for artificial nutritional support
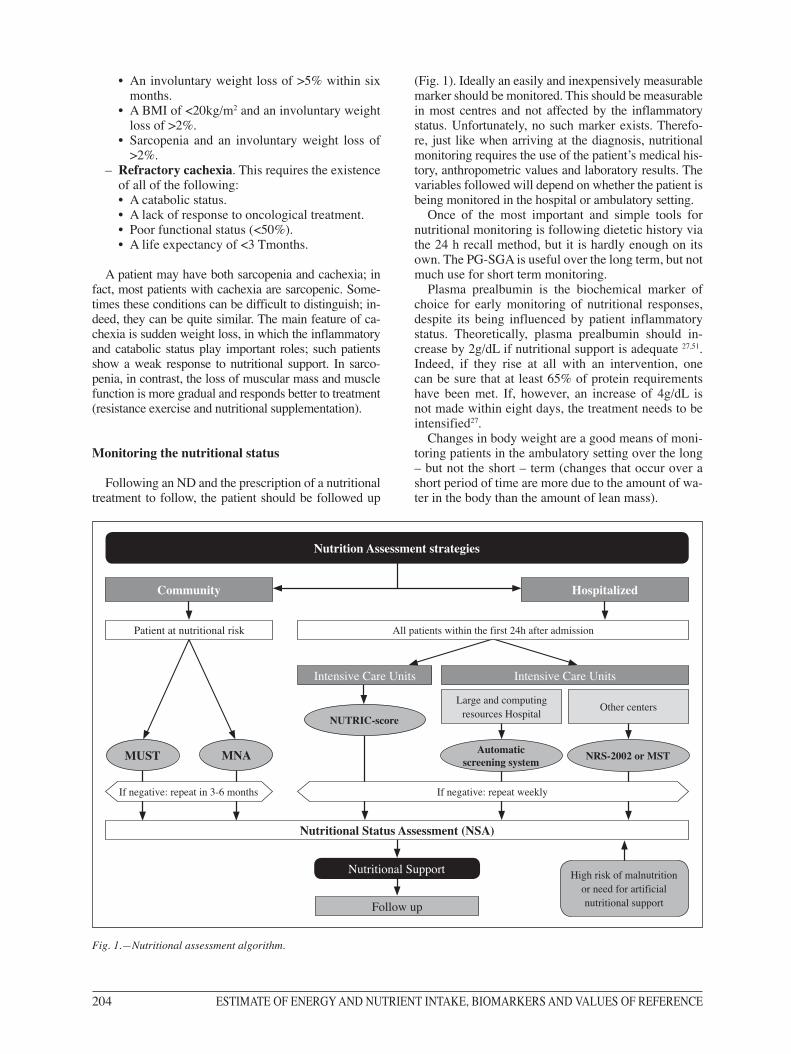
Fig. 1.—Nutritional assessment algorithm.
• An involuntary weight loss of >5% within six months.
• A BMI of <20kg/m2 and an involuntary weight loss of >2%.
• Sarcopenia and an involuntary weight loss of >2%.
– Refractory cachexia. This requires the existence of all of the following:• A catabolic status.• A lack of response to oncological treatment.• Poor functional status (<50%).• A life expectancy of <3 Tmonths.
A patient may have both sarcopenia and cachexia; in fact, most patients with cachexia are sarcopenic. Some-times these conditions can be difficult to distinguish; in-deed, they can be quite similar. The main feature of ca-chexia is sudden weight loss, in which the inflammatory and catabolic status play important roles; such patients show a weak response to nutritional support. In sarco-penia, in contrast, the loss of muscular mass and muscle function is more gradual and responds better to treatment (resistance exercise and nutritional supplementation).
Monitoring the nutritional status
Following an ND and the prescription of a nutritional treatment to follow, the patient should be followed up
(Fig. 1). Ideally an easily and inexpensively measurable marker should be monitored. This should be measurable in most centres and not affected by the inflammatory status. Unfortunately, no such marker exists. Therefo-re, just like when arriving at the diagnosis, nutritional monitoring requires the use of the patient’s medical his-tory, anthropometric values and laboratory results. The variables followed will depend on whether the patient is being monitored in the hospital or ambulatory setting.
Once of the most important and simple tools for nutritional monitoring is following dietetic history via the 24 h recall method, but it is hardly enough on its own. The PG-SGA is useful over the long term, but not much use for short term monitoring.
Plasma prealbumin is the biochemical marker of choice for early monitoring of nutritional responses, despite its being influenced by patient inflammatory status. Theoretically, plasma prealbumin should in-crease by 2g/dL if nutritional support is adequate 27,51. Indeed, if they rise at all with an intervention, one can be sure that at least 65% of protein requirements have been met. If, however, an increase of 4g/dL is not made within eight days, the treatment needs to be intensified27.
Changes in body weight are a good means of moni-toring patients in the ambulatory setting over the long – but not the short – term (changes that occur over a short period of time are more due to the amount of wa-ter in the body than the amount of lean mass).
022_Evaluación del estado nutricional en el entorno asistencial.indd 204 12/02/15 14:18

Assessment of Nutritional Status in the Healthcare Setting in Spain 205
The MCA and TST are two classic anthropometric variables used in the measurement of nutritional status. However, their use is not without limitations, especia-lly in hospitalised patients since the references against which the results are compared were developed with ambulatory subjects16. However, they are useful for monitoring changes if sufficient time is left between one measurement and another.
Recently, dynamometry has been used in the moni-toring of nutritional status, but no consensus has yet been reached regarding its value31,33.
The duration of monitoring of the response to a nu-tritional intervention will depend on each patient, but it
would appear reasonable that weekly records be taken in the hospital setting and monthly or three-monthly records in the ambulatory setting, depending on the severity of the patient’s condition and the type of nu-tritional support prescribed (Table VI).
Conclusion
The early identification of undernourished patients, or at risk of becoming undernourished, allows for diagnoses to be made that should be recorded in the medical history according to the ICD-9 system. There
Table VI Monitoring of nutrition support at hospital and community
Hos
pita
lized
pat
ient
ScreeningCONUT
NRS-2002 NST NUTRIC-score
Perform to all patients within the first 24 h after admissionIf screening is positive: perform nutritional assessment (NSA)
If screening is negative: repeat at least weekly
NSA Initial Follow-up after nutritional support
Indication If positive screening, high risk of malnutrition or
artificial nutritional support
4-8 days >15-20 days
Symptoms (diarrhea, nausea, vomiting)
✔ ✔ ✔
Diet history (intake rate) ✔ ✔ ✔
Weight loss ✔ ✗ ✔
Triceps skin fold + Upper arm muscle circumference
✔ ✗ ✔
Dynamometry ✔ ¿? ✔
Albumin ✔ ✗ ✔
Prealbumin ✗ ✔ ✔
C-reactive protein ✔ ✗ ✗/✔
Com
mun
ity p
atie
nt
Screening MUSTMNA-screening
Perform to those patients with malnutrition risk factorsIf screening is positive: perform nutritional assessment (NSA)
If screening is negative: repeat at least every 3-6 months
NSA Initial Follow-up after nutritional support
Indication If positive screening, high risk of malnutrition or
artificial nutritional support
<1 month >3 months
Symptoms (diarrhea, nausea, vomiting)
✔ ✔ ✔
Diet history (intake rate) ✔ ✔ ✔
Weight loss ✔ ✔ ✔
Triceps skin fold + Upper arm muscle circumference
✔ ✔ ✔
Dynamometry ✔ ✔ ✔
Albumin ✔ ✗ ✔
Prealbumin ✗ ✔ ✔
C-reactive protein ✗/✔ ✗/✔ ✗/✔
022_Evaluación del estado nutricional en el entorno asistencial.indd 205 12/02/15 14:18
206 ESTIMATE OF ENERGY AND NUTRIENT INTAKE, BIOMARKERS AND VALUES OF REFERENCE
is no gold standard for assessing patients, but the NSA method may be recommendable since it integrates the SGA method, anthropometric measurements, and biochemical analyses. When a nutritional intervention is prescribed, the patient should be followed up, with monitoring performed according to the clinical setting, the means available, and the medical condition of the patient.
References
1. Roldán Aviña JP, Pérez Camacho I, Irles Rocamora JA, Martín Gómez R. Malnutrition in hospitalized patients: a prospective and randomized study. Nutr Hosp 1995;10(4):192-8.
2. Norman K, Pichard C, Lochs H, Pirlich M. Prognostic impact of disease-related malnutrition. Clin Nutr 2008 Feb;27(1):5-15.
3. Mueller C, Compher C, Ellen DM. A.S.P.E.N. clinical gui-delines: Nutrition screening, assessment, and intervention in adults. JPEN J Parenter Enteral Nutr 2011 Jan 1;35(1):16-24.
4. Kondrup J, Allison SP, Elia M, Vellas B, Plauth M. ESPEN guidelines for nutrition screening 2002. Clin Nutr 2003 Aug;22(4):415-21.
5. Rasmussen HH, Holst M, Kondrup J. Measuring nutritional risk in hospitals. Clin Epidemiol 2010 Jan;2:209-16.
6. García de Lorenzo A, Álvarez Hernández J, Planas M, Burgos R, Araujo K. Multidisciplinary consensus on the approach to hospital malnutrition in Spain. Nutr Hosp 2011;26(4):701-10.
7. Elia M, Stratton R. On the ESPEN guidelines for nutritional screening 2002. Clin Nutr 2004 Feb;23(1):131-2.
8. Ignacio de Ulíbarri J, González-Madroño A, de Villar NGP, González P, González B, Mancha A, et al. CONUT: a tool for controlling nutritional status. First validation in a hospital po-pulation. Nutr Hosp 2005;20(1):38-45.
9. Villalobos Gámez JL, García-Almeida JM, Guzmán de Damas JM, Rioja Vázquez R, Osorio Fernández D, Rodríguez-García LM, et al. Proceso INFORNUT®: validación de la fase de filtro -FILNUT- y comparación con otros métodos de detección pre-coz de desnutrición hospitalaria. Nutr Hosp 2012;21(4):491-504.
10. Gómez-Candela C, Serrano Labajos R, García-Vazquez N, Valero Pérez M, Morato Martínez M, Santurino Fontecha C, et al. Complete process of implantation of a nutritional risk screening system in the University Hospital La Paz, Madrid. Nutr Hosp 2013;28(6):2165-74.
11. Heyland DK, Dhaliwal R, Jiang X, Day AG. Identifying criti-cally ill patients who benefit the most from nutrition therapy: the development and initial validation of a novel risk assess-ment tool. Crit Care 2011 Jan;15(6):R268.
12. Aquino R de C de, Philippi ST. Identification of malnutri-tion risk factors in hospitalized patients. Rev Assoc Med Bras 2011;57(6):637-43.
13. Windsor JA, Hill GL. Weight loss with physiologic impairment. A basic indicator of surgical risk. Ann Surg 1988;207(3):290-6.
14. Dewys WD, Begg C, Lavin PT, Band PR, Bennett JM, Bertino JR, et al. Prognostic effect of weight loss prior to chemothera-py in cancer patients. Eastern Cooperative Oncology Group. Am J Med 1980 Oct;69(4):491-7.
15. White J V, Guenter P, Jensen G, Malone A, Schofield M. Con-sensus statement: Academy of Nutrition and Dietetics and American Society for Parenteral and Enteral Nutrition: charac-teristics recommended for the identification and documenta-tion of adult malnutrition (undernutrition). JPEN J Parenter Enteral Nutr 2012 May;36(3):275-83.
16. García de Lorenzo A, Álvarez Hernández J, Planas M, Burgos R, Araujo K. Consenso multidisciplinar sobre el abordaje de la desnutrición hospitalaria en España. Documentos de consenso de la SENPE. p. 9-41.
17. MAG of the British Association for Parenteral and Enteral Nutrition. The “MUST” Explanatory Booklet. A Guide to
the “Malnutrition Universal Screening Tool” (“MUST”) for Adults. 2003.
18. Kvamme J-M, Holmen J, Wilsgaard T, Florholmen J, Midthje-ll K, Jacobsen BK. Body mass index and mortality in elderly men and women: the Tromso and HUNT studies. J Epidemiol Community Health 2012 Jul;66(7):611-7.
19. CRUZ-JENTOF AJ, BAEYENS J-P, BAUER JM, BOIRIE Y, CEDERHOLM T, LANDI F. Sarcopenia: European consensus on definition and diagnosis. Br Geriatr Soc 2010;39:412-23.
20. Kyle UG, Bosaeus I, De Lorenzo AD, Deurenberg P, Elia M, Manuel Gómez J, et al. Bioelectrical impedance analy-sis-part II: utilization in clinical practice. Clin Nutr 2004 Dec;23(6):1430-53.
21. Benjamin DR. Laboratory tests and nutritional assessment. Protein-energy status. Pediatr Clin North Am 1989 Feb;36(1): 139-61.
22. Burritt MF, Anderson CF. Laboratory assessment of nutritional status. Hum Pathol 1984 Feb;15(2):130-3.
23. Jellinge ME, Henriksen DP, Hallas P, Brabrand M. Hypoalbu-minemia is a strong predictor of 30-day all-cause mortality in acutely admitted medical patients: a prospective, observatio-nal, cohort study. PLoS One 2014 Jan ;9(8):e105983.
24. Villamayor Blanco L, Llimera Rausell G, Jorge Vidal V, González Pérez-Crespo C, Iniesta Navalón C, Mira Sirvent M. C, et al. Valoración nutricional al ingreso hospitalario: iniciación al estudio entre distintas metodologías. Nutr Hosp 2006;21(2):163-72.
25. Fletcher JP, Little JM, Guest PK. A comparison of serum trans-ferrin and serum prealbumin as nutritional parameters. JPEN J Parenter Enteral Nutr 1987;11(2):144-7.
26. Tuten MB, Wogt S, Dasse F, Leider Z. Utilization of prealbu-min as a nutritional parameter. JPEN J Parenter Enteral Nutr 1985;9(6):709-11.
27. Beck FK, Rosenthal TC. Prealbumin: a marker for nutritional evaluation. Am Fam Physician 2002 Apr 15;65(8):1575-8.
28. Kuzuya M, Kanda S, Koike T, Suzuki Y, Iguchi A. Lack of co-rrelation between total lymphocyte count and nutritional status in the elderly. Clin Nutr 2005 Jun;24(3):427-32.
29. Bellace J V, Healy D, Besser MP, Byron T, Hohman L. Va-lidity of the Dexter Evaluation System’s Jamar dynamometer attachment for assessment of hand grip strength in a normal population. J Hand Ther 2000;13(1):46-51.
30. Norman K, Stobäus N, Gonzalez MC, Schulzke J-D, Pirlich M. Hand grip strength: outcome predictor and marker of nutritio-nal status. Clin Nutr 2011 Apr;30(2):135-42.
31. Flood A, Chung A, Parker H, Kearns V, O’Sullivan T a. The use of hand grip strength as a predictor of nutrition status in hospital patients. Clin Nutr 2014 Mar;33(1):106-14.
32. Milne AC, Avenell A, Potter J. Meta-analysis: protein and energy supplementation in older people. Ann Intern Med 2006 Jan 3;144(1):37-48.
33. Matos LC, Tavares MM, Amaral TF. Handgrip strength as a hospital admission nutritional risk screening method. Eur J Clin Nutr 2007 Sep;61(9):1128-35.
34. Detsky AS, McLaughlin JR, Baker JP, Johnston N, Whittaker S, Mendelson RA, et al. What is subjective global assessment of nutritional status? JPEN J Parenter Enteral Nutr 1987; 11(1):8-13.
35. Barbosa-Silva MCG, Barros AJD. Indications and limita-tions of the use of subjective global assessment in clinical practice: an update. Curr Opin Clin Nutr Metab Care 2006 May;9(3):263-9.
36. Ferguson M. Patient-generated subjective global assessment. Oncology (Williston Park). 2003 Feb;17(2 Suppl 2):13-4; dis-cussion 14-6.
37. Bauer J, Capra S, Ferguson M. Use of the scored Patient-Ge-nerated Subjective Global Assessment (PG-SGA) as a nutrition assessment tool in patients with cancer. Eur J Clin Nutr 2002 Aug;56(8):779-85.
38. Kalantar-Zadeh K, Kleiner M, Dunne E, Lee GH, Luft FC. A modified quantitative subjective global assessment of nu-trition for dialysis patients. Nephrol Dial Transplant 1999 Jul;14(7):1732-8.
022_Evaluación del estado nutricional en el entorno asistencial.indd 206 12/02/15 14:18

Assessment of Nutritional Status in the Healthcare Setting in Spain 207
39. Bleda MJ, Bolibar I, Parés R, Salvà A. Reliability of the mini nutritional assessment (MNA) in institutionalized elderly peo-ple. J Nutr Health Aging 2002 Jan;6(2):134-7.
40. Calvo I, Olivar J, Martínez E. Uso del mini nutritional assess-ment como herramienta de cribaje nutricional en la población mayor de 65 años en el ámbito hospitalario; conveniencia y factibilidad. Nutr Hosp 2012 Sep 1;27(n05).
41. Vellas B, Guigoz Y, Garry PJ, Nourhashemi F, Bennahum D, Lauque S, et al. The Mini Nutritional Assessment (MNA) and its use in grading the nutritional state of elderly patients. Nutri-tion 1999 Feb;15(2):116-22.
42. Guigoz Y, Lauque S, Vellas BJ. Identifying the elderly at risk for malnutrition. The Mini Nutritional Assessment. Clin Geria-tr Med 2002 Nov;18(4):737-57.
43. Guigoz Y. The Mini Nutritional Assessment (MNA) review of the literature--What does it tell us? J Nutr Health Aging 2006;10(6):466-85; discussion 485-7.
44. Matía Martín P, Triana F-MC. Nutrición en el anciano hospita-lizado. Rev Esp Geriatr Gerontol 2006;41(06):340-56.
45. Durán Alert P, Milà Villarroel R, Formiga F, Virgili Casas N, Vilarasau Farré C. Assessing risk screening methods of mal-nutrition in geriatric patients: Mini Nutritional Assessment
(MNA) versus Geriatric Nutritional Risk Index (GNRI). Nutr Hosp 2012;27(2):590-8.
46. Cereda E, Limonta D, Pusani C, Vanotti A. Assessing el-derly at risk of malnutrition: the new Geriatric Nutritional Risk Index versus Nutritional Risk Index. Nutrition. 2006 Jun;22(6):680-2.
47. Álvarez J, Río J Del, Planas M, Peris PG, Lorenzo AG de, Cal-vo V, et al. Documento SENPE-SEDOM sobre la codificación de la desnutrición hospitalaria. Nutr Hosp. 2008;23(6):536-40.
48. Ministerio de Sanidad Servicios Sociales e Igualdad. PRO-YECTO DE TRANSICION DE CIE-9-MC A CIE-10-ES. Portal Estadístico del SNS. 2014.
49. Muscaritoli M, Anker SD, Argilés J, Aversa Z, Bauer JM, Bio-lo G, et al. Consensus definition of sarcopenia, cachexia and pre-cachexia: joint document elaborated by Special Interest Groups (SIG) “cachexia-anorexia in chronic wasting diseases” and “nutrition in geriatrics”. Clin Nutr 2010 Apr;29(2):154-9.
50. MacDonald N. Terminology in cancer cachexia: impor-tance and status. Curr Opin Clin Nutr Metab Care 2012 May;15(3):220-5.
51. Spiekerman AM. Nutritional assessment (protein nutriture). Anal Chem 1995 Jun 15;67(12):429R - 436R.
022_Evaluación del estado nutricional en el entorno asistencial.indd 207 12/02/15 14:18