assessment of immunoassays for the … · 1 assessment of immunoassays for the detection of amnesic...
TRANSCRIPT
Not to be quoted without prior reference to the authors
Fisheries Research Services Internal Report No 16/03 ASSESSMENT OF IMMUNOASSAYS FOR THE DETECTION OF AMNESIC SHELLFISH POISONING (ASP) TOXINS Elizabeth A Smith, Marie Grieve, Fiona H Mackintosh, Alasdair C Scott, Nigel Brown and Susan Gallacher August 2003
Fisheries Research Services Marine Laboratory 375 Victoria Road Aberdeen AB11 9DB
CONTENTS 1. SUMMARY............................................................................................................. 1 2. GLOSSARY ........................................................................................................... 2 3. BACKGROUND ..................................................................................................... 3 3.1 Amnesic shellfish poisoning (ASP) toxins .............................................................. 3 3.2 EU regulations and monitoring in Scotland ............................................................ 4 3.3. Detection methods for ASP toxins ......................................................................... 4 3.4. Immunological assays for detection of ASP toxins ................................................ 4 4. OBJECTIVES......................................................................................................... 5 5. EXPERIMENTAL PROCEDURES ......................................................................... 6 5.1. Assessment of the indirect cELISA for the detection of ASP toxins....................... 6 5.1.1 Shellfish extracts and HPLC analysis......................................................... 6 5.1.2 Calibration and optimisation of the cELISA ................................................ 7 5.1.3 cELISA procedure ...................................................................................... 7 5.1.4 Inter-plate and between-day reproducibility of the cELISA......................... 7 5.1.5 Quantitative comparison between HPLC and the cELISA.......................... 8 5.1.6 Semi-quantitative screening for ASP toxins by cELISA during routine monitoring....................................................................................... 8 5.2. Assessment of the agglutination assay for the detection of ASP toxins................. 9 5.2.1 Shellfish extracts ........................................................................................ 9 5.2.2 Agglutination assay procedure ................................................................... 9 6. RESULTS............................................................................................................... 10 6.1 Assessment of the indirect cELISA for detection of ASP toxins............................. 10 6.1.1 Calibration and optimisation of the cELISA ................................................ 10 6.1.2 Inter-plate and between-day reproducibility................................................ 11 6.1.3 Comparison between HPLC and cELISA for the quantitative detection of ASP toxins .............................................................................. 14 6.1.4 Comparison between HPLC and cELISA for the semi-quantitative detection of ASP toxins .............................................................................. 15 6.2 Assessment of the ASP toxin agglutination assay ................................................. 17 6.2.1 Analysis of shellfish extracts....................................................................... 17 7. DISCUSSION AND CONCLUSIONS..................................................................... 20 7.1 Assessment of cELISA for the detection of ASP toxins in monitoring.................... 20 7.2 Assessment of the agglutination assay for the detection of ASP toxins................. 21 7.3 Conclusions............................................................................................................ 21 8. ADDITIONAL INFORMATION ............................................................................... 22 8.1 Development of a direct cELISA for the detection of ASP toxins........................... 22 8.2 Developments with the agglutination assay ........................................................... 22 9. ACKNOWLEDGEMENTS ...................................................................................... 22 10. LITERATURE CITED ............................................................................................. 23 11. Appendix 1 12. Appendix 2
1
ASSESSMENT OF IMMUNOASSAYS FOR THE DETECTION OF AMNESIC SHELLFISH POISONING (ASP) TOXINS
Elizabeth A Smith, Marie Grieve, Fiona H Mackintosh, Alasdair C Scott, Nigel Brown and Susan Gallacher
Fisheries Research Service Marine laboratory, PO Box 101,
375 Victoria Road, Aberdeen AB11 9DB, UK
1. SUMMARY Monitoring shellfish for domoic acid (DA) and epi-DA was implemented in Scotland in 1998 following the inclusion of amnesic shellfish poisoning (ASP) toxins in an amendment to the EU Directive (91/492/EEC). Currently, routine testing of shellfish for ASP toxins employs HPLC with UV diode array detection (DAD). This methodology is costly, requires skilled operators and is time consuming. In this study, an indirect competitive enzyme-linked immunosorbent assay (cELISA) for the detection of ASP toxins was optimised for use with aqueous methanol shellfish extracts. The quantification limit for domoic acid (DA), the principal compound associated with ASP, was estimated to be 0.07 ng DA ml-1. Shellfish samples obtained from the Scottish shellfish toxin monitoring programme were simultaneously analysed by the established regulatory HPLC technique and the cELISA and results from the two techniques compared. Results suggest that the cELISA may be employed to screen out negative samples and those containing low levels of DA during high throughput monitoring prior to quantification of toxin concentrations by more expensive analytical techniques. A further immunoassay, in the form of a rapid agglutination assay, was investigated. This assay detected ASP toxin in shellfish monitoring samples containing over the regulatory limit (20 µg g-1 shellfish flesh) as determined by HPLC and no ‘false positive’ samples were recorded in samples that did not contain DA. This preliminary study suggests that this assay could be used as a screen in the toxin monitoring programme. Due to its ease of use, it is also considered that it could be used by shellfish harvesters and farmers as a shellfish fisheries management tool to avoid harvest of contaminated product and aid stock conservation and this merits further investigation.
Assessment of Immunoassays
2
2. GLOSSARY ASP Amnesic shellfish poisoning
DA Domoic acid
epi-DA epi-Domoic acid
ELISA Enzyme-linked immunosorbent assay
PBS Phosphate buffered saline
LOQ Limit of quantification
LOD Limit of detection
HPLC High performance liquid chromatography
SAX Strong anion exchange
LC-MS Liquid chromatography-mass spectrometry Antibody A protein produced in response to an antigen (an antibody-
generating foreign macromolecule) Hapten A substance which contains at least one epitope (a site on the
antigen that determines its interaction with a particular antibody), but is too small to induce antibody formation unless it is linked to a macromolecule
Polyclonal antibodies They are produced by repeated injection of antigen into a
laboratory animal. They contain many different IgG antibodies Monoclonal antibodies These are specific to a single epitope and are produced from
individual clones of cells, grown using cell culture techniques. Such cultures provide a stable source of antibodies of known uniform specificity
Conjugate Antigen is conjugated to a protein carrier (e.g. Bovine serum albumin) to make an immunogenic form
Assessment of Immunoassays
3
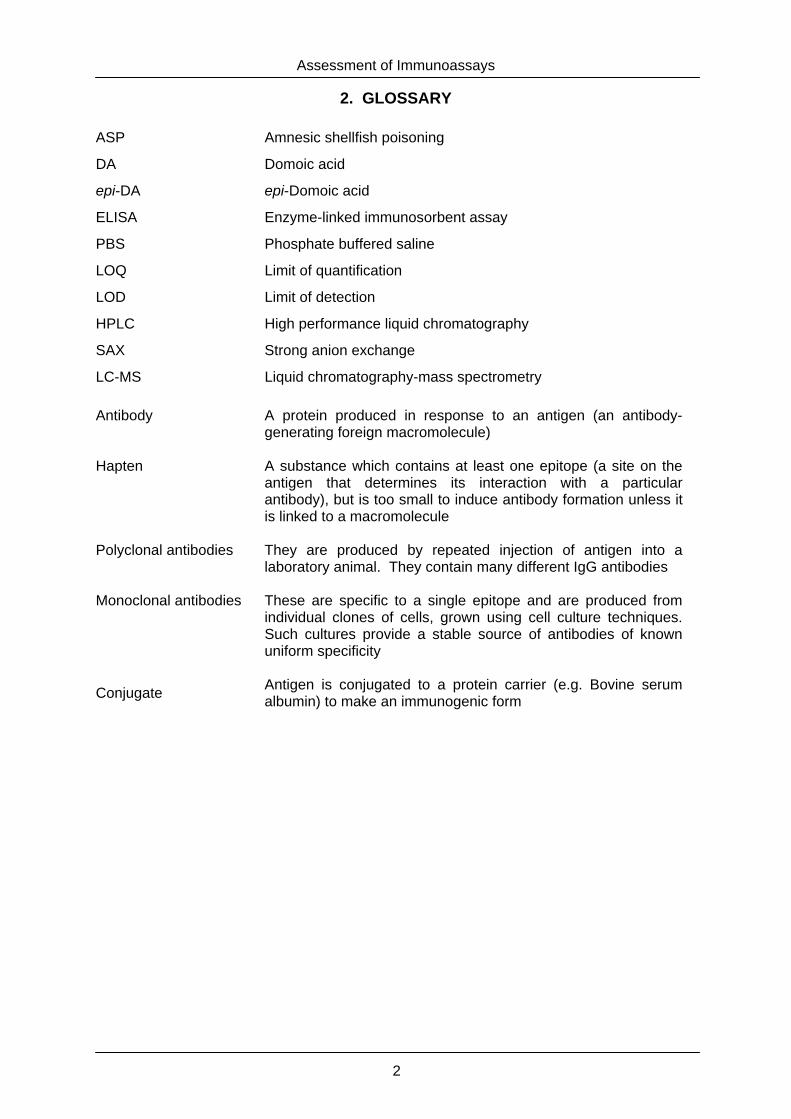
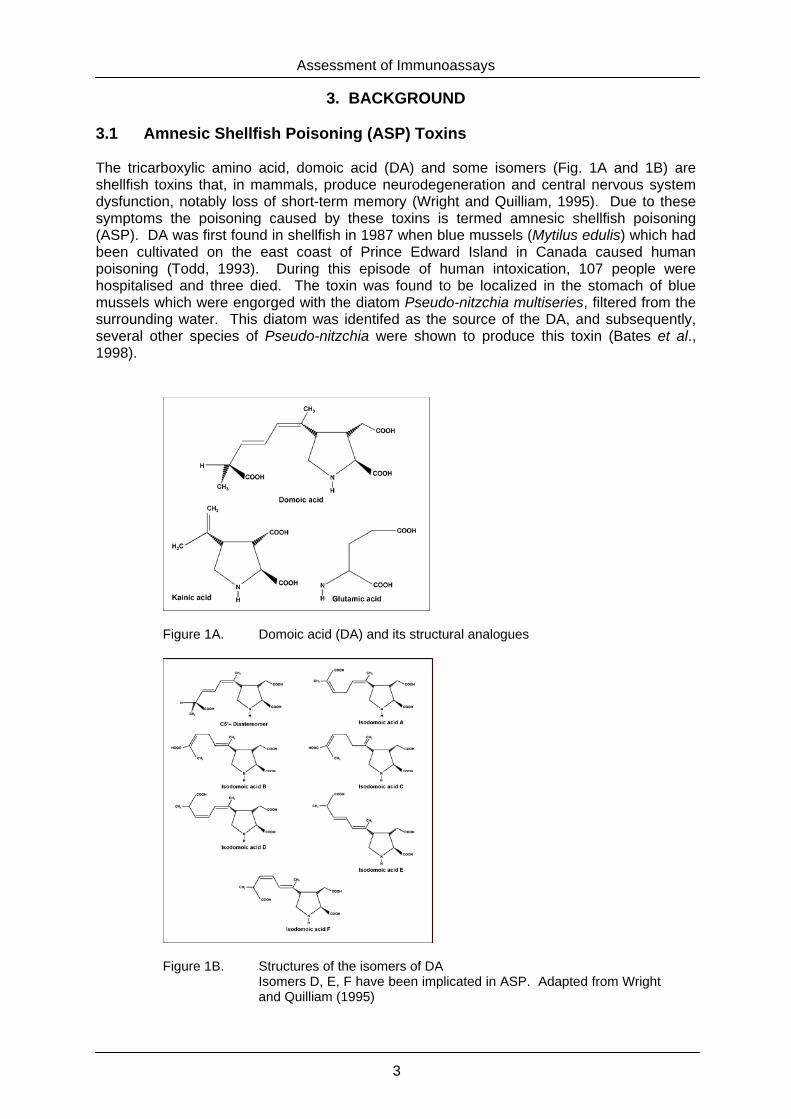
3. BACKGROUND 3.1 Amnesic Shellfish Poisoning (ASP) Toxins The tricarboxylic amino acid, domoic acid (DA) and some isomers (Fig. 1A and 1B) are shellfish toxins that, in mammals, produce neurodegeneration and central nervous system dysfunction, notably loss of short-term memory (Wright and Quilliam, 1995). Due to these symptoms the poisoning caused by these toxins is termed amnesic shellfish poisoning (ASP). DA was first found in shellfish in 1987 when blue mussels (Mytilus edulis) which had been cultivated on the east coast of Prince Edward Island in Canada caused human poisoning (Todd, 1993). During this episode of human intoxication, 107 people were hospitalised and three died. The toxin was found to be localized in the stomach of blue mussels which were engorged with the diatom Pseudo-nitzchia multiseries, filtered from the surrounding water. This diatom was identifed as the source of the DA, and subsequently, several other species of Pseudo-nitzchia were shown to produce this toxin (Bates et al., 1998).
Epi-DA
Figure 1A. Domoic acid (DA) and its structural analogues
Figure 1B. Structures of the isomers of DA
Isomers D, E, F have been implicated in ASP. Adapted from Wright and Quilliam (1995)
Assessment of Immunoassays
4
3.2 EU Regulations and Monitoring in Scotland Following the Canadian shellfish poisoning event and suspected presence of DA in shellfish on the Spanish coast (Arévalo et al., 1998), regulations (Council Directive 97/61/EC) on the maximum concentration of DA permissible in shellfish marketed in Europe were introduced. The regulatory limit was set at 20 µg DA g-1 shellfish flesh with the evaluation of the DA concentration in shellfish to be determined using HPLC methodology. DA in Scottish shellfish was first detected in 1998 following the implementation of an inshore and offshore shellfish sampling programme. The toxin was identified in a range of shellfish using high performance liquid chromatography (HPLC) with UV detection and has been responsible for harvesting bans on king scallop (Pecten maximus) fishing grounds over most (14,400 square miles) of the Scottish west coast (Gallacher et al., 2001). The high incidence of DA in king scallops has prompted considerable debate regarding the development of an alternative testing regime based on a tiered system. It was suggested that the toxic parts of the king scallop (i.e. the digestive gland) could be removed to allow ‘safe’ parts to be marketed (i.e. the adductor muscle and gonad). Subsequently, Commision Decision 2002/226/EC was reached, which establishes marketing conditions for king scallop gonad and adductor muscle where DA levels must be less than or equal to 4.6 µg g-1. 3.3. Detection Methods for ASP Toxins Several methods have been proposed for the determination of ASP toxins in shellfish. Although the mouse bioassay can detect DA at high levels, its insensitivity is insufficient for the detection of DA at the imposed regulatory level of 20 µg g-1 shellfish flesh (Quilliam and Wright, 1989; Iverson et al., 1994). The first non-animal methods to be developed were chromatographic procedures. The most commonly used technique is HPLC with UV absorbance detection, first developed in 1989 (Quilliam et al., 1989). More recently, advances in LC with mass spectrometric (LC-MS) detection has allowed this technology to be applied to the detection of ASP toxins (Hess et al., 2001; Garthwaite, 2000). ASP toxins exert their biological activity at the cellular level, through the binding of receptors. In particular, they disrupt binding of glutamate to AMDA glutamine receptors of the brain. This mode of action was used to establish a radio-ligand displacement assay, employing receptors for ASP toxins isolated from frog brain synaptosomes (Van Dolah et al., 1997). However, this methodology has not been routinely adopted; a major drawback of this assay is the limited availability of radiolabelled DA standard and the high regulatory (and personal) barriers to the use of radio-isotopes. More recently, immunoassays have been developed which show promise for the routine detection and quantification of ASP toxins (Garthwaite et al., 1998; Garthwaite et al., 2001). 3.4. Immunological Assays for Detection of ASP Toxins Immunoassays are developed using antibodies that recognise specific toxin structures. The choice of antibody is crucial for determining the usefulness of the assay; too specific and the assay will fail to recognise all members of a toxin family and underestimate the total toxin content (false negatives), not specific enough and it may detect non-toxic analogues and lead to the reporting of false positives. Several groups have developed immunological assays for DA. Smith and Kitts (1995) successfully demonstrated the use of an enzyme-linked immunosorbent assay (ELISA) with results correlating well with results obtained by HPLC. Unfortunately, their assay relied upon a limited resource of a serum from a single mouse. More recently, Garthwaite et al. (1998) at the AgResearch Toxicology group in Hamilton, New Zealand, have employed novel
Assessment of Immunoassays
5
hapten chemistries to develop highly sensitive ovine polyclonal antibodies to DA, for use in an indirect competitive ELISA (cELISA). It was reported that this cELISA is specific for DA, and analogous compounds that are sometimes found in algae, such as kainic acid (Fig 1A), do not interfere with the assay. It can detect DA at levels 500 times lower than the regulatory level of 20 µg g-1. The assay is considered to be robust, and was used successfully to determine DA concentrations in a number of shellfish species, seawater samples and algal cultures (Garthwaite et al., 1998; Garthwaite et al., 2001). A commercially available rapid antibody-based qualitative (yes/no) test (Jellet Rapid Test for ASP, previously marketed under the trade name MIST AlertTM for ASP) has been developed which utilises the sheep antibodies developed by Garthwaite and colleagues. This kit employs the principal of lateral flow immuno-chromatography in a strip format. MIST AlertTM for ASP has previously been assessed at FRS and the data reported in FRS Contract Report 03/03 (Smith and Mackintosh, 2002). Researchers at the Millennium Institute for Fundamental and Applied Biology (Santiago, Chile) have developed specific monoclonal antibodies that are reportedly capable of recognising DA (J. Córdova, Molecular Probe Technology for the Detection of Harmful Algae Workshop, Galway, May 2002). These antibodies have been used to develop a qualitative assay in the form of an indirect immunoassay. The antibodies are used to agglutinate latex beads with DA adsorbed to their surface. It is considered that if a shellfish extract contains DA, this molecule will occupy the binding sites on the antibodies and block the latex agglutination.
4. OBJECTIVES Fisheries Research Services (FRS) currently uses, with modification, the HPLC method of Quilliam et al. (1995) for the detection of ASP toxins DA and associated compounds epi-domoic acid (epi-DA) and iso-domoic acids (iso-DA)) for shellfish monitoring purposes (Hess et al., 2001). Although this HPLC technique provides high-resolution profiles and accurate information for DA identification, there is a high cost for the instrumentation, it requires skilled operators and has a relatively low daily sample turnover (approximately 30 samples per day). There is therefore a requirement for simple, cheap, quick and accurate detection methods for ASP toxins in shellfish. It has been considered that it would be more efficient and less costly to introduce an immunoassay-screening test to identify samples that are toxin free, as against those which are toxin positive (Garthwaite, 2000). Shellfish growing areas classed toxin-free could be harvested without further testing, whereas toxin-positive areas would be subjected to the accepted regulatory HPLC method to determine whether toxin levels exceeded the regulatory level. Previous data obtained at FRS suggested that the cELISA, developed by Garthwaite et al. (1998), would be an effective screen for the detection of ASP toxins in the Scottish shellfish monitoring programme, reducing the number of samples processed by more time consuming HPLC. However, frequent problems arose when new batches of cELISA reagents were used (in particular batch to batch variation in the DA plate coating conjugate and primary antibodies) (M Mackenzie, pers. comm.). It was concluded that additional evaluation of the cELISA was required with optimisation of the reagents prior to undertaking further comparisons between the cELISA and HPLC methodologies. Therefore, the main objective of this study was to optimise the cELISA for the detection of ASP toxins in shellfish and to compare the results with data generated by HPLC. MIST AlertTM for ASP, a commercial antibody based rapid test kit for the qualitative (yes/no) detection of ASP toxins has previously been assessed at FRS (Mackintosh and Smith, 2002; Smith and Mackintosh 2002). The advantage of this test over the cELISA is that it does not require any instrumentation to interpret the result and consequently lends itself to use in the
Assessment of Immunoassays
6
field by shellfish harvesters. However, results demonstrated that MIST AlertTM for ASP was too sensitive to screen out negative and low-toxicity shellfish samples in the monitoring programme. In early 2002 Jellet Bioteck Ltd. ceased production of the MIST AlertTM kit, hence further optimisation and trials were not feasible. In May 2002, at the Molecular Probe Technology for the Detection of Harmful Algae Workshop (Galway, Ireland), J. Córdova demonstrated a rapid agglutination assay for the detection of ASP toxins that requires no instrumentation. As a result it was decided to undertake a further preliminary investigation into the use of this methodology for the detection of ASP toxins in Scottish shellfish. Hence, FRS entered into a testing programme with the following objectives and milestones:
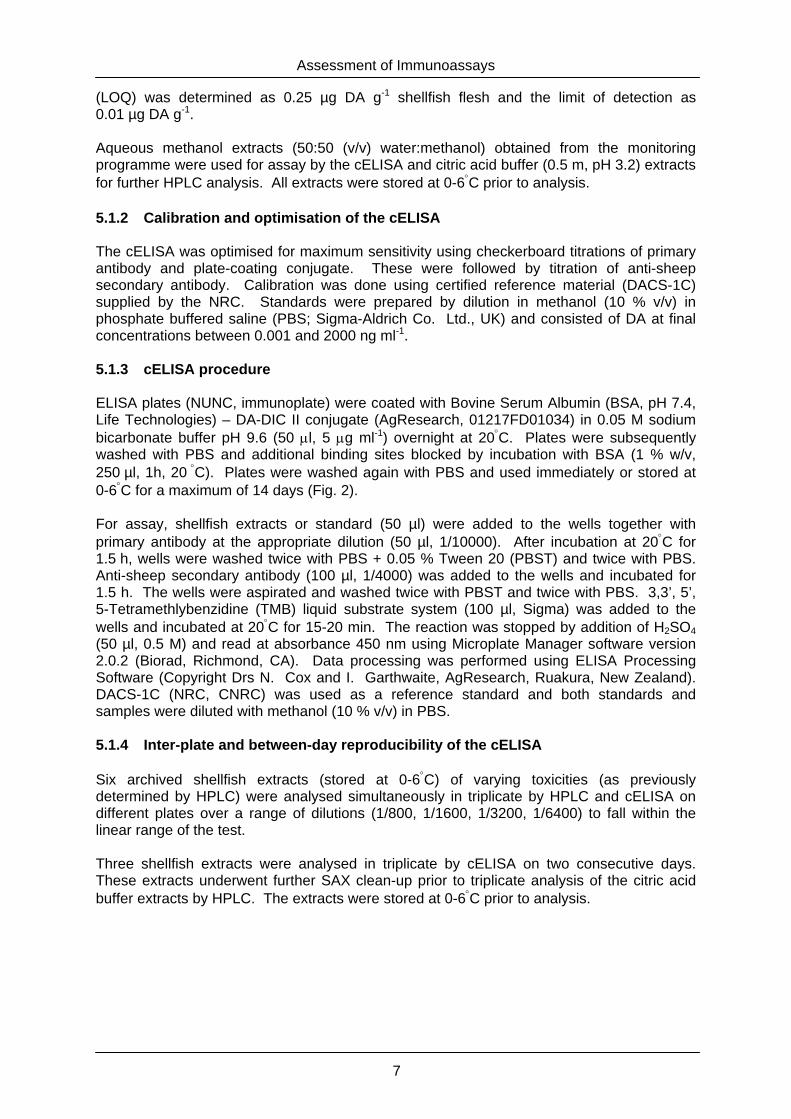
5. EXPERIMENTAL PROCEDURES 5.1 Assessment of the Indirect cELISA for the Detection of ASP Toxins 5.1.1 Shellfish extracts and HPLC analysis Concentrations of ASP toxins in shellfish extracts were initially determined by applying the HPLC method of Quilliam et al. (1995) modified by Hess et al. (2001) as part of the shellfish toxin monitoring programme commissioned by the Food Standards Agency (Scotland). In brief, shellfish homogenates were extracted in aqueous methanol (50:50 (v/v) water:methanol), followed by strong anion exchange (SAX) clean-up and elution with citric acid buffer (0.5 M, pH 3.2) and HPLC with UV diode-array detection. Identification of DA and epi-DA was made by the coincidence of retention times and UV spectra with standards (DACS-1C) supplied by the National Research Council (NRC) (Halifax, Nova Scotia, Canada). Further iso-DA’s, for which standards are commercially unavailable were quantified by comparison with DA and were termed iso-DA1, iso-DA2 and iso-DA3 in the order of their retention time. Calibration was performed externally using DA calibration standards (0.5, 1.0, 2.0, 5.0 and 10.0 µg ml-1) run every 10-15 samples. Calibration curves were always linear, with correlation coefficients > 0.99. The method limit of quantification
Objective 1 Assessment of cELISA for the detection of ASP toxins as a screen in shellfish monitoring Milestone 1 Optimisation of the cELISA for detecting the presence of ASP toxins in shellfish
Milestone 2 Evaluation of the optimised cELISA with comparison between HPLC for the detection of
ASP toxins during routine monitoring
Objective 2 Assessment of the antibody agglutination assay for the detection of ASP toxins Milestone 1
Evaluation of the agglutination assay for determining the presence/absence of ASP toxins
in shellfish
Milestone 2 Compare the qualitative data generated from the assay with quantitative results generated
from the HPLC method
Assessment of Immunoassays
7
(LOQ) was determined as 0.25 µg DA g-1 shellfish flesh and the limit of detection as 0.01 µg DA g-1. Aqueous methanol extracts (50:50 (v/v) water:methanol) obtained from the monitoring programme were used for assay by the cELISA and citric acid buffer (0.5 m, pH 3.2) extracts for further HPLC analysis. All extracts were stored at 0-6°C prior to analysis. 5.1.2 Calibration and optimisation of the cELISA The cELISA was optimised for maximum sensitivity using checkerboard titrations of primary antibody and plate-coating conjugate. These were followed by titration of anti-sheep secondary antibody. Calibration was done using certified reference material (DACS-1C) supplied by the NRC. Standards were prepared by dilution in methanol (10 % v/v) in phosphate buffered saline (PBS; Sigma-Aldrich Co. Ltd., UK) and consisted of DA at final concentrations between 0.001 and 2000 ng ml-1. 5.1.3 cELISA procedure ELISA plates (NUNC, immunoplate) were coated with Bovine Serum Albumin (BSA, pH 7.4, Life Technologies) – DA-DIC II conjugate (AgResearch, 01217FD01034) in 0.05 M sodium bicarbonate buffer pH 9.6 (50 µl, 5 µg ml-1) overnight at 20°C. Plates were subsequently washed with PBS and additional binding sites blocked by incubation with BSA (1 % w/v, 250 µl, 1h, 20 °C). Plates were washed again with PBS and used immediately or stored at 0-6°C for a maximum of 14 days (Fig. 2). For assay, shellfish extracts or standard (50 µl) were added to the wells together with primary antibody at the appropriate dilution (50 µl, 1/10000). After incubation at 20°C for 1.5 h, wells were washed twice with PBS + 0.05 % Tween 20 (PBST) and twice with PBS. Anti-sheep secondary antibody (100 µl, 1/4000) was added to the wells and incubated for 1.5 h. The wells were aspirated and washed twice with PBST and twice with PBS. 3,3’, 5’, 5-Tetramethlybenzidine (TMB) liquid substrate system (100 µl, Sigma) was added to the wells and incubated at 20°C for 15-20 min. The reaction was stopped by addition of H2SO4 (50 µl, 0.5 M) and read at absorbance 450 nm using Microplate Manager software version 2.0.2 (Biorad, Richmond, CA). Data processing was performed using ELISA Processing Software (Copyright Drs N. Cox and I. Garthwaite, AgResearch, Ruakura, New Zealand). DACS-1C (NRC, CNRC) was used as a reference standard and both standards and samples were diluted with methanol (10 % v/v) in PBS. 5.1.4 Inter-plate and between-day reproducibility of the cELISA Six archived shellfish extracts (stored at 0-6°C) of varying toxicities (as previously determined by HPLC) were analysed simultaneously in triplicate by HPLC and cELISA on different plates over a range of dilutions (1/800, 1/1600, 1/3200, 1/6400) to fall within the linear range of the test. Three shellfish extracts were analysed in triplicate by cELISA on two consecutive days. These extracts underwent further SAX clean-up prior to triplicate analysis of the citric acid buffer extracts by HPLC. The extracts were stored at 0-6°C prior to analysis.
Assessment of Immunoassays
8
5.1.5 Quantitative comparison between HPLC and the cELISA Shellfish extracts (n = 94), obtained from the monitoring programme, were analysed concurrently in duplicate by cELISA, over a range of dilutions, and HPLC for DA and its isomers (iso-DA1, 2, 3 and epi-DA) and results from the two techniques compared. The extracts were from a range of shellfish species (native oysters, pacific oysters, mussels, razor fish, queen scallops and king scallops).
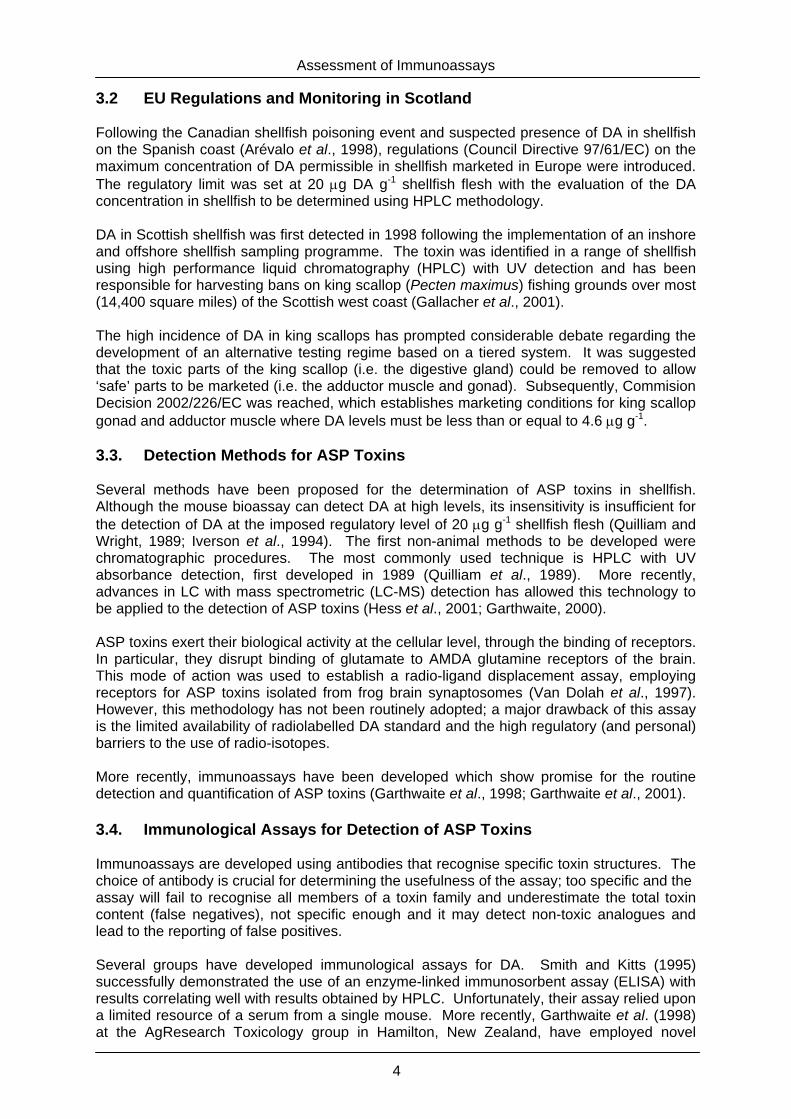
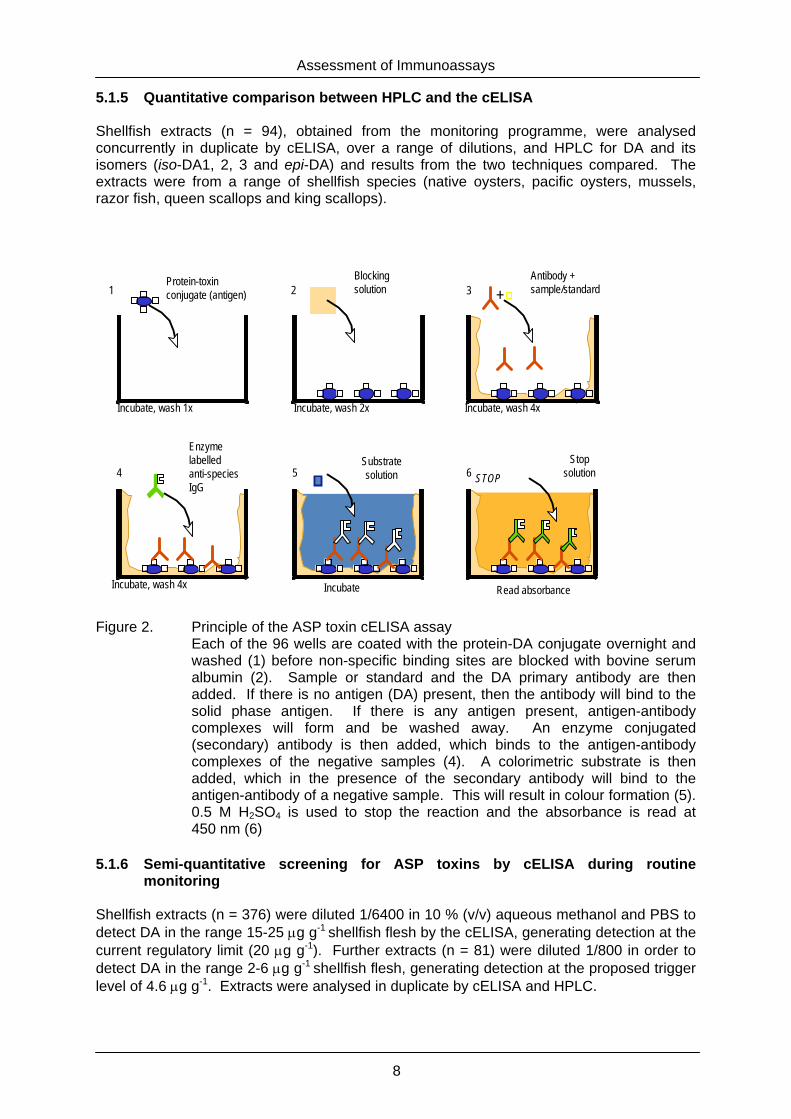
Figure 2. Principle of the ASP toxin cELISA assay
Each of the 96 wells are coated with the protein-DA conjugate overnight and washed (1) before non-specific binding sites are blocked with bovine serum albumin (2). Sample or standard and the DA primary antibody are then added. If there is no antigen (DA) present, then the antibody will bind to the solid phase antigen. If there is any antigen present, antigen-antibody complexes will form and be washed away. An enzyme conjugated (secondary) antibody is then added, which binds to the antigen-antibody complexes of the negative samples (4). A colorimetric substrate is then added, which in the presence of the secondary antibody will bind to the antigen-antibody of a negative sample. This will result in colour formation (5). 0.5 M H2SO4 is used to stop the reaction and the absorbance is read at 450 nm (6)
5.1.6 Semi-quantitative screening for ASP toxins by cELISA during routine
monitoring Shellfish extracts (n = 376) were diluted 1/6400 in 10 % (v/v) aqueous methanol and PBS to detect DA in the range 15-25 µg g-1 shellfish flesh by the cELISA, generating detection at the current regulatory limit (20 µg g-1). Further extracts (n = 81) were diluted 1/800 in order to detect DA in the range 2-6 µg g-1 shellfish flesh, generating detection at the proposed trigger level of 4.6 µg g-1. Extracts were analysed in duplicate by cELISA and HPLC.
Read absorbance
Protein-toxinconjugate (antigen)
Substratesolution
Incubate
5
Incubate, wash 4x
3 +
Incubate, wash 2x
2
Incubate, wash 1x
1
Incubate, wash 4x
4Stop
solution6 STOP
Antibody +sample/standard
Blockingsolution
Enzymelabelledanti-speciesIgG
Assessment of Immunoassays
9
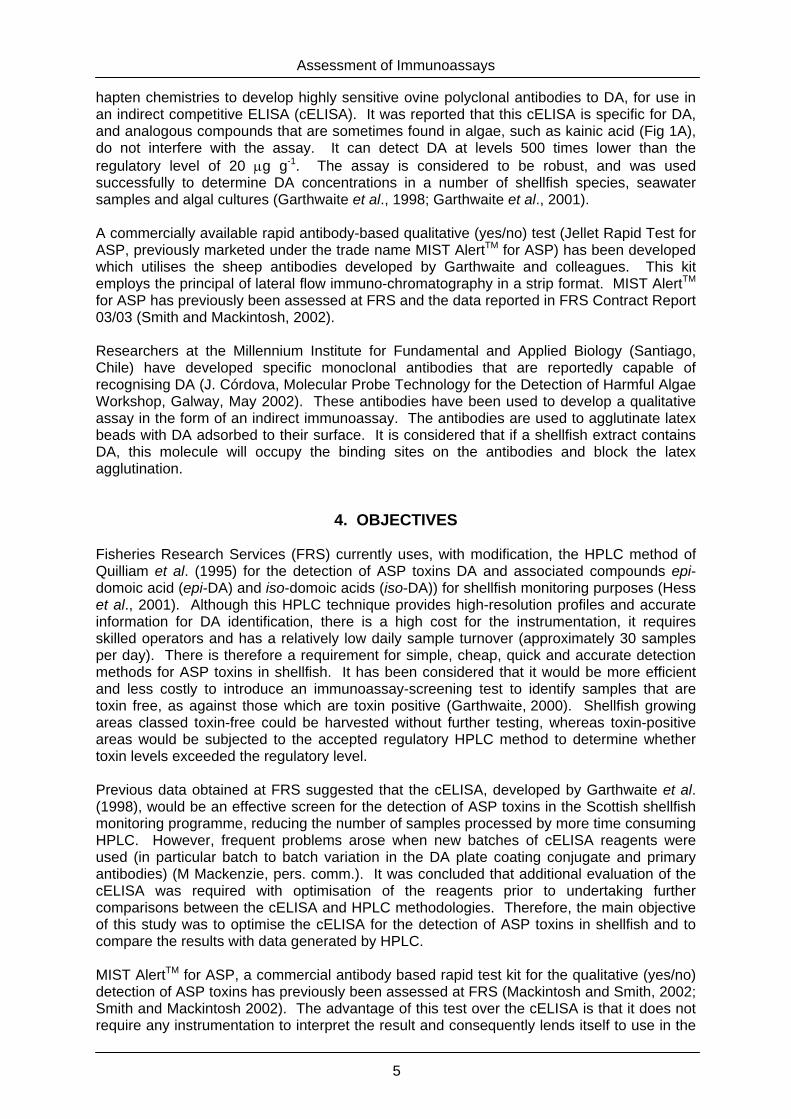
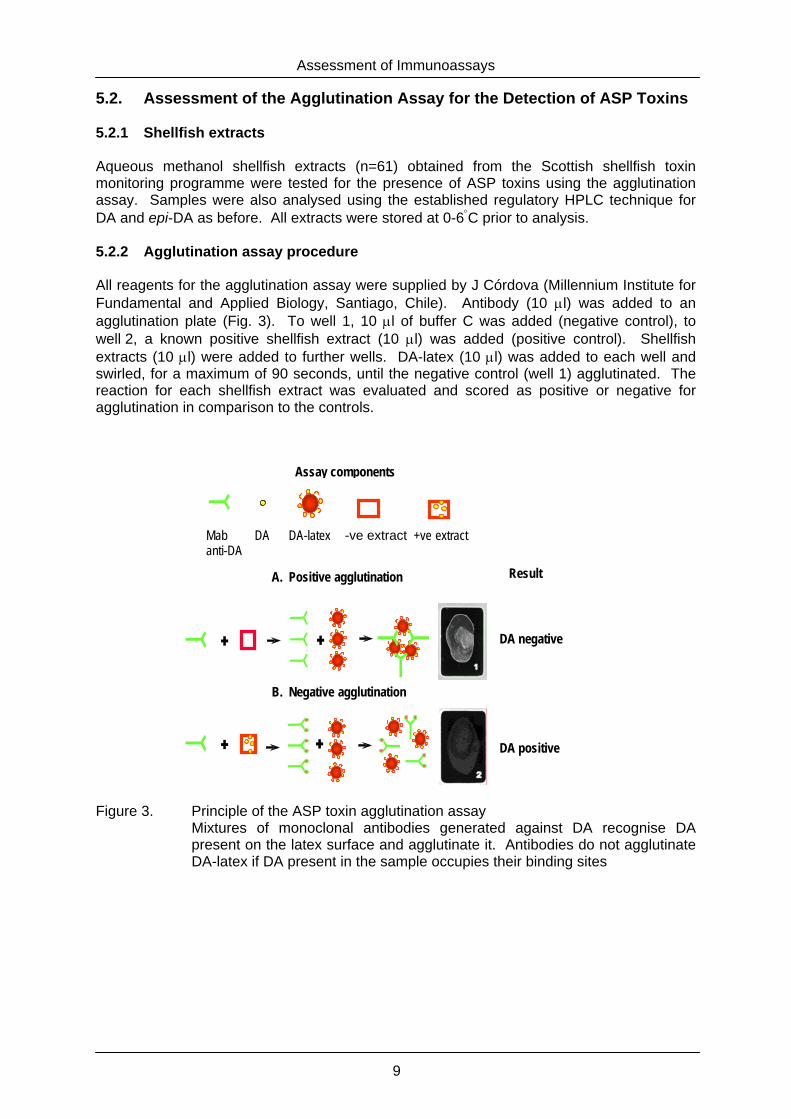
5.2. Assessment of the Agglutination Assay for the Detection of ASP Toxins 5.2.1 Shellfish extracts Aqueous methanol shellfish extracts (n=61) obtained from the Scottish shellfish toxin monitoring programme were tested for the presence of ASP toxins using the agglutination assay. Samples were also analysed using the established regulatory HPLC technique for DA and epi-DA as before. All extracts were stored at 0-6°C prior to analysis. 5.2.2 Agglutination assay procedure All reagents for the agglutination assay were supplied by J Córdova (Millennium Institute for Fundamental and Applied Biology, Santiago, Chile). Antibody (10 µl) was added to an agglutination plate (Fig. 3). To well 1, 10 µl of buffer C was added (negative control), to well 2, a known positive shellfish extract (10 µl) was added (positive control). Shellfish extracts (10 µl) were added to further wells. DA-latex (10 µl) was added to each well and swirled, for a maximum of 90 seconds, until the negative control (well 1) agglutinated. The reaction for each shellfish extract was evaluated and scored as positive or negative for agglutination in comparison to the controls. Figure 3. Principle of the ASP toxin agglutination assay
Mixtures of monoclonal antibodies generated against DA recognise DA present on the latex surface and agglutinate it. Antibodies do not agglutinate DA-latex if DA present in the sample occupies their binding sites
Assay components
Mab anti-DA
DA DA-latex
18
Result
DA negative
-ve extract +ve extract A. Positive agglutination
DA positive
B. Negative agglutination
Assessment of Immunoassays
10
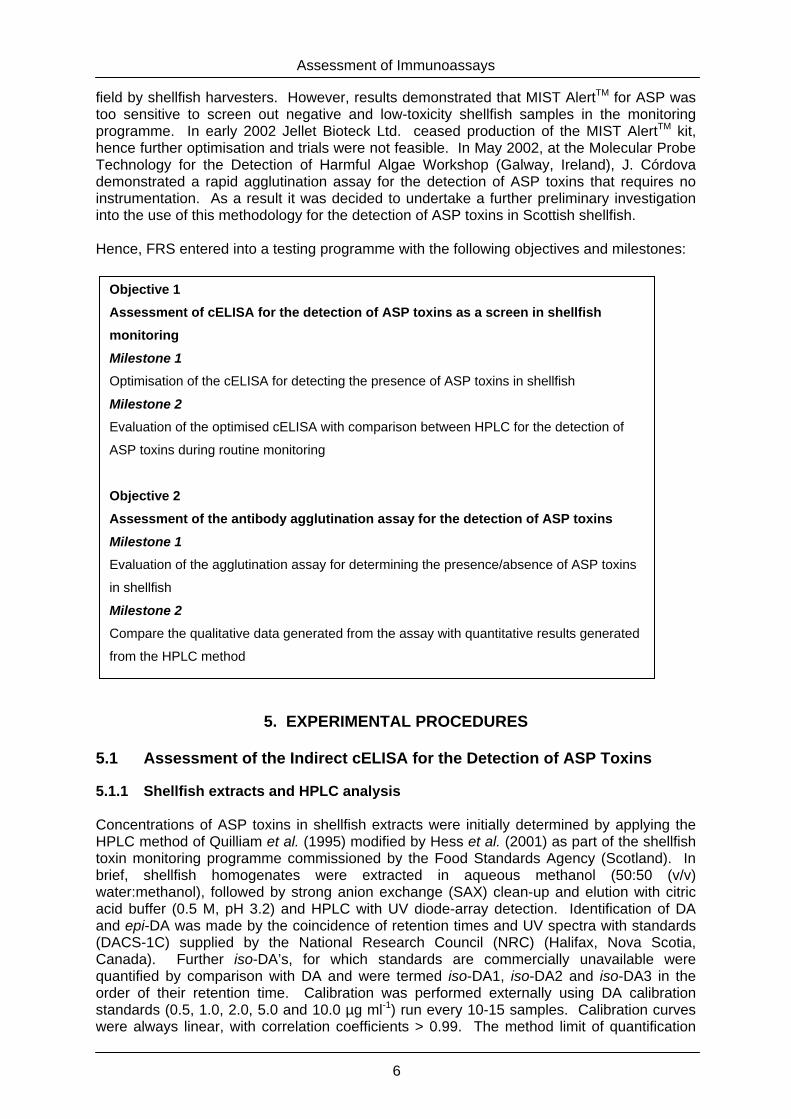
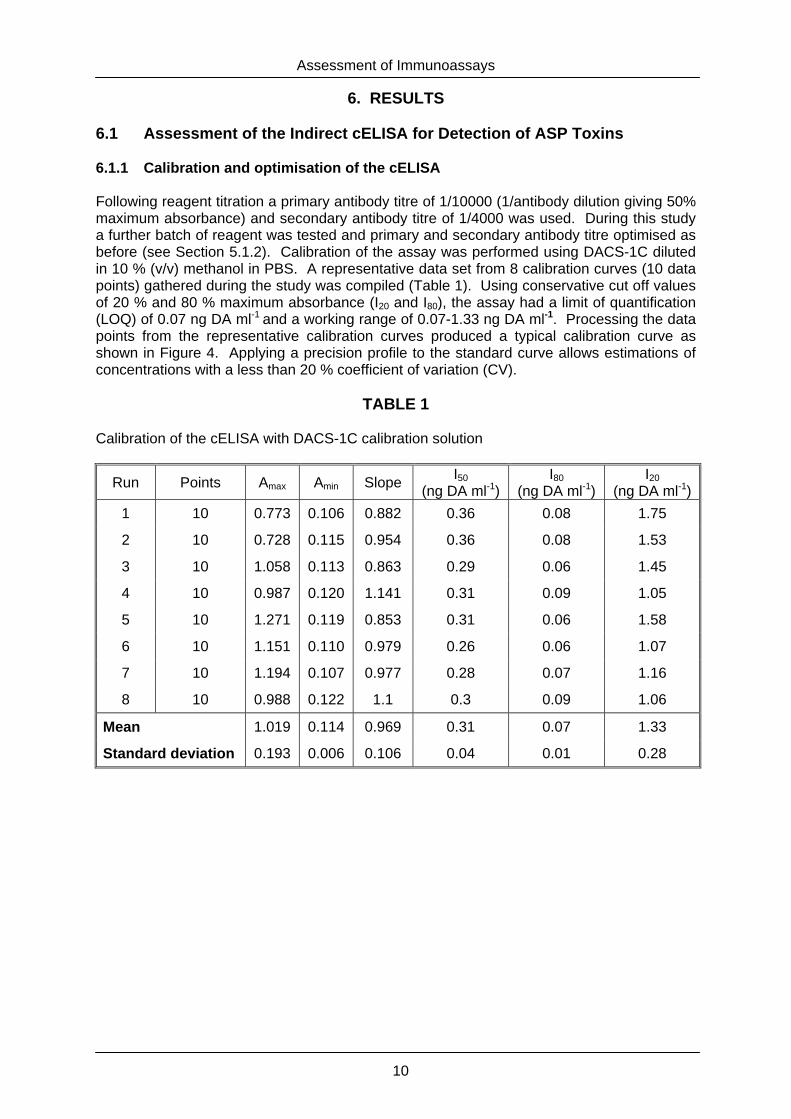
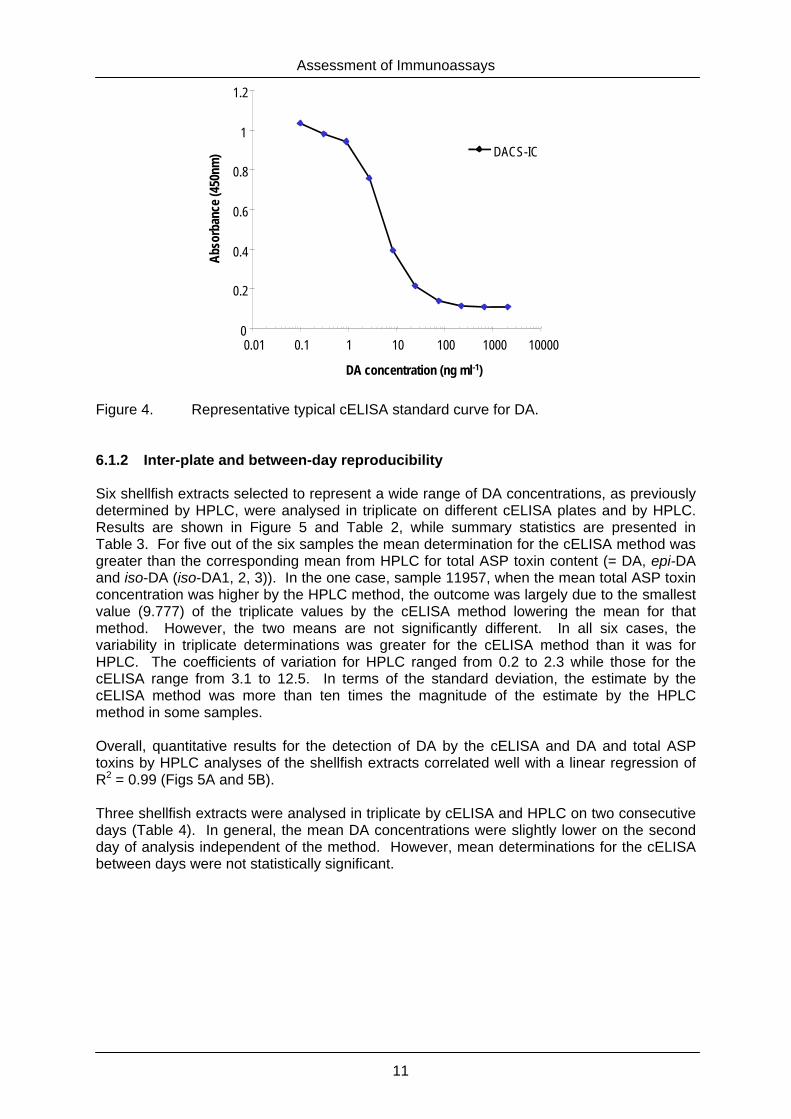
6. RESULTS 6.1 Assessment of the Indirect cELISA for Detection of ASP Toxins 6.1.1 Calibration and optimisation of the cELISA Following reagent titration a primary antibody titre of 1/10000 (1/antibody dilution giving 50% maximum absorbance) and secondary antibody titre of 1/4000 was used. During this study a further batch of reagent was tested and primary and secondary antibody titre optimised as before (see Section 5.1.2). Calibration of the assay was performed using DACS-1C diluted in 10 % (v/v) methanol in PBS. A representative data set from 8 calibration curves (10 data points) gathered during the study was compiled (Table 1). Using conservative cut off values of 20 % and 80 % maximum absorbance (I20 and I80), the assay had a limit of quantification (LOQ) of 0.07 ng DA ml-1 and a working range of 0.07-1.33 ng DA ml-1. Processing the data points from the representative calibration curves produced a typical calibration curve as shown in Figure 4. Applying a precision profile to the standard curve allows estimations of concentrations with a less than 20 % coefficient of variation (CV).
TABLE 1 Calibration of the cELISA with DACS-1C calibration solution
Run Points Amax Amin Slope I50 (ng DA ml-1)
I80 (ng DA ml-1)
I20 (ng DA ml-1)
1 10 0.773 0.106 0.882 0.36 0.08 1.75
2 10 0.728 0.115 0.954 0.36 0.08 1.53
3 10 1.058 0.113 0.863 0.29 0.06 1.45
4 10 0.987 0.120 1.141 0.31 0.09 1.05
5 10 1.271 0.119 0.853 0.31 0.06 1.58
6 10 1.151 0.110 0.979 0.26 0.06 1.07
7 10 1.194 0.107 0.977 0.28 0.07 1.16
8 10 0.988 0.122 1.1 0.3 0.09 1.06
Mean 1.019 0.114 0.969 0.31 0.07 1.33
Standard deviation 0.193 0.006 0.106 0.04 0.01 0.28
Assessment of Immunoassays
11
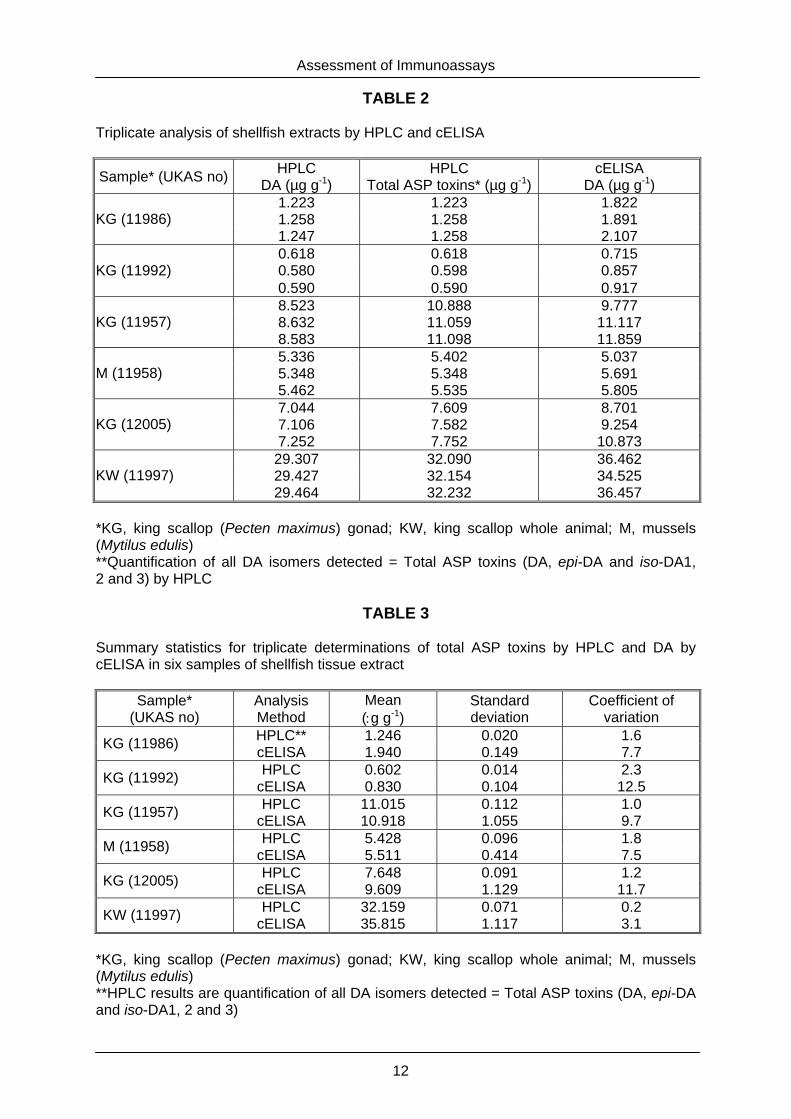
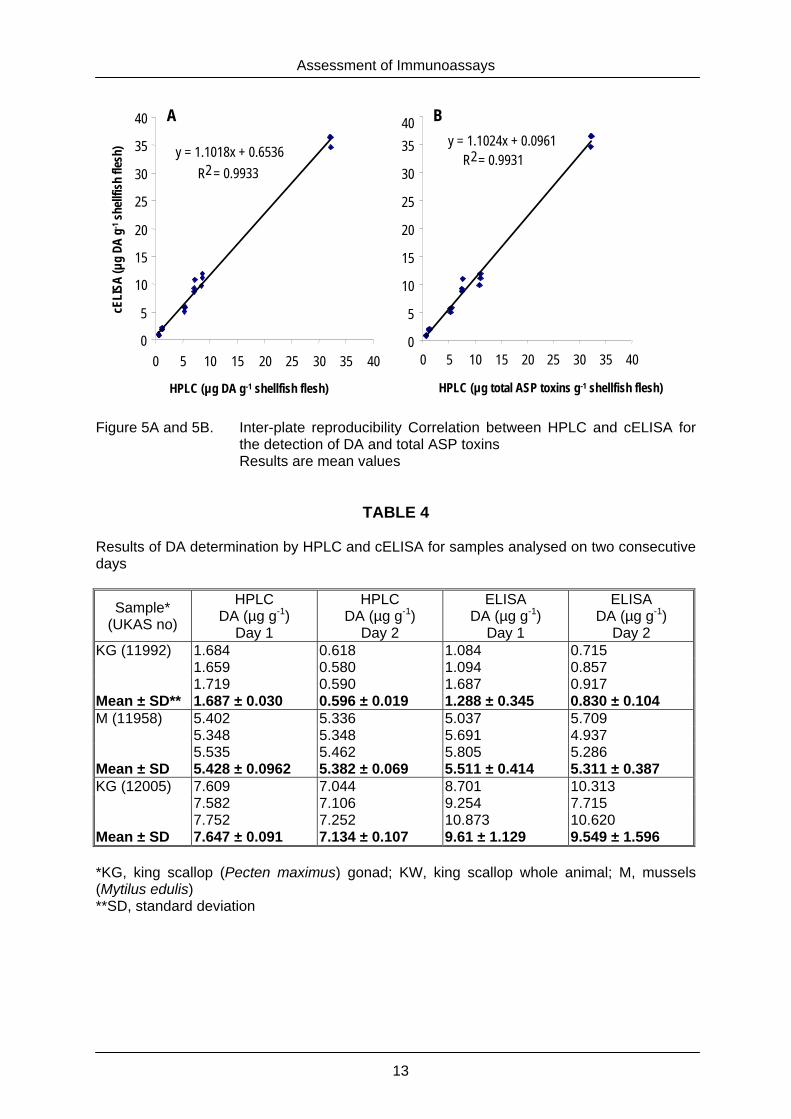
Figure 4. Representative typical cELISA standard curve for DA. 6.1.2 Inter-plate and between-day reproducibility Six shellfish extracts selected to represent a wide range of DA concentrations, as previously determined by HPLC, were analysed in triplicate on different cELISA plates and by HPLC. Results are shown in Figure 5 and Table 2, while summary statistics are presented in Table 3. For five out of the six samples the mean determination for the cELISA method was greater than the corresponding mean from HPLC for total ASP toxin content (= DA, epi-DA and iso-DA (iso-DA1, 2, 3)). In the one case, sample 11957, when the mean total ASP toxin concentration was higher by the HPLC method, the outcome was largely due to the smallest value (9.777) of the triplicate values by the cELISA method lowering the mean for that method. However, the two means are not significantly different. In all six cases, the variability in triplicate determinations was greater for the cELISA method than it was for HPLC. The coefficients of variation for HPLC ranged from 0.2 to 2.3 while those for the cELISA range from 3.1 to 12.5. In terms of the standard deviation, the estimate by the cELISA method was more than ten times the magnitude of the estimate by the HPLC method in some samples. Overall, quantitative results for the detection of DA by the cELISA and DA and total ASP toxins by HPLC analyses of the shellfish extracts correlated well with a linear regression of R2 = 0.99 (Figs 5A and 5B). Three shellfish extracts were analysed in triplicate by cELISA and HPLC on two consecutive days (Table 4). In general, the mean DA concentrations were slightly lower on the second day of analysis independent of the method. However, mean determinations for the cELISA between days were not statistically significant.
0
0.2
0.4
0.6
0.8
1
1.2
0.01 0.1 1 10 100 1000 10000
DA concentration (ng ml-1)
Abso
rban
ce (4
50nm
) DACS-IC
Assessment of Immunoassays
12
TABLE 2 Triplicate analysis of shellfish extracts by HPLC and cELISA
Sample* (UKAS no) HPLC DA (µg g-1)
HPLC Total ASP toxins* (µg g-1)
cELISA DA (µg g-1)
1.223 1.223 1.822 1.258 1.258 1.891 KG (11986) 1.247 1.258 2.107 0.618 0.618 0.715 0.580 0.598 0.857 KG (11992) 0.590 0.590 0.917 8.523 10.888 9.777 8.632 11.059 11.117 KG (11957) 8.583 11.098 11.859 5.336 5.402 5.037 5.348 5.348 5.691 M (11958) 5.462 5.535 5.805 7.044 7.609 8.701 7.106 7.582 9.254 KG (12005) 7.252 7.752 10.873
29.307 32.090 36.462 29.427 32.154 34.525 KW (11997) 29.464 32.232 36.457
*KG, king scallop (Pecten maximus) gonad; KW, king scallop whole animal; M, mussels (Mytilus edulis) **Quantification of all DA isomers detected = Total ASP toxins (DA, epi-DA and iso-DA1, 2 and 3) by HPLC
TABLE 3 Summary statistics for triplicate determinations of total ASP toxins by HPLC and DA by cELISA in six samples of shellfish tissue extract
Sample* (UKAS no)
Analysis Method
Mean (:g g-1)
Standard deviation
Coefficient of variation
HPLC** 1.246 0.020 1.6 KG (11986) cELISA 1.940 0.149 7.7 HPLC 0.602 0.014 2.3 KG (11992) cELISA 0.830 0.104 12.5 HPLC 11.015 0.112 1.0 KG (11957) cELISA 10.918 1.055 9.7 HPLC 5.428 0.096 1.8 M (11958) cELISA 5.511 0.414 7.5 HPLC 7.648 0.091 1.2 KG (12005) cELISA 9.609 1.129 11.7 HPLC 32.159 0.071 0.2 KW (11997) cELISA 35.815 1.117 3.1
*KG, king scallop (Pecten maximus) gonad; KW, king scallop whole animal; M, mussels (Mytilus edulis) **HPLC results are quantification of all DA isomers detected = Total ASP toxins (DA, epi-DA and iso-DA1, 2 and 3)
Assessment of Immunoassays
13
Figure 5A and 5B. Inter-plate reproducibility Correlation between HPLC and cELISA for
the detection of DA and total ASP toxins Results are mean values
TABLE 4 Results of DA determination by HPLC and cELISA for samples analysed on two consecutive days
Sample* (UKAS no)
HPLC DA (µg g-1)
Day 1
HPLC DA (µg g-1)
Day 2
ELISA DA (µg g-1)
Day 1
ELISA DA (µg g-1)
Day 2 1.684 0.618 1.084 0.715 1.659 0.580 1.094 0.857
KG (11992)
1.719 0.590 1.687 0.917 Mean ± SD** 1.687 ± 0.030 0.596 ± 0.019 1.288 ± 0.345 0.830 ± 0.104
5.402 5.336 5.037 5.709 5.348 5.348 5.691 4.937
M (11958)
5.535 5.462 5.805 5.286 Mean ± SD 5.428 ± 0.0962 5.382 ± 0.069 5.511 ± 0.414 5.311 ± 0.387
7.609 7.044 8.701 10.313 7.582 7.106 9.254 7.715
KG (12005)
7.752 7.252 10.873 10.620 Mean ± SD 7.647 ± 0.091 7.134 ± 0.107 9.61 ± 1.129 9.549 ± 1.596 *KG, king scallop (Pecten maximus) gonad; KW, king scallop whole animal; M, mussels (Mytilus edulis) **SD, standard deviation
40y = 1.1024x + 0.0961
R2 = 0.9931
0
5
10
15
20
25
30
35
0 5 10 15 20 25 30 35 40
HPLC (µg total ASP toxins g-1 shellfish flesh)
y = 1.1018x + 0.6536R2 = 0.9933
0
5
10
15
20
25
30
35
40
0 5 10 15 20 25 30 35 40
cELI
SA (µ
g DA
g-1
shell
fish
flesh
)
HPLC (µg DA g-1 shellfish flesh)
A B
Assessment of Immunoassays
14
6.1.3 Comparison between HPLC and cELISA for the quantitative detection of ASP toxins
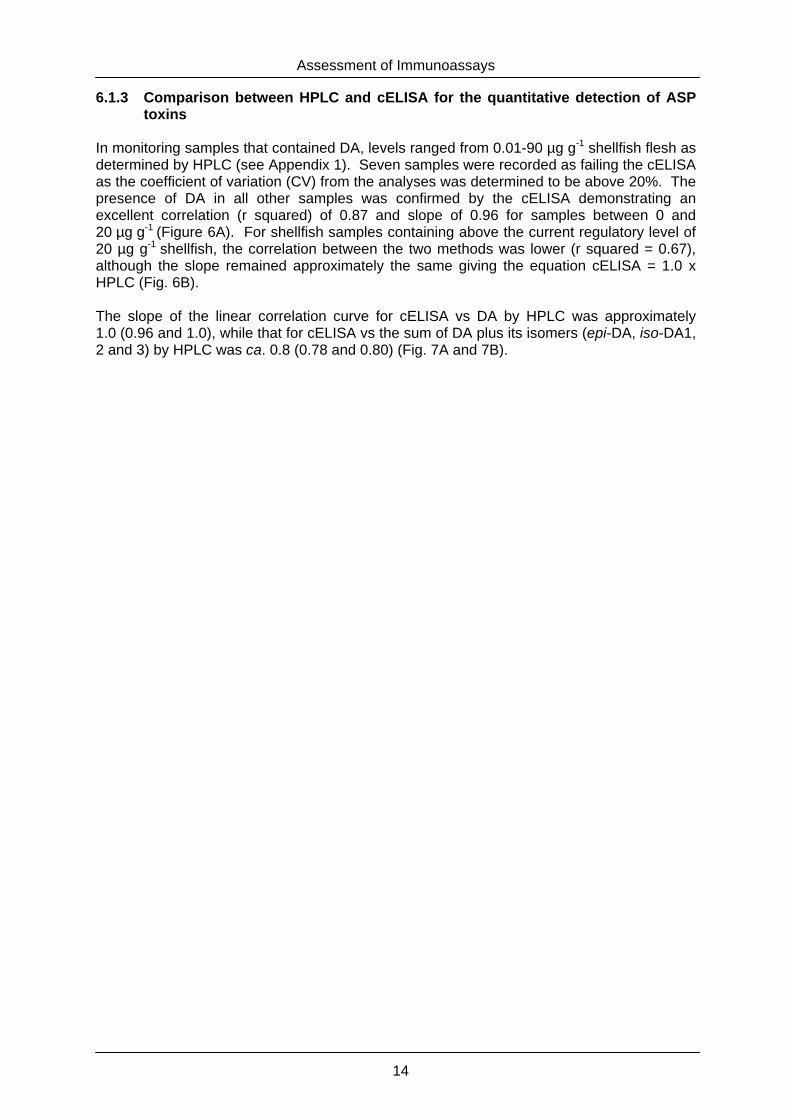
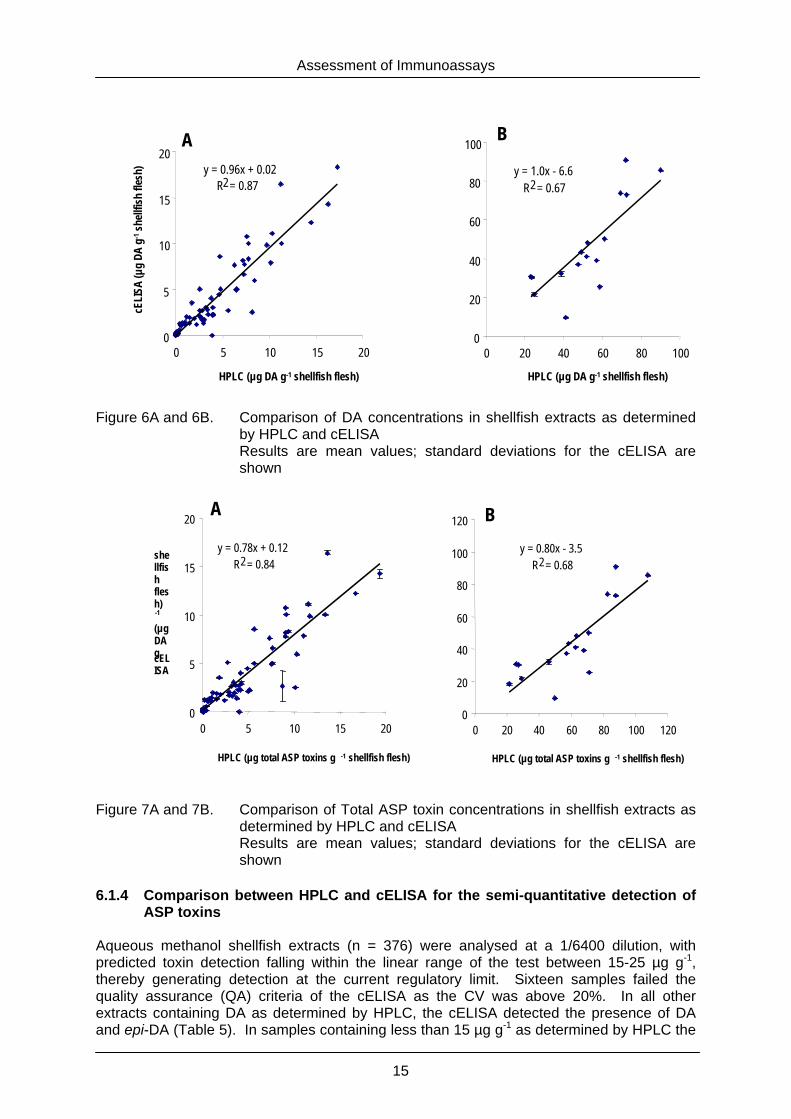
In monitoring samples that contained DA, levels ranged from 0.01-90 µg g-1 shellfish flesh as determined by HPLC (see Appendix 1). Seven samples were recorded as failing the cELISA as the coefficient of variation (CV) from the analyses was determined to be above 20%. The presence of DA in all other samples was confirmed by the cELISA demonstrating an excellent correlation (r squared) of 0.87 and slope of 0.96 for samples between 0 and 20 µg g-1 (Figure 6A). For shellfish samples containing above the current regulatory level of 20 µg g-1 shellfish, the correlation between the two methods was lower (r squared = 0.67), although the slope remained approximately the same giving the equation cELISA = 1.0 x HPLC (Fig. 6B). The slope of the linear correlation curve for cELISA vs DA by HPLC was approximately 1.0 (0.96 and 1.0), while that for cELISA vs the sum of DA plus its isomers (epi-DA, iso-DA1, 2 and 3) by HPLC was ca. 0.8 (0.78 and 0.80) (Fig. 7A and 7B).
Assessment of Immunoassays
15
Figure 6A and 6B. Comparison of DA concentrations in shellfish extracts as determined
by HPLC and cELISA Results are mean values; standard deviations for the cELISA are shown
Figure 7A and 7B. Comparison of Total ASP toxin concentrations in shellfish extracts as
determined by HPLC and cELISA Results are mean values; standard deviations for the cELISA are shown
6.1.4 Comparison between HPLC and cELISA for the semi-quantitative detection of
ASP toxins Aqueous methanol shellfish extracts (n = 376) were analysed at a 1/6400 dilution, with predicted toxin detection falling within the linear range of the test between 15-25 µg g-1, thereby generating detection at the current regulatory limit. Sixteen samples failed the quality assurance (QA) criteria of the cELISA as the CV was above 20%. In all other extracts containing DA as determined by HPLC, the cELISA detected the presence of DA and epi-DA (Table 5). In samples containing less than 15 µg g-1 as determined by HPLC the
y = 0.96x + 0.02R2 = 0.87
0
5
10
15
20
0 5 10 15 20
HPLC (µg DA g-1 shellfish flesh)HPLC (µg DA g-1 shellfish flesh)
cELI
SA (µ
g DA
g-1
shell
fish
flesh
)A
y = 1.0x - 6.6R2 = 0.67
0
20
40
60
80
100
0 20 40 60 80 100
B
A
y = 0.78x + 0.12R2 = 0.84
0
5
10
15
20
0 5 10 15 20
HPLC (µg total ASP toxins g -1 shellfish flesh)
cELISA
(µgDAg
-1
shellfishflesh)
y = 0.80x - 3.5R2 = 0.68
0
20
40
60
80
100
120
0 20 40 60 80 100 120
HPLC (µg total ASP toxins g -1 shellfish flesh)
B
Assessment of Immunoassays
16
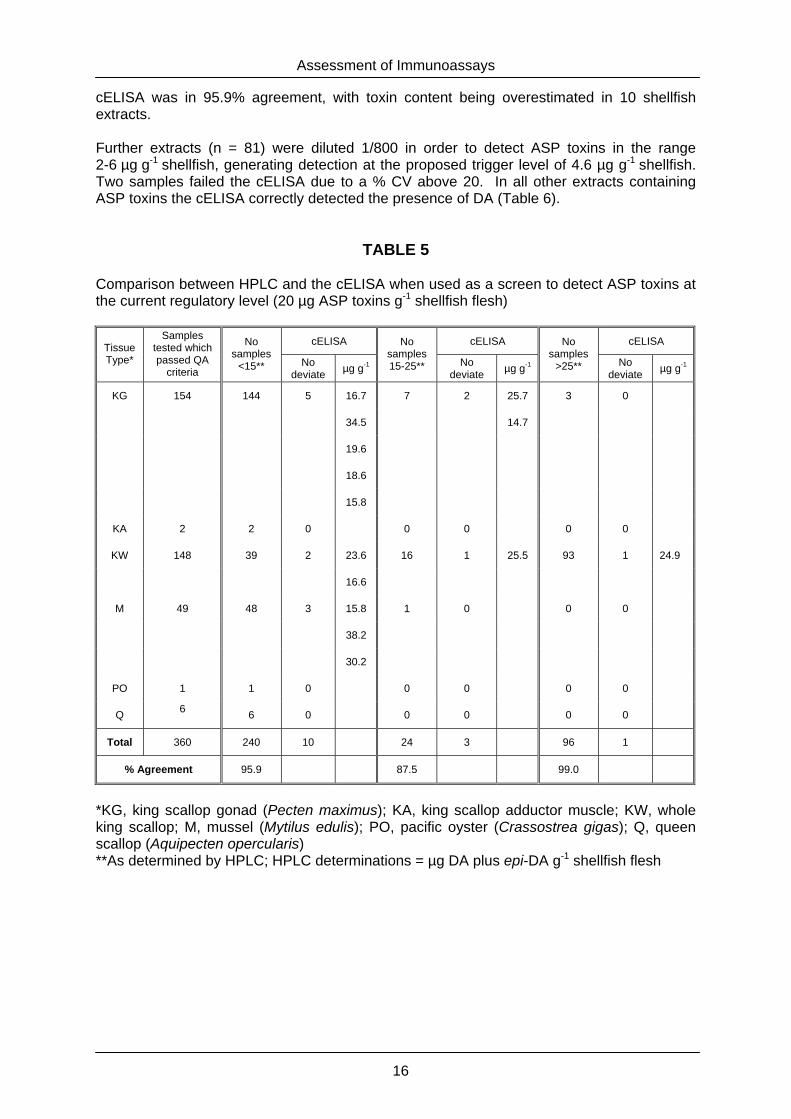
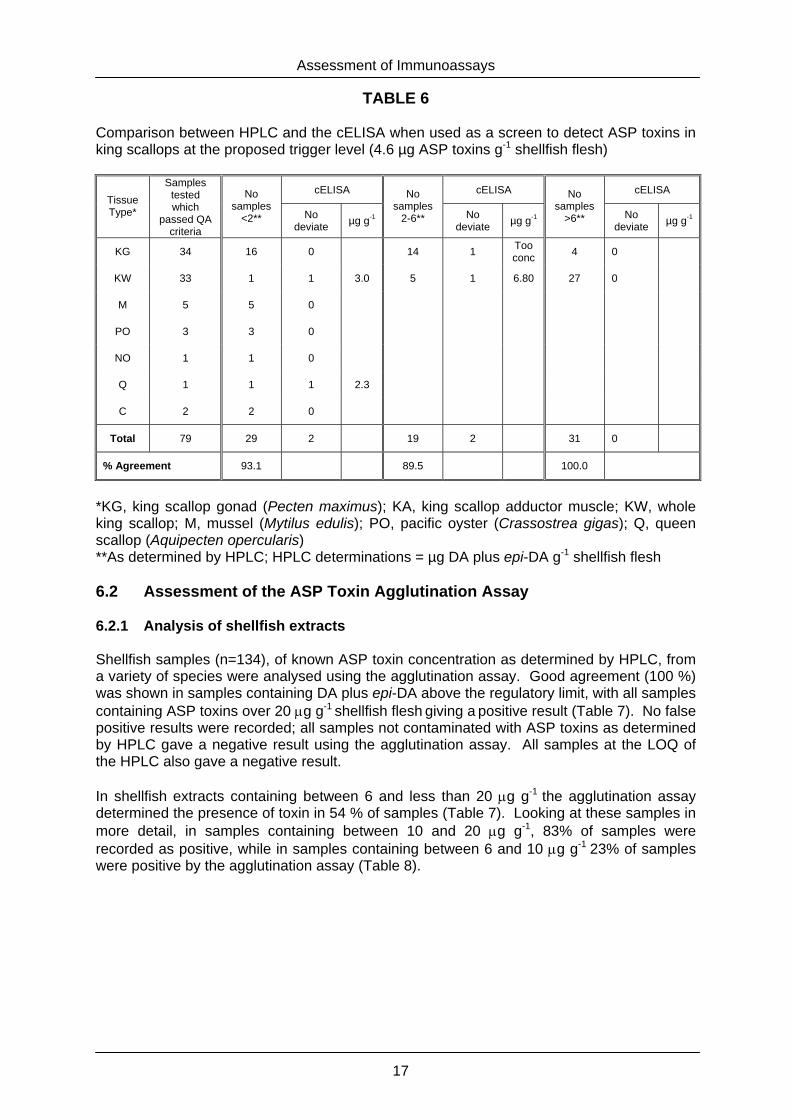
cELISA was in 95.9% agreement, with toxin content being overestimated in 10 shellfish extracts. Further extracts (n = 81) were diluted 1/800 in order to detect ASP toxins in the range 2-6 µg g-1 shellfish, generating detection at the proposed trigger level of 4.6 µg g-1 shellfish. Two samples failed the cELISA due to a % CV above 20. In all other extracts containing ASP toxins the cELISA correctly detected the presence of DA (Table 6).
TABLE 5 Comparison between HPLC and the cELISA when used as a screen to detect ASP toxins at the current regulatory level (20 µg ASP toxins g-1 shellfish flesh)
cELISA cELISA cELISA Tissue Type*
Samples tested which passed QA
criteria
No samples
<15** No deviate µg g-1
No samples 15-25** No
deviate µg g-1
No samples
>25** No deviate µg g-1
KG 154 144 5 16.7 7 2 25.7 3 0
34.5 14.7
19.6
18.6
15.8
KA 2 2 0 0 0 0 0
KW 148 39 2 23.6 16 1 25.5 93 1 24.9
16.6
M 49 48 3 15.8 1 0 0 0
38.2
30.2
PO 1 1 0 0 0 0 0
Q 6 6 0 0 0 0 0
Total 360 240 10 24 3 96 1
% Agreement 95.9 87.5 99.0
*KG, king scallop gonad (Pecten maximus); KA, king scallop adductor muscle; KW, whole king scallop; M, mussel (Mytilus edulis); PO, pacific oyster (Crassostrea gigas); Q, queen scallop (Aquipecten opercularis) **As determined by HPLC; HPLC determinations = µg DA plus epi-DA g-1 shellfish flesh
Assessment of Immunoassays
17
TABLE 6 Comparison between HPLC and the cELISA when used as a screen to detect ASP toxins in king scallops at the proposed trigger level (4.6 µg ASP toxins g-1 shellfish flesh)
cELISA cELISA cELISA Tissue Type*
Samples tested which
passed QA criteria
No samples
<2** No deviate µg g-1
No samples
2-6** No deviate µg g-1
No samples
>6** No deviate µg g-1
KG 34 16 0 14 1 Too conc 4 0
KW 33 1 1 3.0 5 1 6.80 27 0
M 5 5 0
PO 3 3 0
NO 1 1 0
Q 1 1 1 2.3
C 2 2 0
Total 79 29 2 19 2 31 0
% Agreement 93.1 89.5 100.0
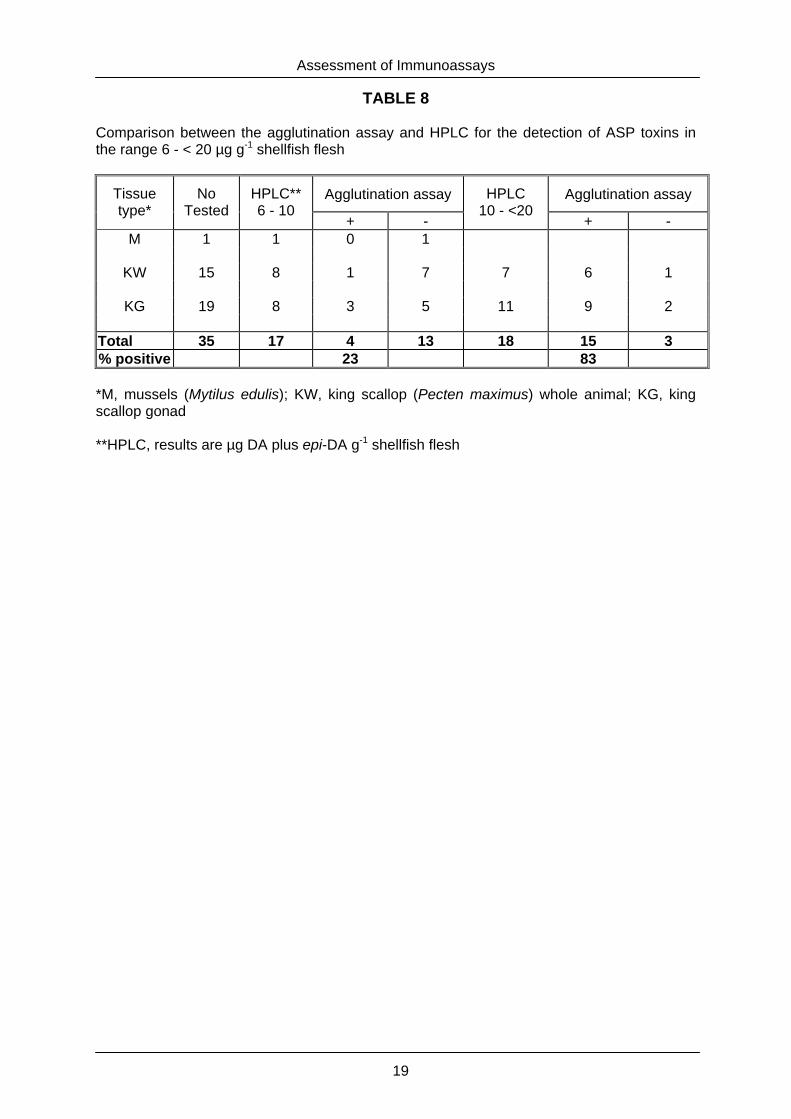
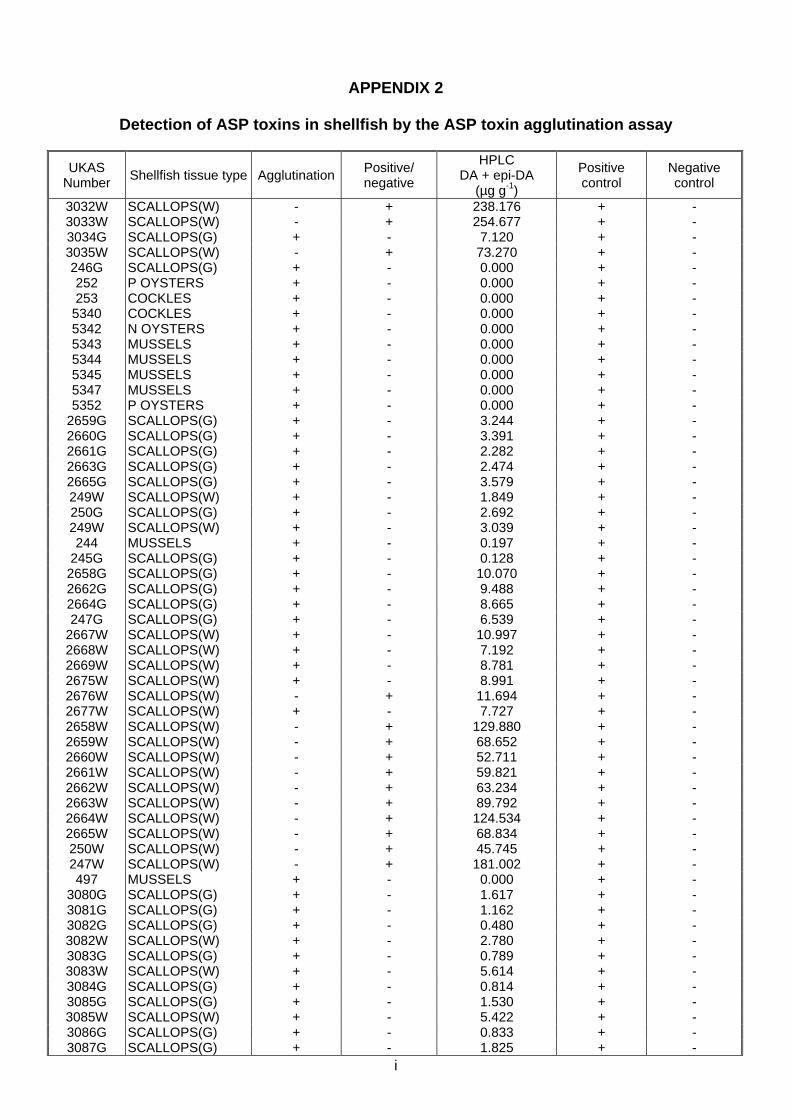
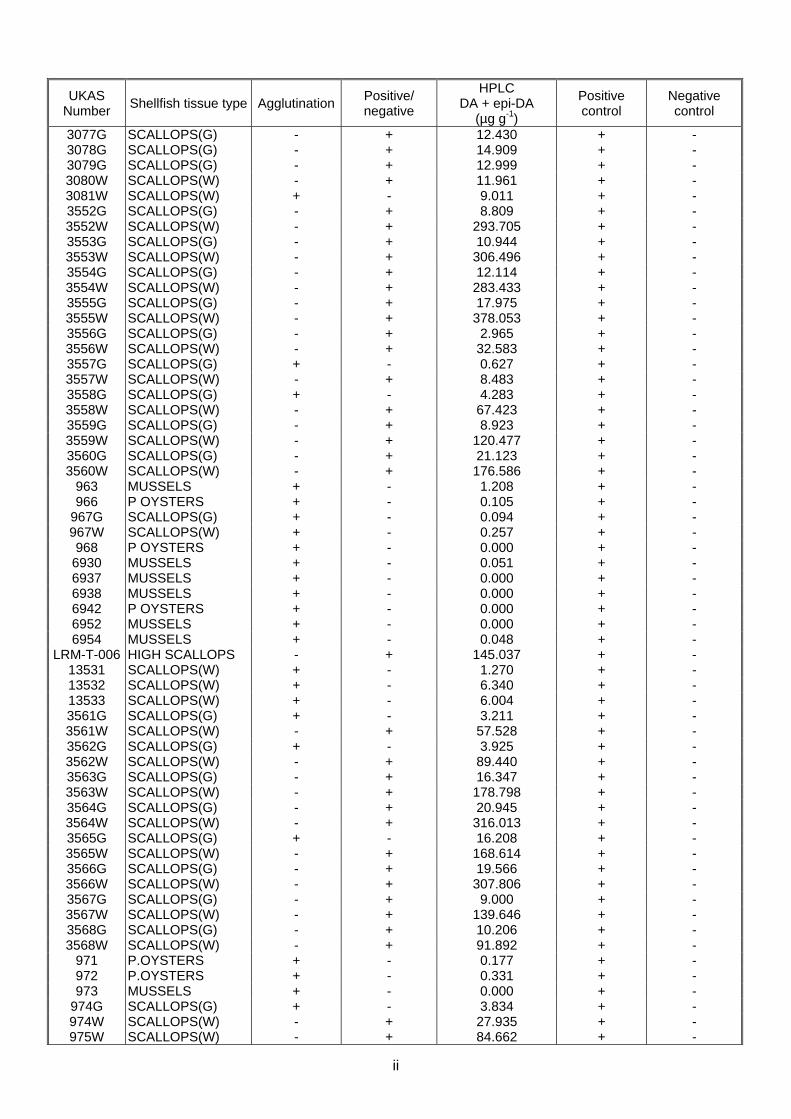
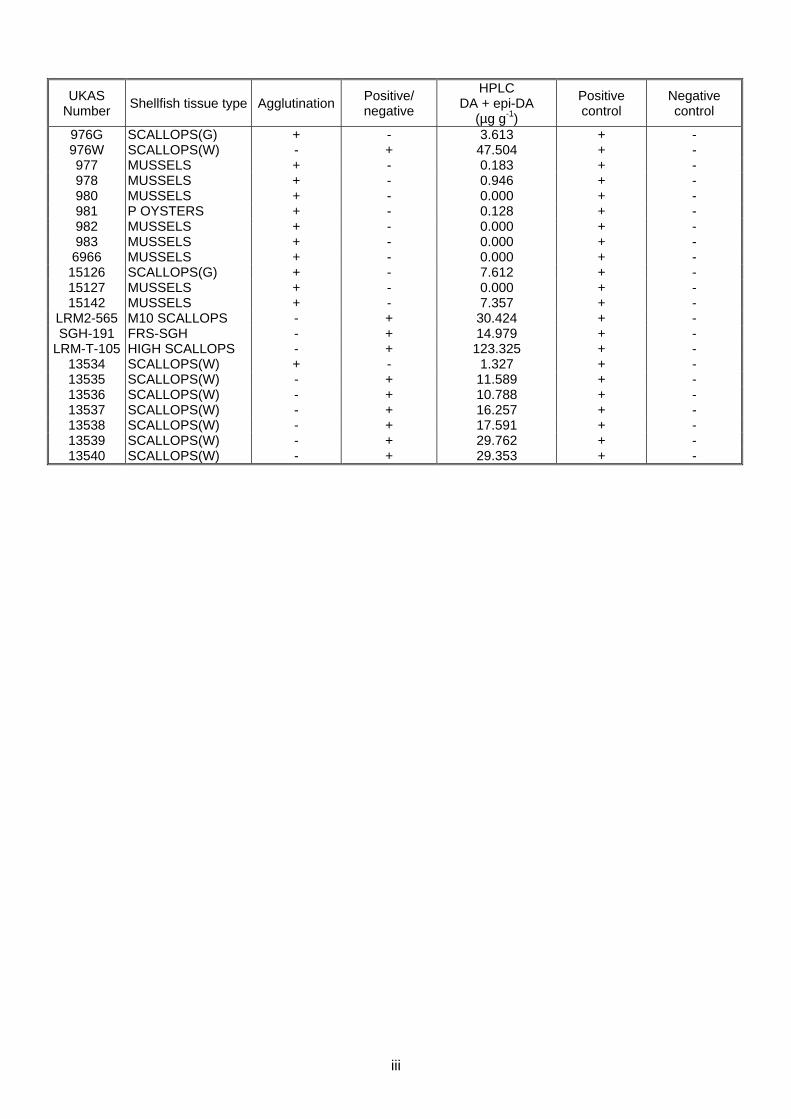
*KG, king scallop gonad (Pecten maximus); KA, king scallop adductor muscle; KW, whole king scallop; M, mussel (Mytilus edulis); PO, pacific oyster (Crassostrea gigas); Q, queen scallop (Aquipecten opercularis) **As determined by HPLC; HPLC determinations = µg DA plus epi-DA g-1 shellfish flesh 6.2 Assessment of the ASP Toxin Agglutination Assay 6.2.1 Analysis of shellfish extracts Shellfish samples (n=134), of known ASP toxin concentration as determined by HPLC, from a variety of species were analysed using the agglutination assay. Good agreement (100 %) was shown in samples containing DA plus epi-DA above the regulatory limit, with all samples containing ASP toxins over 20 µg g-1 shellfish flesh giving a positive result (Table 7). No false positive results were recorded; all samples not contaminated with ASP toxins as determined by HPLC gave a negative result using the agglutination assay. All samples at the LOQ of the HPLC also gave a negative result. In shellfish extracts containing between 6 and less than 20 µg g-1 the agglutination assay determined the presence of toxin in 54 % of samples (Table 7). Looking at these samples in more detail, in samples containing between 10 and 20 µg g-1, 83% of samples were recorded as positive, while in samples containing between 6 and 10 µg g-1 23% of samples were positive by the agglutination assay (Table 8).
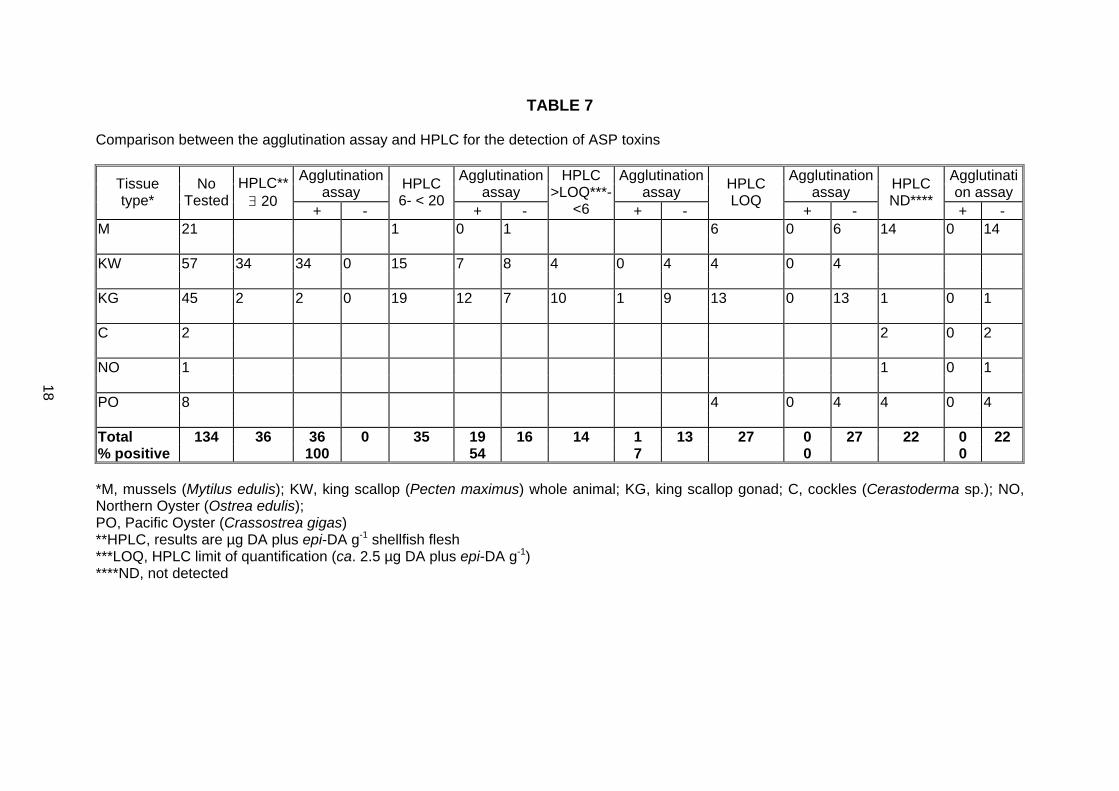
TABLE 7 Comparison between the agglutination assay and HPLC for the detection of ASP toxins
Agglutination assay
Agglutination assay
Agglutination assay
Agglutination assay
Agglutination assay Tissue
type* No
TestedHPLC** ∃ 20
+ -
HPLC 6- < 20
+ -
HPLC >LOQ***-
<6 + -
HPLC LOQ
+ -
HPLC ND****
+ - M 21 1 0 1 6 0 6 14 0 14 KW 57 34 34 0 15 7 8 4 0 4 4 0 4 KG 45 2 2 0 19 12 7 10 1 9 13 0 13 1 0 1 C 2 2 0 2 NO 1 1 0 1 PO 8 4 0 4 4 0 4 Total 134 36 36 0 35 19 16 14 1 13 27 0 27 22 0 22 % positive 100 54 7 0 0 *M, mussels (Mytilus edulis); KW, king scallop (Pecten maximus) whole animal; KG, king scallop gonad; C, cockles (Cerastoderma sp.); NO, Northern Oyster (Ostrea edulis); PO, Pacific Oyster (Crassostrea gigas) **HPLC, results are µg DA plus epi-DA g-1 shellfish flesh ***LOQ, HPLC limit of quantification (ca. 2.5 µg DA plus epi-DA g-1) ****ND, not detected
18
Assessment of Immunoassays
19
TABLE 8 Comparison between the agglutination assay and HPLC for the detection of ASP toxins in the range 6 - < 20 µg g-1 shellfish flesh
Agglutination assay Agglutination assay Tissue type*
No Tested
HPLC** 6 - 10
+ -
HPLC 10 - <20
+ - M 1 1 0 1
KW 15 8 1 7 7 6 1
KG 19 8 3 5 11 9 2
Total 35 17 4 13 18 15 3 % positive 23 83 *M, mussels (Mytilus edulis); KW, king scallop (Pecten maximus) whole animal; KG, king scallop gonad **HPLC, results are µg DA plus epi-DA g-1 shellfish flesh
Assessment of Immunoassays
20
7. DISCUSSION AND CONCLUSIONS 7.1 Assessment of cELISA for the Detection of ASP Toxins in Monitoring In order for the cELISA to be effective as a rapid screen in the ASP toxin monitoring programme it is necessary that a single simple extraction procedure can be used. Ideally the extraction should use low toxicity solvents and have minimal clean-up. Preferably this extraction can be retained for further processing and analysis if the sample is deemed positive and requires further confirmatory analysis. Prior to this study it had been reported that an aqueous methanol extract, with appropriate dilution to avoid shellfish matrix effects, is sufficient to allow direct application of samples to the cELISA (Garthwaite et al., 2001). During the current monitoring programme shellfish are extracted into aqueous methanol (50:50 (v/v methanol:water), and are further processed by SAX clean-up and elution in citric acid buffer (0.5 M, pH 3.2), prior to HPLC analysis for ASP toxins. Results from this trial demonstrate that a simple extraction in aqueous methanol without the requirement for further sample preparation will be suitable to detect ASP toxins by the cELISA (Tables 2 and 3). Therefore in mass screening, which requires rapidity, the cELISA seems to be more advantageous than the HPLC method. Of note is that shellfish extracts that have undergone SAX clean-up and elution in citric acid buffer can not be reliably used by the cELISA. Significant differences in the determination of DA by the cELISA using aqueous methanol extracts and citric acid buffer extracts have previously been observed (M Mackenzie, pers. comm.) and results obtained by cELISA in this study, using citric acid buffer extractions, did not correlate with data obtained by HPLC (data not shown). Inter-plate variation for the cELISA was determined using four dilutions to cover the linear range of the standard curve with comparisons made to HPLC analysis. Although a higher source of variation was determined in the reproducibility of samples over three different cELISA plates than for triplicate HPLC analysis, this was not shown to be significant emphasising that comparable results would be obtained when using different cELISA plates (Tables 2 and 3). DA concentrations obtained by cELISA in this inter-plate study were higher than those for HPLC with the slope for the correlation plot being 1.1 (Fig. 5A). Smith and Kitts (1995) previously assayed shellfish flesh using an ELISA. Their results correlated well with results obtained by HPLC, but were approximately 9% higher. It was considered that perhaps their ELISA recognised the presence of DA isomers not determined by HPLC. More recently, Kawatsu et al. (1999) using an indirect competitive enzyme immunoassay reported that recoveries of DA from extracts of shellfish were satisfactory, but that slightly more DA was recovered than was originally added to the shellfish extracts. Non-specific interactions between natural substances commonly present in the extracts and the DA antibody or the solid phase antigen were surmised in their case, as the antibody they used showed no significant cross-reactivity with the isomers of DA. In this study, when 94 shellfish samples were simultaneously analysed using cELISA and HPLC, and results from the two techniques compared, the slope of the linear correlation curve for cELISA vs DA by HPLC was approximately 1.0, while that for cELISA vs the sum of DA plus its isomers by HPLC was ca. 0.8 (Figs 6 and 7). In contrast to the investigation on inter-plate variability (Table 2), this indicates that these isomers may not be detected as well as DA by the cELISA. In two samples, both obtained from king scallops (see Appendix 1), the cELISA gave a much lower value for DA than expected from the HPLC data (Fig. 6B). Unfortunately there was not enough sample extract to investigate these anomalous results further. Until recently, nine isomers of DA had been chemically identified (see Fig. 1B). A further novel isomer, produced by Pseudo-nitzchia australis, was detected in mid-2001 (Holland et al., 2002). However, the characterisation and toxicity of this isomer has not yet been determined. Isodomoic acids, iso-DA A, B, C, G and H have never been detected in
Assessment of Immunoassays
21
shellfish and although epi-DA and iso-DA D, E and F have been found to commonly occur, the ratios of these compounds against DA are very low (Walter et al., 1994). In contaminated king scallops harvested from Scottish waters, DA is reported to be the predominant compound; generally greater than 90% (Fryer et al., 2002). Therefore although the cELISA may have low and or no cross-reactivity with some of the isomers of DA, results suggest the cELISA would be a suitable technique for protection against ASP. During this study, the cELISA was also used semi-quantitatively (Table 5 and 6) with shellfish extracts applied to the cELISA at only one dilution (either 1/6400 or 1/800). Using fewer dilutions speeds up the time taken for analysis. All samples determined by HPLC to contain toxin over the current regulatory limit (20 µg g-1 shellfish flesh; Council Directive 97/61/EC) and the proposed trigger level for king scallops (4.6 µg g-1 shellfish flesh; Commision Decision 2002/226/EC) were found to contain DA by the cELISA (Tables 5 and 6). In samples containing less than these regulatory levels the cELISA also showed strong agreement (ca. 94 %) with HPLC providing a rapid screening technique. Using the HPLC method a maximum of 30 samples can be processed in a day. cELISA analysis and data interpretation of this number of samples takes approximately five hours, but as many as 144 samples could be analysed in this time. If the cELISA was introduced into the toxin monitoring programme and confirmation of toxin identity and quantification by HPLC was required it would be necessary to undertake further extract clean-up on the day of analysis. HPLC analyse could then be carried out during the night with results available the next morning. Results from this study indicate that aqueous methanol sample extracts should not be stored prior to analysis as DA concentrations are observed to decrease (Table 4). Previous studies at FRS have also indicated that obtaining satisfactory results for ASP toxins in aqueous methanol extracts is only possible within 24 h of extraction (Smith and Mackintosh, 2002; Stobo and Cowles, 2002). 7.2 Assessment of the Agglutination Assay for the Detection of ASP Toxins The agglutination assay was not developed with the intent of replacing the HPLC as it is incapable of providing quantitative and toxin profile information. During this study, the ASP toxin agglutination assay proved to be effective in detecting DA in aqueous methanol shellfish extracts. In all samples that did not contain toxin or low levels of toxin (< 2.5 µg DA plus epi-DA g-1 shellfish as determined by HPLC) the agglutination assay returned a negative result. While all samples containing over the regulatory limit were positive. These results imply that this easy to use, qualitative test could be used to screen out negative samples in shellfish monitoring programmes and in field conditions, allowing shellfish farmers to be rapidly alerted to the presence of contaminated shellfish. This is in contrast to the MIST AlertTM test for ASP which has been reported to detect low levels of toxin (< 2.5 µg DA g-1) in some shellfish species, particularly king scallops (Mackintosh and Smith, 2002; Smith and Mackintosh, 2002). This suggests that some shellfish tested by the MIST AlertTM test for ASP would give a positive result when levels of DA are below the regulatory limit and would still be marketable. 7.3 Conclusions Routine monitoring of shellfish for ASP toxins currently utilises, with modification, the HPLC method proposed by Quilliam et al. (1995), with UV-DAD. Although this HPLC technique provides high-resolution profiles and accurate information for DA identification, there is a high cost for the instrumentation, it requires skilled operators and has a relatively low daily sample turnover. LC-MS detection is also available at FRS for the analysis of shellfish toxins (ASP, paralytic shellfish poisoning (PSP) and diarrhetic shellfish poisoning (DSP)) but is not currently routinely used in the shellfish-monitoring programme for the detection of ASP
Assessment of Immunoassays
22
toxins. LC-MS is an invaluable tool for the confirmation of the presence of a toxin and its quantitation, but again the technology carries a high price tag. These results suggest that the cELISA and/or the agglutination assay could be employed to screen out samples containing low levels of DA during high throughput monitoring prior to quantification of toxin concentrations by more expensive analytical techniques. In general immunoassays are relatively cheap and quick. They do not require sophisticated and expensive facilities, and can be automated (Wilkinson et al., 1991). They are therefore suited to handling large numbers of samples and permit rapid screening of samples. Current monitoring practice for the detection of ASP toxin in shellfish requires the shipment of samples from the shellfish farm/harvesting area to FRS, adding a significant delay to sample analysis and reporting of the results due to logisitics. By introducing rapid on-site testing (e.g., using an agglutination assay or an automated ELISA), the potential for improved decision making is apparent.
8. ADDITIONAL INFORMATION 8.1 Development of a Direct cELISA for the Detection of ASP Toxins Since this study, further advancements to the cELISA have been made. AgResearch and Biosense Laboratories AS (Bergen, Norway), have reformulated and optimised the indirect cELISA into a direct format and have produced a kit which has been produced to have a greater ease of use and enhanced stability. In principle, the kit should be suitable for the determination of DA in shellfish extracts, and other aqueous solutions, such as seawater or phytoplankton cultures. FRS is currently (in 2003) participating in a validation study led by Biosense Laboratories AS. This collaborative trial includes 13 participants from other institutions with monitoring responsibilities, industry, and academic institutions. The study design follows guidelines recommended by the Association of Analytical Chemists (AOAC) and should yield statistically valid data for method precision. 8.2 Developments with the Agglutination Assay Algene Biotech AS (Oslo, Norway) has obtained proprietary rights to the agglutination toxin test developed by J. Córdova. They are currently developing agglutination antibody based tests for the detection of paralytic shellfish poisoning (PSP) and DSP toxins (Córdova et al., 2001). It is envisaged that Algene Biotech AS will market these tests as rapid field-tests for the industry. Presently, there are only a few suppliers of rapid field tests to detect toxicity in shellfish, however, none of them have a field test for DSP toxins. The Scottish shellfish industry has expressed its needs for easier, faster and cheaper methods for detection of shellfish toxins. The use of an agglutination assay would enable producers to avoid harvesting product unsuitable for consumption and aid stock conservation. Therefore further investigations and field trials into the use of these kits are recommended.
9. ACKNOWLEDGEMENTS The authors thank Drs Ian Garthwaite (Ag Research), José Córdova and Hanne Ramstad (Algene Biotech AS) for extensive advice and provision of the antibodies for the cELISA and agglutination assay and Margaret Mackenzie for helpful advice and comment. This project was funded by SEERAD, ROAME FC0756.
Assessment of Immunoassays
23
10. LITERATURE CITED Arévalo, F.F., Bermúdez de la Puente, M. and Salgado, C. 1998. ASP toxicity in scallops:
Individual variability and tissue distribution. In: Harmful Aglae (Reguera, B., Blanco, J., Fernández, M.L. and Wyatt, T. eds.) Xunta de Galicia andIntergovernmental Oceanographic Commission of UNESCO, pp. 499-502.
Bates, S.S., Garrison, D.L. and Horner, R.A. 1998. Bloom dynamics and physiology of
domoic acid producing Pseudo-nitzschia species. In: Physiological Ecology of Harmful Algal Blooms (Anderson, D.M., Cembella, A.D., Hallegraef, G.M., eds.) Springer-Verlag, Heidelberg, pp. 268-292.
Córdova, J.L., Jamett, A., Aguayo, J., Faure, M.T., Villarroel, O. and Cardenas, L. 2001. An
in vitro assay to detect paralytic shellfish poison. Journal of Shellfish Research, 20, 55-61.
Fryer, R., Smith, E. and Moffat, C. 2002. Domoic acid in the King scallop Pecten maximus:
A summary of a report prepared for the EU ASP Working Group. UK National Reference Laboratory for Marine Biotoxins Biotoxins (January 2001). http://foodstandards.gov.uk/multimedia/pdfs/Domoicacidinkingscallop.pdf
Garthwaite, I. 2000. Keeping shellfish safe to eat: a brief review of shellfish toxins, and
methods for their detection. Trends in Food Science and Technology, 11, 235-244. Garthwaite, I., Ross, K.M., Miles, C.O., Hansen, R.P., Foster, D., Wilkins, A.L. and Towers,
N.R. 1998. Polyclonal antibodies to domoic acid, and their use in immunoassays for domoic acid in sea water and shellfish. Natural Toxins, 6, 93-104.
Garthwaite, I., Ross, K.M., Miles, C.O., Briggs, L.R. and Towers, N.R. 2001. Integrated
enzyme-linked immunosorbent assay screening system for Amnesic, Neurotoxic, Diarrhetic, and Paralytic shellfish poisoning toxins found in New Zealand. Journal of AOAC International, 84, 1643-1648.
Gallacher, S., Howard, G., Hess, P., MacDonald, E., Kelly, M.C., Bates, L.A., Brown, N.,
MacKenzie, M., Gillibrand, P. and Turrell, W.R. 2001. The occurrence of amnesic shellfish poisons in shellfish from Scottish waters. In: Harmful algal blooms 2000 (Hallegraeff, G.M., Blackburn S.I., Bolch C.J., Lewis, R.J., eds.) Intergovernmental Oceanographic Commission of UNESCO, pp. 30-33.
Hess, P., Gallacher, S., Bates, L.A. and Brown, N. 2001. Determination and confirmation of
the amnesic shellfish poisoning toxin, domoic acid, in shellfish from Scotland by liquid chromatography and mass spectrometry. Journal of International AOAC, 84, 1657-1667.
Holland, P.T., McNabb, P., Rhodes, L.L., Selwood, A.I. and Neil, T. in press. Amnesic
shellfish poisoning toxins in New Zealand shellfish - Detection of a novel domoic acid isomer using a newly validated LC-MS/MS method. In: Proceedings of the 4th Molluscan Shellfish Safety Conference, 2002, Santiago, Spain
Iverson, F. and Truelove, J.F. 1994. Toxicology and seafood toxins: domoic acid. Natural
Toxins, 2, 334-339. Kawatsu, K., Hamano, Y. and Noguchi, T. 1999. Production and characterisation of a
monoclonal antibody against domoic acid and it’s application to enzyme immunoassay. Toxicon., 37, 1579-1589.
Assessment of Immunoassays
24
Mackintosh, F.H. and Smith, E.A. 2002. Evaluation of MIST AlertTM for rapid test kits for the detection of paralytic and amnesic shellfish poisoning toxins in shellfish. Journal of Shellfish Research, 21, 455-460.
Quilliam, M.A., Xie, M. and Hardstaff, W.R. 1995. Rapid extraction and cleanup for liquid
chromatographic determination of domoic acid in unsalted seafood. Journal of AOAC International, 78, 543-554.
Quilliam, M.A., Sim, P.G., McCulloch, A.W. and McInnes, A.G. 1989. High performance
liquid chromatography of domoic acid, a marine neurotoxin, with application to shellfish and plankton. International Journal of Environmental Analytical Chemistry, 36, 139-154.
Smith, E.A. and Mackintosh, F.H. 2002. Assessment and validation of a commercial rapid
qualitative assay (MIST AlertTM) for detection of amnesic and paralytic shellfish poisons in the UK monitoring programme and as an end-product test. FRS Contract Report No 09/02.
Smith, D.S. and Kitts, D.D. 1995. Enzyme immunoassay for the determination of domoic
acid in mussel extracts. Journal of Agriculture and Food Chemistry, 43, 367-371. Stobo, L. and Cowles, J. 2002. Development, evaluation and assessment of methods for
the determination of ASP, DSP and PSP using LC-MS and LC-MS-MS. FRS Contract Report (in press).
Todd, E.C.D. 1993. Domoic acid and amnesic shellfish poisoning – A review. Journal of
Food Protection, 56, 69-83. Van Dolah, F.M., Leighfield, T.A., Haynes, B.L., Hampson, D.R. and Ramsdell, J.S. 1997.
A microplate receptor assay for the amnesic shellfish poisoning toxin, domoic acid, utilising a cloned glutamate receptor. Analytical Biochemistry, 245, 102-105.
Walter, J.A., Falk, M. and Wright, J.L.C. 1994. Chemistry of the shellfish toxin domoic acid:
characterisation of related compounds. Canadian Journal of Chemistry, 72, 430-436 Wilkinson, A.P., Ward, C.M. and Morgan, M.R.A. 1991. Immunological analysis of
mycotoxins In: Plant Toxin Analysis (Linskens, H.F., Jackson J.F., eds) Springer-Verlag, Berlin pp. 185-225.
Wright, J.L.C. and Quilliam, M.A. 1995. Methods for domoic acid, the amnesic shellfish
poisons. In: Manual on Harmful Marine Microalgae (Hallegraef, G.M., Anderson, D.M., Cembella, A.D., eds.) Intergovernmental Oceanographic Commission, Manuals and Guides 33. UNESCO, France, pp. 114-116.
i
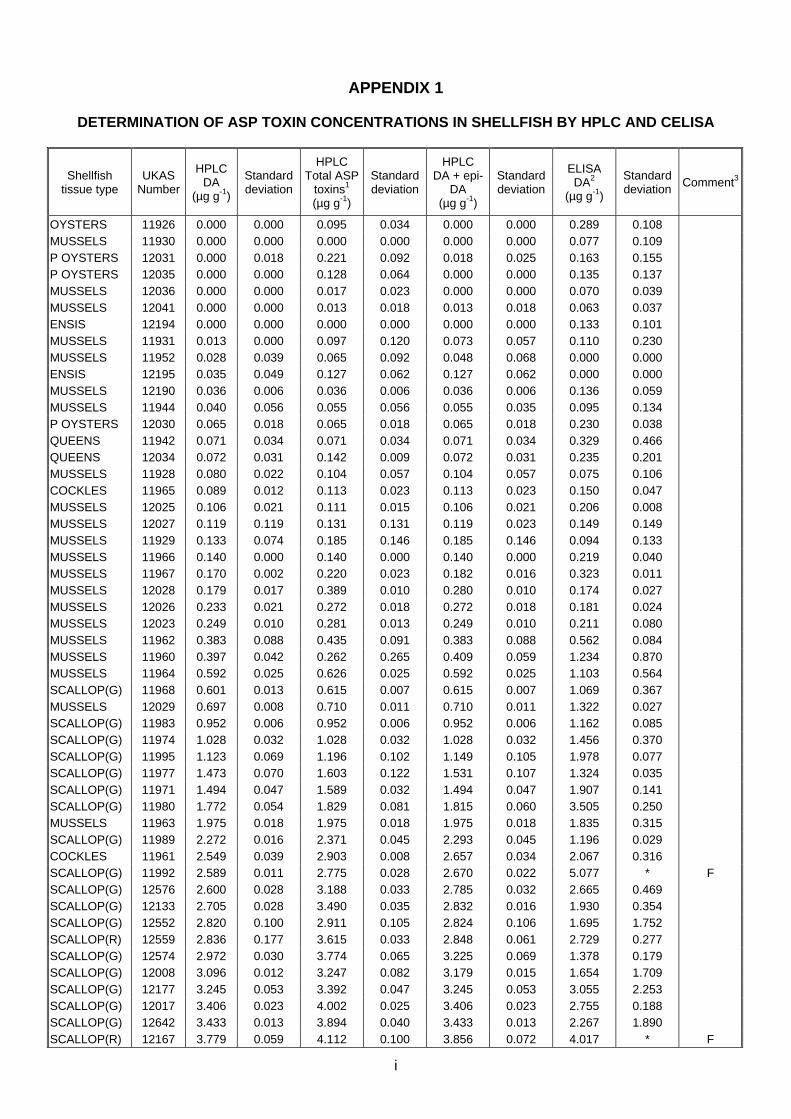
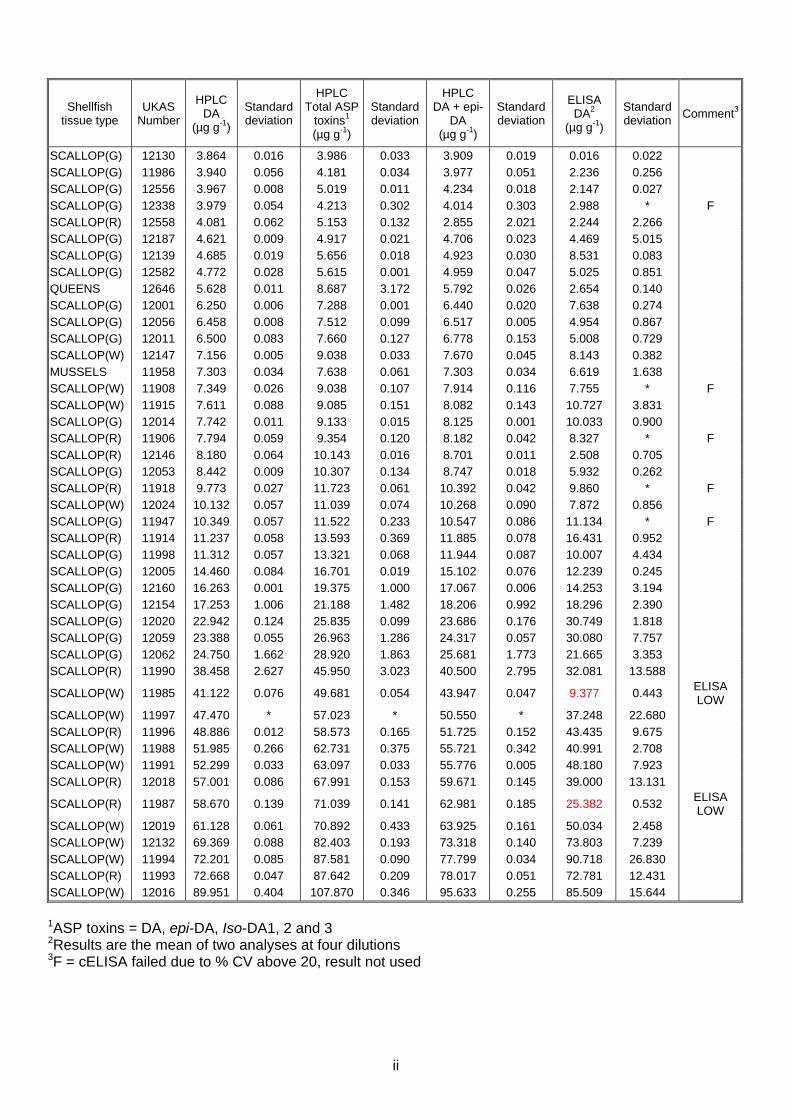
APPENDIX 1
DETERMINATION OF ASP TOXIN CONCENTRATIONS IN SHELLFISH BY HPLC AND CELISA
Shellfish tissue type
UKAS Number
HPLC DA
(µg g-1)
Standard deviation
HPLC Total ASP
toxins1 (µg g-1)
Standard deviation
HPLC DA + epi-
DA (µg g-1)
Standard deviation
ELISA DA2
(µg g-1)
Standard deviation Comment3
OYSTERS 11926 0.000 0.000 0.095 0.034 0.000 0.000 0.289 0.108 MUSSELS 11930 0.000 0.000 0.000 0.000 0.000 0.000 0.077 0.109 P OYSTERS 12031 0.000 0.018 0.221 0.092 0.018 0.025 0.163 0.155 P OYSTERS 12035 0.000 0.000 0.128 0.064 0.000 0.000 0.135 0.137 MUSSELS 12036 0.000 0.000 0.017 0.023 0.000 0.000 0.070 0.039 MUSSELS 12041 0.000 0.000 0.013 0.018 0.013 0.018 0.063 0.037 ENSIS 12194 0.000 0.000 0.000 0.000 0.000 0.000 0.133 0.101 MUSSELS 11931 0.013 0.000 0.097 0.120 0.073 0.057 0.110 0.230 MUSSELS 11952 0.028 0.039 0.065 0.092 0.048 0.068 0.000 0.000 ENSIS 12195 0.035 0.049 0.127 0.062 0.127 0.062 0.000 0.000 MUSSELS 12190 0.036 0.006 0.036 0.006 0.036 0.006 0.136 0.059 MUSSELS 11944 0.040 0.056 0.055 0.056 0.055 0.035 0.095 0.134 P OYSTERS 12030 0.065 0.018 0.065 0.018 0.065 0.018 0.230 0.038 QUEENS 11942 0.071 0.034 0.071 0.034 0.071 0.034 0.329 0.466 QUEENS 12034 0.072 0.031 0.142 0.009 0.072 0.031 0.235 0.201 MUSSELS 11928 0.080 0.022 0.104 0.057 0.104 0.057 0.075 0.106 COCKLES 11965 0.089 0.012 0.113 0.023 0.113 0.023 0.150 0.047 MUSSELS 12025 0.106 0.021 0.111 0.015 0.106 0.021 0.206 0.008 MUSSELS 12027 0.119 0.119 0.131 0.131 0.119 0.023 0.149 0.149 MUSSELS 11929 0.133 0.074 0.185 0.146 0.185 0.146 0.094 0.133 MUSSELS 11966 0.140 0.000 0.140 0.000 0.140 0.000 0.219 0.040 MUSSELS 11967 0.170 0.002 0.220 0.023 0.182 0.016 0.323 0.011 MUSSELS 12028 0.179 0.017 0.389 0.010 0.280 0.010 0.174 0.027 MUSSELS 12026 0.233 0.021 0.272 0.018 0.272 0.018 0.181 0.024 MUSSELS 12023 0.249 0.010 0.281 0.013 0.249 0.010 0.211 0.080 MUSSELS 11962 0.383 0.088 0.435 0.091 0.383 0.088 0.562 0.084 MUSSELS 11960 0.397 0.042 0.262 0.265 0.409 0.059 1.234 0.870 MUSSELS 11964 0.592 0.025 0.626 0.025 0.592 0.025 1.103 0.564 SCALLOP(G) 11968 0.601 0.013 0.615 0.007 0.615 0.007 1.069 0.367 MUSSELS 12029 0.697 0.008 0.710 0.011 0.710 0.011 1.322 0.027 SCALLOP(G) 11983 0.952 0.006 0.952 0.006 0.952 0.006 1.162 0.085 SCALLOP(G) 11974 1.028 0.032 1.028 0.032 1.028 0.032 1.456 0.370 SCALLOP(G) 11995 1.123 0.069 1.196 0.102 1.149 0.105 1.978 0.077 SCALLOP(G) 11977 1.473 0.070 1.603 0.122 1.531 0.107 1.324 0.035 SCALLOP(G) 11971 1.494 0.047 1.589 0.032 1.494 0.047 1.907 0.141 SCALLOP(G) 11980 1.772 0.054 1.829 0.081 1.815 0.060 3.505 0.250 MUSSELS 11963 1.975 0.018 1.975 0.018 1.975 0.018 1.835 0.315 SCALLOP(G) 11989 2.272 0.016 2.371 0.045 2.293 0.045 1.196 0.029 COCKLES 11961 2.549 0.039 2.903 0.008 2.657 0.034 2.067 0.316 SCALLOP(G) 11992 2.589 0.011 2.775 0.028 2.670 0.022 5.077 * F SCALLOP(G) 12576 2.600 0.028 3.188 0.033 2.785 0.032 2.665 0.469 SCALLOP(G) 12133 2.705 0.028 3.490 0.035 2.832 0.016 1.930 0.354 SCALLOP(G) 12552 2.820 0.100 2.911 0.105 2.824 0.106 1.695 1.752 SCALLOP(R) 12559 2.836 0.177 3.615 0.033 2.848 0.061 2.729 0.277 SCALLOP(G) 12574 2.972 0.030 3.774 0.065 3.225 0.069 1.378 0.179 SCALLOP(G) 12008 3.096 0.012 3.247 0.082 3.179 0.015 1.654 1.709 SCALLOP(G) 12177 3.245 0.053 3.392 0.047 3.245 0.053 3.055 2.253 SCALLOP(G) 12017 3.406 0.023 4.002 0.025 3.406 0.023 2.755 0.188 SCALLOP(G) 12642 3.433 0.013 3.894 0.040 3.433 0.013 2.267 1.890 SCALLOP(R) 12167 3.779 0.059 4.112 0.100 3.856 0.072 4.017 * F
ii
Shellfish tissue type
UKAS Number
HPLC DA
(µg g-1)
Standard deviation
HPLC Total ASP
toxins1 (µg g-1)
Standard deviation
HPLC DA + epi-
DA (µg g-1)
Standard deviation
ELISA DA2
(µg g-1)
Standard deviation Comment3
SCALLOP(G) 12130 3.864 0.016 3.986 0.033 3.909 0.019 0.016 0.022 SCALLOP(G) 11986 3.940 0.056 4.181 0.034 3.977 0.051 2.236 0.256 SCALLOP(G) 12556 3.967 0.008 5.019 0.011 4.234 0.018 2.147 0.027 SCALLOP(G) 12338 3.979 0.054 4.213 0.302 4.014 0.303 2.988 * F SCALLOP(R) 12558 4.081 0.062 5.153 0.132 2.855 2.021 2.244 2.266 SCALLOP(G) 12187 4.621 0.009 4.917 0.021 4.706 0.023 4.469 5.015 SCALLOP(G) 12139 4.685 0.019 5.656 0.018 4.923 0.030 8.531 0.083 SCALLOP(G) 12582 4.772 0.028 5.615 0.001 4.959 0.047 5.025 0.851 QUEENS 12646 5.628 0.011 8.687 3.172 5.792 0.026 2.654 0.140 SCALLOP(G) 12001 6.250 0.006 7.288 0.001 6.440 0.020 7.638 0.274 SCALLOP(G) 12056 6.458 0.008 7.512 0.099 6.517 0.005 4.954 0.867 SCALLOP(G) 12011 6.500 0.083 7.660 0.127 6.778 0.153 5.008 0.729 SCALLOP(W) 12147 7.156 0.005 9.038 0.033 7.670 0.045 8.143 0.382 MUSSELS 11958 7.303 0.034 7.638 0.061 7.303 0.034 6.619 1.638 SCALLOP(W) 11908 7.349 0.026 9.038 0.107 7.914 0.116 7.755 * F SCALLOP(W) 11915 7.611 0.088 9.085 0.151 8.082 0.143 10.727 3.831 SCALLOP(G) 12014 7.742 0.011 9.133 0.015 8.125 0.001 10.033 0.900 SCALLOP(R) 11906 7.794 0.059 9.354 0.120 8.182 0.042 8.327 * F SCALLOP(R) 12146 8.180 0.064 10.143 0.016 8.701 0.011 2.508 0.705 SCALLOP(G) 12053 8.442 0.009 10.307 0.134 8.747 0.018 5.932 0.262 SCALLOP(R) 11918 9.773 0.027 11.723 0.061 10.392 0.042 9.860 * F SCALLOP(W) 12024 10.132 0.057 11.039 0.074 10.268 0.090 7.872 0.856 SCALLOP(G) 11947 10.349 0.057 11.522 0.233 10.547 0.086 11.134 * F SCALLOP(R) 11914 11.237 0.058 13.593 0.369 11.885 0.078 16.431 0.952 SCALLOP(G) 11998 11.312 0.057 13.321 0.068 11.944 0.087 10.007 4.434 SCALLOP(G) 12005 14.460 0.084 16.701 0.019 15.102 0.076 12.239 0.245 SCALLOP(G) 12160 16.263 0.001 19.375 1.000 17.067 0.006 14.253 3.194 SCALLOP(G) 12154 17.253 1.006 21.188 1.482 18.206 0.992 18.296 2.390 SCALLOP(G) 12020 22.942 0.124 25.835 0.099 23.686 0.176 30.749 1.818 SCALLOP(G) 12059 23.388 0.055 26.963 1.286 24.317 0.057 30.080 7.757 SCALLOP(G) 12062 24.750 1.662 28.920 1.863 25.681 1.773 21.665 3.353 SCALLOP(R) 11990 38.458 2.627 45.950 3.023 40.500 2.795 32.081 13.588
SCALLOP(W) 11985 41.122 0.076 49.681 0.054 43.947 0.047 9.377 0.443 ELISA LOW
SCALLOP(W) 11997 47.470 * 57.023 * 50.550 * 37.248 22.680 SCALLOP(R) 11996 48.886 0.012 58.573 0.165 51.725 0.152 43.435 9.675 SCALLOP(W) 11988 51.985 0.266 62.731 0.375 55.721 0.342 40.991 2.708 SCALLOP(W) 11991 52.299 0.033 63.097 0.033 55.776 0.005 48.180 7.923 SCALLOP(R) 12018 57.001 0.086 67.991 0.153 59.671 0.145 39.000 13.131
SCALLOP(R) 11987 58.670 0.139 71.039 0.141 62.981 0.185 25.382 0.532 ELISA LOW
SCALLOP(W) 12019 61.128 0.061 70.892 0.433 63.925 0.161 50.034 2.458 SCALLOP(W) 12132 69.369 0.088 82.403 0.193 73.318 0.140 73.803 7.239 SCALLOP(W) 11994 72.201 0.085 87.581 0.090 77.799 0.034 90.718 26.830 SCALLOP(R) 11993 72.668 0.047 87.642 0.209 78.017 0.051 72.781 12.431 SCALLOP(W) 12016 89.951 0.404 107.870 0.346 95.633 0.255 85.509 15.644
1ASP toxins = DA, epi-DA, Iso-DA1, 2 and 3
2Results are the mean of two analyses at four dilutions 3F = cELISA failed due to % CV above 20, result not used
i
APPENDIX 2
Detection of ASP toxins in shellfish by the ASP toxin agglutination assay
UKAS Number Shellfish tissue type Agglutination Positive/
negative
HPLC DA + epi-DA
(µg g-1)
Positive control
Negative control
3032W SCALLOPS(W) - + 238.176 + - 3033W SCALLOPS(W) - + 254.677 + - 3034G SCALLOPS(G) + - 7.120 + - 3035W SCALLOPS(W) - + 73.270 + - 246G SCALLOPS(G) + - 0.000 + - 252 P OYSTERS + - 0.000 + - 253 COCKLES + - 0.000 + -
5340 COCKLES + - 0.000 + - 5342 N OYSTERS + - 0.000 + - 5343 MUSSELS + - 0.000 + - 5344 MUSSELS + - 0.000 + - 5345 MUSSELS + - 0.000 + - 5347 MUSSELS + - 0.000 + - 5352 P OYSTERS + - 0.000 + -
2659G SCALLOPS(G) + - 3.244 + - 2660G SCALLOPS(G) + - 3.391 + - 2661G SCALLOPS(G) + - 2.282 + - 2663G SCALLOPS(G) + - 2.474 + - 2665G SCALLOPS(G) + - 3.579 + - 249W SCALLOPS(W) + - 1.849 + - 250G SCALLOPS(G) + - 2.692 + - 249W SCALLOPS(W) + - 3.039 + - 244 MUSSELS + - 0.197 + -
245G SCALLOPS(G) + - 0.128 + - 2658G SCALLOPS(G) + - 10.070 + - 2662G SCALLOPS(G) + - 9.488 + - 2664G SCALLOPS(G) + - 8.665 + - 247G SCALLOPS(G) + - 6.539 + -
2667W SCALLOPS(W) + - 10.997 + - 2668W SCALLOPS(W) + - 7.192 + - 2669W SCALLOPS(W) + - 8.781 + - 2675W SCALLOPS(W) + - 8.991 + - 2676W SCALLOPS(W) - + 11.694 + - 2677W SCALLOPS(W) + - 7.727 + - 2658W SCALLOPS(W) - + 129.880 + - 2659W SCALLOPS(W) - + 68.652 + - 2660W SCALLOPS(W) - + 52.711 + - 2661W SCALLOPS(W) - + 59.821 + - 2662W SCALLOPS(W) - + 63.234 + - 2663W SCALLOPS(W) - + 89.792 + - 2664W SCALLOPS(W) - + 124.534 + - 2665W SCALLOPS(W) - + 68.834 + - 250W SCALLOPS(W) - + 45.745 + - 247W SCALLOPS(W) - + 181.002 + - 497 MUSSELS + - 0.000 + -
3080G SCALLOPS(G) + - 1.617 + - 3081G SCALLOPS(G) + - 1.162 + - 3082G SCALLOPS(G) + - 0.480 + - 3082W SCALLOPS(W) + - 2.780 + - 3083G SCALLOPS(G) + - 0.789 + - 3083W SCALLOPS(W) + - 5.614 + - 3084G SCALLOPS(G) + - 0.814 + - 3085G SCALLOPS(G) + - 1.530 + - 3085W SCALLOPS(W) + - 5.422 + - 3086G SCALLOPS(G) + - 0.833 + - 3087G SCALLOPS(G) + - 1.825 + -
ii
UKAS Number Shellfish tissue type Agglutination Positive/
negative
HPLC DA + epi-DA
(µg g-1)
Positive control
Negative control
3077G SCALLOPS(G) - + 12.430 + - 3078G SCALLOPS(G) - + 14.909 + - 3079G SCALLOPS(G) - + 12.999 + - 3080W SCALLOPS(W) - + 11.961 + - 3081W SCALLOPS(W) + - 9.011 + - 3552G SCALLOPS(G) - + 8.809 + - 3552W SCALLOPS(W) - + 293.705 + - 3553G SCALLOPS(G) - + 10.944 + - 3553W SCALLOPS(W) - + 306.496 + - 3554G SCALLOPS(G) - + 12.114 + - 3554W SCALLOPS(W) - + 283.433 + - 3555G SCALLOPS(G) - + 17.975 + - 3555W SCALLOPS(W) - + 378.053 + - 3556G SCALLOPS(G) - + 2.965 + - 3556W SCALLOPS(W) - + 32.583 + - 3557G SCALLOPS(G) + - 0.627 + - 3557W SCALLOPS(W) - + 8.483 + - 3558G SCALLOPS(G) + - 4.283 + - 3558W SCALLOPS(W) - + 67.423 + - 3559G SCALLOPS(G) - + 8.923 + - 3559W SCALLOPS(W) - + 120.477 + - 3560G SCALLOPS(G) - + 21.123 + - 3560W SCALLOPS(W) - + 176.586 + -
963 MUSSELS + - 1.208 + - 966 P OYSTERS + - 0.105 + -
967G SCALLOPS(G) + - 0.094 + - 967W SCALLOPS(W) + - 0.257 + - 968 P OYSTERS + - 0.000 + -
6930 MUSSELS + - 0.051 + - 6937 MUSSELS + - 0.000 + - 6938 MUSSELS + - 0.000 + - 6942 P OYSTERS + - 0.000 + - 6952 MUSSELS + - 0.000 + - 6954 MUSSELS + - 0.048 + -
LRM-T-006 HIGH SCALLOPS - + 145.037 + - 13531 SCALLOPS(W) + - 1.270 + - 13532 SCALLOPS(W) + - 6.340 + - 13533 SCALLOPS(W) + - 6.004 + - 3561G SCALLOPS(G) + - 3.211 + - 3561W SCALLOPS(W) - + 57.528 + - 3562G SCALLOPS(G) + - 3.925 + - 3562W SCALLOPS(W) - + 89.440 + - 3563G SCALLOPS(G) - + 16.347 + - 3563W SCALLOPS(W) - + 178.798 + - 3564G SCALLOPS(G) - + 20.945 + - 3564W SCALLOPS(W) - + 316.013 + - 3565G SCALLOPS(G) + - 16.208 + - 3565W SCALLOPS(W) - + 168.614 + - 3566G SCALLOPS(G) - + 19.566 + - 3566W SCALLOPS(W) - + 307.806 + - 3567G SCALLOPS(G) - + 9.000 + - 3567W SCALLOPS(W) - + 139.646 + - 3568G SCALLOPS(G) - + 10.206 + - 3568W SCALLOPS(W) - + 91.892 + -
971 P.OYSTERS + - 0.177 + - 972 P.OYSTERS + - 0.331 + - 973 MUSSELS + - 0.000 + -
974G SCALLOPS(G) + - 3.834 + - 974W SCALLOPS(W) - + 27.935 + - 975W SCALLOPS(W) - + 84.662 + -
iii
UKAS Number Shellfish tissue type Agglutination Positive/
negative
HPLC DA + epi-DA
(µg g-1)
Positive control
Negative control
976G SCALLOPS(G) + - 3.613 + - 976W SCALLOPS(W) - + 47.504 + - 977 MUSSELS + - 0.183 + - 978 MUSSELS + - 0.946 + - 980 MUSSELS + - 0.000 + - 981 P OYSTERS + - 0.128 + - 982 MUSSELS + - 0.000 + - 983 MUSSELS + - 0.000 + -
6966 MUSSELS + - 0.000 + - 15126 SCALLOPS(G) + - 7.612 + - 15127 MUSSELS + - 0.000 + - 15142 MUSSELS + - 7.357 + -
LRM2-565 M10 SCALLOPS - + 30.424 + - SGH-191 FRS-SGH - + 14.979 + -
LRM-T-105 HIGH SCALLOPS - + 123.325 + - 13534 SCALLOPS(W) + - 1.327 + - 13535 SCALLOPS(W) - + 11.589 + - 13536 SCALLOPS(W) - + 10.788 + - 13537 SCALLOPS(W) - + 16.257 + - 13538 SCALLOPS(W) - + 17.591 + - 13539 SCALLOPS(W) - + 29.762 + - 13540 SCALLOPS(W) - + 29.353 + -