assessment matters! issue 10
TRANSCRIPT
Assessment Matters!
10ParticiPation in Large-ScaLe aSSeSSment StudieS:
What’S in it for me?As is the case in most industrialized countries, students in Canada (as well as some school staff) regularly participate in a number of national and international large-scale assessments. The goal of these studies is to provide reliable information about academic achievement and gain a better understanding of the contextual factors influencing it. They provide policy-makers, administrators, teachers, and researchers with powerful insights into the functioning of education systems and how they might be improved.
The most common large-scale studies are the Pan-Canadian Assessment Program (PCAP), the Programme for International Student Assessment (PISA), the Progress in International Reading Literacy Study (PIRLS), and the Trends in International Mathematics and Science Study (TIMSS). These national and international studies complement, but do not replace, provincial and territorial assessments. Although provincial/territorial assessments may be conducted at various grade levels and across different subject areas, they all have one common goal: to assess student achievement relative to provincial and territorial learning outcomes.
The Pan-Canadian Assessment Program (PCAP)The Pan-Canadian Assessment Program was introduced in 2007. It replaced the School Achievement Indicators Program (SAIP), which was launched by the Council of Ministers of Education, Canada, in 1993.
PCAP is administered every three years. The information gathered in its cyclical tests of student achievement in reading, mathematics, and science provides the provinces and territories with a basis for examining their curriculum and improving their assessment tools relative to the other Canadian jurisdictions. While school programs differ from one part of the country to another, PCAP is based on curriculum areas that are common to them at the Grade 8/Secondary II level. This allows comparisons to be made across jurisdictions of students at a comparable point in their schooling.
PCAP is based on a very large sample. Over 1,500 schools are randomly selected across the country, and in each school at least one intact Grade 8/Secondary II classroom is selected, for a total of over 30,000 students.
To place the PCAP performance-level descriptors in the context of the assessment, five blocks of science items that make up fourteen sample questions from the most recent PCAP assessment were released to the public. Samples were chosen to represent a range of sub-domains and competencies and a variety of item types, as well as each of the four performance levels. Performance level 2 is considered the acceptable or “baseline proficiency” level at which students begin to demonstrate the competencies needed to participate in life situations related to science. For constructed-response items, student responses
Assessment Matters! No. 10, 2016 - CMEC 2
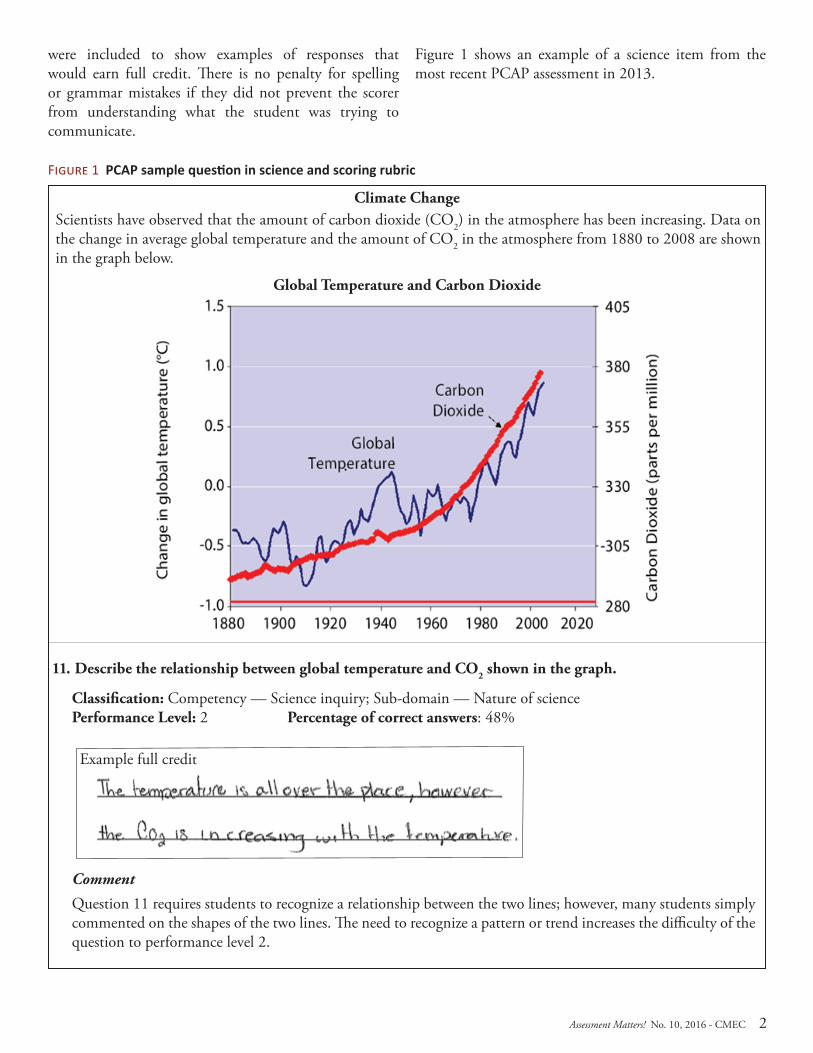
Figure 1 PCAP sample question in science and scoring rubric
Climate Change Scientists have observed that the amount of carbon dioxide (CO2) in the atmosphere has been increasing. Data on the change in average global temperature and the amount of CO2 in the atmosphere from 1880 to 2008 are shown in the graph below.
Global Temperature and Carbon Dioxide
11. Describe the relationship between global temperature and CO2 shown in the graph.
Classification: Competency — Science inquiry; Sub-domain — Nature of sciencePerformance Level: 2 Percentage of correct answers: 48%
Example full credit
Comment
Question 11 requires students to recognize a relationship between the two lines; however, many students simply commented on the shapes of the two lines. The need to recognize a pattern or trend increases the difficulty of the question to performance level 2.
were included to show examples of responses that would earn full credit. There is no penalty for spelling or grammar mistakes if they did not prevent the scorer from understanding what the student was trying to communicate.
Figure 1 shows an example of a science item from the most recent PCAP assessment in 2013.
Assessment Matters! No. 10, 2016 - CMEC 3
The Programme for International Student Assessment (PISA)
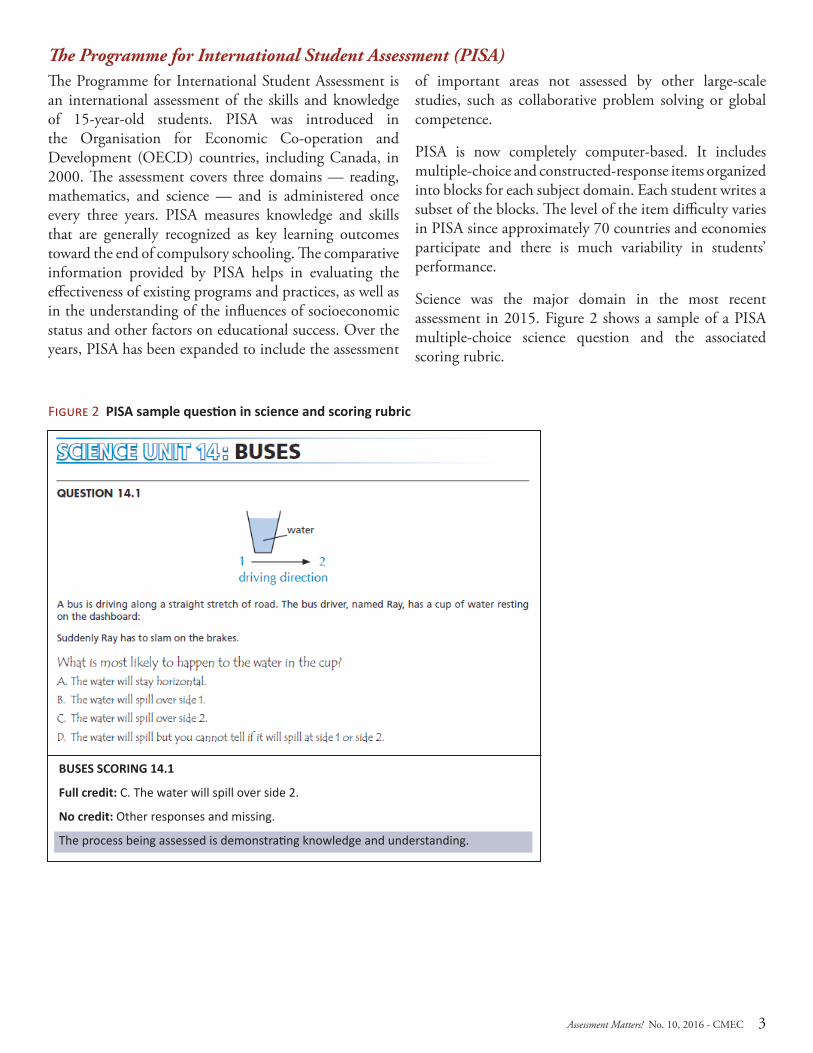
Figure 2 PISA sample question in science and scoring rubric
BUSES SCORING 14.1
Full credit: C. The water will spill over side 2.
No credit: Other responses and missing.
The process being assessed is demonstrating knowledge and understanding.
The Programme for International Student Assessment is an international assessment of the skills and knowledge of 15-year-old students. PISA was introduced in the Organisation for Economic Co-operation and Development (OECD) countries, including Canada, in 2000. The assessment covers three domains — reading, mathematics, and science — and is administered once every three years. PISA measures knowledge and skills that are generally recognized as key learning outcomes toward the end of compulsory schooling. The comparative information provided by PISA helps in evaluating the effectiveness of existing programs and practices, as well as in the understanding of the influences of socioeconomic status and other factors on educational success. Over the years, PISA has been expanded to include the assessment
of important areas not assessed by other large-scale studies, such as collaborative problem solving or global competence.
PISA is now completely computer-based. It includes multiple-choice and constructed-response items organized into blocks for each subject domain. Each student writes a subset of the blocks. The level of the item difficulty varies in PISA since approximately 70 countries and economies participate and there is much variability in students’ performance.
Science was the major domain in the most recent assessment in 2015. Figure 2 shows a sample of a PISA multiple-choice science question and the associated scoring rubric.
Assessment Matters! No. 10, 2016 - CMEC 4
The Trends in International Mathematics and Science Study (TIMSS)The Trends in International Mathematics and Science Study is an international assessment also conducted under the auspices of the IEA. It measures mathematics and science knowledge of students in Grade 4 and Grade 8/Secondary II. TIMSS was first administered in 1995 and has since been carried out every four years.
Approximately 60 countries participate in TIMSS at both grade levels. This assessment uses primarily multiple-choice and constructed-response items. Half of the students answer questions in mathematics first and then science, and the other half answers the science questions first and the mathematics questions second. The assessment includes items of different formats and levels of difficulties, organized in blocks. To illustrate the types of items administered to students in previous
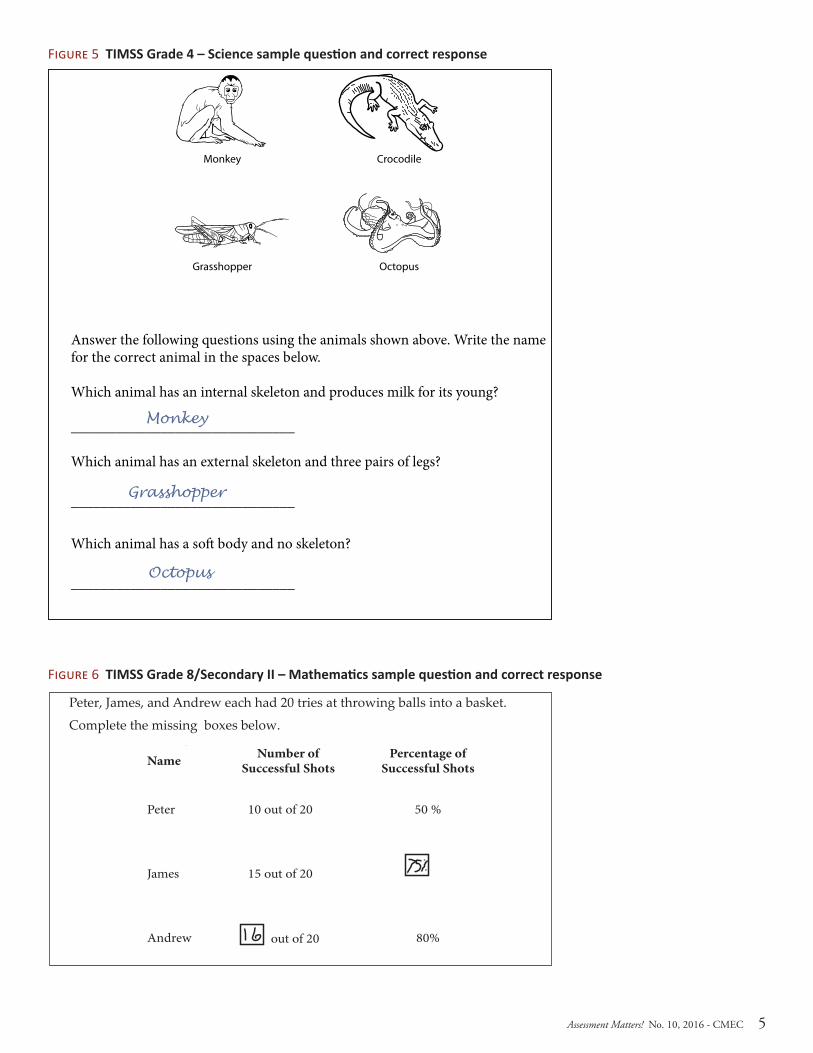
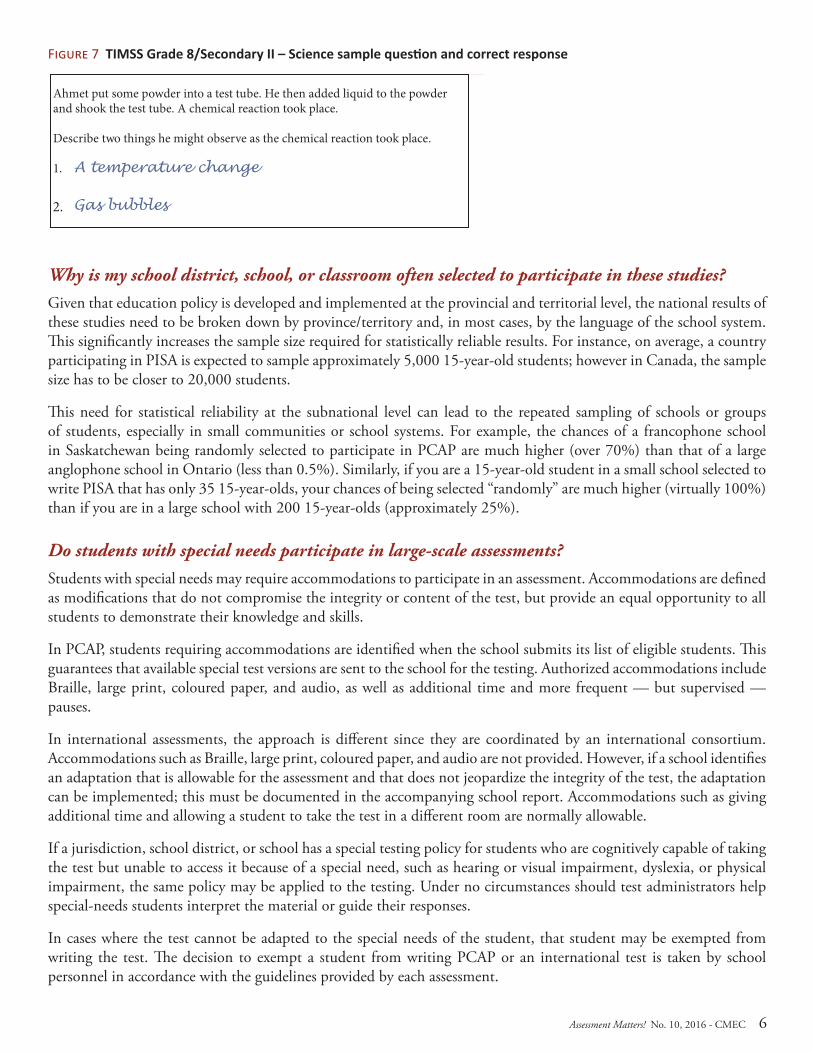
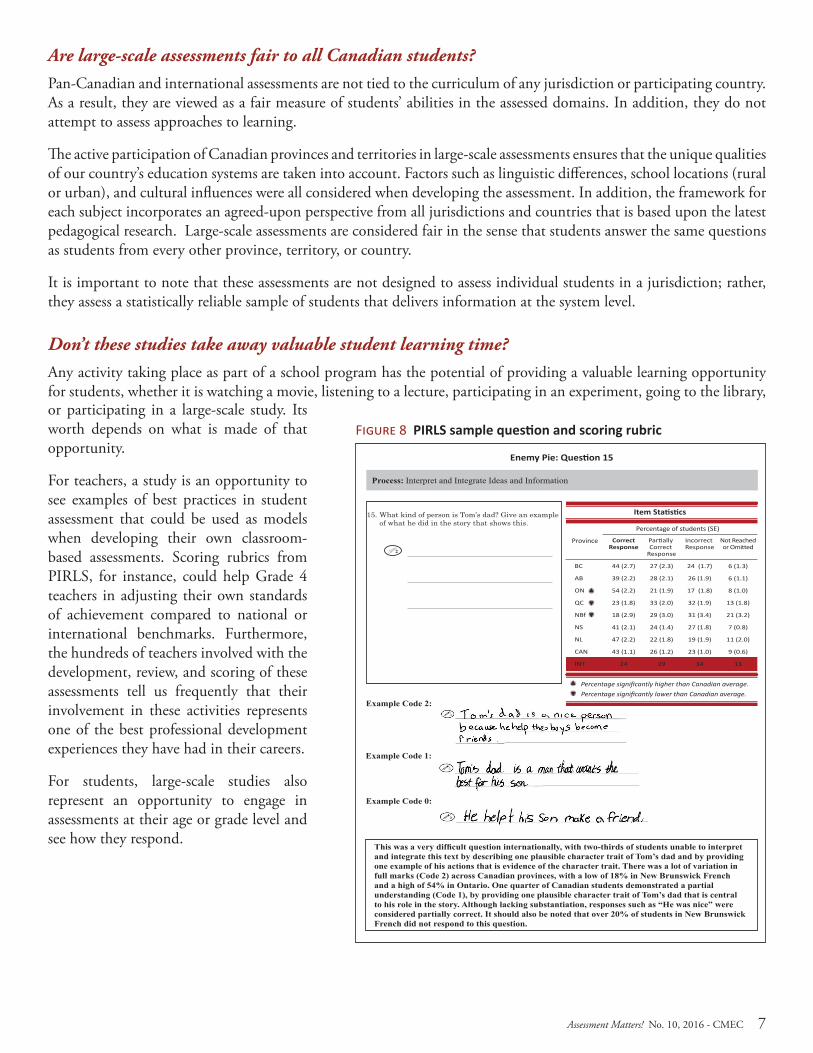
assessments, the next four figures (Figures 4, 5, 6, and 7) present sample items for both subjects and both grades that were administered in the TIMSS 2011 assessment.
Figure 4 TIMSS Grade 4 – Mathematics sample question and correct response
In a soccer tournament, teams get:
3 points for a win 1 point for a tie 0 points for a loss
Zedland has 11 points.
What is the smallest number of games Zedland could have played?
Answer: ______________
The Progress in International Reading Literacy Study (PIRLS)The Progress in International Reading Literacy Study, first introduced in 2001, is an international assessment administered every five years that measures trends in students’ reading-literacy achievement, as well as policy and practices related to literacy. This study is carried out under the auspices of the International Association for the Evaluation of Educational Achievement (IEA), a consortium of research institutions in 60 countries. The target population for PIRLS is students in Grade 4, and the mean age at the time of testing is at least 9.5 years. Grade 4 was chosen because it represents an important transition point in students’ development, the point at which students have already learned how to read and are now using reading to learn. PIRLS also collects a significant range of contextual information about home and school support for literacy.
IEA has created a new extension to the PIRLS 2016 assessment: ePIRLS, an innovative assessment of on-line reading. With the Internet now a major source of information at home and at school, curricula in countries around the world are acknowledging the importance of on-line reading. ePIRLS uses an engaging, simulated Internet environment to measure Grade 4 students’ achievement in reading for informational purposes. The assessment presents students with school-like assignments on science and social-studies topics that align with school reading purposes.
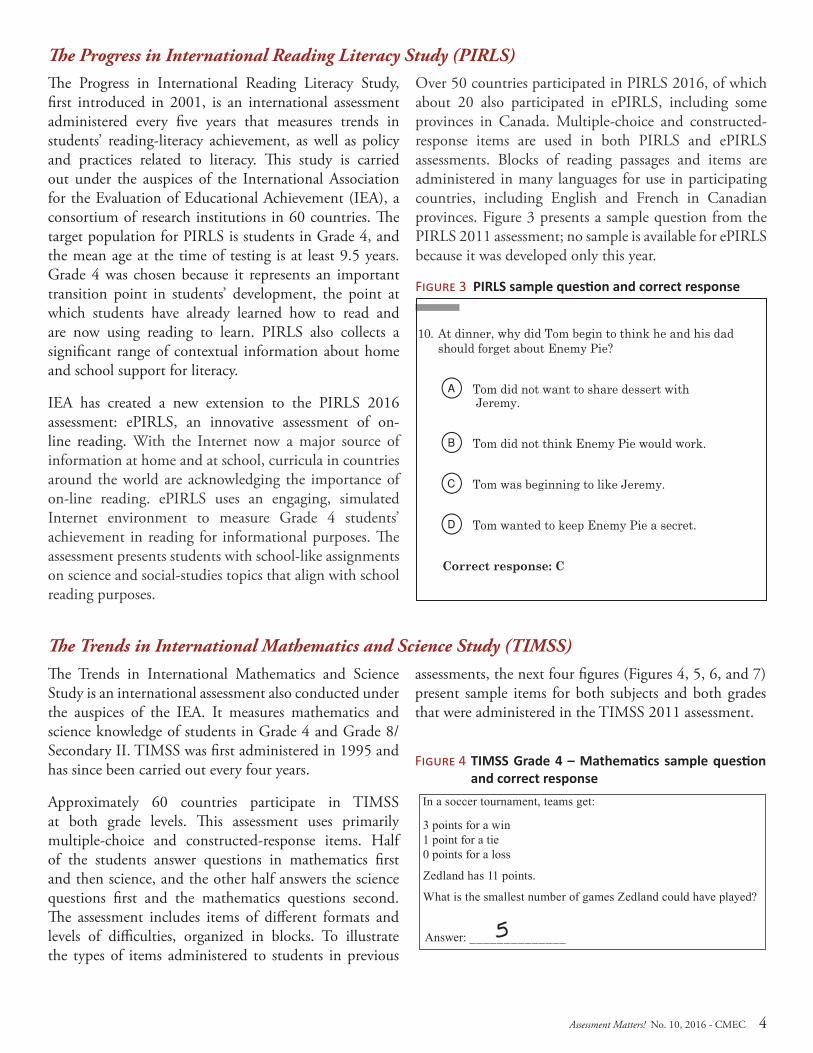
Over 50 countries participated in PIRLS 2016, of which about 20 also participated in ePIRLS, including some provinces in Canada. Multiple-choice and constructed-response items are used in both PIRLS and ePIRLS assessments. Blocks of reading passages and items are administered in many languages for use in participating countries, including English and French in Canadian provinces. Figure 3 presents a sample question from the PIRLS 2011 assessment; no sample is available for ePIRLS because it was developed only this year.
Figure 3 PIRLS sample question and correct response
10. At dinner, why did Tom begin to think he and his dad should forget about Enemy Pie?
ATom did not want to share dessert with Jeremy.
BTom did not think Enemy Pie would work.
CTom was beginning to like Jeremy.
DTom wanted to keep Enemy Pie a secret.
Correct response: C
Assessment Matters! No. 10, 2016 - CMEC 5
Figure 5 TIMSS Grade 4 – Science sample question and correct response
Fourth Class Booklet 6 Page 14
G4_S07 Page 2
S07_03
S031
233
Answer the following questions using the animals shown above. Write the name for the correct animal in the spaces below.
Which animal has an internal skeleton and produces milk for its young?
______________________________
Which animal has an external skeleton and three pairs of legs?
______________________________
Which animal has a so� body and no skeleton?
______________________________
Monkey Crocodile
Grasshopper Octopus
7971
99
70
10
16
Figure 6 TIMSS Grade 8/Secondary II – Mathematics sample question and correct response
Peter, James, and Andrew each had 20 tries at throwing balls into a basket.
Complete the missing boxes below.
Copyright © 2013 International Association for the Evaluation of Educational Achievement (IEA). 18
TIMSS 2011 8th-Grade Mathematics Concepts and Mathematics Items
M042059
Student ResponsesCorrect Response:
Peter, James, and Andrew each had 20 tries at throwing balls into a basket.
Complete the missing boxes below.
Name Number of Successful Shots
Percentage of Successful Shots
Peter 10 out of 20 50 %
James 15 out of 20
Andrew out of 20 80%
Partially Correct Response:Peter, James, and Andrew each had 20 tries at throwing balls into a basket.
Complete the missing boxes below.
Name Number of Successful Shots
Percentage of Successful Shots
Peter 10 out of 20 50 %
James 15 out of 20
Andrew out of 20 80%
Incorrect Response:Peter, James, and Andrew each had 20 tries at throwing balls into a basket.
Complete the missing boxes below.
Name Number of Successful Shots
Percentage of Successful Shots
Peter 10 out of 20 50 %
James 15 out of 20
Andrew out of 20 80%
Monkey
Grasshopper
Octopus
Assessment Matters! No. 10, 2016 - CMEC 6
Figure 7 TIMSS Grade 8/Secondary II – Science sample question and correct response
Copyright © 2013 International Association for the Evaluation of Educational Achievement (IEA). 64
TIMSS 2011 8th-Grade Science Concepts and Science Items
Content Domain
CHEMISTRY
Main Topic
Chemical Change
Cognitive Domain
Knowing
Ahmet put some powder into a test tube. He then added liquid to the powder and shook the test tube. A chemical reaction took place.
Describe two things he might observe as the chemical reaction took place.
1.
2.
Item Number: S042100
SCORINGCorrect Response
Appearance of a new color (color change)
Changing temperature (increase or decrease) A precipitate forming
Partially Correct Response
Incorrect Response
Overall Percent Correct
Education systemPercent correct
England-GBR 59New Zealand 50United States 46Chinese Taipei-CHN 44Russian Federation 44Singapore 44Australia 42United Arab Emirates 37Finland 36Hong Kong-CHN 35Norway 32Japan 30Saudi Arabia 30Syrian Arab Republic 30Slovenia 30Jordan 28Ukraine 27International average 24Bahrain 23Israel 23Korea, Rep. of 23Lebanon 22Qatar 22Lithuania 21Palestinian Nat’l Auth. 21Sweden 18Tunisia 18Kazakhstan 17Romania 17Oman 17Iran, Islamic Rep. of 17Hungary 15Armenia 14Malaysia 10Italy 9Turkey 8Thailand 8Chile 7Indonesia 6Macedonia, Rep. of 5Morocco 4Georgia 3Ghana 1
Benchmarking education system
Percentcorrect
Minnesota-USA 53Massachusetts-USA 52Indiana-USA 51Colorado-USA 51North Carolina-USA 47Quebec-CAN 44California-USA 44Florida-USA 42Dubai-UAE 39Abu Dhabi-UAE 39Alabama-USA 38Connecticut-USA 37Alberta-CAN 37Ontario-CAN 32
Percent higher than International average Percent lower than International average
A temperature change
Gas bubbles2.
Why is my school district, school, or classroom often selected to participate in these studies? Given that education policy is developed and implemented at the provincial and territorial level, the national results of these studies need to be broken down by province/territory and, in most cases, by the language of the school system. This significantly increases the sample size required for statistically reliable results. For instance, on average, a country participating in PISA is expected to sample approximately 5,000 15-year-old students; however in Canada, the sample size has to be closer to 20,000 students.
This need for statistical reliability at the subnational level can lead to the repeated sampling of schools or groups of students, especially in small communities or school systems. For example, the chances of a francophone school in Saskatchewan being randomly selected to participate in PCAP are much higher (over 70%) than that of a large anglophone school in Ontario (less than 0.5%). Similarly, if you are a 15-year-old student in a small school selected to write PISA that has only 35 15-year-olds, your chances of being selected “randomly” are much higher (virtually 100%) than if you are in a large school with 200 15-year-olds (approximately 25%).
Do students with special needs participate in large-scale assessments?Students with special needs may require accommodations to participate in an assessment. Accommodations are defined as modifications that do not compromise the integrity or content of the test, but provide an equal opportunity to all students to demonstrate their knowledge and skills.
In PCAP, students requiring accommodations are identified when the school submits its list of eligible students. This guarantees that available special test versions are sent to the school for the testing. Authorized accommodations include Braille, large print, coloured paper, and audio, as well as additional time and more frequent — but supervised — pauses.
In international assessments, the approach is different since they are coordinated by an international consortium. Accommodations such as Braille, large print, coloured paper, and audio are not provided. However, if a school identifies an adaptation that is allowable for the assessment and that does not jeopardize the integrity of the test, the adaptation can be implemented; this must be documented in the accompanying school report. Accommodations such as giving additional time and allowing a student to take the test in a different room are normally allowable.
If a jurisdiction, school district, or school has a special testing policy for students who are cognitively capable of taking the test but unable to access it because of a special need, such as hearing or visual impairment, dyslexia, or physical impairment, the same policy may be applied to the testing. Under no circumstances should test administrators help special-needs students interpret the material or guide their responses.
In cases where the test cannot be adapted to the special needs of the student, that student may be exempted from writing the test. The decision to exempt a student from writing PCAP or an international test is taken by school personnel in accordance with the guidelines provided by each assessment.
Assessment Matters! No. 10, 2016 - CMEC 7
Are large-scale assessments fair to all Canadian students?Pan-Canadian and international assessments are not tied to the curriculum of any jurisdiction or participating country. As a result, they are viewed as a fair measure of students’ abilities in the assessed domains. In addition, they do not attempt to assess approaches to learning.
The active participation of Canadian provinces and territories in large-scale assessments ensures that the unique qualities of our country’s education systems are taken into account. Factors such as linguistic differences, school locations (rural or urban), and cultural influences were all considered when developing the assessment. In addition, the framework for each subject incorporates an agreed-upon perspective from all jurisdictions and countries that is based upon the latest pedagogical research. Large-scale assessments are considered fair in the sense that students answer the same questions as students from every other province, territory, or country.
It is important to note that these assessments are not designed to assess individual students in a jurisdiction; rather, they assess a statistically reliable sample of students that delivers information at the system level.
Don’t these studies take away valuable student learning time? Any activity taking place as part of a school program has the potential of providing a valuable learning opportunity for students, whether it is watching a movie, listening to a lecture, participating in an experiment, going to the library, or participating in a large-scale study. Its worth depends on what is made of that opportunity.
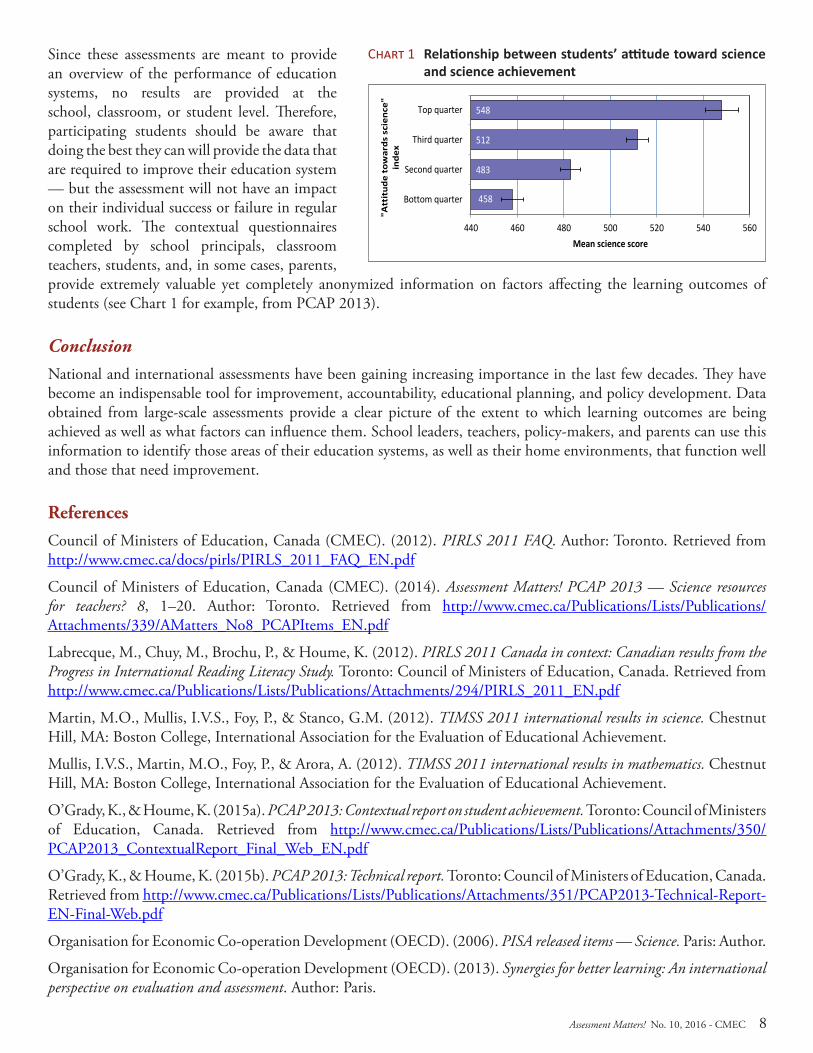
For teachers, a study is an opportunity to see examples of best practices in student assessment that could be used as models when developing their own classroom-based assessments. Scoring rubrics from PIRLS, for instance, could help Grade 4 teachers in adjusting their own standards of achievement compared to national or international benchmarks. Furthermore, the hundreds of teachers involved with the development, review, and scoring of these assessments tell us frequently that their involvement in these activities represents one of the best professional development experiences they have had in their careers.
For students, large-scale studies also represent an opportunity to engage in assessments at their age or grade level and see how they respond.
Figure 8 PIRLS sample question and scoring rubric Enemy Pie: Question 15
Process: Interpret and Integrate Ideas and Information
This was a very difficult question internationally, with two-thirds of students unable to interpret and integrate this text by describing one plausible character trait of Tom’s dad and by providing one example of his actions that is evidence of the character trait. There was a lot of variation in full marks (Code 2) across Canadian provinces, with a low of 18% in New Brunswick French and a high of 54% in Ontario. One quarter of Canadian students demonstrated a partial understanding (Code 1), by providing one plausible character trait of Tom’s dad that is central to his role in the story. Although lacking substantiation, responses such as “He was nice” were considered partially correct. It should also be noted that over 20% of students in New Brunswick French did not respond to this question.
15. What kind of person is Tom’s dad? Give an example of what he did in the story that shows this.
2
Example Code 2:
Example Code 1:
Example Code 0:
CorrectResponse
44 (2.7)
39 (2.2)
54 (2.2)
23 (1.8)
18 (2.9)
41 (2.1)
47 (2.2)
43 (1.1)
24
Partially Correct
Response
27 (2.3)
28 (2.1)
21 (1.9)
33 (2.0)
29 (3.0)
24 (1.4)
22 (1.8)
26 (1.2)
29
Incorrect Response
24 (1.7)
26 (1.9)
17 (1.8)
32 (1.9)
31 (3.4)
27 (1.8)
19 (1.9)
23 (1.0)
34
Not Reachedor Omitted
6 (1.3)
6 (1.1)
8 (1.0)
13 (1.8)
21 (3.2)
7 (0.8)
11 (2.0)
9 (0.6)
13
BC
AB
ON
QC
NBf
NS
NL
CAN
INT
Percentage of students (SE)
Province
Item Statistics
Percentage significantly higher than Canadian average.Percentage significantly lower than Canadian average.
Assessment Matters! No. 10, 2016 - CMEC 8
provide extremely valuable yet completely anonymized information on factors affecting the learning outcomes of students (see Chart 1 for example, from PCAP 2013).
ConclusionNational and international assessments have been gaining increasing importance in the last few decades. They have become an indispensable tool for improvement, accountability, educational planning, and policy development. Data obtained from large-scale assessments provide a clear picture of the extent to which learning outcomes are being achieved as well as what factors can influence them. School leaders, teachers, policy-makers, and parents can use this information to identify those areas of their education systems, as well as their home environments, that function well and those that need improvement.
ReferencesCouncil of Ministers of Education, Canada (CMEC). (2012). PIRLS 2011 FAQ. Author: Toronto. Retrieved from http://www.cmec.ca/docs/pirls/PIRLS_2011_FAQ_EN.pdf
Council of Ministers of Education, Canada (CMEC). (2014). Assessment Matters! PCAP 2013 — Science resources for teachers? 8, 1–20. Author: Toronto. Retrieved from http://www.cmec.ca/Publications/Lists/Publications/Attachments/339/AMatters_No8_PCAPItems_EN.pdf
Labrecque, M., Chuy, M., Brochu, P., & Houme, K. (2012). PIRLS 2011 Canada in context: Canadian results from the Progress in International Reading Literacy Study. Toronto: Council of Ministers of Education, Canada. Retrieved from http://www.cmec.ca/Publications/Lists/Publications/Attachments/294/PIRLS_2011_EN.pdf
Martin, M.O., Mullis, I.V.S., Foy, P., & Stanco, G.M. (2012). TIMSS 2011 international results in science. Chestnut Hill, MA: Boston College, International Association for the Evaluation of Educational Achievement.
Mullis, I.V.S., Martin, M.O., Foy, P., & Arora, A. (2012). TIMSS 2011 international results in mathematics. Chestnut Hill, MA: Boston College, International Association for the Evaluation of Educational Achievement.
O’Grady, K., & Houme, K. (2015a). PCAP 2013: Contextual report on student achievement. Toronto: Council of Ministers of Education, Canada. Retrieved from http://www.cmec.ca/Publications/Lists/Publications/Attachments/350/PCAP2013_ContextualReport_Final_Web_EN.pdf
O’Grady, K., & Houme, K. (2015b). PCAP 2013: Technical report. Toronto: Council of Ministers of Education, Canada. Retrieved from http://www.cmec.ca/Publications/Lists/Publications/Attachments/351/PCAP2013-Technical-Report-EN-Final-Web.pdf
Organisation for Economic Co-operation Development (OECD). (2006). PISA released items — Science. Paris: Author.
Organisation for Economic Co-operation Development (OECD). (2013). Synergies for better learning: An international perspective on evaluation and assessment. Author: Paris.
Since these assessments are meant to provide an overview of the performance of education systems, no results are provided at the school, classroom, or student level. Therefore, participating students should be aware that doing the best they can will provide the data that are required to improve their education system — but the assessment will not have an impact on their individual success or failure in regular school work. The contextual questionnaires completed by school principals, classroom teachers, students, and, in some cases, parents,
458
483
512
548
440 460 480 500 520 540 560
Bottom quarter
Second quarter
Third quarter
Top quarter
Mean science score
"Att
itud
e to
war
ds s
cien
ce"
inde
x
Chart 1 Relationship between students’ attitude toward science and science achievement