assessment and determinants of nutritional status … · assessment and determinants of nutritional...
TRANSCRIPT
European Journal of Biology and Medical Science Research
Vol 4, No.4, pp.1-24, September 2016
Published by European Centre for Research, Training and Development UK (www.eajournals.org)
1
ISSN 2053-406X(Print), ISSN 2053-4078(Online)
ASSESSMENT AND DETERMINANTS OF NUTRITIONAL STATUS IN A SAMPLE
OF UNDER FIVE-YEAR-OLD IRAQI CHILDREN
Maysaloun Muhammed Abdulla
Assistant Professor, Community & Family Medicine Department/College of Medicine/Al-
Nahrain University.
ABSTRACT: The nutritional status of under five-year-old children is an important outcome
measure of children’s health. Malnutrition is one of the most important causes of children’s
abnormal physical and mental development. The study aims to find the prevalence and
determinants of malnutrition in terms of wasting, stunting, and underweight, in addition to
obesity in a sample of under five-year-old Iraqi children. A cross sectional study was
conducted in three primary health care centres in Baghdad for the period from 3rd
January to
31st March 2012. A sample of 606 under 5-year-old children (2-59 months) of both genders
was included in the study. Data were gathered by direct interviews with the children’s parents,
and the weight, height, and BMI measurements of each child were taken. The prevalence of
different undernutrition problems among under five-year-old children were: 5.28% for
wasting, 16.17% for stunting, and 7.43% for underweight. The highest prevalence was that of
being being obese; 17.5% by weight to height and 15.35% by BMI to age. Malnutrition levels
were higher in rural than in urban areas. A significant association was estimated between;
the age of a child and being underweight, lower levels of parental education and stunting,
and between extended families and stunting. The rates of being being obese were higher than
that of those of undernutrition. The factors associated with undernutrition in under five-year-
old children are especially related to lower socioeconomic status such as rural residence,
lower levels of maternal education, unemployed mothers, and extended larger families.
KEYWORDS: Nutritional Status, Under 5 Children, Malnutrition.
INTRODUCTION
In the developing regions, despite population growth, a decline in under 5-year-old child
mortality was estimated from 12.7 million in 1990 to almost 6 million in 2015 globally,
mostly due to preventable causes (United Nations, 2015). The nutritional status of under-five
children is an important outcome measure of children’s health (NBS and ICF, 2010).
Malnutrition is one of the most important causes of children’s abnormal physical and mental
development (Das and Rahman, 2011). Much research has shown that the level of resistance
to infection is lower for malnourished children than other children, which causes high levels
of morbidity and mortality and adverse effects on intellectual ability (Sharghi, Kamran, and
Faridan 2011). Nearly half of all deaths in under 5-year-old children are attributable to
undernutrition, which translates into the unnecessary loss of about three million young lives a
year (Park et al 2012; UNICEF 2015).
European Journal of Biology and Medical Science Research
Vol 4, No.4, pp.1-24, September 2016
Published by European Centre for Research, Training and Development UK (www.eajournals.org)
2
ISSN 2053-406X(Print), ISSN 2053-4078(Online)
Poor nutrition in the first 1,000 days of a child’s life can also lead to stunted growth, which is
irreversible and associated with impaired cognitive ability and reduced school and work
performance (UNICEF, 2015).
In April 2006, the World Health Organization (WHO) released new global growth charts for
infants and children as old as 5 years to replace the existing CDC/WHO international growth
charts, which were based on the 1977 NCHS growth charts (Grummer, Reinold, and Krebs
2010).
Prior to 2015, the tracking progress to the Millennium Development Goal 1 (Eradicate
extreme poverty and hunger) was done through child undernutrition indicators. The target
was to achieve a 50% reduction in underweight prevalence between 1990 and 2015. Another
aspect of malnutrition i.e. overweight and obesity was growing at a brisk pace among
children worldwide. Now, in the post-2015 development era, the world is on track to achieve
the Sustainable Development Goal 2 (End hunger, achieve food security and improved
nutrition, and promote sustainable agriculture) with the help of malnutrition measures
(UNICEF 2015).
In the Middle East, the percentage of stunted and underweight children under the age of five
decreased between 1990 and 1914 from 31% to 18% and from 14% to 7% respectively, and
in 2014 the wasting rate was 8.2%. Obesity, on the other hand, continued to increase
worldwide, from 7.5% in 1990 to 8.9% in 2014 (UNICEF 2016).
In general, the different prevalence of under-nutrition in various parts of the world ranged
from about 5% to 40% with the different risk factors categorized as: child or family
characteristics, socio-economic status, healthcare, and prevalent infectious diseases ( Kavosi
et al 2014).
In Iraq, the nutritional surveys carried out in 2011and 2013 showed that there exist continued
nutritional problems in addition to obesity, which require a national strategy to control them.
Studies showed that 61% of the deaths of children under five years old are caused by
malnutrition. The multi-indicators national survey conducted in collaboration with the
Ministry of Planning, the Health Organization, and UNICEF, which included 36,500 Iraqi
families in 18 provinces, showed that for every (1,000) live births, in 2013 the mortality rate
for infants and children under five years old was 38. In addition, the rates of underweight,
stunting, and wasting were 8.4, 22.3, and 6.9 respectively, while the percentage of overweight
was 12% (Nutrition Research Institute Iraq 2014, University of Baghdad 2014). The
increasing prevalence of childhood obesity has become a growing matter of public health
concern worldwide and is expected to reach 9.1% in 2020 (Muhihi 2013, Grieken 2013,
WHO obesity and overweight 2006). New conditions, in terms of lifestyle, have been created
in many developing countries due to urbanization and economic development, and which
have led to the emergence of nutrition transition which is characterized by a shift to a higher
caloric content in diet and to a reduction in physical activity (Rihlat 2009).
The four measures of children’s nutritional status used in this study were: stunting, wasting,
underweight, and overweight/obesity. Children (age 2-59 months) whose height-for-age Z-
European Journal of Biology and Medical Science Research
Vol 4, No.4, pp.1-24, September 2016
Published by European Centre for Research, Training and Development UK (www.eajournals.org)
3
ISSN 2053-406X(Print), ISSN 2053-4078(Online)
score (HAZ) is below minus two standard deviations (-2 SD) from the median of the WHO
reference population are considered to be stunted, or chronically malnourished (NBS and ICF
2010). This means that a child who is stunted is considered short for their age, which is a
measure of chronic nutritional deficiency. Wasting relates to the weight-for-height index
(WHZ) which measures body mass in relation to body height or length and describes current
nutritional status. Children with Z scores below minus two standard deviations (-2SD) are
considered wasted, or acutely malnourished. Further, weight-for-age (WAZ) is a composite
index of height-for-age (HAZ) and weight-for-height (WHZ), and it takes into account both
chronic and acute malnutrition. Children with weight-for-age below minus two standard
deviations (-2 SD) are classified as underweight. Height-for-age does not distinguish between
chronic malnutrition (stunting) and acute malnutrition (wasting) (National Statistical Office
2011).
The WHO recommended the cut-off points for overweight and obesity based on the BMI-for-
age Z –scores (BAZ). The reference curve of the Z -score = 1 was recommended to classify
“overweight”, while that of the Z -score > 2 classifies “obesity”. The BMI-for-age Z -score <
-2 and < -3 were set as the cut-off points for thinness and severe thinness, respectively
(Wang and Chen 2012). Children have WHZ score above +2 were considered overweight and
obese (WHO 2016).
The study aims to find the prevalence of malnutrition in a sample of under five-year-old Iraqi
children in terms of wasting, stunting, and underweight, in addition to overweight and
obesity, and to identify the association of some sociodemographic and lifestyle characteristics
with these nutritional health problems.
METHODS
A cross-sectional study was carried out in three conveniently selected primary health care
centres (PHC) in Baghdad/Alkarkh, with different catchment areas serving the population
from urban and rural regions, namely Alrashid, Alshabab, and Alwashash PHC centres. Data
collection was carried out for a period of three months from 3rd
January to 31st March, 2012.
The researcher visited each PHC centre four days a week, for 3-4 hours a day for about one
month.
A convenient consecutive sample was recruited including 606 children under 5 years old (2-
59 months) of both genders who were visiting health care centres for vaccination or routine
care visits. Child age was determined according to the difference between a child's date of
birth taken from available written records and the date of data collection. As there is no
available proposed classification to define socioeconomic classes in Iraq, sociodemographic
characteristics were used instead such as: residence (urban or rural), educational level,
employment status, type of family (nuclear or extended), and family size. Only apparently
healthy children accompanied by their parent or parents, and who had family cards, were
included in the study while those with chronic diseases (endocrine, gastrointestinal, respiratory,
and others), severe acute illnesses, mental illness, and those with no cards were excluded.
European Journal of Biology and Medical Science Research
Vol 4, No.4, pp.1-24, September 2016
Published by European Centre for Research, Training and Development UK (www.eajournals.org)
4
ISSN 2053-406X(Print), ISSN 2053-4078(Online)
Each child’s parent (parents) was interviewed by the researcher, his or her verbal consent was
given after a brief explanation of the nature and the aims of the study, and the data was collected
using a specially structured questionnaire form designed for this study. This consisted of data
regarding sociodemographic characteristics, antenatal care, and the child’s mother’s
obstetrical history, data related to the child’s feeding patterns, and the eating habits and daily
physical activity that may be related to the child’s nutritional status. Ethical approval was
given by the Ethical Standards Council of Faculty of College of Medicine, at Alnahrain
University.
Each child selected for the study underwent anthropometric measurements for weight, height
and body mass index (BMI) A well-calibrated digital scale was used to measure the child’s
weight in kilograms (kg), and they were recorded to the nearest 0.1 kg. The scales were
checked daily for accuracy and calibrated using standard known weights. All boys and girls
were barefoot and wearing with minimal clothes. Children who could not stand on the scales
were weighed with the respondent, then the respondent was weighed alone, and the
difference was used to obtain the weight of the child. Height was measured in centimetres in a
standing position for children of two years and over using tape measures fixed to the wall, and
in recumbent length for those less than two years old on the examination couch. Older
children (two years and above) stood with their backs against the wall with their feet parallel,
and their heels, buttocks, shoulders, and the back of the head touching the wall. All
anthropometric measurements were performed in duplicate. When two measurements were
discrepant, a third was taken, and the two closest were selected. The presence of bilateral
pitting oedema in the children was recorded if an imprint remained in both feet after pressing
for 3 seconds.
Data were entered using the WHO Anthro 3.2.2 version, anthropometric indices were
calculated using reference medians recommended by WHO and classified according to
standard deviation units (z-scores), and based on the WHO criteria to estimate
anthropometric indices (WHZ, WAZ, HAZ, and BAZ) and according to the NCHS/WHO
method which assesses a child’s nutritional status (WHO child growth standards 2006).
The Z-score or standard deviation (SD) is defined as the difference between the value for an
individual and the median value of the reference population for the same age or height,
divided by the standard deviation of the reference population. The used cut-off with Z-scores
is -2 standard deviation (SD) irrespective of the indicator used. This means children with a Z-
score for HAZ, WHZ or WAZ below -2 SD are considered malnourished. Wasting (weight-
for-height z-score–WHZ) indicates thinness. It is usually the result of recent nutritional
deficiency and is affected by seasonal shifts associated with the availability of food and the
prevalence of disease. A WHZ of <-2 defines the presence of acute malnutrition (wasting).
Stunting, represented by a low height-for-age z-score (HAZ), results from extended periods
of inadequate food intake, poor dietary quality, increased morbidity, or a combination of
these factors. A HAZ of <-2 defines chronic malnutrition (stunting). The weight-for-age z-
score (WAZ) is essentially a composite of weight-for-height and height-for-age, thus a
measure of both acute and chronic malnutrition. A WAZ of <-2 is used to define a child as

European Journal of Biology and Medical Science Research
Vol 4, No.4, pp.1-24, September 2016
Published by European Centre for Research, Training and Development UK (www.eajournals.org)
5
ISSN 2053-406X(Print), ISSN 2053-4078(Online)
being underweight. Children with a WHZ score of +1 to +2 are at risk of obesity while
overweight and obese children have WHZ score above +2 (WHO 2016).
All anthropometric measurements were computed into z-scores; weight for age z-score
(WAZ), height for age z-score (HAZ), weight for height z-score (WHZ), and BMI for age z-
score (BAZ), using 2006 World Health Organization Growth Standards.
Malnourished children were reported when one of their anthropometric indices were
abnormal (-2 z-scores below the average reference). Children were considered wasted if their
weight-for-height index was below -2 z-scores below the average reference, and were
considered to have growth retardation if their height for age index was below -2 z-scores
below the average reference. Table (1) shows the classification of malnutrition rates as a
public health problem according to WHO (B)(4).
Table -1-: Classification of malnutrition by prevalence ranges among children under
5 years of age (WHO 2016)
Index Normal/ low Poor/ medium Serious/ high Critical/ very high
Wasting
<5%
5-9.9%
10-14.9%
>15%
Stunting <20% 20-29.9% 30-39.9% >40%
underweight <10% 10-19.9% 20-29.9% >30%
Data were entered using the WHO Anthro 3.2.2 version to estimate the anthropometric
indices (WHZ, WAZ, HAZ and BAZ) according to the NCHS/WHO method of assessing a
child’s nutritional status.
The study data was analysed using the SPSS-16 (statistical packages for social sciences)
statistical computer programme to estimate mean and standard deviation (SD), the Chi-square
test for the assessment of the association between the qualitative variables studied, and the
student (unpaired) t-test for independent data to test the significance of the differences between
the results of two means. An association or difference was considered statistically significant if
the probability value (P value) was less or equal to 0.05.
RESULTS
A total of 606 children aged from two months up to five years were included in this study,
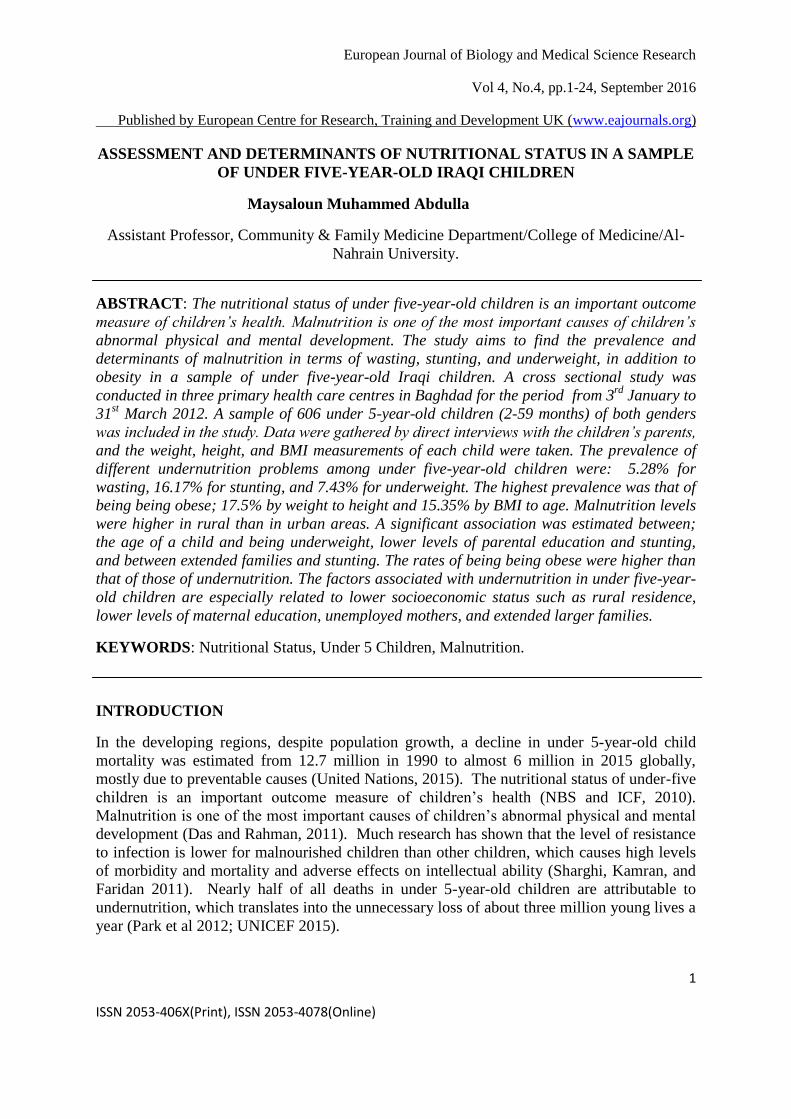
their anthropometric measurements are shown in Table-2. Regarding the weight-for-height z
scores, 5.28% of children were below -2 SD (wasting), and 17.492% were above 2 SD
(overweight). The relation between the children’s weight and height was statistically
significant (r =0.910 and p<0.01) (Figure-1). By assessing the health status of children on the
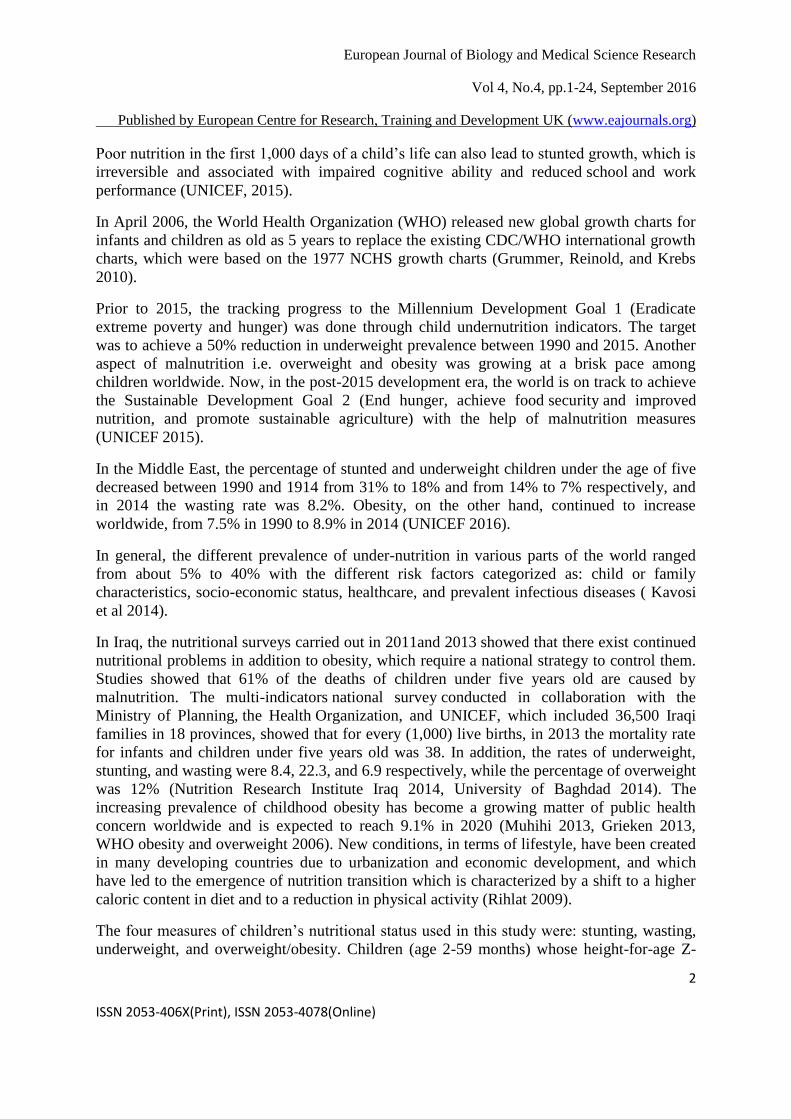
basis of weight-for-age it was seen that 7.43% of children were being underweight (below -2
SD) and 5.61% of children were above 2 SD. The correlation between weight and age was
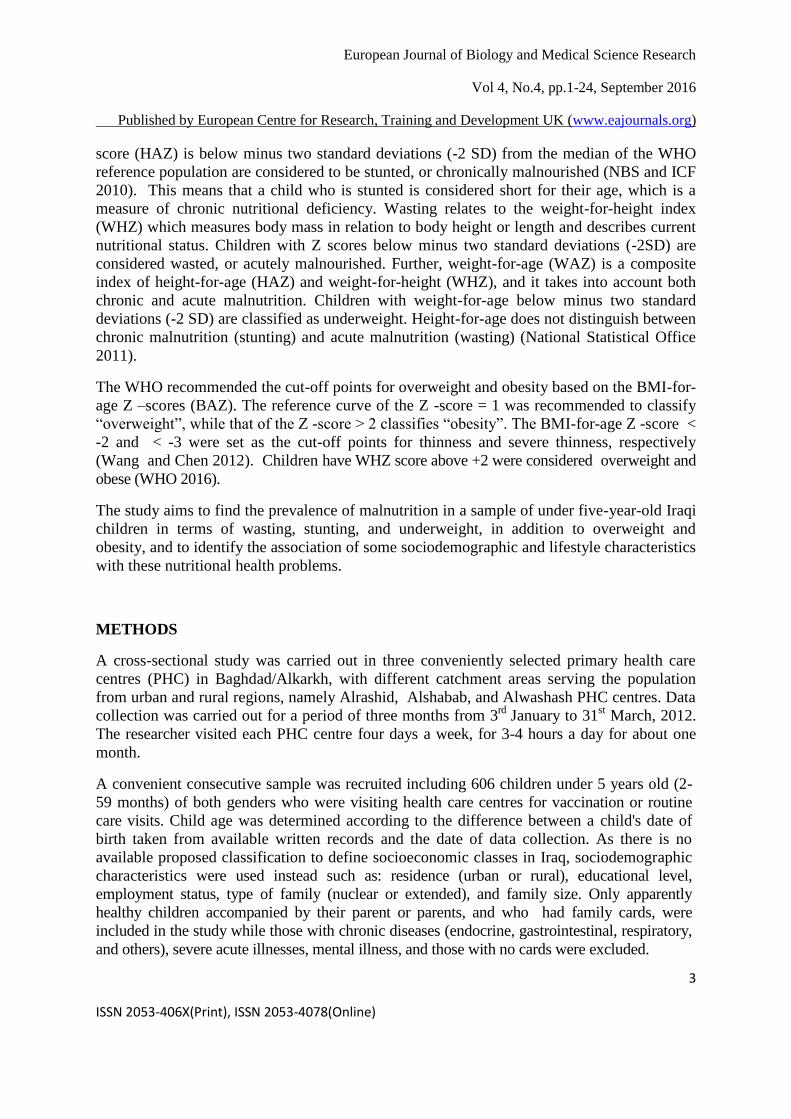
statistically significant (r =0.867 and p<0.01) (Figure-2). According to the height-for-age
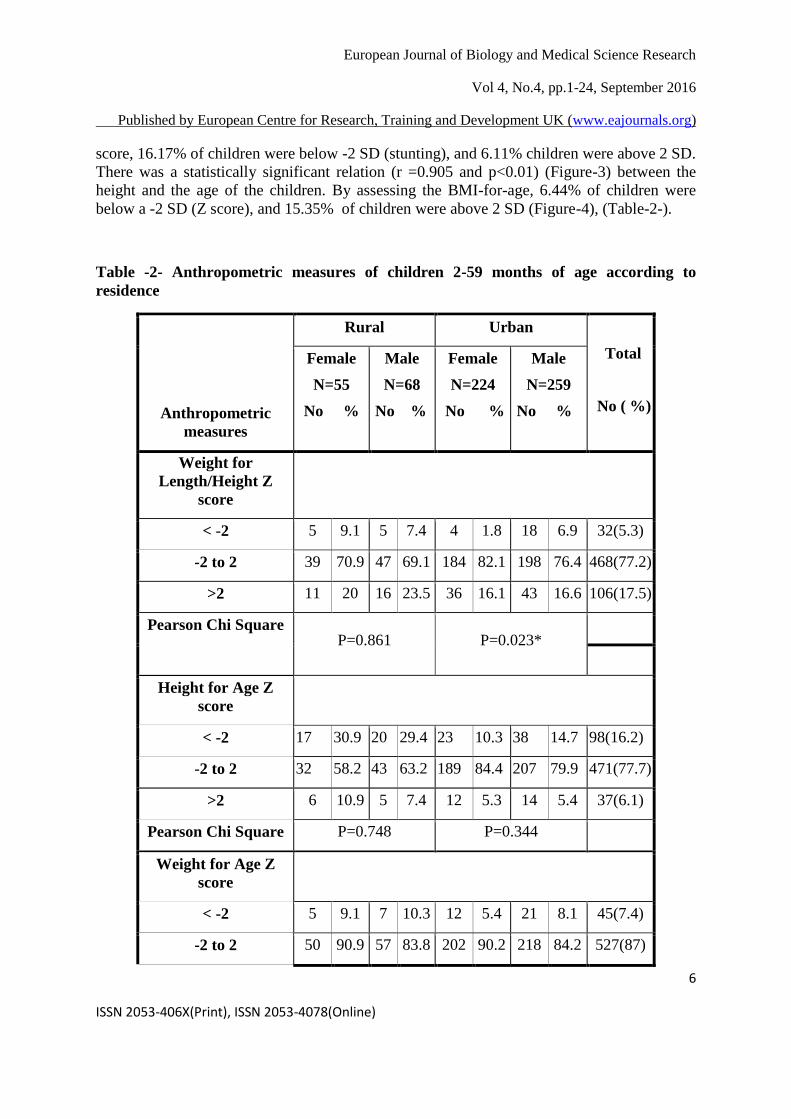
European Journal of Biology and Medical Science Research
Vol 4, No.4, pp.1-24, September 2016
Published by European Centre for Research, Training and Development UK (www.eajournals.org)
6
ISSN 2053-406X(Print), ISSN 2053-4078(Online)
score, 16.17% of children were below -2 SD (stunting), and 6.11% children were above 2 SD.
There was a statistically significant relation (r =0.905 and p<0.01) (Figure-3) between the
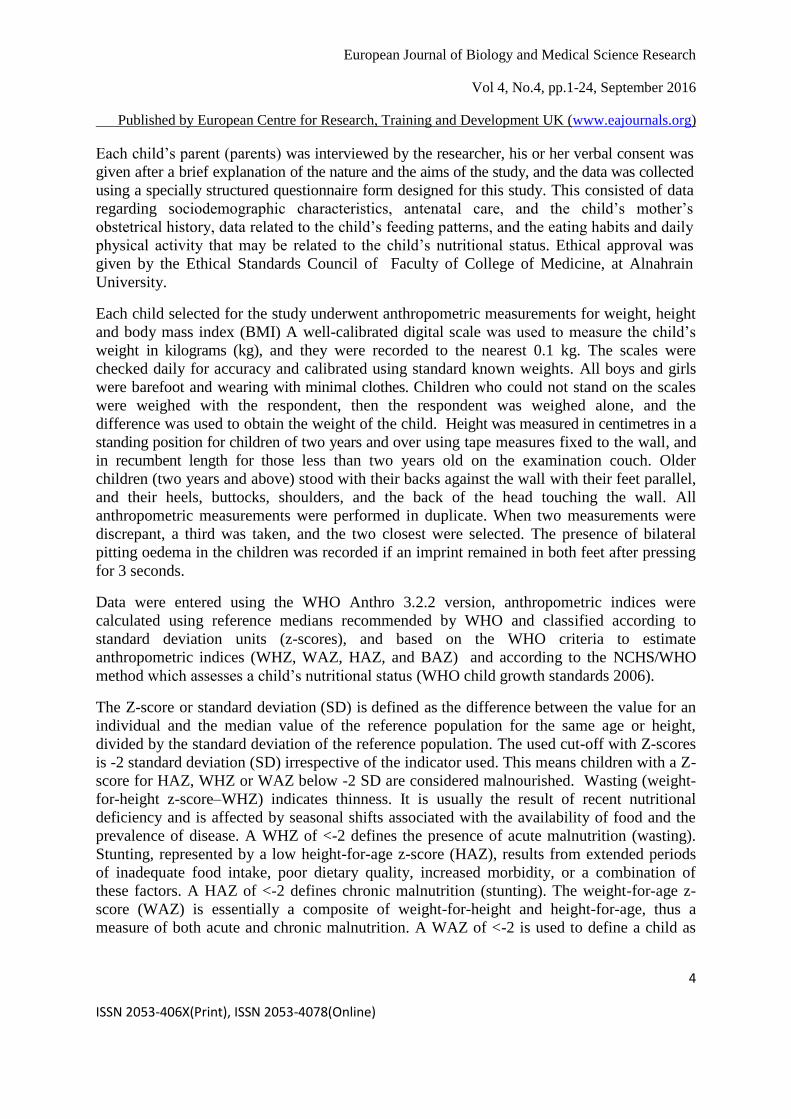
height and the age of the children. By assessing the BMI-for-age, 6.44% of children were
below a -2 SD (Z score), and 15.35% of children were above 2 SD (Figure-4), (Table-2-).
Table -2- Anthropometric measures of children 2-59 months of age according to
residence
Anthropometric
measures
Rural Urban
Total
No ( %)
Female
N=55
No %
Male
N=68
No %
Female
N=224
No %
Male
N=259
No %
Weight for
Length/Height Z
score
< -2 5 9.1 5 7.4 4 1.8 18 6.9 32(5.3)
-2 to 2 39 70.9 47 69.1 184 82.1 198 76.4 468(77.2)
>2 11 20 16 23.5 36 16.1 43 16.6 106(17.5)
Pearson Chi Square P=0.861 P=0.023*
Height for Age Z
score
< -2 17 30.9 20 29.4 23 10.3 38 14.7 98(16.2)
-2 to 2 32 58.2 43 63.2 189 84.4 207 79.9 471(77.7)
>2 6 10.9 5 7.4 12 5.3 14 5.4 37(6.1)
Pearson Chi Square P=0.748 P=0.344
Weight for Age Z
score
< -2 5 9.1 7 10.3 12 5.4 21 8.1 45(7.4)
-2 to 2 50 90.9 57 83.8 202 90.2 218 84.2 527(87)

European Journal of Biology and Medical Science Research
Vol 4, No.4, pp.1-24, September 2016
Published by European Centre for Research, Training and Development UK (www.eajournals.org)
7
ISSN 2053-406X(Print), ISSN 2053-4078(Online)
Anthropometric
measures
Rural Urban
Total
No ( %)
Female
N=55
No %
Male
N=68
No %
Female
N=224
No %
Male
N=259
No %
Weight for
Length/Height Z
score
< -2 5 9.1 5 7.4 4 1.8 18 6.9 32(5.3)
-2 to 2 39 70.9 47 69.1 184 82.1 198 76.4 468(77.2)
>2 11 20 16 23.5 36 16.1 43 16.6 106(17.5)
Pearson Chi Square P=0.861 P=0.023*
Height for Age Z
score
< -2 17 30.9 20 29.4 23 10.3 38 14.7 98(16.2)
-2 to 2 32 58.2 43 63.2 189 84.4 207 79.9 471(77.7)
>2 6 10.9 5 7.4 12 5.3 14 5.4 37(6.1)
Pearson Chi Square P=0.748 P=0.344
Weight for Age Z
score
>2 0 0 4 5.9 10 4.5 20 7.7 34(5.6)
Pearson Chi Square P=0.178 P=0.144
BMI for Age Z score
< -2 5 9.1 7 10.3 6 2.7 21 8.1 39(6.4)
-2 to 2 39 70.9 44 64.7 188 83.9 203 78.4 474(78.2)
>2 11 20 17 25 30 13.4 35 13.5 93(15.3)
Pearson Chi Square P=0.759 0.033*

European Journal of Biology and Medical Science Research
Vol 4, No.4, pp.1-24, September 2016
Published by European Centre for Research, Training and Development UK (www.eajournals.org)
8
ISSN 2053-406X(Print), ISSN 2053-4078(Online)
The rates for urban and rural children were 79.7% (483 children) and 20.3% (123 children)
respectively. In both residencies, although the rates for malnourished males (below -2 and
above 2 Z scores) were higher than those of females for all nutritional indices, this result was
only significant (P< 0.05) among urban children regarding weight for length/height and BMI
for age Z scores ( Table-2).
The levels of malnutrition among children under five in this study were higher in rural than
urban areas as follows: wasting (8.13and 4.55), stunting ( 30.08 and 12.63), being
underweight (9.76 and 6.83), overweight and obesity by WHZ ( 21.95 and16.36), and BAZ (
22.76 and 13.46) for rural and urban children respectively.
WAZ WHZ
Figure 1: Weight –for-height; 5.28% of
children below -2 SD, 17.492% above 2 SD.
correlation between weight and height is
statistically significant(r =0.910 and p<0.01).
Figure 2: Weight–for–age; 7.43% of children below -2 SD , 5.61% of children above 2 SD. Correlation between weight and age is statistically significant (r =0.867 and p<0.01).
HAZ
BAZ
Figure 3 : Height–for-age; 16.17% of children below -2 SD, 6.11% of children above 2 SD. The height and age of the children had statistically significant correlation (r =0.905 and p<0.01).
Figure 4: BMI-for –age;6.44% of
children below -2 SD , 15.35% of
children above 2 SD

European Journal of Biology and Medical Science Research
Vol 4, No.4, pp.1-24, September 2016
Published by European Centre for Research, Training and Development UK (www.eajournals.org)
9
ISSN 2053-406X(Print), ISSN 2053-4078(Online)
The sociodemographic characteristics of the children were studied and it was found the
highest rate of children (46.5%) were aged from three months up to one year while the
lowest was for those aged from four to five years old (3.96%). Parents with primary and
secondary education represented 34.6% and 50.2% for fathers and mothers respectively, the
illiterate or those with a limited ability to read and write were 29.7% and 29.5%, while
college and higher education constituted 26.7% and 20.35% , for fathers and mothers
respectively. The children’s fathers were all employed (self-employed 60.1% and
governmental employed 39.65) and about two- thirds of mothers were housewives and the
remaining 35.5% of them were employed. Regarding family structure, 461(76.1%) of
children had nuclear families while 145 (23.9%) were from extended families. The family
size of approximately 80% of the sample was less than five, and 20% (122) consisted of five
people or more (Table-3).
Table -3- Anthropometric measures of children 2-59 months of age according to
sociodemographic characteristics
Variables
WHZ HAZ WAZ BAZ
<-2
-2 to
2 >2 <-2
-2 to
2 >2 <-2
-2 to
2 >2 <-2
-2 to
2 >2
N N
%
N
%
N
%
N
%
N
%
N
%
N
%
N
%
N
%
N
%
N
%
N
%
Age in
months
2-11 282 18
6.4
209
74.1
55
19.5
55
19.5
210
74.5
17
6.0
31
11.0
240
85.1
11
3.9
21
7.4
223
79.1
38
13.5
12-23 178 10
5.6
140
78.7
28
15.7
23
12.9
140
78.7
15
8.4
3
1.7
160
89.9
15
8.4
13
7.3
135
75.8
30
16.9
24-35 76 2
2.6
62
81.6
12
15.8
11
14.5
61
80.3
4
5.3
7
9.2
63
82.9
6
7.9
2
2.6
60
78.9
14
18.4
36-47 46 1
2.2
36
78.3
9
19.6
6
13.0
40
87.0
0.0
0.0
3
6.5
42
91.3
1
2.2
2
4.3
35
76.1
9
19.6
48-60 24 1
4.2
21
87.5
2
8.3%
3
12.5
20
83.3
1
4.2
1
4.2
22
91.7
1
4.2
1
4.2
21
87.5
2
8.3
Pearson Chi
square P=0.661 P=0.310 P=0.011* P=0.647
Educational
level of
father

European Journal of Biology and Medical Science Research
Vol 4, No.4, pp.1-24, September 2016
Published by European Centre for Research, Training and Development UK (www.eajournals.org)
10
ISSN 2053-406X(Print), ISSN 2053-4078(Online)
Illetrate or
only read &
write
180 13
7.2
133
73.9
34
18.9
36
20.0
132
73.3
12
6.7
17
9.4
157
87.2
6
3.3
17
9.4
134
74.4
29
16.1
Primary or
secondary
264 10
3.8
207
78.4
47
17.8
39
14.8
209
79.2
16
6.1
20
7.6
229
86.7
15
5.7
14
5.3
204
77.3
46
17.4
college &
above
162 9
5.6
128
79.0
25
15.4
23
14.2
130
80.2
9
5.6
8
4.9
141
87.0
13
8.0
8
4.9
136
84.0
18
11.1
Pearson Chi
square
P=0.492 P=0.531 P=0.223 P=0.118
Educational
level of
mother
Illetrate or
only read &
write
179
12
6.7
129
72.1
38
21.2
43
24.0
122
68.2
14
7.8
16
8.9
157
87.7
6
3.4
14
7.8
131
73.2
34
19.0
Primary or
secondary
304 14
4.6
240
78.9
50
16.4
42
13.8
245
80.6
17
5.6
25
8.2
258
84.9
21
6.9
17
5.6
242
79.6
45
14.8
college &
above
123
6
4.9
99
80.5
18
14.6
13
10.6
104
84.6
6
4.9
4
3.3
112
91.1
7
5.7
8
6.5
101
82.1
14
11.4
Pearson Chi
square
P=395 P=0.005* P=0.156 P=0.327
Occupation
of father
Self
employed
364
17
4.7
277
76.1
70
19.2
70
19.2
274
75.3
20
5.5
28
7.7
320
87.9
16
4.4
22
6.0
277
76.1
65
17.9
Government
employed
242
15
6.2
191
78.9
36
14.9
28
11.6
197
81.4
17
7.0
17
7.0
207
85.5
18
7.4
17
7.0
197
81.4
28
11.6
Pearson Chi
square
P=0.306 P=0.038* P=0.275 P=0.106
Occupation
of mother
Unemployed
391
21
5.4
302
77.2
68
17.4
72
18.4
295
75.4
24
6.1
30
7.7
345
88.2
16
4.1
26
6.6
304
77.7
61
15.6
employed 215
11
5.1
166
77.2
38
17.7
26
12.1
176
81.9
13
6.0
15
7.0
182
84.7
18
8.4
13
6.0
170
79.1
32
14.9

European Journal of Biology and Medical Science Research
Vol 4, No.4, pp.1-24, September 2016
Published by European Centre for Research, Training and Development UK (www.eajournals.org)
11
ISSN 2053-406X(Print), ISSN 2053-4078(Online)
Pearson Chi
square
P=0.988 P=0.125 P=0.090 P=0.925
Type of
family
Nuclear 461 21
4.6
363
78.7
77
16.7
68
14.8
372
80.7
21
4.6
33
7.2
398
86.3
30
6.5
27
5.9
369
80.0
65
14.1
extended 145 11
7.6
105
72.4
29
20.0
30
20.7
99
68.3
16
11.0
12
8.3
129
89.0
4
2.8
12
8.3
105
72.4
28
19.3
Pearson Chi
square
P=0.204 P=0.002* P=0.219 P=0.151
Family size
<5 484 26
5.4
372
76.9
86
17.8
76
15.7
383
79.1
25
5.2
34
7.0
419
86.6
31
6.4
31
6.4
378
78.1
75
15.5
5+ 122 6
4.9
96
78.7
20
16.4
22
18.0
88
72.1
12
9.8
11
9.0
108
88.5
3
2.5
8
6.6
96
78.7
18
14.8
Pearson Chi
square
P=0.911 P=0.110 P=0.195 P=0.979
The highest rates of children with low Z scores (< -2) were among infants of 2-11 months
(less than one year-old) for all anthropometric measures ( WHZ 6.4%, HAZ 19.5%, WAZ
11% and BAZ 7.4%). The lowest rates were as follows: 2.2% for WHZ of children within
their fourth year of age, 12.5% for HAZ among the 48-60 months age group, 1.7% for WAZ
within the second year of life, and 2.6% for BAZ among children aged 24-35 months. On the
other hand, Z score rates above two were highest among children who were less than one
year old for the WAZ index (19.5%), one to less than two years old for the HAZ and WAZ
indices ( 8.4% for each), in the 36-47 months age group for BAZ (19.6%). The lowest rates
were among the age group 36-47 months for HAZ and WAZ ( 0.0% and 2.2% respectively) ,
8.3% for WHZ in children of 48-60 months of age, and 13.5% were less than one year old for
BAZ .
Children of parents (fathers and mothers) with the lowest educational level (illiterate or with
a limited ability to read and write) had the highest percentages of malnourishment (below -2
and above 2 Z scores) for almost all the anthropometric measures studied: for fathers, WHZ
7.2% and 18.9%, HAZ 20% and 6.7% , BAZ 9.4% and 16.1% respectively, and WAZ 9.4%
( for below -2 SD ) and the rates according to mothers’ education were, WHZ 6.7% and
21.2%, HAZ 24% and 7.8% , BAZ 7.8% and 19.0% respectively, and WAZ 8.9% (for
below -2 SD ). The lowest rates were found among children with parents of higher
educational levels .
Undernutrition (below -2 Z score) had higher rates among children of unemployed mothers
(housewives) for all the indices ( WHZ 5.4%, HAZ 18.4%, WAZ 7.7% and BAZ 6.6%) while

European Journal of Biology and Medical Science Research
Vol 4, No.4, pp.1-24, September 2016
Published by European Centre for Research, Training and Development UK (www.eajournals.org)
12
ISSN 2053-406X(Print), ISSN 2053-4078(Online)
those with >2 SD were estimated to have higher rates among employed mothers for WHZ
and WAS (17.7% and 8.4% respectively).
A significant association was found between the HAZ of the children and their fathers’
occupations and those of HAZ <-2 SD represented 19.2% among the self-employed while
>2 SD accounted for 7.0% among governmental employed fathers.
For almost all anthropometric measures studied, children from extended families were found
to have higher rates of malnutrition (below -2 and above 2 SD): WHZ (7.6% and 20.0%),
HAZ (20.7% and 11.0% ), and BAZ (8.3% and 19.3% ) respectively, and the rate of children
with <-2 SD for WAZ was 8.3% , with a significant association between family structure and
WAZ indicator (P=0.002) .
Children from larger families had higher rates of undernutrition (<-2 SD), HAZ was 18.0% ,
WAZ 9.0% , and BAZ 6.6%, while those from smaller families had higher percentages of
>2 Z scores for WHZ (17.8%) , WAZ (6.4%) , and BAZ (15.5%).
Children of more than two years of age constituted 24.1% of the sample , and Table-4 shows
the mean Z scores of anthropometric measures ( WHZ , HAZ , WAZ and BAZ ) of those
children according to some nutritional and life style variables. Although not significant, the
means of all the four indices were higher among children who, were breast fed during the
first year of life, started solid food at or after six months of age, ate sweet food or fruit and
vegetables three times or more per day, drank water three times or more per day, slept for
nine hours or more per day, and did not watch TV.
Table-4- Mean anthropometric measurements of children 2 years up to 5 years of age
according to feeding patterns and lifestyle characteristics.
N WHZ
Mean
SD
p-
value
HAZ
Mean
SD
p-
value
WAZ
Mean
SD
p-
value
BAZ
Mean
SD
p-
value
BF during
1st year
No 122 .4758
1.4622
0.24 -.6742
-1.4310
0.38 -.0217
-1.1882
0.13 .5675
1.5469
0.33
Yes 24 .9513
1.1932
-.2387
-1.2901
.5096
1.1166
.9848
1.1454
* Age
of starting
added food
<6
months
124 .4855
1.4017
0.25 -.6060
-1.3950
0.94 .0201
1.2389
0.35 .5689
1.4521
0.28
≥ 6 22 .8673
1.5649
-.5809
-1.5256
.2768
.81681
.9418
1.7101
Eat night
meal*

European Journal of Biology and Medical Science Research
Vol 4, No.4, pp.1-24, September 2016
Published by European Centre for Research, Training and Development UK (www.eajournals.org)
13
ISSN 2053-406X(Print), ISSN 2053-4078(Online)
Yes 31 .7803
1.3283
0.29 -.9171
-1.2311
0.16 -.0087
-1.0552
0.72 .8487
1.3440
0.35
No 115 .4790
1.4530
-.5173
-1.4475
.0770
1.2228
.5648
1.5310
Eat
sweet*
<3 times 38 .3247
1.3489
0.28 -.7118
-1.2835
0.58 -.0955
-1.1837
0.35 .4363
1.3831
0.37
3+ 108 .6198
1.4535
-.5636
-1.4555
.1131
1.1878
.6915
1.5308
Eating
fruits or
Vegetables
*
<3 times 36 .3189
1.3651
0.28 -.7397
-1.2929
0.50 -.1150
-1.2133
0.31 .4328
1.3957
0.38
3+ 110 .6164
1.4469
-.5572
-1.4489
.1156
1.1773
.6880
1.5248
Drinking
water*
<3 times 33 .2767
1.3683
0.23 -.7745
-1.2444
0.43 -.1591
-1.1329
0.23 .3927
1.4174
0.31
3+ 113 .6208
1.4420
-.5519
-1.4560
.1224
1.1988
.6929
1.5142
Sleeping
hours*
<=8 91 .5152
1.4666
0.76 -.6432
-1.4730
0.65 -.0032
-1.1059
0.42 .5918
1.5706
0.73
9+ 55 .5891
1.3748
-.5344
-1.3093
.1613
1.3126
.6802
1.3683
Watching
TV**
No 17 .6406
1.34054
0.73 -.3388
-1.6854
0.68 .2935
1.2397
0.53 .7212
1.4241
0.82
≤ 3 hours 52 .4156
1.3536
-.6885
-1.1893
-.0646
-1.2909
.5206
1.3599
4+ 77 .6075
1.5058
-.6021
-1.4917
.0903
1.1042
.6744
1.6046
*student t-test
** ANOVA
Anthropometric measures of children below two years of age, who represented 75.9% of the
total children,were studied in relation to certain nutritional and maternal variables (Table-5- ).

European Journal of Biology and Medical Science Research
Vol 4, No.4, pp.1-24, September 2016
Published by European Centre for Research, Training and Development UK (www.eajournals.org)
14
ISSN 2053-406X(Print), ISSN 2053-4078(Online)
Although not significant, it is worth noting the mean values of the four nutritional indices (
WHZ, HAZ, WAZ, BAZ) among children who were bottle or mixed fed during the first six
months of their lives were higher than those of breast fed children for the same period. On the
other hand, the means were significantly higher among children who ate solid food before six
months of age, than those who started after six months of age or who never started yet. The
difference in the means was highly significant for the WAZ and BAZ scores.
The weight for the age Z score means of children who eat sweet food, fruit or vegetables
were significantly higher than those who do not, although the means of other indices ( WHZ,
WAZ, and BAZ ) were also higher but the difference was not significant.
In spite of no significant difference in the Z score means regarding sleeping hours, the
ranking of the child in the family, the history of the children’s mothers antenatal care,
complications during pregnancy, and the type of delivery, the results of this study revealed
that for all the anthropometric measures studied the Z score means were higher among
children ranking less than 3, and if their mothers had complications during pregnancy or the
child was delivered by caesarean section.
Table -5- Mean anthropometric measurements of under 2 year children in relation to
nutritional and maternal factors
N WHZ
Mean
SD
P-
valu
e
HAZ
Mean
SD
P-
valu
e
WAZ
Mean
SD
P-
value
BAZ
Mean
SD
P-
value
Feeding
during 1st
Six
months**
Breast
feeding
133 .4651
1.5981
0.63 -.4179
1.7606
0.59 -.0266
1.2418
0.42 .3041
1.5278
0.42
Bottle
feeding
160 .4928
1.6003
-.2822
1.6524
.1633
1.3513
.4534
1.6751
Mixed
feeding
167 .6271
1.5449
-.4757
1.8006
.1118
1.1672
.5466
1.5694
Started
added
food*
Yes 366 .6116
1.4293
0.04 -.2959
1.6103
0.02 .2605
1.0968
<0.01 .5973
1.5091
<0.01
No 94 .2298
2.0380
-.7647
2.1296
-.5752
1.5777
-.1522
1.7788
Age
Started
European Journal of Biology and Medical Science Research
Vol 4, No.4, pp.1-24, September 2016
Published by European Centre for Research, Training and Development UK (www.eajournals.org)
15
ISSN 2053-406X(Print), ISSN 2053-4078(Online)
added
food**
None 94 .2357
2.0279
0.04 -.7817
2.1247
0.04 -.5747
1.5693
<0.01 -.1377
1.7749
<0.01
<6 months 296 .6682
1.3371
-.2987
1.5179
.3042
1.0962
.6603
1.3990
>= 6 70 .3661
1.7702
-.2535
1.9639
.0845
1.0933
.3177
1.9055
Eat sweet*
Yes 161 .5042
1.4246
0.77
-.1957
1.4588
0.08
.2937
1.0938
0.01
.5650
1.5494
0.23
No 299 .5493
1.6567
-.4972
1.8634
-.0201
1.3223
.3790
1.6176
Eating
fruits or
Vegetables
*
Yes 169 .5386
1.4592
0.96 -.2579
1.5056
0.21 .2771
1.0921
0.01 .5931
1.5681
0.13
No 291 .5306
1.6454
-.4694
1.8561
-.0191
1.3301
.3576
1.6065
Sleeping
hours**
<=8 52 .4413
1.4621
0.88 -.0637
1.8522
0.26 .2958
.9316
0.25
.4633
1.6645
0.83
9-12 364 .5522
1.5123
-.4103
1.7063
.0870
1.2442
.4584
1.5166
13+ 44 .4882
2.1727
-.6252
1.8348
-.1314
1.6155
.3030
2.1036
Rank of
Child*
<3 403 .5457
1.5568
0.66 -.3771
1.6686
0.63 .1206
1.2507
0.16 .4733
1.5771
0.29
3+ 57 .4474
1.7323
-.4949
2.1740
-.1288
1.2742
.2377
1.7159
Antenatal
care*
European Journal of Biology and Medical Science Research
Vol 4, No.4, pp.1-24, September 2016
Published by European Centre for Research, Training and Development UK (www.eajournals.org)
16
ISSN 2053-406X(Print), ISSN 2053-4078(Online)
Yes 19 .0095
2.0305
0.14 -.2826
2.1623
0.78 -.1289
1.0375
0.44 .0805
2.1029
0.31
No 441 .5561
1.5545
-.3964
1.7191
.0991
1.2636
.4598
1.5705
Complicati
ons during
Pregnancy
*
Yes 26 .8131
1.5551
0.35 -.1069
2.0813
0.39 .4004
1.1037
0.194 .6527
1.5194
0.49
No 434 .5168
1.5795
-.4088
1.7154
.0711
1.2621
.4316
1.6001
Type of
Delivery*
Vaginal
delivery
428 .5083
1.5904
0.21 -.4007
1.7328
0.69 .0681
1.2628
0.18 .4215
1.6098
0.27
Cesarean
section
32 .8716
1.3782
-.2712
1.8147
.3791
1.1211
.7469
1.3653
*student t-test
** ANOVA
DISCUSSION
According to the WHO malnutrition classification (Table-1), the rates of wasting, stunting
and being underweight in the current study are within the poor/medium category. Data from
the Central Organization of Statistics regarding the multiple indicator cluster survey (MICS)
in Iraq showed that the rates of wasting and being underweight in children under five year for
the years 1991, 2000, 2003, 2004, and 2006 are comparable to this study (5.28% and 7.43%
respectively) but the rate of wasting in MICS 2011(7.4%) was higher. The stunting rate
among children in the current study (16.17%) was lower than the MICS national figures
(range 20-33.7%). Being overweight and obesity in this study showed higher rates (17.49%
for WHZ and 15.35% for BAZ) than Iraqi national figures (WHO 2014).
Two studies in Iran, a neighboring country, conducted in 2013 and 2014, showed lower rates
in stunting (12.5% and 9.53%). The first Iranian study showed a similar rate of being
underweight (7.5%) and lower rate of wasting (4.4%), while the second showed higher rates
of being underweight (9.66%) and wasting (8.19%) (Kavosi et al 2014, Abolfazl 2013).
Regarding the three indicator rates of wasting , stunting and being underweight in other
neighboring countries, in 2014 lower rates were registered in Turkey and Kuwait (1.7%,
9.5%, 1.9% and 2.4%, 5.8%, and 3% respectively), and in 2012 the rates in Jordan were
(2.4%, 7.8%, 3%). The prevalence in Saudi Arabia was higher for wasting (11.8%) but lower
for stunting (9.3%) and being underweight (5.3%), while in Syria all the indicators of

European Journal of Biology and Medical Science Research
Vol 4, No.4, pp.1-24, September 2016
Published by European Centre for Research, Training and Development UK (www.eajournals.org)
17
ISSN 2053-406X(Print), ISSN 2053-4078(Online)
undernutrition in 2009 were higher than in this study (11.5%, 27.5%, and 10.1%
respectively) . In Egypt the prevalence of those indicators, according to WHO statistics, were
higher for wasting (9.5%) and stunting (22.3%) but similar for being underweight (7.0%)
(WHO 2014).
The rates of being underweight and stunting in the current study are lower than countries of
the Far East except Thailand, which had slightly lower rates (being underweight 7% and
stunting 15.7%) (WHO 2015).
The rates of being underweight and stunting in this study were lower than those of studies in
Cameroon in 2014 and Kenya in 2011, except for wasting which was higher than in those
studies (Nolla 2014, Olack 2011). A study in Bangladesh (2011) showed higher rates than in
the current study regarding the three indicators of undernutrition (Siddiqi, Haque and Goni
2011).
Male children had higher rates of malnutrition than females for all anthropometric indices in
both urban and rural areas. The lower Z scores prevalence for BAZ and WHZ (wasting)
were significantly higher among males than females in urban residences, and similar results
were seen in another study in Cameroon in 2014 (Nolla 2014). A study in Kenya (2011) also
concluded that under-five male children are more likely to become stunted than their female
counterparts (14). Different studies have suggested that boys are more influenced by
environmental stress than girls (15) and that male children are more vulnerable to early
childhood disease and health problems. This is in addition to the supportive findings of male
gender as a risk factor of malnutrition ( Kavosi et al 2014, Olack 2011, Makoka 2013).
A study in India in 2003 showed a higher proportion of female children had normal
weight/age and weight/height ratios than their male counterparts. This is in accordance with
the reports from the South Asian countries, which have shown that there was no sex
difference in the nutritional status of preschool children 9 (Lakshmi et al 2003).
The current study showed rates of malnutrition among children from rural areas were higher
than those of urban children. This finding was similar to that of a study on malnutrition in
children under-five in Bangladesh (Siddiqi, Haque and Goni 2011). Several studies reported
that a high prevalence of under-nutrition in rural areas may be the result of low education
levels, low social ranking, poor water supply, and a high incidence of infectious disease
(Kavosi et al 2014). Women in urban areas had better access to nutritional information and
are more educated than mothers in rural areas, are more aware of the benefits of immunizing
children against diseases, the importance of taking children to health clinics, feeding children
at the appropriate times and in the right quantities (Kavosi et al 2014, Siddiqi, Haque and
Goni 2011, Makoka 2013).
The highest rates of children with below -2 Z scores were among those aged 2-11 months.
Similar to findings by Olack B et al. in which moderate wasting was most prevalent among
children aged 6-11 months (Olack 2011). A small rise in the prevalence of undernutrition in
children aged between three and six months is seen with the early introduction of milk
substitutes and there is higher morbidity in the 3-6 months age group. A further rise in the

European Journal of Biology and Medical Science Research
Vol 4, No.4, pp.1-24, September 2016
Published by European Centre for Research, Training and Development UK (www.eajournals.org)
18
ISSN 2053-406X(Print), ISSN 2053-4078(Online)
undernutrition rate between six and twelve months is seen if there is too late an introduction
or an inadequate amount of complementary feeds for children (WHO 2015, Olack 2011).
The current study found children with poorly educated mothers and fathers to suffer more
from malnutrition than those with parents with a higher level of education, which is in
agreement with the findings of Siddiqi et al. Another result reported by this study is that the
rates of all types of undernutrition were higher among housewives (unemployed mothers)
which may be explained by their lower educational level than employed mothers. Educated
parents have a major contributing role to the better health and nutritional status of their
children. Illiterate or poorly educated mothers are less aware that child feeding, care giving
practices, and health seeking are important for the development of child nutritional status. A
father’s education may also affect a child’s nutritional status since he is responsible for the
family resources such as income and food. Therefore, improving socio-economic conditions
along with mothers’ literacy and preventing infections through personal hygiene might help
to improve the nutritional status of children ( Kavosi et al 2014, Siddiqi, Haque and Goni
2011, Makoka 2013, Meshram et al 2012).
Childhood malnutrition rates were higher among extended families with a larger family size
especially being underweight, which was significantly associated with family type and this
finding was similar to previous studies (Meshram et al 2012, Mahyar et al 2010). In a larger
family the susceptibility of children to malnutrition may increase as a result of a decrease in
food intake and accessibility to health care ( Kavosi et al 2014, Meshram et al 2012, Mahyar
et al 2010, Jayant et al 2010).
The rates of anthropometric indices of >2 SD like overweight and obesity were higher
among children from smaller families.
Children in this study were studied in relation to some nutritional and lifestyle factors after
they were divided into two groups; below two years and from two up to five years because of
the growth and developmental differences between these two age groups. Physical growth
and bodily changes are rapid and profound in the first two years as infants (birth to age one)
and toddlers (ages one to two) grow quickly (Cliffsnotes 2016). Over 800,000 children's
lives could be saved every year among children under five, if all children aged 0-23 months
were optimally breastfed (WHO. Infant and young child feeding 2016) (ref2).
The results regarding children from two up to five years revealed that those who were breast
fed for the first year of life and those who started solid food at six months or later, have a
better nutritional status with a higher Z score means of all anthropometric measurements in
the current study. Early introduction to complementary feeding was associated with a lower
weight-for-age and increased risk of respiratory infection in a study carried out in Zambia
(Katepa-Bwalya 2015). Breastfeeding and the weaning of an infant are not only crucial for
optimal growth and development but also are important determinants of future physical and
mental well being because of rapid growth spurts and the development of organs and tissues
during the first year of life. Malnutrition is often associated with inappropriate feeding
practices occurring during the first year of life (Jayant et al 2010, Katepa-Bwalya 2015).

European Journal of Biology and Medical Science Research
Vol 4, No.4, pp.1-24, September 2016
Published by European Centre for Research, Training and Development UK (www.eajournals.org)
19
ISSN 2053-406X(Print), ISSN 2053-4078(Online)
Rapid growth and development takes place during the preschool years, from age two to five.
At this age a child grows about two to three inches and gains four to five pounds each year.
Proper nutrition and opportunities to play and be physically active are critical to ensuring a
child grows properly (Serrano 2013). The results of our study revealed no significant
association between TV watching hours and the nutritional status of children over two years
of age, although higher Z score means were estimated among those who did not watch TV
which is similar to a finding in another study which suggested that among preschool-aged
children, TV viewing reduced energy intake during meals and snacks for some children. The
results also showed that although recent studies found that eating while watching TV is
linked to increased weight status in children, they did not find any significant association
with weight status (Serrano 2013, Francis and Birch 2006) .
Preschool children (from two up to five years) in our study who consumed fruit and
vegetables more frequently had a higher mean of anthropometric indices which may reflect a
higher dietary diversity with a greater likelihood of meeting the Recommended Dietary
Allowances (RDA) for all nutrients. In addition, low food variety in preschool children’s
diets may translate into poor nutritional status (Walingo and Ekesa 2013). This study showed
that more frequent sweet food intake (such as chocolate, sweet food or drinks) was associated
with increased anthropometric means. Consumption of sweet foods may be one factor, which
contributes to being overweight (Valmórbida and Vitolo 2014).
The other group of under two year children showed a reversed result from older children
regarding the age of starting solid food as higher Z score means were found among those who
were fed complementary food earlier than the age of six months. This may be due to the fact
that nutritional aspects and growth patterns among younger children differ from those for
older ones so giving them solid food earlier than recommended may also have a different
effect on their nutritional status, and in addition they need to continue breast feeding until age
two (UNICEF Data 2016 ). Findings related to other feeding patterns like eating sweet food,
fruit, or vegetables were similar to those for children aged over two years. First and second
rank children were found to have a higher Z score mean as they may be from a smaller family
be fed and cared for more by their families and have better access to health services (Kavosi
et al). The higher means among children delivered by caesarean section (C/S) match the
results of an international prospective cohort study conducted in four developing countries
which suggested that children born by C/S have a higher probability of developing obesity
than those who were not. The risk of being obese among those born by caesarean delivery
was over twofold in early childhood, and 57% higher in late-childhood which suggests that
risk magnitudes wane over time (Carrillo et al 2015). (ref3) The relation between the
nutritional status of children under two years and maternal complications during pregnancy
could not be determined accurately in the current study because a wide range of these
complications were included i.e. diabetes, pre-eclampsia, anemia, and other medical
problems, and each of them may have a different adverse effect on a child’s nutritional status.
For BMI-for-age (BAZ) and WHZ, the results from this research found that the prevalence of
being overweight and obesity was higher among the rural children. This finding was

European Journal of Biology and Medical Science Research
Vol 4, No.4, pp.1-24, September 2016
Published by European Centre for Research, Training and Development UK (www.eajournals.org)
20
ISSN 2053-406X(Print), ISSN 2053-4078(Online)
comparable to that by Davis et al. (2010), who explained that this might be due to the fact
that rural children do not engage in physical activity as much as urban children (Davis et al
2010).
A concomitant presence of both over and undernutrition were estimated at higher rates
among children aged under five with low-educated parents (illiterate or with a limited ability
to read and write) in our study. Stunting and being overweight rates were both higher among
rural children. These results are comparable to those of a study by Rihlat et al. who found that
low socioeconomic level is associated with the coexistence of overweight and stunting. They
also found that lower maternal education is an independent risk factor for a child to be
overweight-stunted (Rihlat 2009).
In general this study showed the rates of being overweight and obesity were higher than that
of undernutrition – a finding which may be comparable to the current global situation as the
prevalence of stunting in children before the age of five years has decreased over the last
decade. During the same period a steady rise in preschool being overweight has been
reported, which may indicate that stunting and being overweight are found at the same time
(Black et al 2013, de Onis , Blossner and Borghi 2010).
Being overweight and underweight among under five year-old children in the current study
may be considered as evidence to indicate that the Double Burden of Malnutrition (DBM) is
already a concern. A concept first presented just over a decade ago, the DBM is the
coexistence of the undernutrition and overnutrition of macronutrients and micronutrients
across the life course of the same population, community, family, and even individual. Of
particular concern is the life course dimension of the DBM, or the link between maternal and
fetal undernutrition, and an increased susceptibility to overnutrition and diet-related non
communicable diseases later in life (The World Bank 2013).
The highest rates of both stunting and being overweight were found among infants below one
year of age in the current study. The foetal and neonatal development of children could be
affected by early maternal biological changes, even if the mother lives in a healthy
environment, which may predispose the child to a higher risk of being overweight later. The
intergenerational effect hypothesis is a complementary way to understand the coexistence of
being overweight and stunting in children and should be explored to gain a better
understanding of the individual dual burden in children (Said-Mohamed et al 2012).
CONCLUSIONS
Prevalence of wasting, stunting and being underweight in the current study are within the
poor/medium level according to WHO classification. The rates of being overweight and
obesity were higher than that of undernutrition, a finding which may be comparable to the
current global prevalence. The progress of being overweight may reveal the beginning of the
nutritional transition process.

European Journal of Biology and Medical Science Research
Vol 4, No.4, pp.1-24, September 2016
Published by European Centre for Research, Training and Development UK (www.eajournals.org)
21
ISSN 2053-406X(Print), ISSN 2053-4078(Online)
Factors associated with undernutrition in under five year-old children are especially related to
lower socio-economic status such as rural residence, lower maternal education, an
unemployed mother, and an extended family with a larger family size. Other factors are male
gender and infants below one year. Higher Z score means were found among older children
(above two years) who were breast fed for the first year of life, those who started solid food
at six months or later, and those who consumed fruit, vegetables and sweet food more
frequently. The findings in the first two years of life were different concerning
complementary food but similar for the other factors.
The coexistence of both being overweight and undernutrition were estimated at higher rates
among under five year-old children with poorly educated parents and rural families, and the
highest rates of both stunting and being overweight were found among infants below one year
of age. The concomitant presence of these two nutritional problems (stunting and being
overweight) may be considered as evidence to indicate that the Double Burden of
Malnutrition (DBM) is already a concern.
REFERENCES
Abolfazl, P., Azadeh, S., Mohammad, S., Hamed, T., and Zahra, Z. (2013) Prevalence of
Malnutrition among Preschool Children in Northeast of Iran, A Result of a Population
Based Study. Global Journal of Health Science, 5(2), p.208.
Black, R.E., Victora, C.G. Walker, S.P., Bhutta, Z.A., Christian, P., de Onis, M., et al.
Maternal and child undernutrition and overweight in low-income and middle-income
countries. Lancet. 2013 Aug 3;382(9890) pp.427-51. PubMed PMID: 23746772. 4.
Carrillo-Larco, R.M., Miranda, J. J., and Bernabé-Ortiz, A. Delivery by caesarean section
and risk of childhood obesity: analysis of a Peruvian prospective cohort. Peer J. 2015;
3: e1046.
Cliffsnotes, 2016. Developmental Psychology Study Guides.Pphysical Development: Age 0–
2 .Available at: http://www.cliffsnotes.com/
Das, S. and Rahman, R. M. Application of ordinal logistic regression analysis in determining
risk factors of child malnutrition in Bangladesh. Nutrition Journal, 10, (124), p.2011.
Davis, A. M, Bennet, K. J., Befort, C. and Nollen N., 2010. Obesity and Related Health
Behaviors among Urban and Rural Children in the United States: Data from the
National Health and Nutrition Examination Survey 2003-2004 and 2005- 2006. J.
Pediatric Psychl., 36, pp. 669-676.
De Onis, M., Blossner, M, and Borghi, E., 2010. Global prevalence and trends of overweight
and obesity among preschool children. Am J Clin Nutr, 92(5), p.p..1257- 64. PubMed
PMID: 20861173. Epub 2010/09/24.
Demographic and Health Surveys. Dar es Salaam, Tanzania: NBS and ICF Macro, 2011.
dhsprogramme.com/pubs/pdf/FR243/FR243%5B24June2011%5D.pdf
Francis, L. and Birch, L.L., 2006. Does Eating during Television Viewing Affect Preschool
Children’s Intake? J Am Diet Assoc., 106(4) p.p. 598–600.
Grieken, A.V., Renders, C.M., Wijtzes A.I., Hirasing, R.A., and Raat H. Overweight, obesity
and being underweight is associated with adverse psychosocial and physical health
European Journal of Biology and Medical Science Research
Vol 4, No.4, pp.1-24, September 2016
Published by European Centre for Research, Training and Development UK (www.eajournals.org)
22
ISSN 2053-406X(Print), ISSN 2053-4078(Online)
outcomes among 7-year-old children: the “be active, eat right” study”. PLoS ONE, 8(6),
Article ID e67383, 2013.
Grummer-Strawn, L.M., Reinold, C., and Krebs, N.F. Use of World Health Organization and
CDC Growth Charts for Children Aged 0-59 Months in the United States. Morbidity
and Mortality Weekly Report. MMWR, 59(36) p.1184 . http://www.cdc.gov/,2010.
(Accessed 14 May 2016).
Jayant, D. D., Purushottman, A. G., Deepak, B. Ph., Vaishali, D. Ph, Piyush, K., Aarif, S. M.
M., 2010. Sociocultural practices in relation to breastfeeding, weaning and child rearing
among Indian mothers and assessment of nutritional status of children under five in
rural India. Australasian Medical Journal, 3(9), p.p. 618-624.
Katepa-Bwalya, M., Mukonka, V., Kankasa, C., Masaninga, F., Babaniyi, O. and Siziya,
S., 2015. Infants and young children feeding practices and nutritional status in two
districts of Zambia. Int Breastfeed J, 10(5).
Kavosi, E., Rostami, Z. H.,
Kavosi, Z.,
Nasihatkon, A.,
Moghadami, M.
and Heidari, M.,
2014. Prevalence and determinants of under-nutrition among children under six: a
cross-sectional survey in Fars province. Iran. Int J Health Policy Manag., 3(2) p.p. 71-
76.
Lakshmi A J, Begum K, Saraswathi G AND Prakash J. Nutritional status of rural preschool
children – Mediating factors. The Journal of Family Welfare, 2003 Vol. 49, No. 2.
Mahyar, A., Ayazi, P., Fallahi, M., Javadi, T.H.S., Farkhondehmehr, B., Javadi, A. et al.,
2010. Prevalence of Being underweight, Stunting and Wasting Among Children in
Qazvin, Iran. Iranian Journal of Pediatric Society, 2, p.p. 37-43.
Makoka D. The Impact of Maternal Education on Child Nutrition: Evidence from Malawi,
Tanzania, and Zimbabwe. USAID. Demographic and health surveys, 2013, No. 84.
Meshram II, Arlappa N, Balakrishna N, Laxmaiah A, Mallikarjun Rao K, Gal Reddy Ch, et
al. Prevalence and determinants of undernutrition and its trends among pre-school
tribal children of Maharashtra State, India. J Trop Pediatr. 2012 Apr;58(2):125-32.
Meshram, I.I., Arlappa, N., Balakrishna, N., Rao, K.M., Laxmaiah, A., Brahmam, G.N.V.,
2012. Trends in the prevalence of undernutrition, nutrient and food intake and
predictors of undernutrition among under five year tribal children in India. Asia Pac J
Clin Nutr. , 21, p.p. 568-76.
Muhihi, A. Prevalence and determinants of obesity among primary school children in Dar es
Salaam, 2013.Tanzania, Public Health, 71(1), article 26.
National Bureau of Statistics (NBS) and ICF Macro. Tanzania demographic and health
survey 2010.
National Statistical Office. Malawi Demographic and Health Survey 2010, 2011. ICF Macro
Calverton, Maryland, USA. https://dhsprogramme.com/pubs/pdf/FR247/FR247.pdf
(Accessed on 28 May 2016).
Nolla, N. P., Kana Sop, M. M., Mananga, M. J., Ekoe, T., Inocent Gouado, 2014. Assessment
of nutritional status of preschool children in the Bangang rural community. Cameroon.
International Journal of Biotechnology and Food Science , 2(2), p.p. 44-52.
European Journal of Biology and Medical Science Research
Vol 4, No.4, pp.1-24, September 2016
Published by European Centre for Research, Training and Development UK (www.eajournals.org)
23
ISSN 2053-406X(Print), ISSN 2053-4078(Online)
Nutrition Research Institute Iraq. Food Fortification/wheat flour fortification.
www.ffinetwork.org/about/calendar/2014/.../QIraq, 2014. (Accessed on 25 May 2016).
Olack, B., Burke, H., Cosmas, L., Bamrah, S., Dooling. K., Feikin, D. R., Talley, L.
E., and Breiman, R. F., 2011. Nutritional Status of Under-five Children Living in an
Informal Urban Settlement in Nairobi, Kenya. J Health Popul Nutr., 29(4), p.p. 357-
363.
Park, S. E., Kim, S., Ouma, C., Loha, M., Wierzba, T. F., and Beck, N. S., 2012. Community
management of acute malnutrition in the developing world. Pediatric
Gastroenterology, Hepatology & Nutrition, 15(4), p.p. 210-219.
Rihlat, S. M., Allirot, X., Sobgul, M., Pasquet, P., 2009. Determinant of overweight
associated with stunting in preschool children of Yaounde, Cameroon. Annals of human
biology, 36(2), p.p. 146-61.
Said-Mohamed, R., Bernard, J. Y., Ndzana, A, and Pasquet, P., 2012. Is Overweight in
Stunted Preschool Children in Cameroon Related to Reductions in Fat Oxidation,
Resting Energy Expenditure and Physical Activity? journals.plos.org/plosone/article.
Serrano, E., 2013Healthy Eating for Children Ages 2 to 5 Years Old: A Guide for Parents and
Caregivers. Virginia cooperative extension. Virginia Tech Virginia state University.
Publication 348-150.
Sharghi, A., Kamran A., and Faridan, M., 2011. Evaluating risk factors for protein-energy
malnutrition in children under the age of six years: a case-control study from Iran.
International Journal of General Medicine, 4, p.p. 607-611.
Siddiqi, N. A., Haque, N, Goni, A., 2011. Malnutrition of Under-Five Children: Evidence from
Bangladesh. Asian Journal of Medical Sciences, p.p. 113-119.
The World Bank, 2013. The double burden of malnutrition in Indonesia. www-
wds.worldbank.org/. (Accessed on 31 May 2016).
UNICEF Data: Monitoring the Situation of Children and Women, 2016.
http://data.unicef.org/nutrition/malnutrition.html#sthash.etUl6Vem.dpuf
UNICEF statistics. Child nutrition. Updated March 2016. http://data.unicef.org/index-2.html,
2015.
UNICEF, 2015. UNICEF Data: Monitoring the Situation of Children and Women Current
Status + Progress. (updated March 2016) data.unicef.org/nutrition/malnutrition,.
(Accessed on 25 May 2016).
United Nations. The Millenium Development Goals report, 2015.
www.un.org/millenniumgoals/2015_MDG_Report/. (Accessed on 28 May 2016).
University of Baghdad. Lecture on healthy nutrition and nutritional status in Iraq.
http://en.uobaghdad.edu.iq/uploads/Uobheader/1.jpg, 2014. (Accessed on 25 May
2016).
Valmórbida, J. L. and Vitolo, M. R., 2014. Factors associated with low consumption of fruits
and vegetables by preschoolers of low socio-economic level. J Pediatr (Rio J), 90(5),
p.p. 464-471.
Walingo, M. K. and Ekesa, B. N., 2013. Nutrient Intake, Morbidity and Nutritional Status of
Preschool Children are Influenced by Agricultural and Dietary Diversity in Western
Kenya. Pakistan Journal of Nutrition, 12 (9), p.p. 854-859.

European Journal of Biology and Medical Science Research
Vol 4, No.4, pp.1-24, September 2016
Published by European Centre for Research, Training and Development UK (www.eajournals.org)
24
ISSN 2053-406X(Print), ISSN 2053-4078(Online)
Wang, Y. and Chen, H.J., 2012. Use of Percentiles and Z -Scores in Anthropometry.
Handbook of Anthropometry: Physical Measures 29 of Human Form in Health and
Disease. Springer Science+Business Media, LLC.
www.springer.com/cda/content/.../9781441917874-c1.pdf (Accessed on 28 May 2016).
WHO. Child growth standards: methods and development. Geneva: World Health
Organization, 2006. pp. 306-7.
WHO. Global Database on Child Growth and Malnutrition, 2016.
WHO. Infant and young child feeding, 2016. who.int/mediacentre/factsheets/fs342/en/.
WHO. Obesity and overweight. Fact sheet. Who/ 311, 2006. World Health Organization,
Geneva.
WHO. Regional nutrition strategy: Addressing malnutrition and micronutrient deficiencies
(2011-2015). apps.searo.who.int/PDS_DOCS/B4819.pdf.
WHO: WHO child growth standards based on length/height, weight and age, 2006. Acta
Paediatr, Suppl 450, p.p. 76-85.
www.who.int/nutgrowthdb/about/introduction/en/index5.html. (Accessed on 13 June
2016).