assessingeconomicimpactsof restoration and … sensitivity and uncertainty analysis: see how...
TRANSCRIPT
Assessing economic impacts of
restoration and building a carbon
abatement curve

What does economics have to do with
restoration?
• Globally, there are more than 2 billion
hectares of degraded land.
• With this tremendous opportunity, deciding
where, when, and how landscapes should be
restored is important.
• The answers to these questions must be
formed on the basis of restoration’s expected
impacts on ecosystem goods and services.

• An ROI framework is appropriate for serving the decision making processes at the country, regional, or local level.
• Framework assesses the ecosystem service and economic impacts of forest landscape restoration to help decision makers understand trade-offs.
• Carbon abatement curves show how much carbon each transition could capture and helps decision makers offset emissions by restoring landscapes as efficiently as possible.
How can economics help?
1. Identify degraded forest landscapes and their land uses: Map landscapes in need of restoration as well as the characteristics of the landscapes.
2. Identify restoration transitions: Determine which restoration interventions could be used to restore each type of degraded land use.
3. Model and value the change in ecosystem goods and service production for each restoration transition: Calculate the net change in ecosystem goods and service production.
4. Conduct sensitivity and uncertainty analysis: See how sensitive the cost-benefit results are to changes in key variables like prices, interest rates, and biological assumptions.
Four steps in applying the ROI framework
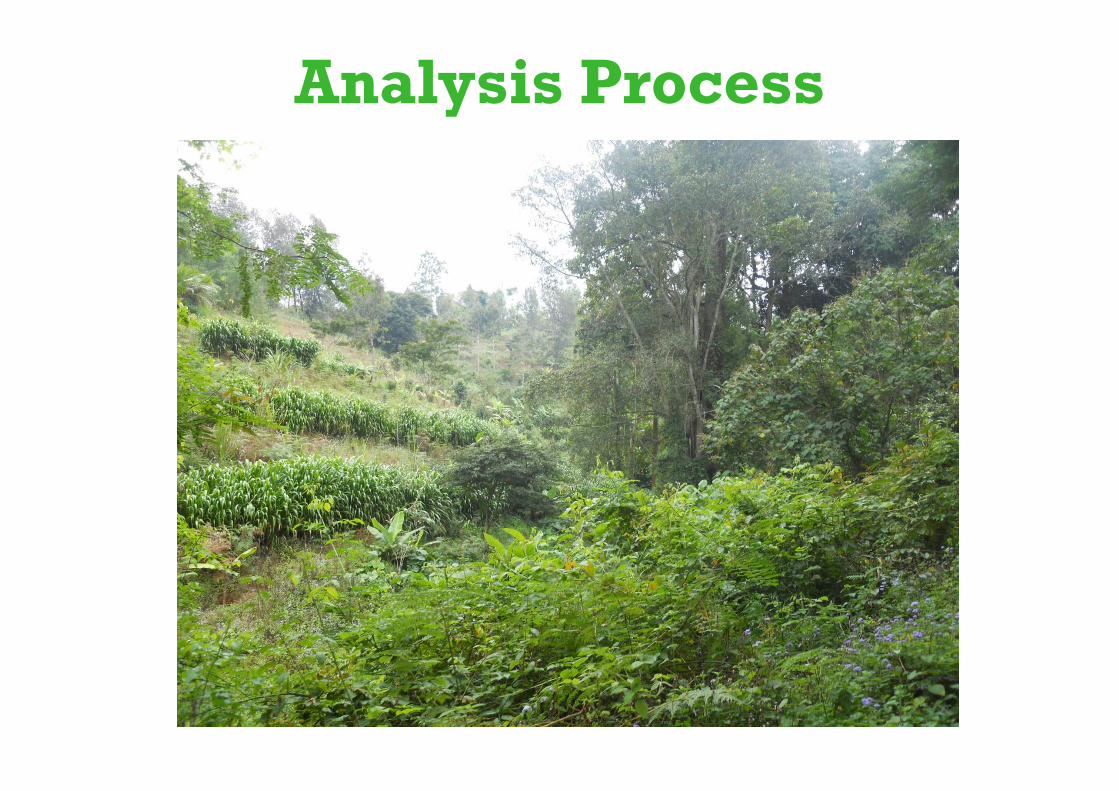
Analysis Process
• Map landscapes in need of restoration, as
well as the characteristics of the landscapes.
• Degraded landscapes should be
characterized in terms of current land uses
and land cover, weather, socio-economic
conditions, and other contextual information.
Step 1: Identify degraded forest landscapes
and their land uses

Geospatial analysis
• Geospatial analysis used to quantify
areas of degraded land use that are
also opportunity areas for forest and
landscape restoration.
• Analysis based on geospatial datasets
including elevation, slope, land cover,
forest cover, water bodies, parks and
reserves, and administrative areas.
• Five degraded categories: deforested
land, agriculture, native forest,
plantations, and farm fallow

• Determine which restoration interventions could be used to restore each type of degraded land use.
– For example, degraded agricultural land could be restored to agroforestry and
– deforested land could be restored to secondary forests through natural regeneration.
Step 2: Identify restoration transitions

Example of restoration transitions
Conventional agriculture → Agroforestry
Poorly managed woodlots → Well managed woodlots
Deforested land → Naturally regenerated forests

Define restoration transition actions
• Make relatively reliable estimates of the different technical specifications involved in
each transition
• A Multistakeholder approach
• Examples from Rwanda
• Conventional agriculture → Agroforestry
• Sale of crops is only source of revenue for agriculture
• Agroforestry would add 300 additional trees/ha to agricultural land
• Leaves from trees would be used as green manure, reducing fertilizer costs
• Rotation interval for trees is 20 years
• Poorly managed woodlots → Well managed woodlots
• Poorly managed woodlots stock 1,100 trees per hectare
• Well managed woodlots stock 1,600 trees per hectare
• After 1 year, 15% of seedlings are replanted
• After 4th year 250 trees/ha are removed for thinning
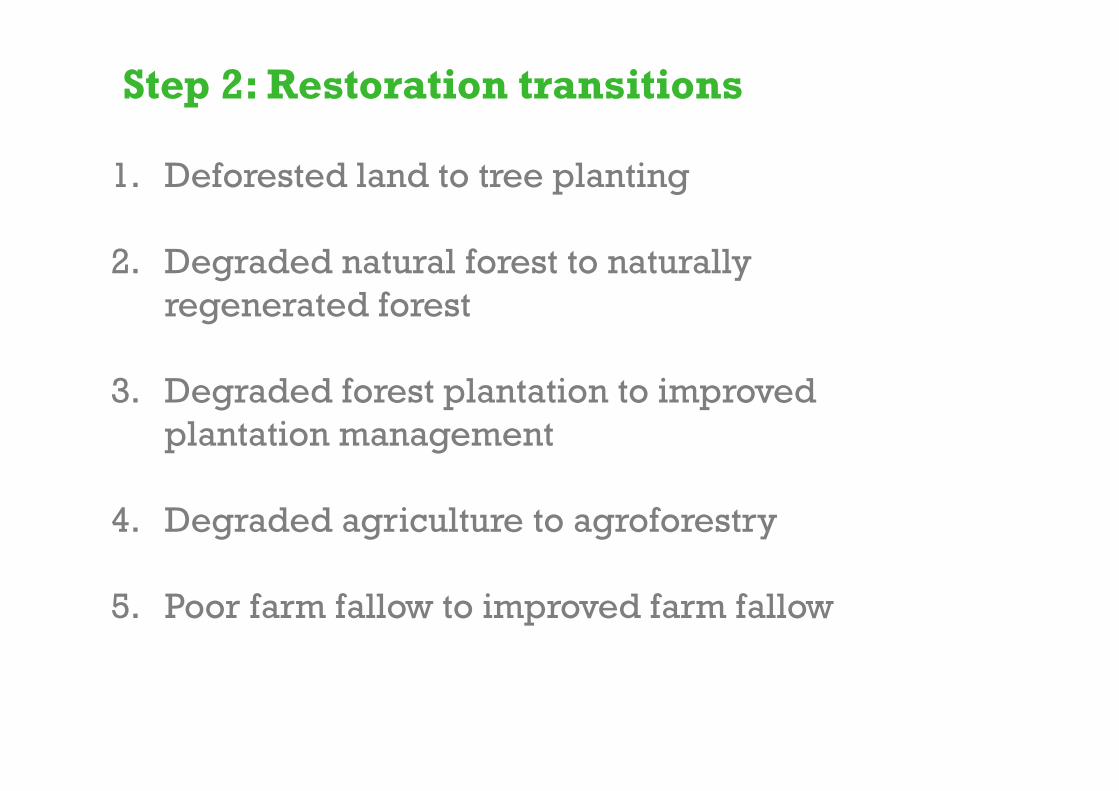
1. Deforested land to tree planting
2. Degraded natural forest to naturally
regenerated forest
3. Degraded forest plantation to improved
plantation management
4. Degraded agriculture to agroforestry
5. Poor farm fallow to improved farm fallow
Step 2: Restoration transitions

• The quantity of ecosystem services and their value can be estimated using a number of methods depending on how available biological and market data are.
• In data rich situations more accurate and advanced methods can be used, such as biological production functions.
• In data poor situations benefit-transfer techniques can be used to construct look-up tables of land-use values.
• Here we use a look-up table approach using stylized data.
Step 3: Value change in ecosystem services

• Our goal: estimate economic returns of each restoration transition and identify areas where restoration would have a large, positive impact.
• To do this: compare the value of ecosystem services gained through restoration with the costs of restoration.
• Columns [1a-1c; 2a-2c] in the look-up table are the physical units of ecosystem goods and service that can be measure in the field.
• Columns [1d-1h; 2d-2h] are the values of the ecosystem goods and services, which may be estimated from the information in [1a-1c; 2a-2c] or filled in from estimates in the peer-reviewed literature.
• Column [1i; 2i] is cost of operating each land use.
Step 3: Value change in ecosystem services

Step 3: Value change in ecosystem services –
calculate ROI with the Look-up Table and
ROI Worksheet
Biophysical
values/landscape
characteristics
Economic values based on
biophysical valuesCosts
Tree planting

1. What is the value of restoring deforested land with silviculture?
Step 3: Value change in ecosystem services – calculate ROI with the Look-up
Table and ROI Worksheet
1. Timber revenue: $4,500
Tree planting
1

Slide 15
1 Michael Verdone, 3/14/2014

1. What is the value of restoring deforested land with silviculture?
Step 3: Value change in ecosystem services – calculate ROI with the Look-up
Table and ROI Worksheet
1. Timber revenue: $4,500
2. Carbon revenue: $3,854
Tree planting
4

Slide 16
4 Michael Verdone, 3/14/2014

1. What is the value of restoring deforested land with silviculture?
Step 3: Value change in ecosystem services – calculate ROI with the Look-up
Table and ROI Worksheet
1. Timber revenue: $4,500
2. Carbon revenue: $3,854
3. Reduced erosion: $1,500
Tree planting
5

Slide 17
5 Michael Verdone, 3/14/2014

1. What is the value of restoring deforested land with silviculture?
Step 3: Value change in ecosystem services – calculate ROI with the Look-up
Table and ROI Worksheet
1. Timber revenue: $4,500
2. Carbon revenue: $3,854
3. Reduced erosion: $1,500
4. NTFPs: $500
Tree planting
6

Slide 18
6 Michael Verdone, 3/14/2014

1. What is the value of restoring deforested land with silviculture?
Step 3: Value change in ecosystem services – calculate ROI with the Look-up
Table and ROI Worksheet
1. Timber revenue: $4,500
2. Carbon revenue: $3,854
3. Reduced erosion: $1,500
4. NTFPs: $500
5. Costs: $6,950
Tree planting
8

Slide 19
8 Michael Verdone, 3/14/2014

1. What is the value of restoring deforested land with silviculture?
Step 3: Value change in ecosystem services – calculate ROI with the Look-up
Table and ROI Worksheet
1. Timber revenue: $4,500
2. Carbon revenue: $3,854
3. Reduced erosion: $1,500
4. NTFPs: $500
5. Costs: $6,950
6. NPV: $3,404
Tree planting
7

Slide 20
7 Michael Verdone, 3/14/2014

• The net present value (NPV) concept allows various sums of money to be compared over time.
• For example, $10 received a year from now would have a NPV of $9 assuming the future is discounted at a rate of 10%.
• NPV greater than zero suggests that restoring degraded landscape is a worthwhile.
• NPV less than zero suggests that restoring the degraded landscape will generate too few benefits to justify the costs.
Step 3: Value change in ecosystem services

• ROI calculates the amount of value (measured in currency) that would be generated by every dollar invested in the restoration transition.
• For example, an ROI of 0.2 means for each dollar invested $1.20 worth of ecosystem goods and services would be created.
• Private investors and private landowners want to achieve large ROIs through land use transitions
Step 3: Value change in ecosystem services

Step 3: Value change in ecosystem services – calculate
ROI with the Look-up Table and ROI Worksheet
• We repeat this exercise for every restoration
transition
• This tells us the Cost, NPV and ROI of each
transition
11

Slide 23
11 Michael Verdone, 3/14/2014
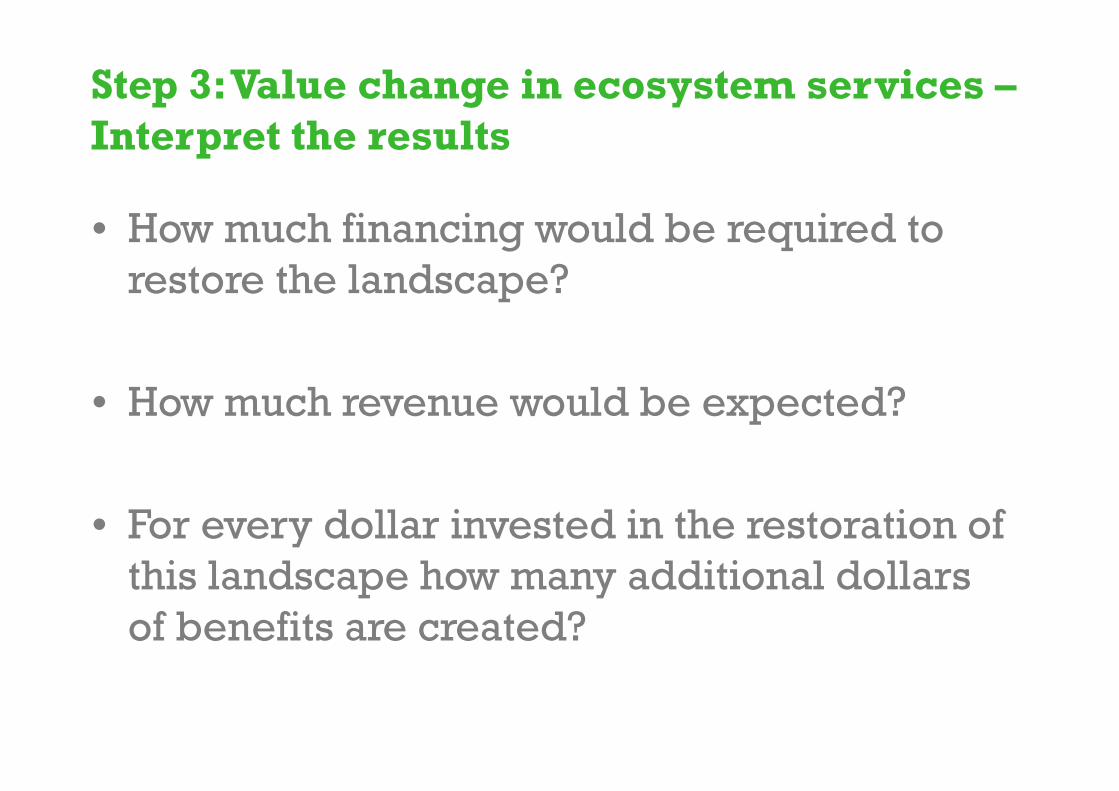
• How much financing would be required to
restore the landscape?
• How much revenue would be expected?
• For every dollar invested in the restoration of
this landscape how many additional dollars
of benefits are created?
Step 3: Value change in ecosystem services –
Interpret the results

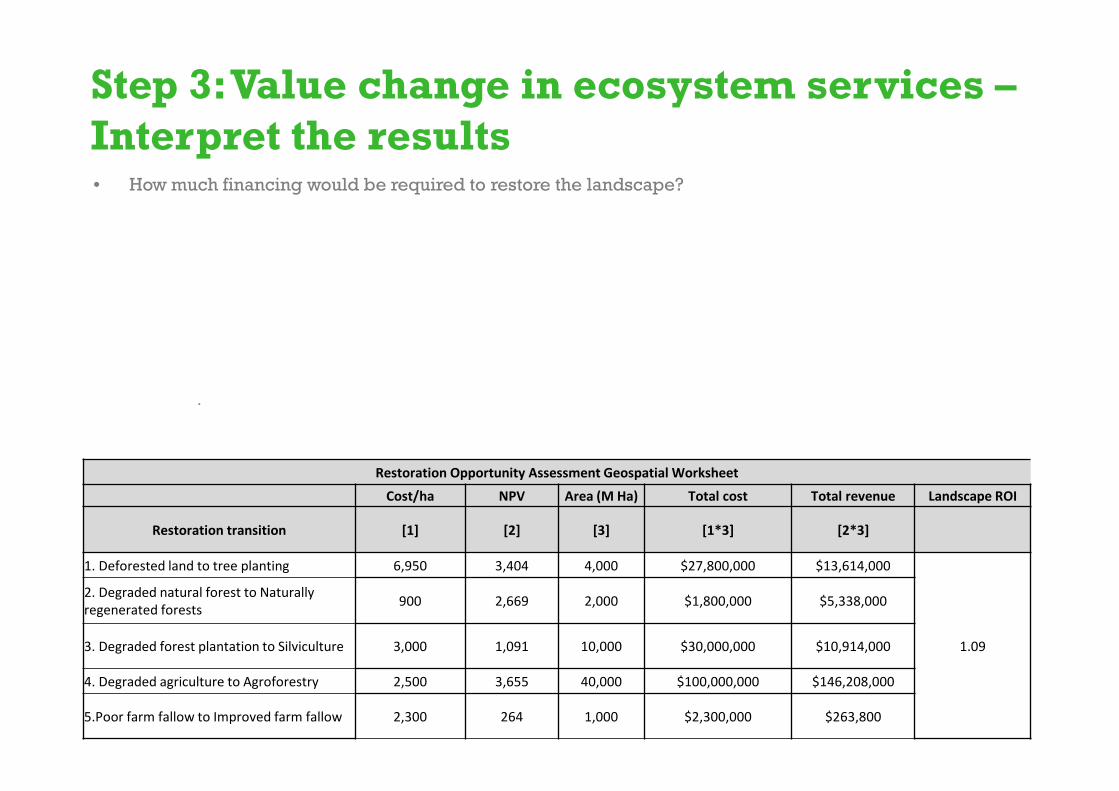
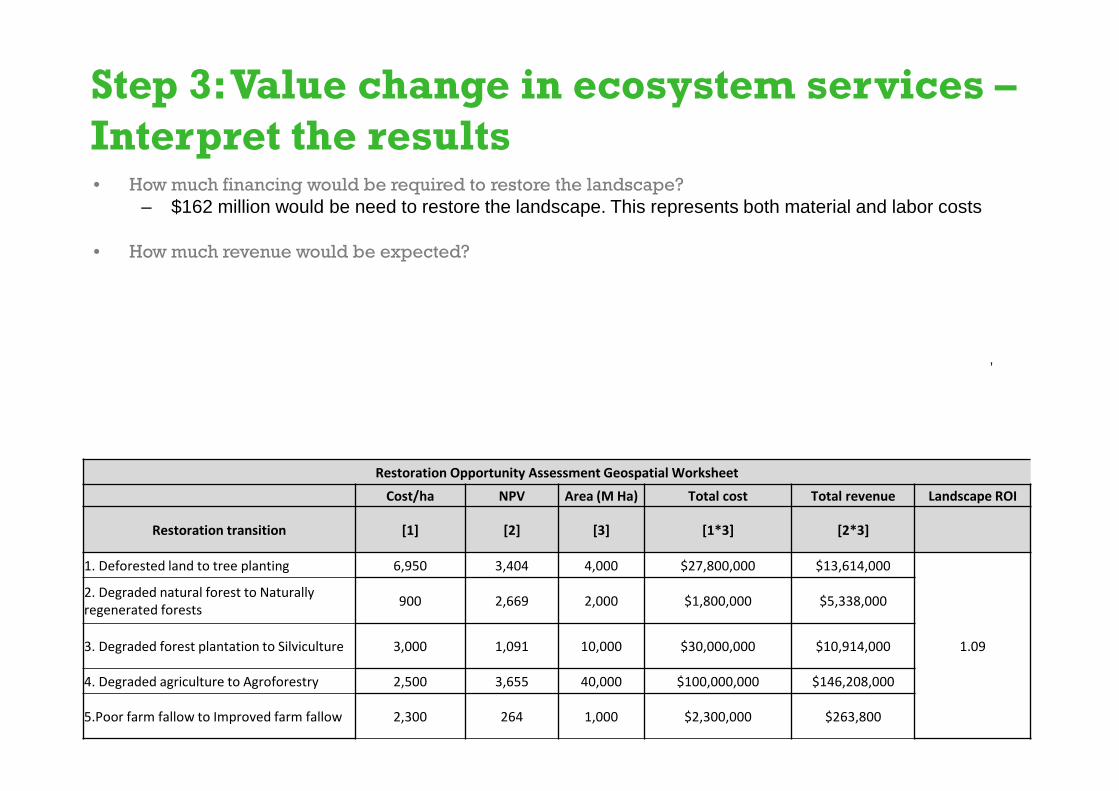
Restoration Opportunity Assessment Geospatial Worksheet
Cost/ha NPV Area (M Ha) Total cost Total revenue Landscape ROI
Restoration transition [1] [2] [3] [1*3] [2*3]
1. Deforested land to tree planting 6,950 3,404 4,000 $27,800,000 $13,614,000
1.09
2. Degraded natural forest to Naturally
regenerated forests900 2,669 2,000 $1,800,000 $5,338,000
3. Degraded forest plantation to Silviculture 3,000 1,091 10,000 $30,000,000 $10,914,000
4. Degraded agriculture to Agroforestry 2,500 3,655 40,000 $100,000,000 $146,208,000
5.Poor farm fallow to Improved farm fallow 2,300 264 1,000 $2,300,000 $263,800
9

Slide 25
9 Michael Verdone, 3/14/2014
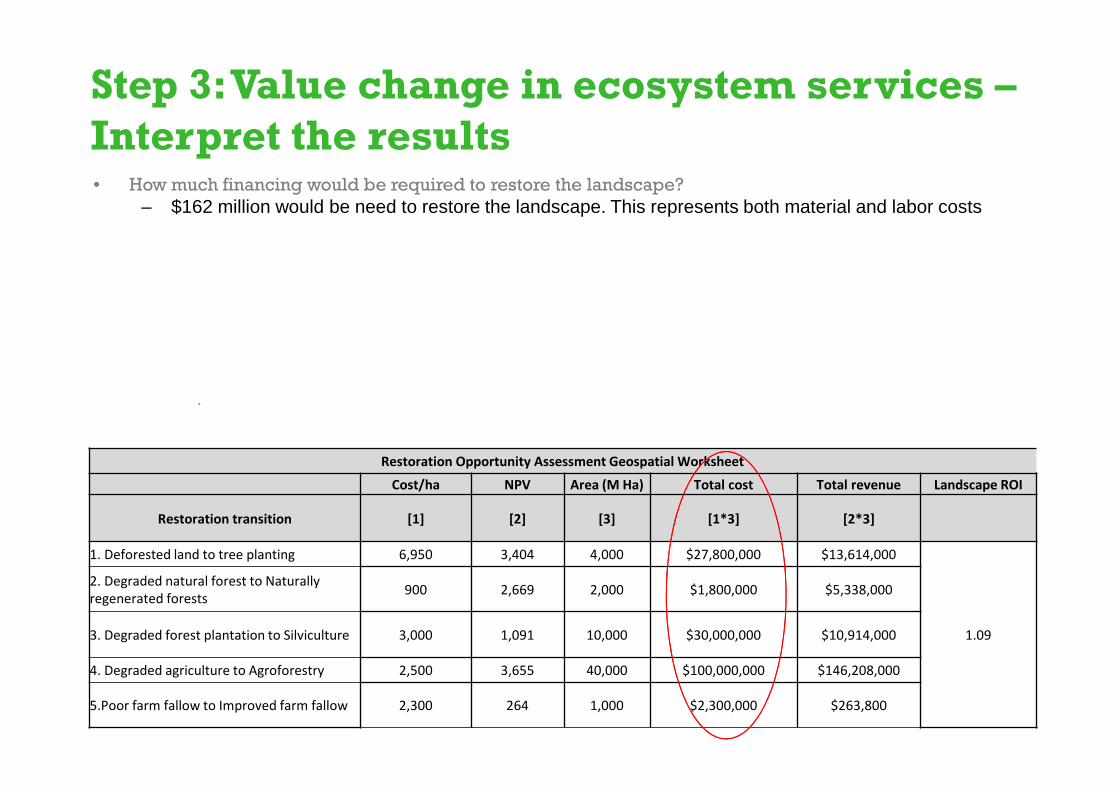
• How much financing would be required to restore the landscape?
– $162 million would be need to restore the landscape. This represents both material and labor costs
• How much revenue would be expected?
– Restoring the landscape would generate $338 million over the restoration horizon (20 – 30 years)
• For every dollar invested in the restoration of this landscape how many additional dollars of benefits are created?
– The results from the ROI framework suggest that each dollar invested in this landscape would yield $2.08 of additional benefits, including crops, timber, reduced erosion, and increased carbon sequestration.
Step 3: Value change in ecosystem services –
Interpret the results
Restoration Opportunity Assessment Geospatial Worksheet
Cost/ha NPV Area (M Ha) Total cost Total revenue Landscape ROI
Restoration transition [1] [2] [3] [1*3] [2*3]
1. Deforested land to tree planting 6,950 3,404 4,000 $27,800,000 $13,614,000
1.09
2. Degraded natural forest to Naturally
regenerated forests900 2,669 2,000 $1,800,000 $5,338,000
3. Degraded forest plantation to Silviculture 3,000 1,091 10,000 $30,000,000 $10,914,000
4. Degraded agriculture to Agroforestry 2,500 3,655 40,000 $100,000,000 $146,208,000
5.Poor farm fallow to Improved farm fallow 2,300 264 1,000 $2,300,000 $263,800
• How much financing would be required to restore the landscape?
– $162 million would be need to restore the landscape. This represents both material and labor costs
• How much revenue would be expected?
•– Restoring the landscape would generate $338 million over the restoration horizon (20 – 30 years)
• For every dollar invested in the restoration of this landscape how many additional dollars of benefits are created?
– The results from the ROI framework suggest that each dollar invested in this landscape would yield $2.08 of additional benefits,including crops, timber, reduced erosion, and increased carbon sequestration.
Step 3: Value change in ecosystem services –
Interpret the results
Restoration Opportunity Assessment Geospatial Worksheet
Cost/ha NPV Area (M Ha) Total cost Total revenue Landscape ROI
Restoration transition [1] [2] [3] [1*3] [2*3]
1. Deforested land to tree planting 6,950 3,404 4,000 $27,800,000 $13,614,000
1.09
2. Degraded natural forest to Naturally
regenerated forests900 2,669 2,000 $1,800,000 $5,338,000
3. Degraded forest plantation to Silviculture 3,000 1,091 10,000 $30,000,000 $10,914,000
4. Degraded agriculture to Agroforestry 2,500 3,655 40,000 $100,000,000 $146,208,000
5.Poor farm fallow to Improved farm fallow 2,300 264 1,000 $2,300,000 $263,800

• How much financing would be required to restore the landscape?
– $162 million would be need to restore the landscape. This represents both material and labor costs
• How much revenue would be expected?
– Restoring the landscape would generate $176 million over the restoration horizon (20 – 30 years)
• For every dollar invested in the restoration of this landscape how many additional dollars of benefits are created?
– The results from the ROI framework suggest that each dollar invested in this landscape would yield $2.08 of additional benefits, including crops, timber, reduced erosion, and increased carbon sequestration.
Step 3: Value change in ecosystem services –
Interpret the results
Restoration Opportunity Assessment Geospatial Worksheet
Cost/ha NPV Area (M Ha) Total cost Total revenue Landscape ROI
Restoration transition [1] [2] [3] [1*3] [2*3]
1. Deforested land to tree planting 6,950 3,404 4,000 $27,800,000 $13,614,000
1.09
2. Degraded natural forest to Naturally
regenerated forests900 2,669 2,000 $1,800,000 $5,338,000
3. Degraded forest plantation to Silviculture 3,000 1,091 10,000 $30,000,000 $10,914,000
4. Degraded agriculture to Agroforestry 2,500 3,655 40,000 $100,000,000 $146,208,000
5.Poor farm fallow to Improved farm fallow 2,300 264 1,000 $2,300,000 $263,800

• How much financing would be required to restore the landscape?
– $162 million would be need to restore the landscape. This represents both material and labor costs
• How much revenue would be expected?
– Restoring the landscape would generate $338 million over the restoration horizon (20 – 30 years)
• For every dollar invested in the restoration of this landscape how many additional dollars of benefits are created?
– The results from the ROI framework suggest that each dollar invested in this landscape would yield $1.09 of additional benefits, including crops, timber, reduced erosion, and increased carbon sequestration.
Step 3: Value change in ecosystem services –
Interpret the results
Restoration Opportunity Assessment Geospatial Worksheet
Cost/ha NPV Area (M Ha) Total cost Total revenue Landscape ROI
Restoration transition [1] [2] [3] [1*3] [2*3]
1. Deforested land to tree planting 6,950 3,404 4,000 $27,800,000 $13,614,000
1.09
2. Degraded natural forest to Naturally
regenerated forests900 2,669 2,000 $1,800,000 $5,338,000
3. Degraded forest plantation to Silviculture 3,000 1,091 10,000 $30,000,000 $10,914,000
4. Degraded agriculture to Agroforestry 2,500 3,655 40,000 $100,000,000 $146,208,000
5.Poor farm fallow to Improved farm fallow 2,300 264 1,000 $2,300,000 $263,800

Constructing a carbon abatement curve
• Countries who use restoration to offset emissions
want to find the least costly/most beneficial way to
do so.
• Carbon abatement curves use information on the
costs and benefits to estimate the costs/benefits of
sequestering carbon under each restoration
transition.
• The curves show how much carbon each transition
could capture if all of the restoration opportunities
were taken.

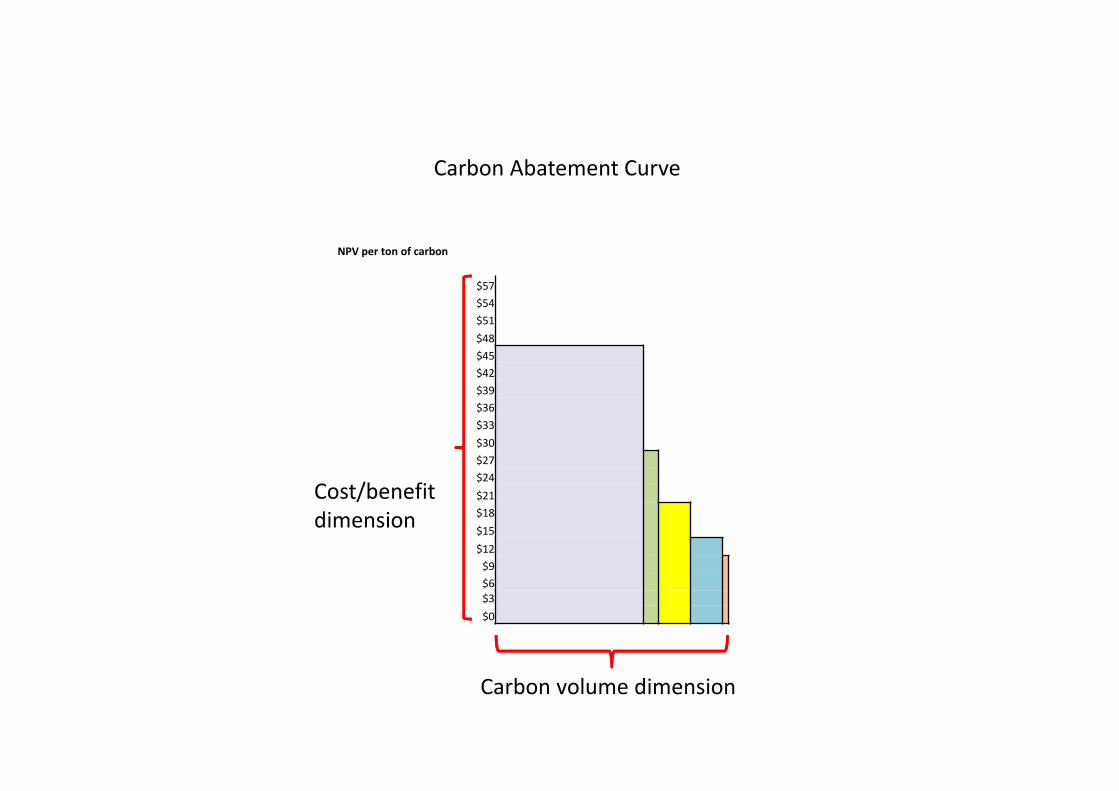
Two dimensions of a carbon abatement curve
• Cost (benefit) dimension: Height of curves show which restoration
transitions sequester carbon for the least cost or most benefit.
• Volume dimension: The width of each bar represents the total amount of
carbon that could be sequestered if all opportunity areas were restored.
Cost/benefit
dimension
Carbon volume dimension

Constructing a carbon abatement curve
• To construct a carbon abatement curve we need to define the height and width of each restoration transition.
• Begin by creating a table that shows the amount of carbon, total area of opportunity, and the NPV for each restoration transition
• The total amount of carbon that can be stored (i.e. the width of each column) by each transition is found by multiplying the carbon sequestered by each hectare with the total number of hectares that could be restored.
• The cost (benefit) of carbon (i.e. the height of each column) is found by dividing the NPV of each transition by the tons of carbon stored by that transition on a single hectare.
Carbon Abatement Curve Worksheet
Restoration transitionCarbon
(tons/ha)Area Total Carbon NPV NPV/TC
[1] [2] [1*2] [3] [3/1]
1. Deforested land to tree planting 150 4,000 600,000 $3,404 $23
2. Degraded natural forest to Naturally regenerated forests 100 2,000 200,000 $2,669 $27
3. Degraded forest plantation to Silviculture 60 10,000 600,000 $1,091 $18
4. Degraded agriculture to Agroforestry 80 40,000 3,200,000 $3,655 $46
5.Poor farm fallow to Improved farm fallow 20 1,000 20,000 $264 $13
NPV per ton of carbon
$57
$54
$51
$48
$45
$42
$39
$36
$33
$30
$27
$24
$21
$18
$15
$12
$9
$6
$3
$0
Cost/benefit
dimension
Carbon volume dimension
Carbon Abatement Curve

Interpreting a carbon abatement curve
• Which restoration transitions have the potential to sequester the most
carbon? Is that what you would have expected?
• If you were a social investor looking for a source of carbon offsets and
community impact which restoration transition would you invest in?
Conclusions
• Given the amount of degraded land across the world, the ability to identify the most beneficial landscapes to restore is an important objective.
• An integrated approach that accounts for both the costs and benefits of restoration provides decision makers with more actionable information.
• Assessing the costs and benefits is useful for prioritizing investments in restoration across a variety of criteria including NPV, ROI, and multi-criteria decision-making.
• Restoration is most successful when planning is based on multiple factors, in addition to economic ones.
• Other factors (e.g. secure land-tenure) will also be key to restoration success. Restoration is most likely to succeed.