assessing urban forests top-down bottom-up. assessing urban forests top-down produces good cover...
TRANSCRIPT
Assessing Urban Forests
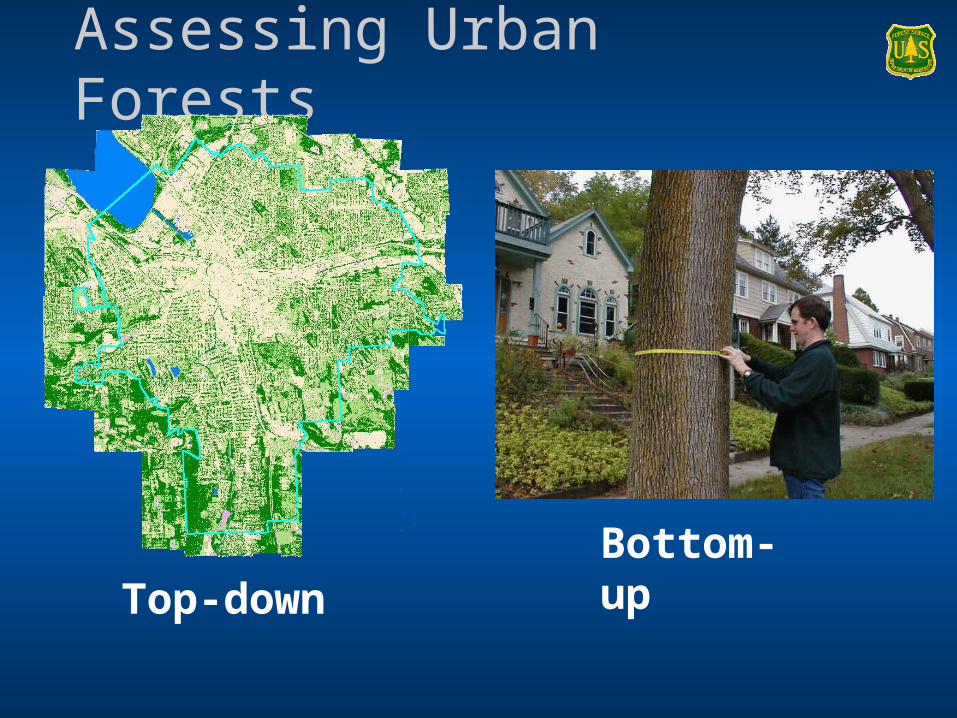
Top-downBottom-up
Assessing Urban ForestsTop-down
Produces good cover estimates
Can detail and map tree and other cover locations
Bottom-upProvides detailed management information
No. trees, spp. composition, tree sizes and health, tree locations, risk information…
Provides better means to assess and project ecosystem services and values
Air pollution removal, carbon storage…
Top-down Approaches
30 m resolution imagery (NLCD)
High resolution imagery (UTC)
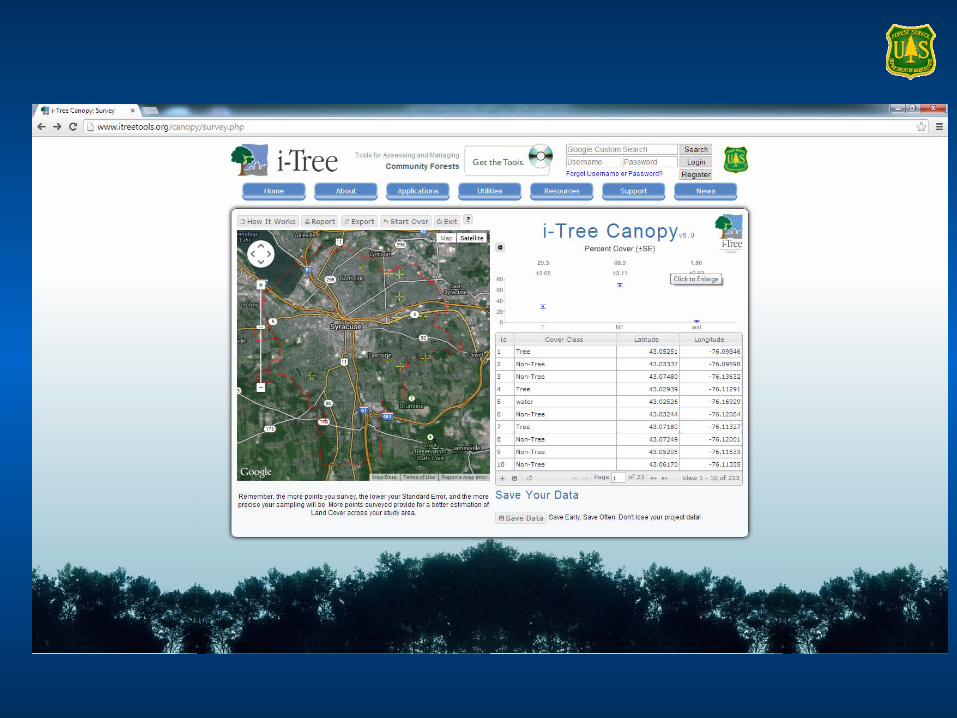
Photo-interpretation (GIS or iTree Canopy)
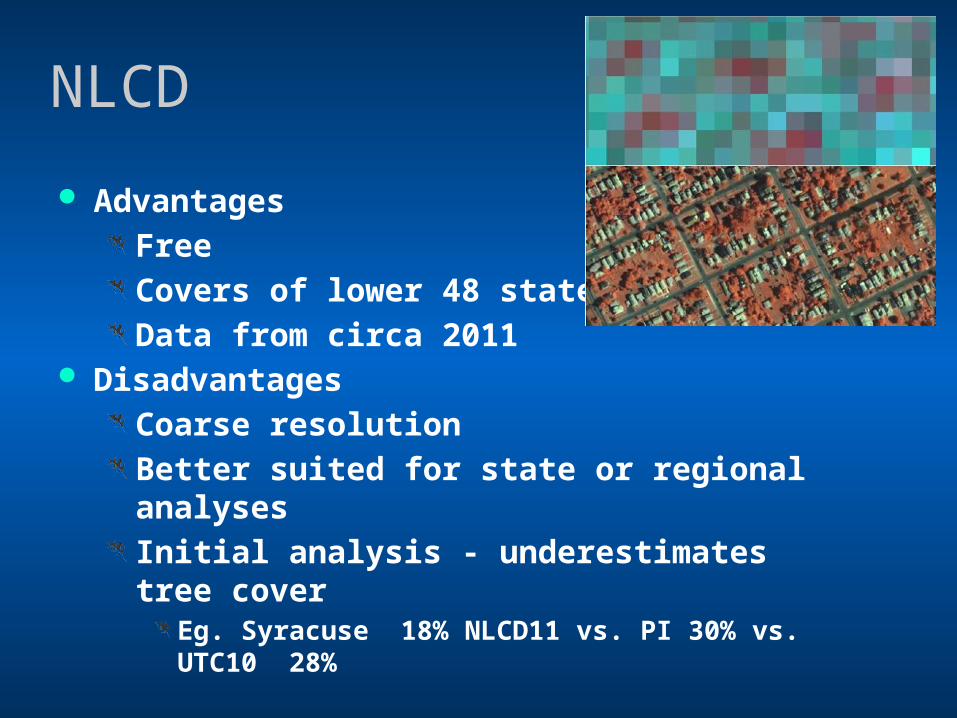
NLCD
Advantages
Free
Covers of lower 48 states
Data from circa 2011 Disadvantages
Coarse resolution
Better suited for state or regional analyses
Initial analysis - underestimates tree coverEg. Syracuse 18% NLCD11 vs. PI 30% vs. UTC10 28%
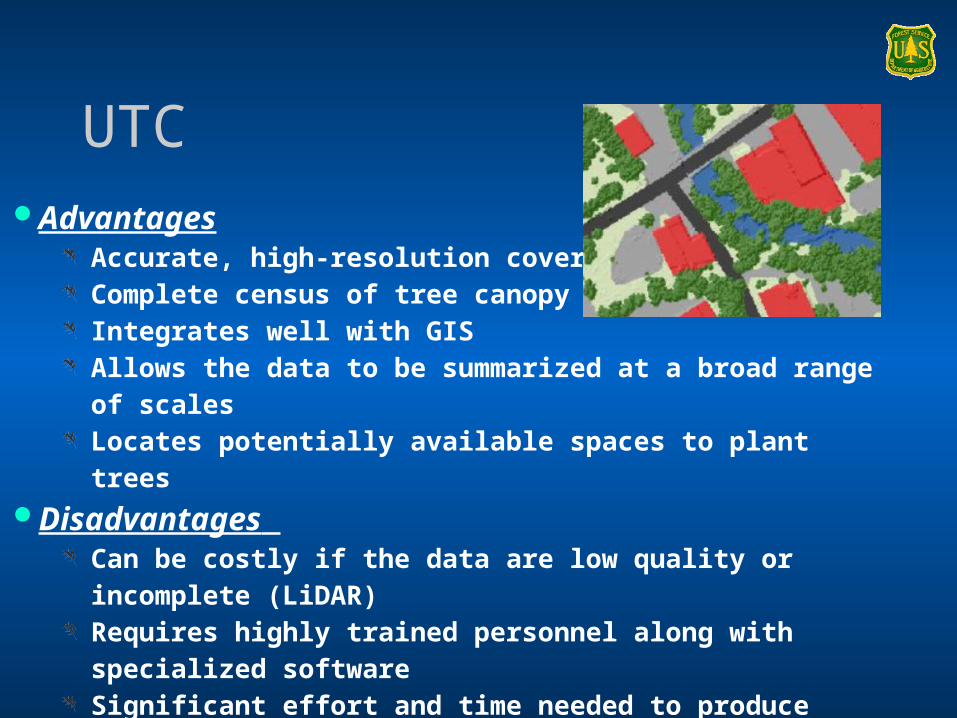
UTCAdvantages
Accurate, high-resolution cover mapComplete census of tree canopy locationsIntegrates well with GISAllows the data to be summarized at a broad range of scalesLocates potentially available spaces to plant trees
Disadvantages Can be costly if the data are low quality or incomplete (LiDAR)Requires highly trained personnel along with specialized softwareSignificant effort and time needed to produce quality mapsChange analyses can locate false changes due to map inaccuracies
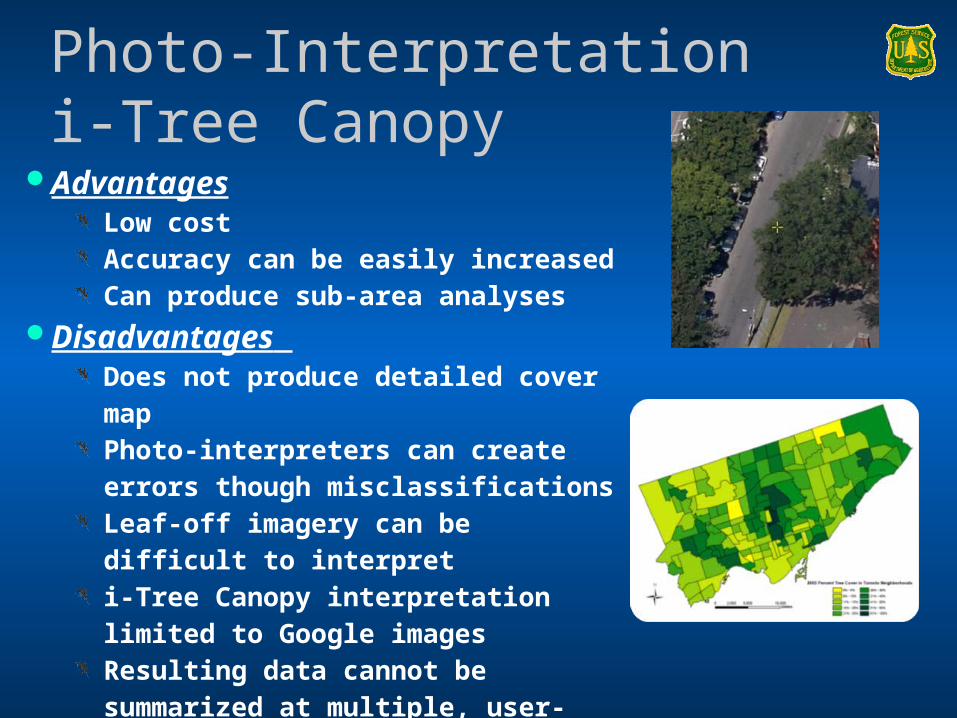
Photo-Interpretation i-Tree Canopy
AdvantagesLow cost Accuracy can be easily increased Can produce sub-area analyses
Disadvantages Does not produce detailed cover mapPhoto-interpreters can create errors though misclassificationsLeaf-off imagery can be difficult to interpreti-Tree Canopy interpretation limited to Google imagesResulting data cannot be summarized at multiple, user-defined scales
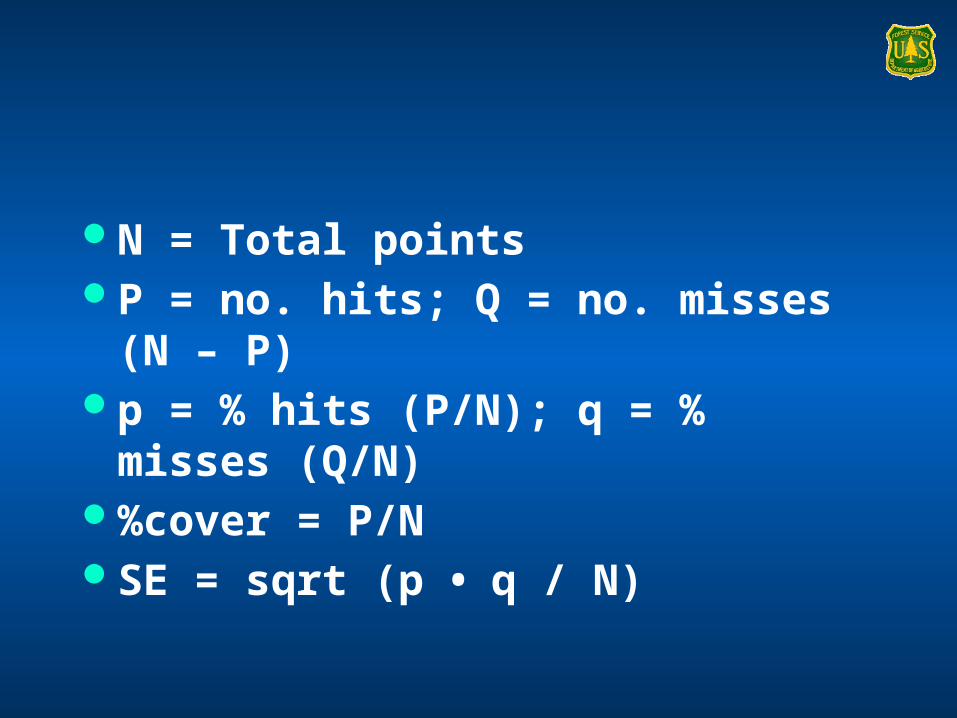
N = Total pointsP = no. hits; Q = no. misses (N – P)p = % hits (P/N); q = % misses (Q/N)%cover = P/NSE = sqrt (p • q / N)
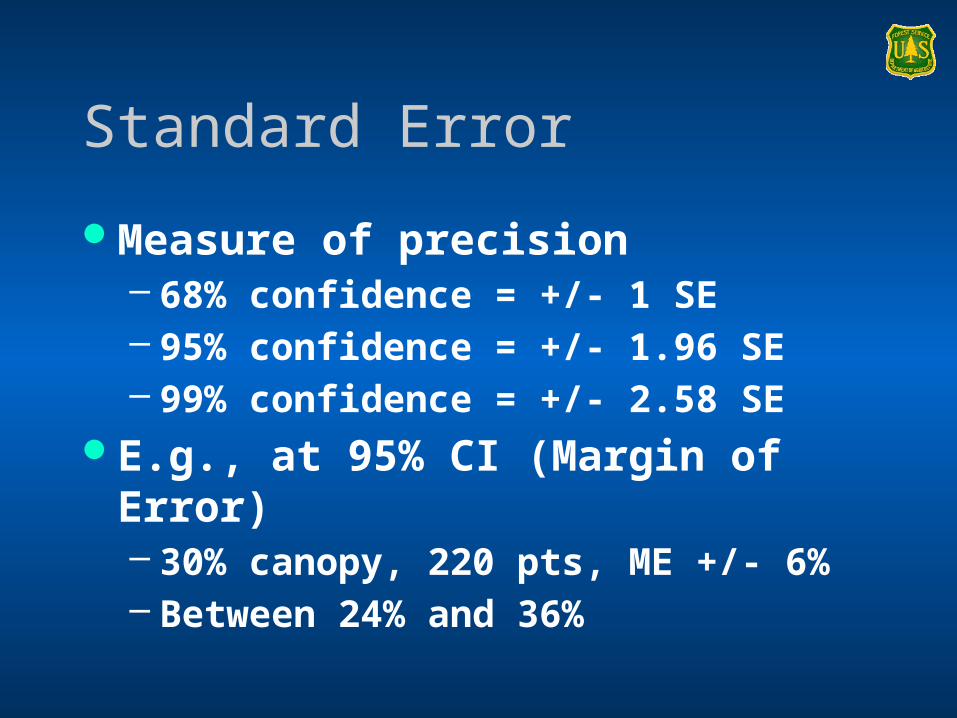
Standard Error
Measure of precision– 68% confidence = +/- 1 SE– 95% confidence = +/- 1.96 SE– 99% confidence = +/- 2.58 SE
E.g., at 95% CI (Margin of Error)– 30% canopy, 220 pts, ME +/- 6%– Between 24% and 36%
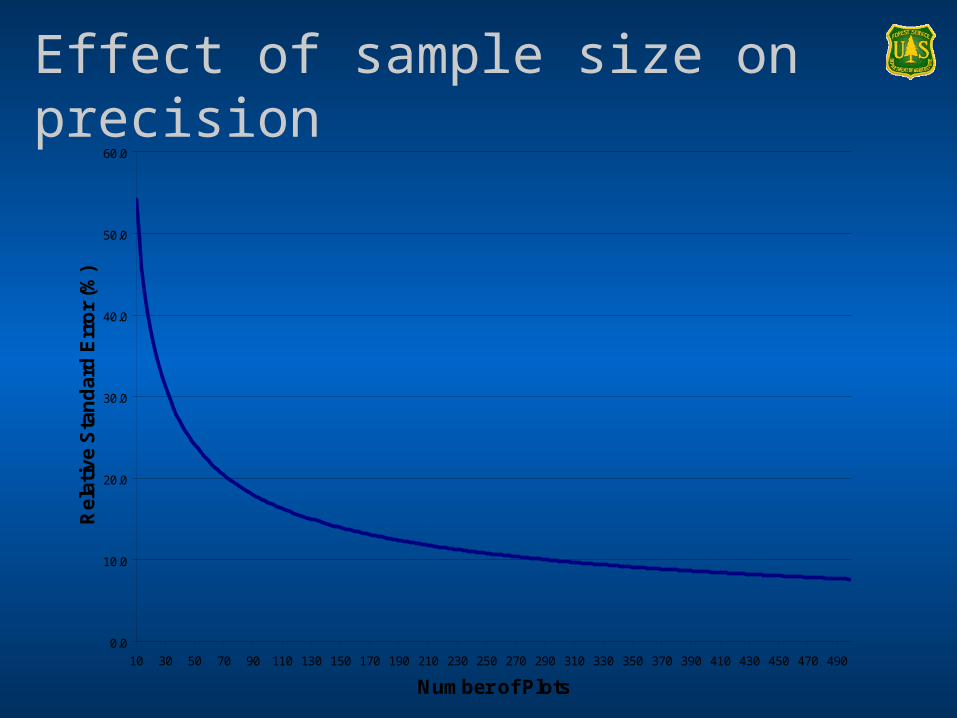
Effect of sample size on precision
0.0
10.0
20.0
30.0
40.0
50.0
60.0
10 30 50 70 90 110 130 150 170 190 210 230 250 270 290 310 330 350 370 390 410 430 450 470 490
Number of Plots
Rel
ativ
e S
tan
dar
d E
rro
r (%
)
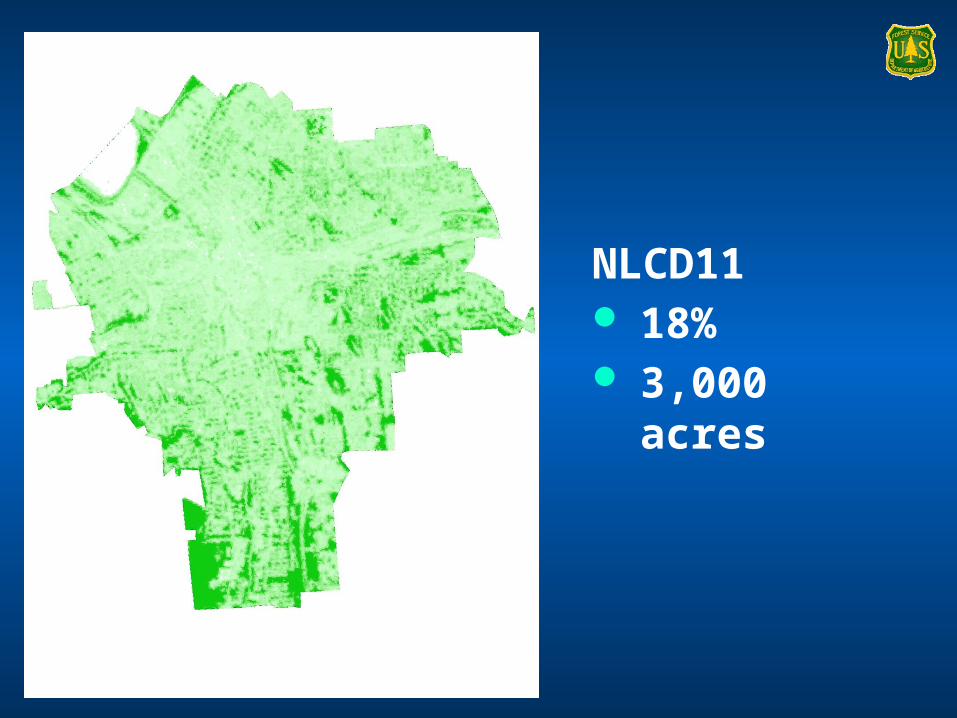
NLCD11 18% 3,000 acres
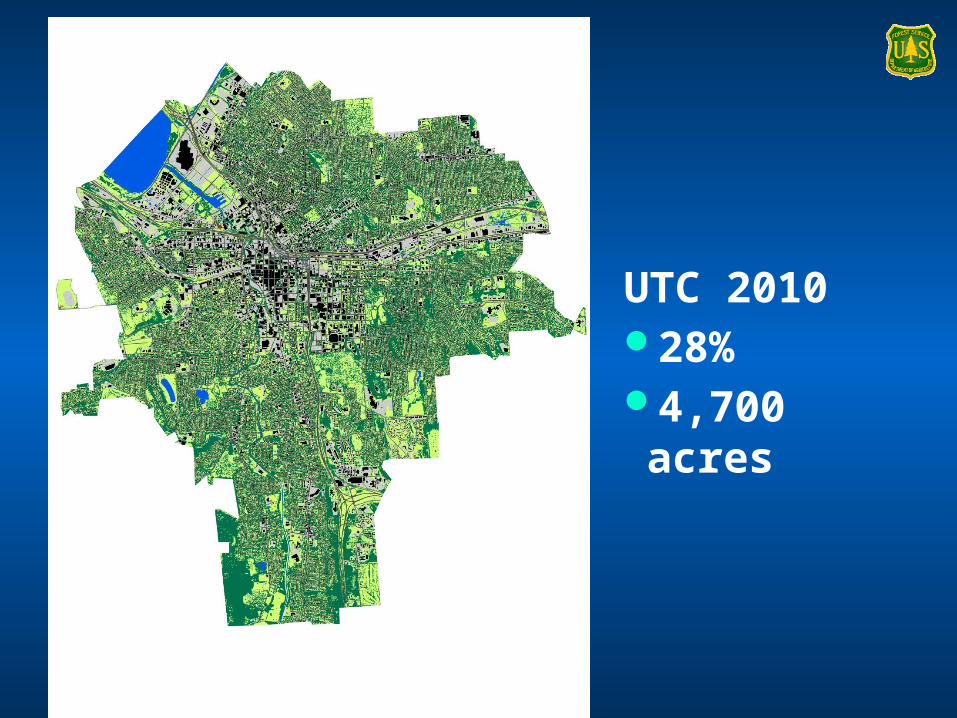
UTC 2010 28% 4,700 acres
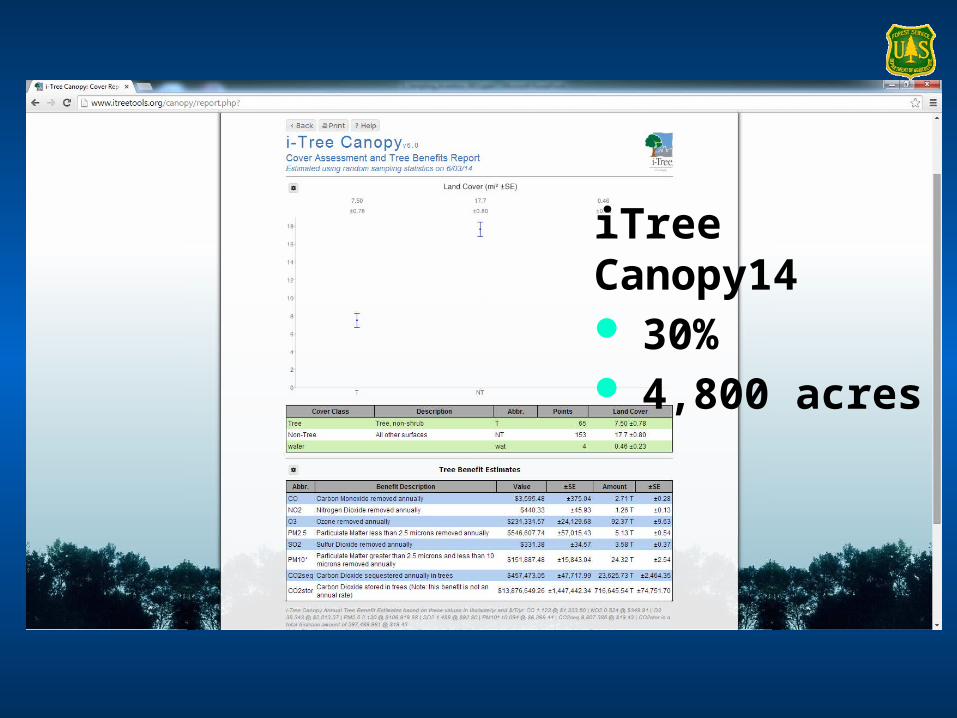
iTree Canopy14 30% 4,800 acres

Questions?