assessing the sustainability and resiliency of giahs ... · assessing the sustainability and...
TRANSCRIPT

Assessing the sustainability and resiliency of GIAHS
systems: a methodological contribution
Miguel A. Altieri
Clara I. Nicholls
University of California-Berkeley
And
Latin American Scientific Society of Agroecology (SOCLA)
www.agroeco.org/socla

SOCIETY NATURE T
IM
E
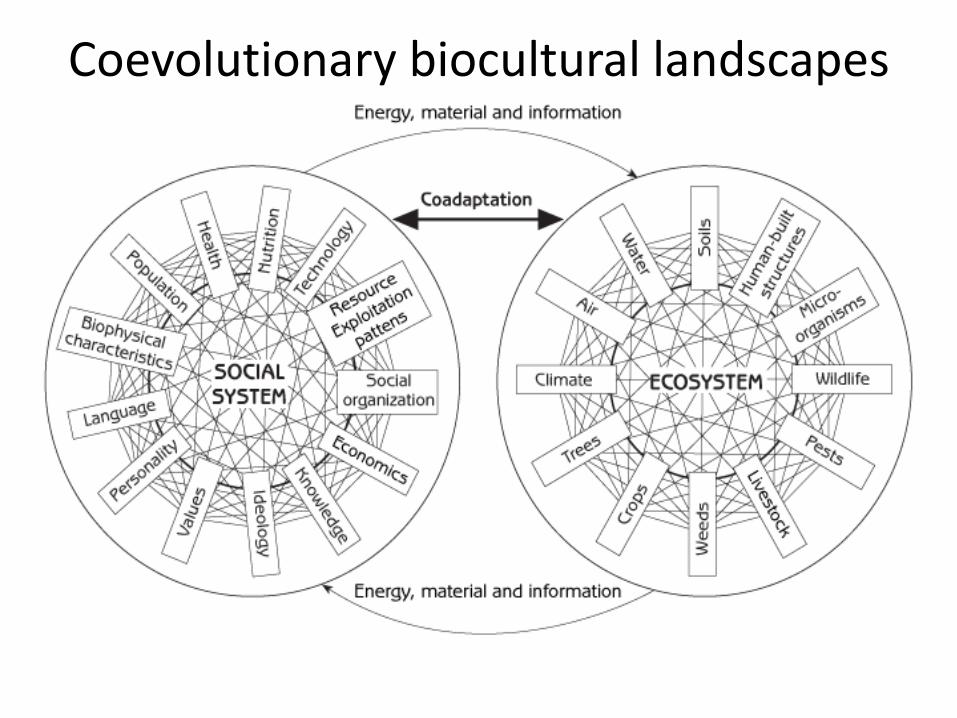
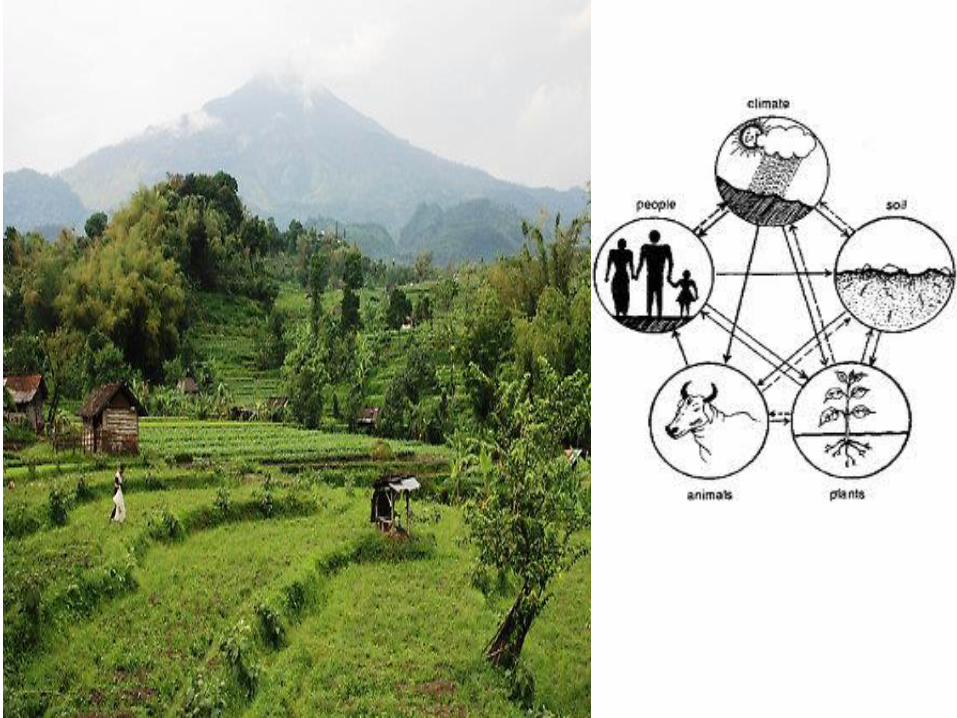
Coevolutionary biocultural landscapes

KOSMOS
(beliefs)
CORPUS
(knowledge)
PRAXIS
(practices)
N
A
T
U
R
E
K: Image o representation (BELIEVE) C: Reading or Interpretation (KNOW) P: Use oandmanagement (DO)

Etno-ecólogoProductor rural
PRAXIS
CORPUSKOSMOS
Etno-ecólogoProductor rural
PRAXIS
CORPUSKOSMOS
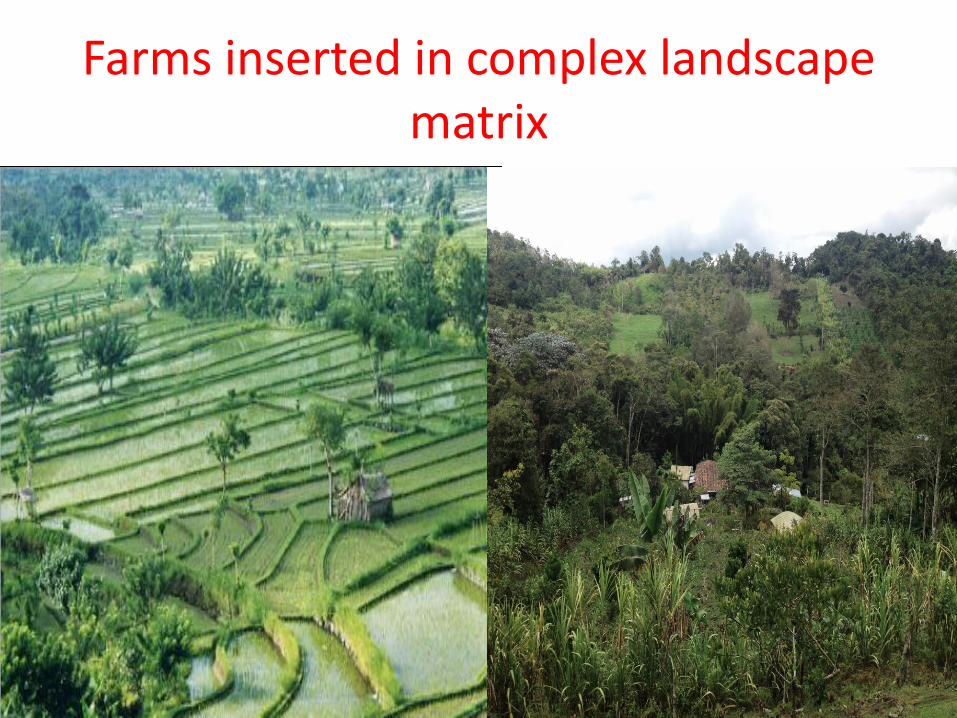
Farms inserted in complex landscape matrix


How many peasant farmers? (ETC 2009)
• 1, 5 billion peasant farmers
• 380 million farms
• Globally: > 90% of the world’s farms are small , < 2 ha.
• 1.9 million crop varieties

Peasants and world food
Produce 50-75% of food consumed by world population, but use :
• 25- 30% of the agricultural land
• 30% water used in agriculture
• 20 % fossil fuels used in agriculture.

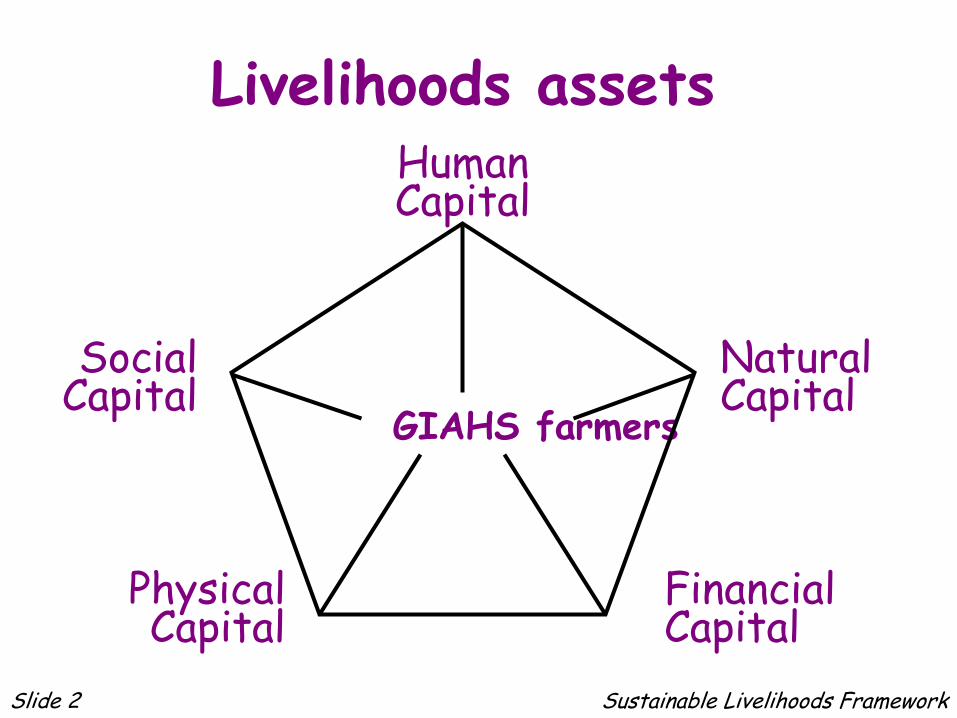
Livelihoods assets
Financial Capital
Natural Capital
Social
Capital
Physical Capital
Human Capital
GIAHS farmers
Slide 2 Sustainable Livelihoods Framework

Rice-fish culture (RFC) systems in Longxian
village, Qingtian County, Zhejiang Province, China

China Rice Fish


Natural Capital indicators Soil quality: level of aggregation, soil cover, signs of erosion, amount of decomposing residues, presence of invertebrates, etc Crop health: plant growth, signs of nutrient deficiencies, disease or pest incidence or damage, weed pressure, production-yields, etc On farm agrobiodiversity: number of crop species per farm, presence of fish and azolla, number of rice varieties grown, ratio of local versus modern varieties present Integrity of surrounding landscape matrix Resiliency: capacity of the system to resist external shocks ( extreme climatic events, pest-disease attack, lack of inputs) and rate of recovery from shock.

Social Capital Level of organization ( political, labor, market, etc) Collective work and actions Participation in community affairs, Role of women in management and decision making, etc Circuits of exchange of knowledge, technologies, seeds, etc Economic Capital Income Dependence on external inputs, energy , etc Access to institutional services (credit, extension, extension, information,etc) Access to local-regional markets Food sovereignty: proportion of food consumed by the family produced on farm, food and nutritional variety Infrastructure (Physical) Capital Access to reasonable levels of technology (mechanization, etc) State of terraces, irrigation canals, etc Access to markets, urban areas (level of isolation) Ecotourism infrastructure and carrying capacity

Agrobiodiversity: Higher values given if > 3-4 rice varieties per field and more local than modern varieties. Higher values if > number of fish species and if fish move as they aerate rice plants and control insects. Density of azolla ( high values if sparse- fish can eat, low value if dense-sign of eutrophication) Surrounding matrix Higher values if fields surrounded by forests . According to farmers forests are key for water conservation and abundance in fields. Traditional knowledge Higher values to farms where farmers still preserve old cultural management techniques such as planting crops in terrace mounds, making and adding compost, using ancient local varieties,etc Soil quality Higher value to soils with lots of aggregates and that are not compacted, that have been heavily manured and rice straw incorporated into soil. Crop health Higher value to plants that exhibit green foliage, with leaves not easily broken, without signs of disease or insect attack.

Resiliency Higher values to farms that have high rice varietal diversity, presence of fish and with good water and soil management. Some farmers also mentioned yield variation, risk of crop loss and food self sufficiency in variable years as key criteria for estimating resiliency Social organization Most farmers rated low this indicator as they plant and tend their fields individually and rarely conduct farming activities collectively Dependence Most farmers continue using their own seeds, recycle rice straw and manure from pigs and ducks for soil fertility. Most farmers don’t use agrochemicals. Food sovereignty < than 20% of the food consumed by families comes from outside the farms. In larger terraces farmers grow vegetables and/or practice rotations of rice and vegetables. Many grow vegetables in the terrace mounds. Institutional support Most farmers have little access to credit, extension, information and markets. Less than 30% of the rice and fish are sold outside of the province. At times dry fish is marketed abroad.
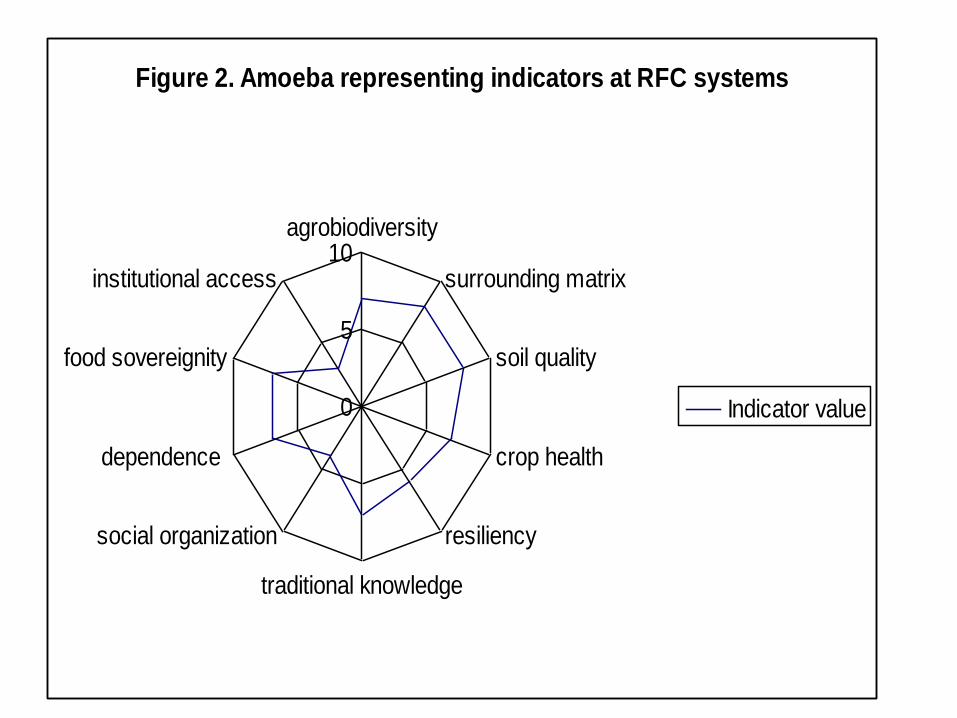
Figure 2. Amoeba representing indicators at RFC systems
0
5
10agrobiodiversity
surrounding matrix
soil quality
crop health
resiliency
traditional knowledge
social organization
dependence
food sovereignity
institutional access
Indicator value

Scenarios--------------------------------------------->
Capital Sustainability Indicators Expand Introductions Agroecological Environmental
Markets of GMOs Interventions Protector Regulations
Natural
Biodiversity - + / - + / - + / -
Soil quality + / - + / - + / - + / -
Yields + / - + / - + / - + / -
Social Food security + / - + / - + / - + / -
Organization + / - + / - + / - + / -
Participation + / - + / - + / - + / -
Human
Nutrition, Health + / - + / - + / - + / -
TEK Skills + / - + / - + / - + / -
Cultural identity + / - + / - + / - + / -
Physical
Fuel, energy + / - + / - + / - + / -
Water and materials + / - + / - + / - + / -
Rural infrastructure + / - + / - + / - + / -
Economic
Income, savings + / - + / - + / - + / -
Access to land, markets, inputs + / - + / - + / - + / -
labor availability + / - + / - + / - + / -


Intensification of coffee systems
Bio
div
ersi
ty
Eco
syst
em s
ervi
ces


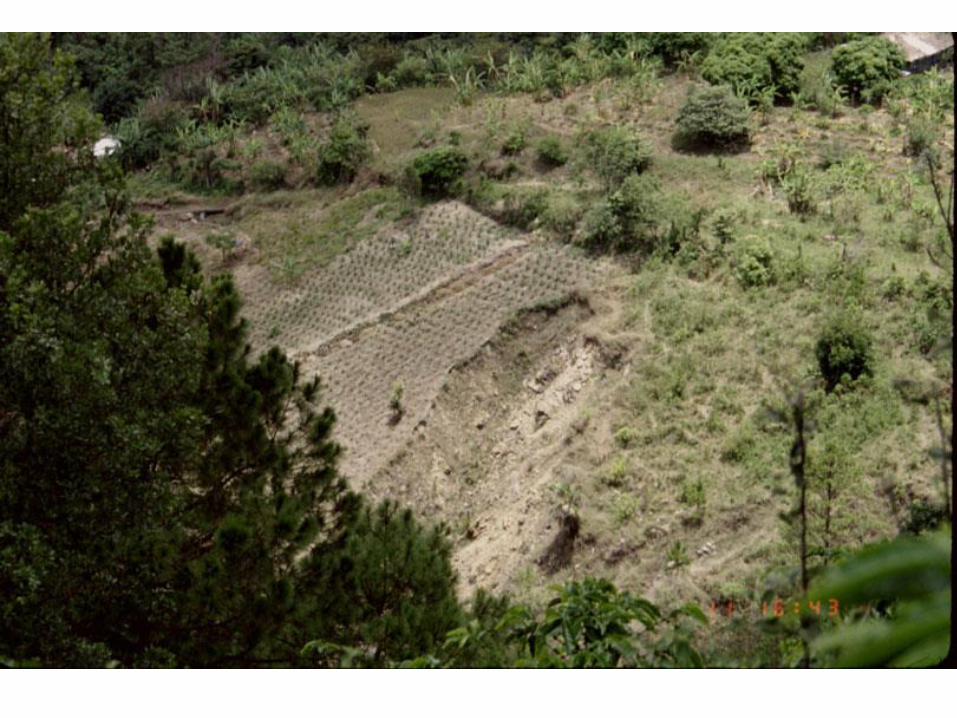

Mud slides post Mich in conventional (C) and agroecological (A) Farms

Extreme Climatic Event
Farming System Resiliency
Surrounding Landscape Heterogeneity
Vegetational Complexity
Soil and Water Management
Inter cropping
Genetic diversity
Animal integration
SOM SAFs Soil
cover Water
harvesting
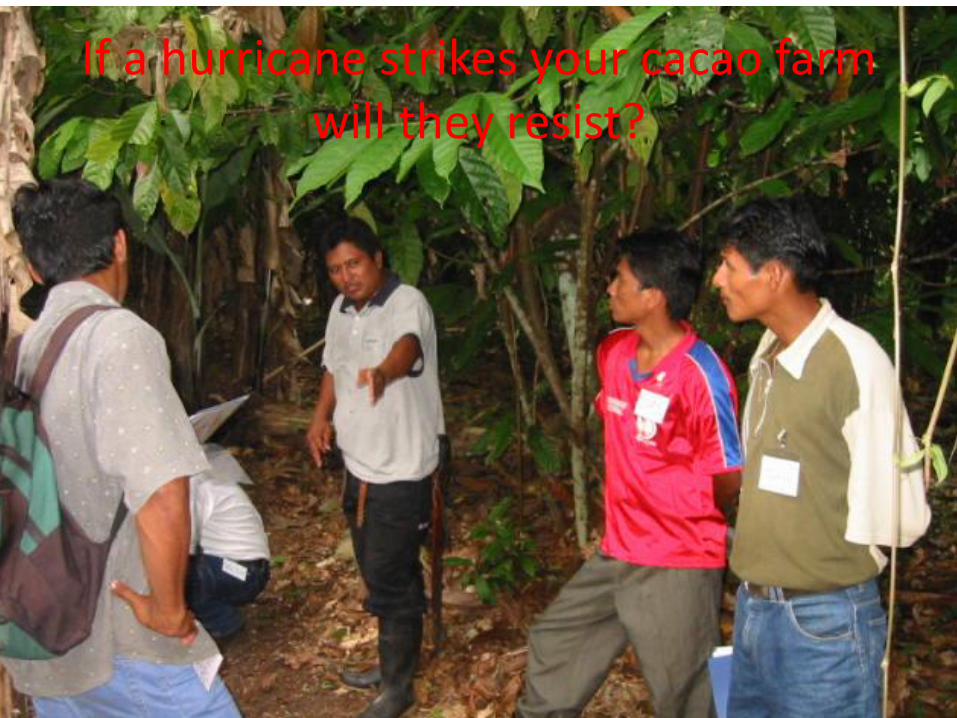
If a hurricane strikes your cacao farm will they resist?

Color Situation Action Numerical
Value
Green Low Vulnerability or
High Resilience
Maintain the level of
management / conservation
(Vigilance)
5
Yellow Medium vulnerability Must do something to
improve (caution) 3 – 4
Red High vulnerability Must do much to improve
(Risk) 1 – 2
Traffic light methodology to assess vulneravility status of agroecosystems

Indicador Red Yellow Green
High (5) Medium (3-4) Low (1-2)
1. Landscape diversity
2. Slope
3. Exposure
4. Windbreaks or hedgerows
5. Proximity to forest
6. Proximity to river
7. Soil conservation practices
8. Soil structure (infiltration)
9. Drainage works
10. Plant diversity
11. Stratification
12. DAP of dominant trees
13. Root depth of dominant trees
14. Soil cover
15. Self sufficiency (% food produced on farm)

Indices of vulnerability resilience as perceived by farmers in Talamanca, Costa Rica
Red Yellow Green
High (4-5) Medium (2-3) Low (1)
Parameter Diversified,
Rustic Cacao Agroforest (A)
Simplified, Rustic Cacao
Agroforest (B) (A) (B) (A) (B)
Slope x x
Exposure x x
Landscape diversity x x
Proximity to Forest x x
Windbreaks x x
Soil Practices x x
Plant Diversity x x
Soil Structure x x
Soil Cover x x
Root Depth x x
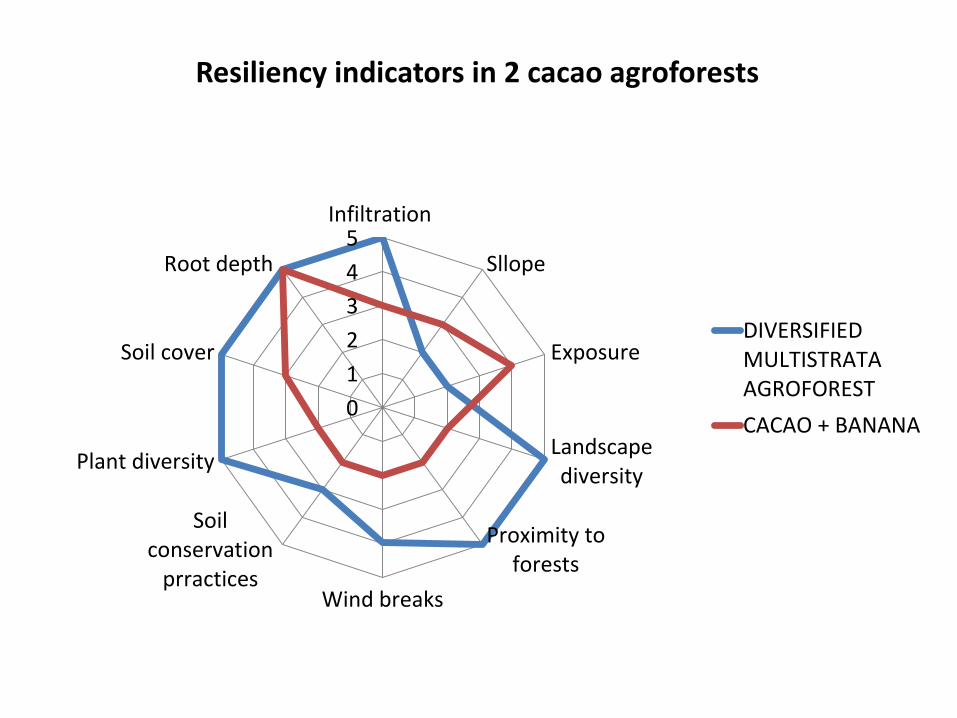
0
1
2
3
4
5Infiltration
Sllope
Exposure
Landscapediversity
Proximity toforests
Wind breaks
Soilconservation
prractices
Plant diversity
Soil cover
Root depth
Resiliency indicators in 2 cacao agroforests
DIVERSIFIEDMULTISTRATAAGROFOREST
CACAO + BANANA


What happens if the farms stays in Red?
How to transition from
Red to Yellow?
How to transition from Yellow to Green?
Risk of high damage
Start implementing
agroecological practices (medium damage)
Achieve complete
agroecological design (low damage)

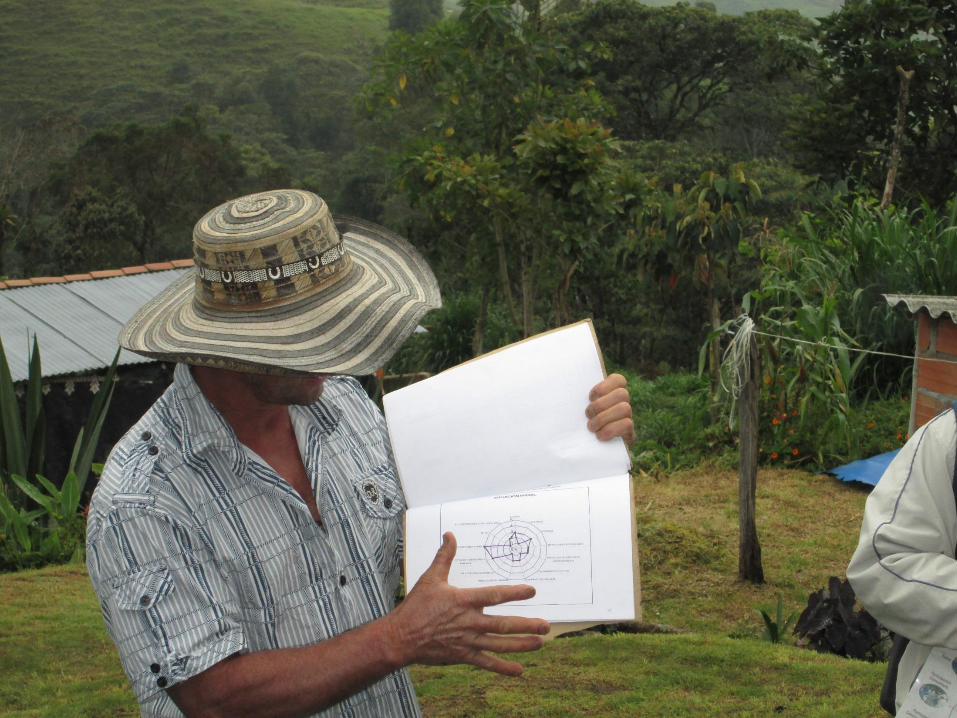
Oriente Antioqueno, Colombia

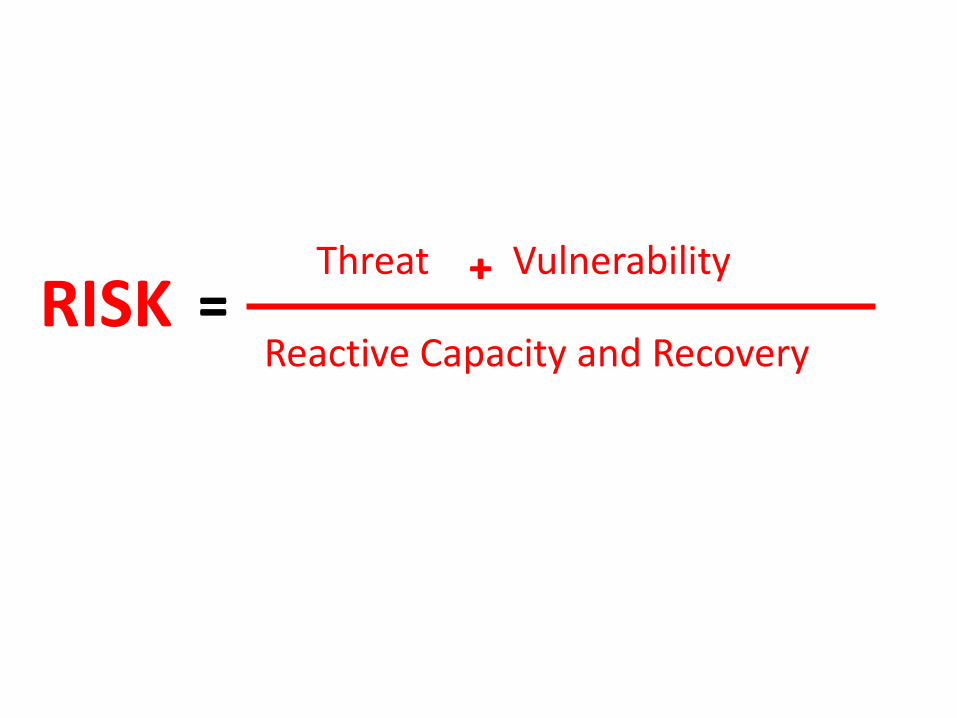
Reactive Capacity and Recovery RISK ⁼
Threat ₊ Vulnerability
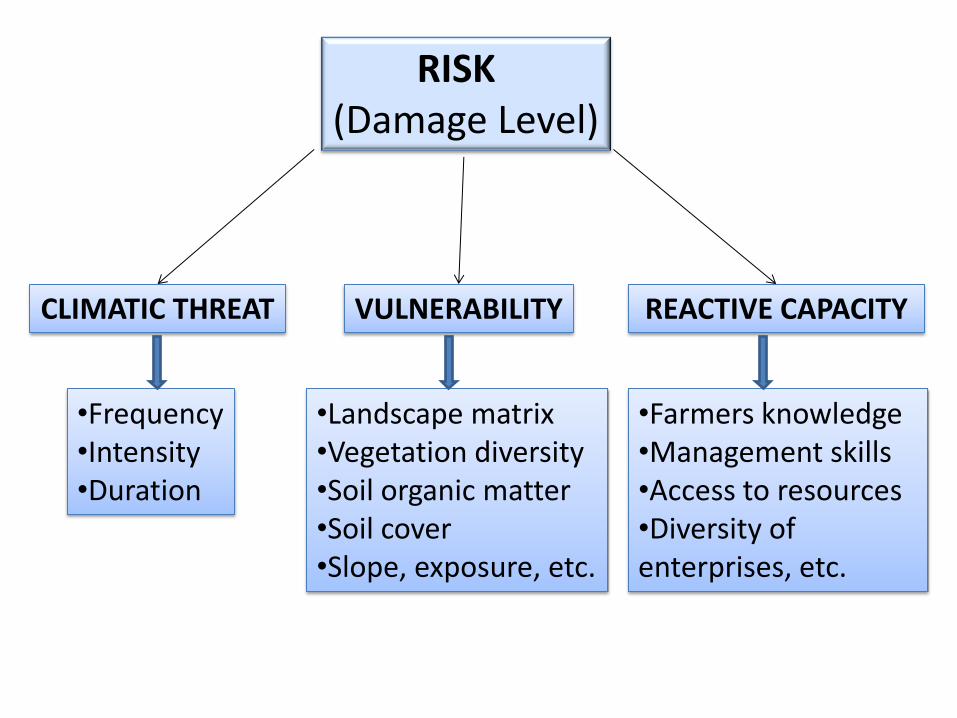
RISK (Damage Level)
CLIMATIC THREAT VULNERABILITY REACTIVE CAPACITY
•Frequency •Intensity •Duration
•Landscape matrix •Vegetation diversity •Soil organic matter •Soil cover •Slope, exposure, etc.
•Farmers knowledge •Management skills •Access to resources •Diversity of enterprises, etc.

Physical Vulnerability
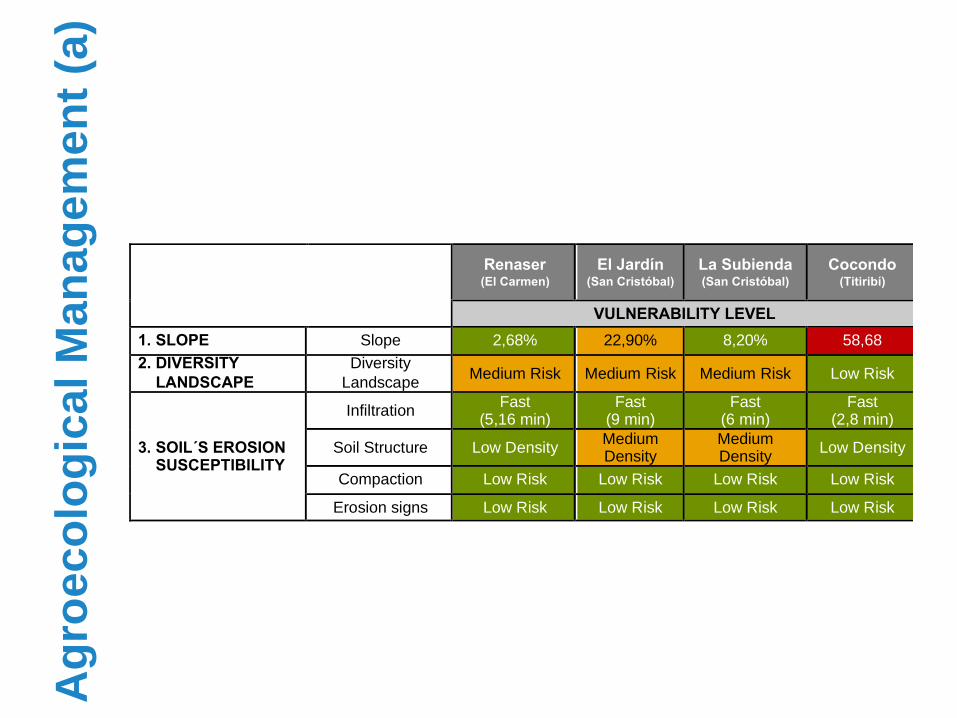
Renaser (El Carmen)
El Jardín (San Cristóbal)
La Subienda (San Cristóbal)
Cocondo (Titiribí)
VULNERABILITY LEVEL
1. SLOPE Slope 2,68% 22,90% 8,20% 58,68
2. DIVERSITY
LANDSCAPE
Diversity
Landscape Medium Risk Medium Risk Medium Risk Low Risk
3. SOIL´S EROSION SUSCEPTIBILITY
Infiltration Fast
(5,16 min) Fast
(9 min) Fast
(6 min) Fast
(2,8 min)
Soil Structure Low Density Medium Density
Medium Density
Low Density
Compaction Low Risk Low Risk Low Risk Low Risk
Erosion signs Low Risk Low Risk Low Risk Low Risk
Ag
roeco
log
ical
Man
ag
em
en
t (a
)

Co
nven
tio
na
l M
an
ag
em
en
t (c
)
Cocondo “Pasture” Santa Ana
(Fredonia) La Rosita
(San Cristóbal)
VULNERABILITY LEVEL
1. SLOPE Slope 47,7 60,62 8,00%
2. DIVERSITY LANDSCAPE
Diversity Landscape
Low Risk Medium Risk Medium Risk
3. SOIL´S EROSION
SUSCEPTIBILITY
Infiltration Moderate (66 min) Fast (0,5 min) Fast (4 min)
Soil Structure High density Low Density Medium Density
Compaction Medium Risk Low Risk Low Risk
Erosion signs Low Risk Medium Risk Low Risk

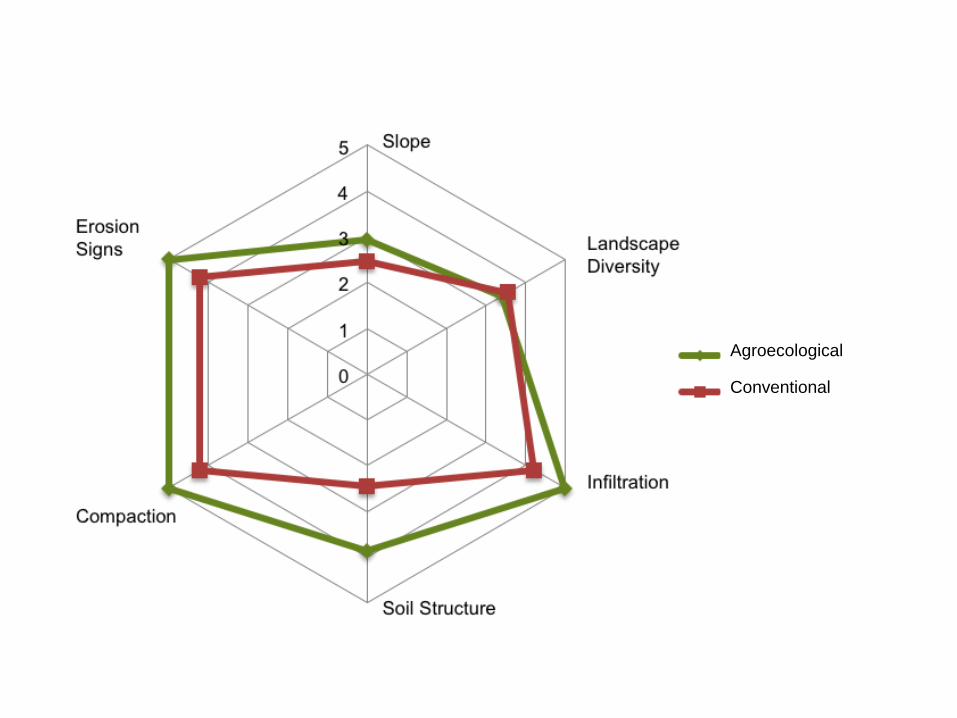
Physical indicators of
vulnerability
p < 0,631
Agroecological
Farms (a)
Conventional
Farms (c) (a – c) ((a – c)/c)*100 (%)
Slope 2,94 2,47 0,48 19,33
Diversity Landscape
3,41 3,56 -0,15 -4,17
Infiltration 5,00 4,22 0,78 18,56
Soil Structure 3,87 2,47 1,41 57,04
Compaction 5,00 4,22 0,78 18,56
Erosion signs 5,00 4,22 0,78 18,56
General average 4,12 3,43 0,68 21,31
Agroecological
Conventional

Response capacity

Ag
roeco
log
ical
Man
ag
em
en
t (a
)
Renaser (El Carmen)
El Jardín (San Cristóbal)
La Subienda (San Cristóbal)
Cocondo (Titiribí)
RESPONSE CAPACITY
SO
IL C
ON
SE
RV
AT
ION
P
RA
CT
ICE
S
Soil Cover > 50% > 50% 10 - 50 % > 50%
Living Barriers > 50% > 50% 10 - 50 % > 50%
Conservation Tillage > 50% > 50% 10 - 50 % > 50%
Water Management Medium Medium Medium Alto
Soil Organic Management High (>3) High (> 3) High (> 3) Medium (1 – 2)
Terraces (Contour line, multiestrata
system)
High (Contour line)
High (Contour line)
None High
(multiestrata)
% Food produced on-farm High (> 60%) High (> 60%)
Medium
(20 - 60%) Low (<20)
Independence from external
inputs 10 - 50% 10 - 50% 10 - 50% 10 - 50%
Seed banks High High Medium High
Animal forage 10 - 50% 10 - 50% 10 - 50% 10 - 50%
Crop Diversity High (> 2) Medium (= 2) Medium (=2) High (> 2)
Protected areas within farm < 10 % > 30 % < 10 % < 10 %
Soil Texture
Franco - Limoso
Franco - Limoso
Franco Franco – Limoso

Co
nven
tio
na
l M
an
ag
em
en
t (c
)
Cocondo “Pasture”
Santa Ana
(Fredonia)
La Rosita
(San Cristóbal)
RESPONSE CAPACITY
SO
IL C
ON
SE
RV
AT
ION
P
RA
CT
ICE
S
Soil Cover > 50% > 50% < 10%
Living Barriers < 10% 10 - 50 % < 10%
Conservation Tillage 10 - 50 % > 50% 10 - 50 %
Water Management Medium Low Medium
Soil Organic Management Medium (1 – 2) Medium (1 – 2) Medium (1 – 2)
Terraces (Contour line, multiestrata
system) None Medium Medium
% Food produced on-farm Low (<20) Low (<20) Low (<20)
Independence from external
inputs 10 - 50% > 50% 10 - 50%
Seed banks Low Low Low
Animal forage 10 - 50% 10 - 50% > 50 %
Crop Diversity Low (monoculture) Medium (=2) Low (monoculture)
Protected areas within farm < 10 % < 10 % < 10 %
Soil Texture Franco - Limoso Franco - Limoso Franco - Arenoso

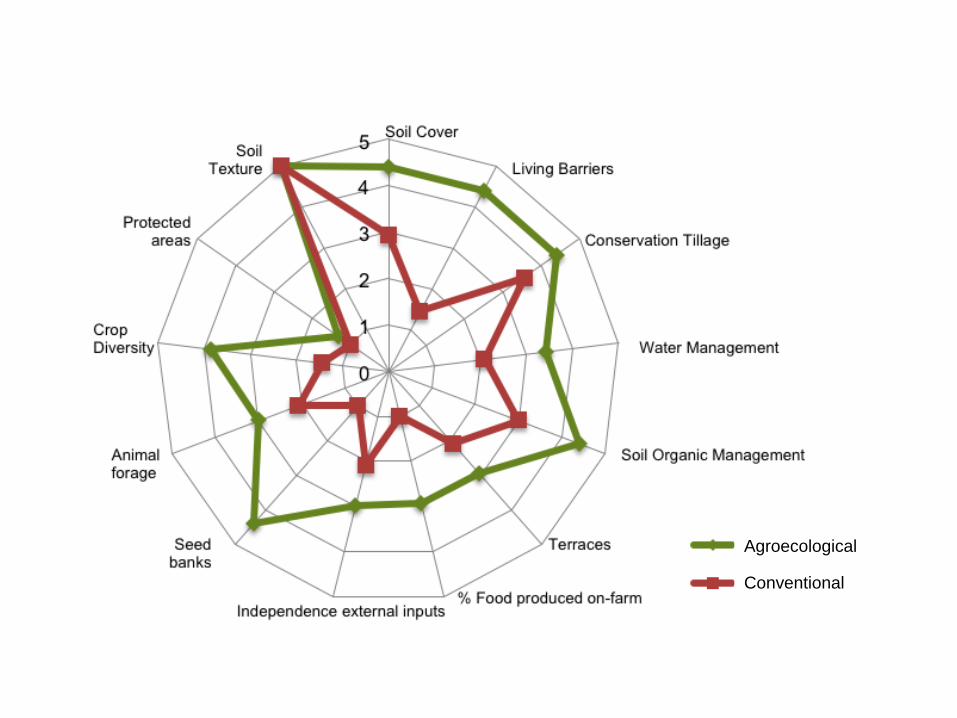
Ind
icato
rs o
f
Re
sp
on
se
Ca
pac
ity
p < 0,0159
Agroecológical
Farms (a)
Conventional
Farm (c) (a – c) ((a – c)/c)*100 (%)
Soil Cover 4,40 2,92 1,48 50,50
Living Barriers 4,40 1,44 2,96 205,12
Conservation
Tillage 4,40 3,56 0,84 23,72
Water
Management 3,41 2,08 1,33 63,87
Soil Organic
Management 4,40 3,00 1,40 46,69
Terraces (Contour line, multiestrata
system) 2,94 2,08 0,86 41,48
% Food produced on-farm
2,94 1,00 1,94 194,28
Independence from external inputs
3,00 2,08 0,92 44,22
Seed banks 4,40 1,00 3,40 340,06
Animal forage 3,00 2,08 0,92 44,22
Crop Diversity 3,87 1,44 2,43 168,54
Protected areas within farm
1,32 1,00 0,32 31,61
Soil Texture 5,00 5,00 0,00 0,00
General average 3,48 1,95 1,45 96,48
Agroecological
Conventional
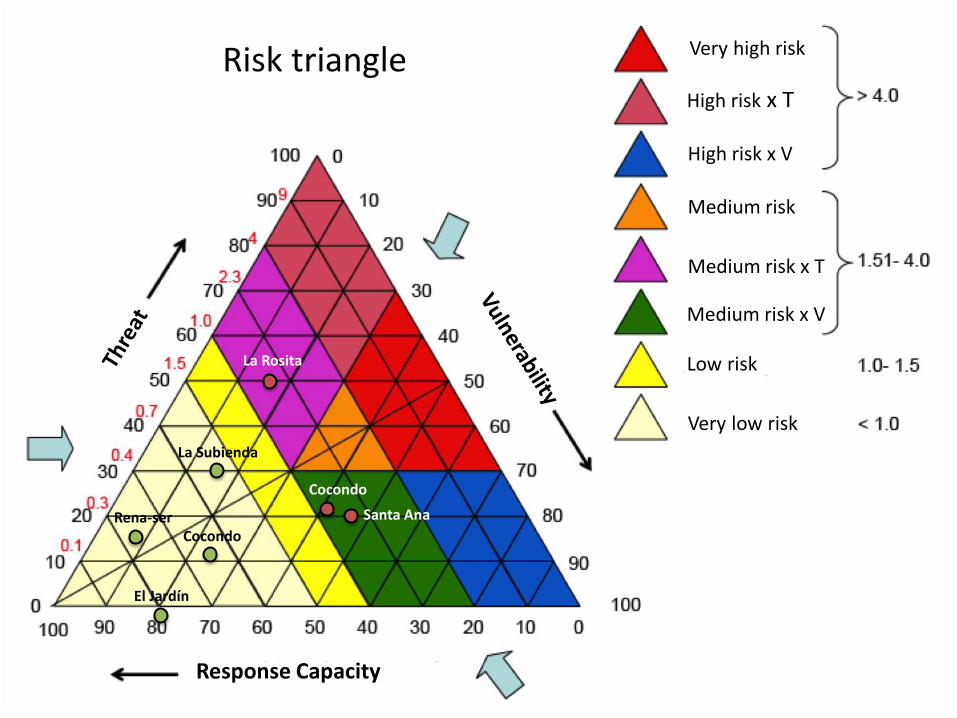
El Jardín
Rena-ser
La Subienda
La Rosita
Cocondo
Cocondo
Santa Ana
Risk triangle Very high risk
Response Capacity
High risk x T
High risk x V
Medium risk
Medium risk x T
Medium risk x V
Low risk
Very low risk

Conceptual framework to examine the socio-ecological resiliency features of GIAHS traditional farming systems
Thank you!!