assessing the impact of alternative splicing in cancer · assessing the impact of alternative...
TRANSCRIPT
FACULDADE DE ENGENHARIA DA UNIVERSIDADE DO PORTO
Assessing the impact of alternativesplicing in cancer
Ana Gomes
Mestrado Integrado em Engenharia Informaacutetica e Computaccedilatildeo
Supervisor Rui Camacho (FEUP)
Second Supervisor Valdemar Maacuteximo (FMUPIPATIMUP)
July 26 2015
Assessing the impact of alternative splicing in cancer
Ana Gomes
Mestrado Integrado em Engenharia Informaacutetica e Computaccedilatildeo
Approved in oral examination by the committee
Chair Joatildeo MoreiraExternal Examiner Seacutergio Matos
Supervisor Rui Camacho
July 26 2015
Abstract
Worldwide millions of people live every day with a diagnosis of cancer Cancer has severalpossible causes One of such possibilities is the genomic origin In this thesis we designed anddeveloped informatics tools to help cancer researchers to investigate cancer possible origin an[aberrant] alternative splicing In this process usually a single fragment of DNA can result in morethan one transcript during which an aberrant mutation can occur and be the cause of a disorder
For the genome analysis RNA-seq was used in our study RNA-seq has been used nowadaysquite frequently as a procedure to sequence genomes RNA-seq performs the reconstruction ofat least part of the genome of a patient from small fragments of it (reads) calculates the set ofactive genes and compares it with one from a reference person This last step of active genedifferentiation may help researchers to understand the original biological question that triggeredthe study At this last stage it is also important to collect several kinds of information associatedwith the active genes in order to establish a solid base for informed decisions based on the process
Although the tools to achieve this evaluation do exist usually they are dispersed causing theprocess to be difficult and slow The whole process requires considerable computational resourcesand programming skills Furthermore it is important for the scientist to work with a user-friendlyweb interface
Our main purpose is to develop an application that helps researchers in this task of assessingthe impact of [aberrant] alternative splicing in cancer by automating the full process from the readsanalysis up to the results of alternative splicing analysis To achieve those the work includes thefollowing tasks develop a web interface to simplify the analysis process assemble the existingiRAP pipeline and improving the gene enrichment step Our contribution is four fold make thewhole process easy to use by the biologist expert design and deploy the data analysis steps extendan existing pipeline with module(s) specific for splicing and apply our work in IPATIMUPrsquosdata on cancer Automatization is the major contribution to improve efficiency and quality of thescientific research on the impact of alternative splicing in cancer
i
ii
Resumo
Por todo o mundo milhotildees de pessoas vivem diariamente com um diagnoacutestico de cancro Um dospossiacuteveis fenoacutemenos que se suspeita estar na origem de alguns cancros eacute o alternative splicingEste processo ocorre no iniacutecio da transcriccedilatildeo de DNA em RNA Durante este processo normal-mente uma pequena regiatildeo de DNA (um gene) pode resultar em mais de uma sequecircncia alternativade RNA Mutaccedilotildees ocorridas na sequecircncia de DNA podem ser nefastas e estar na origem de certostipos de cancro
Para a anaacutelise de genomas utilizamos a tecnologia RNA-seq RNA-seq eacute uma tecnologia cadavez mais utilizada para estudar o problema acima descrito O RNA-Seq executa a reconstruccedilatildeode pelo menos parte do genoma de um paciente a partir de pequenos pedaccedilos do mesmo (reads)calcula o conjunto dos genes ativos e compara-os com um de um grupo de referecircncia O uacuteltimopasso do processo eacute geralmente a diferenciaccedilatildeo dos genes ativamente expressos o que pode ajudaros investigadores a perceberem a origem bioloacutegica da doenccedila Nesta uacuteltima etapa eacute tambeacutem im-portante agregar diversos tipos de informaccedilatildeo relacionados com os genes ativos com o objetivo deconstituir uma base soacutelida para sustentar as explicaccedilotildees cientiacuteficas
Apesar de as ferramentas utilizadas nesta avaliaccedilatildeo estarem disponiacuteveis normalmente estasencontram-se dispersas pela Web o que torna o processo lento e de difiacutecil execuccedilatildeo Mesmocomputacionalmente eacute uma metodologia que requer recursos consideraacuteveis e competecircncias deprogramaccedilatildeo Aleacutem disso eacute importante para o especialista interagir com uma interface amigaacutevele que lhe permita a visualizaccedilatildeo dos resultados
O principal objetivo do trabalho eacute desenvolver uma aplicaccedilatildeo que ajude os investigadores nestatarefa de avaliar o impacto do alternative splicing em cancro atraveacutes da automatizaccedilatildeo de todo oprocesso desde a anaacutelise dos reads ateacute aos resultados da anaacutelise do alternative splicing Parao conseguir alcanccedilar o plano de trabalhos inclui as seguintes tarefas desenvolvimento de umainterface web para a simplificaccedilatildeo do processo de anaacutelise montagem da pipeline iRAP existentee melhoria do passo de gene enrichment A nossa contribuiccedilatildeo tem quatro vertentes simplificaro processo para o investigador planear e implementar os passos da anaacutelise de dados extendera pipeline existente com um moacutedulo especiacutefico para o splicing e aplicar o trabalho em dadosdo IPATIMUP sobre cancro A automatizaccedilatildeo eacute a maior contribuiccedilatildeo no sentido de melhorar aeficiecircncia e qualidade da investigaccedilatildeo cientiacutefica no que respeita ao impacto do alternative splicingno cancro
iii
iv
Acknowledgements
Foremost I would like to express my gratitude to my supervisor Prof Rui Camacho (FEUP)for the continuous support patience and motivation His guidance helped me in all the time ofdevelop research and writing of this thesis I also would like to thank Prof Valdemar Maacuteximo(FMUPIPATIMUP) and IPATIMUPrsquos staff for collaborating and providing the necessary materialfor case studies analysis
I thank my fellow college mates of MIEIC for this 5-year journey of companionship as wellas my roommates that stood out for me at every time
Furthermore my sincere thanks goes to my family my parents and my brother for their faithin me and allowing me to be as ambitious as I wanted Last but not the least I would like to thankmy boyfriend for his love encouragement quiet patience and also his help on surpassing all theobstacles I had
Ana Gomes
v
vi
ldquoIt always seems impossibleuntil itrsquos donerdquo
Nelson Mandela
vii
viii
Contents
1 Introduction 111 Context 112 Motivation and Goals 113 Proposed Solution 214 Structure of the Dissertation 2
2 Basic Concepts and Bibliographic Review 521 Biological Basic Concepts 5
211 Genome 5212 Transcriptome Assembly and Gene expression 7
22 RNA-Seq Analysis 9221 RNA-Seq microarrays and DNA sequencing 9222 RNA-Seq Pipeline 9
23 Standard File Formats used 12231 FASTA 12232 FASTQ 12233 SAM and BAM 12234 GFF and GTF 12
24 Relevant Data Repositories 1325 Tools for RNA-seq and Differential Analysis 1426 Relational and Non-relational Databases 1527 Tecnologies 1628 Related Work 1729 Chapter Summary 18
3 The Gemini framework 1931 Gemini 2032 Gemini Architecture 20
321 Physical Architecture 2033 Data Management 2234 Web Interface 2335 Use cases 2536 Case studies 25
361 Full pipeline 25362 Stage pipeline 26
37 Chapter Summary 26
ix
CONTENTS
4 Case study 2741 Samples characterization 2742 Researching objectives 2743 Protocol of analysis 2844 Genome version GRCh37 versus GRCh38 2845 Fusion genes 3046 Results 30
461 Case study with reference genome GRCh37 30462 Splicing analysis 31463 Case study with reference genome GRCh38 32
47 Chapter Summary 32
5 Conclusions and Future Work 33
References 35
A iRAP tools supported 39A1 Mappers 39A2 Quantification 39A3 Differential expression [DE] 40A4 Gene set enrichment analysis [GSE] 40
B iRAP model of configuration file 41
C iRAP example configuration file 47
x
List of Figures
21 Workflow of alternative splicing process 622 Genetic code table 723 Fusion genes generation types 824 The essential workflow for RNA-Seq analysis [kn11] 1025 iRAP pipeline for RNA sequencing analysis 1126 Print screen of Galaxy when trying to get data from UCSC 17
31 Physical architecture of Gemini 2032 File system tree demonstrating the hierarchy of saved data files 2233 Home page 2334 Logout menu 2335 Create job form 2436 Reference genomes component 2437 Use cases diagram 25
41 An overview of the Tuxedo Protocol with full steps TopHat for alignment Cuf-flinks package to find differential features between group samples and in the endCummeRbund to plot previous results 29
xi
LIST OF FIGURES
xii
List of Tables
21 DNA nucleotides corresponding to RNA ones 6
31 Collections used to store data 21
41 Genes differentially expressed between minimally invasive follicular thryoid car-cinomas (mFTCs) and widely invasive follicular thyroid carcinomas (wFTCs) 30
42 Statistical results for researching objectives number 2 and 3 3143 Potential novel isoforms for each sample of IPATIMUPrsquos data 3144 Number of differences between samples Syntax used S1 - Sample 1 S2 - Sample
2 S3 - Sample 3 and S4 - Sample 4 31
xiii
LIST OF TABLES
xiv
Abbreviations
BAM Binary Sequence AlignmentMapCSS Cascading Style SheetsDNA DesoxyriboNucleic AcidENCODE Encyclopedia of DNA ElementsGFF General Feature FormatGTF General Transfer FormatHTML HyperText Markup LanguagemRNA Messenger RNAORF Open Reading FrameRNA RiboNucleic AcidSAM Sequence AlignmentMapSQL Structured Query LanguageWSGI Web Server Gateway InterfacemFTC minimially invasive Follicular Thyroid CarcinomawFTC widely invasive Follicular Thyroid Carcinoma
xv
Chapter 1
Introduction
11 Context
Worldwide millions of people live every day with a diagnosis of cancer One of several possible
causes of this disease is an anomalous modification in the process of gene transcription [CH07]
more precisely in the early steps of the transcription process where the genes (DNA) are translated
to RNA It is common for a single gene to be transcribed to more than one transcript This is des-
ignated as alternative splicing [Joh03] It happens seldom that errors may occur and an aberrant
transcript can be generated and cause a disorder
In order to study this scientific problem researchers are now using high throughput technolo-
gies that provide them the ability to perform large scale experiments that otherwise would not be
humanly possible One of such technologies is called RNA-Seq [ZW09] in which its last step of
active gene differentiation may help researchers to understand the original biological question that
triggered the study
Although RNA-seq is a very valuable asset for genomic research it is quite often that further
analysis need to be performed to answer the initial research question Commonly those analysis
require the recollection of a lot of information stored in a diverse number of data bases spread
in the Internet This is often a very time consuming task for a biologist expert Moreover there
are some studies for which special toolsprograms have to be developed to process the output of
RNA-seq to answer specific questions of the study
12 Motivation and Goals
Since cancer is a worldwide disease that kills a large amount of people each year any develop-
ments in the treatment of such disease may have a large and very important social impact High-
throughput technologies like RNA-Seq represent already a major improvement for studies on the
genomic origins of cancer They have however some limitations that prevent them to be used in
1
Introduction
large scale by geneticists and Molecular Biologists They require both powerful computational
resources and programming and operating systems skills In order to help the biologist expert to
formulate useful scientific hypotheses genetic-based cancer studies require also the collection of
a large amount of extra information associated with the expressed genes This last task is usually
done by hand over the Internet and is very time consuming
Our goals are threefold to automate as much as possible the full process of RNA-seq analysis
up to the [aberrant] alternative splicing analysis to make the whole process easy to perform
including the data collection over the Internet and to extend the available RNA-seq tools with
software for extra special purposes analysis
13 Proposed Solution
Our proposal consists in the design development and deployment of a computational framework
that enables expert biologists to control the whole analysis process over a Web interface The
framework also includes the control and use of powerful computational resources in a transparent
way for the user
We will use the specific domain problem of assessing the impact of alternative splicing in
cancer as a use and test case by automating the full process from the reads analysis up to the
results of alternative splicing analysis It is also important to provide information enrichment that
might be useful to explain the occurrence of cancer originating from the alternative splicing To
achieve those the work includes the two main tasks design develop and deploy a web interface
to simplify the analysis process and assemble the existing iRAP pipeline Our contribution is
four fold make the whole process easy to use by the biologist expert design and deploy the data
analysis steps extend an existing pipeline with a module specific for splicing and apply our work
in IPATIMUPrsquos data on cancer Automation is the major contribution to improve efficiency and
quality of the scientific research on the impact of alternative splicing in cancer
14 Structure of the Dissertation
Besides this introductory chapter this report has the following structure Chapter 2 presents a
review of the state-of-the-art describing not only some tools from the molecular biology domain
but also the main biological base concepts It is also demonstrated the standard file formats used
as well as the relationship between relational and non-relational databases Lastly there is also a
brief overview of the related work
In Chapter 3 the proposed framework called Gemini is described The framework includes a
Web interface a data base an ftp server and a computational resources server The chapter starts
with the solution description of Gemini Afterwards the details of implementation are described
and finalizes with the characterization of the case studies done for validation purposes
2
Introduction
Chapter 4 introduces the case study where we have used real world data provided by IPA-
TIMUPrsquos researchers It starts with the samples characterization researching objectives and pro-
tocol of analysis Following the data results are described
The final conclusions of this Dissertation are then presented in Chapter 5 In this last chapter
we also point out further directions to extend the work done in the thesis The framework is
conceived in a way that extra modules may be developed and integrated in order to enable other
more specific analysis
3
Introduction
4
Chapter 2
Basic Concepts and BibliographicReview
In this chapter we present the biological basic concepts necessary to understand the thesis work and
we explain what it is gene expression and a more in-depth explanation of the alternative splicing
This will be followed by a state-of-the-art review of some different tools available to analyse RNA
and then a characterization of a pipeline till the gene expression results Some data repositories
are presented together with the data formats that might be used Finally we describe and analyse
some the important technologies used and describe the main differences between relational and
non-relational databases
21 Biological Basic Concepts
We start introducing some of biological basic concepts from the field of molecular biology
211 Genome
The flow of genetic information is known as the central dogma of molecular biology Accord-
ing to it RNA molecules are synthesized from DNA templates (transcription) and proteins are
synthesized from RNA templates (translation) [CH07]
RNA is a single-stranded molecule that is responsible for synthesizing the proteins of the cell
On the other hand DNA is a double-stranded molecule that carries the genetic information in all
cellular forms of life It can be copied or rsquoreplicatedrsquo as each strand can act as a template for the
generation of the complementary strand
Furthermore in DNA the information is stored in the linear sequence of the nucleotides along
each strand Each sequence of these nucleotides is called a gene that later on the translation process
may specify amino acids the elements of a protein
As such genes consist of three types of sequences
5
Basic Concepts and Bibliographic Review
Figure 21 Alternative splicing allows exons to be joined in different combinations resulting inthe formation of three distinct proteins from the single primary transcript
bull Coding regions called exons which specify a sequence of amino acids
bull Non-coding regions called introns which do not specify amino acids
bull Regulatory sequences which play a role in determining when and where the protein is made
In the process of splicing during the transcription the introns are removed and only exons are
included in the messenger RNA that will serve as basis of the production of some protein Even
though these introns do not carry useful information for further steps they allow the exons of a
gene to be joined in different combinations resulting in the synthesis of different proteins from the
same gene as seen in Figure 21 This mechanism is called alternative splicing and provides an
important tool for tissue-specific control of gene expression in complex cells [CH07]
During this process the nucleotides of DNA are transcribed to RNA ones through a par-based
code Each nucleotide of DNA has on its constitution one of the four bases Adenine (A) Guanine
(G) Thymine (T) or Cytosine (C) On the other hand a RNA strand is similar but the four possible
bases are Adenine (A) Guanine (G) Uracil (U) and Cytosine (C) The Table 21 relates each base
of DNA to RNA
DNA base RNA baseAdenine (A) Uracil (U)Thymine (T) Adenine (A)Guanine (G) Cytosine (C)Cytosine (C) Guanine (G)
Table 21 DNA nucleotides corresponding to RNA ones
6
Basic Concepts and Bibliographic Review
On RNA its four-letter rsquoalphabetrsquo forms rsquowordsrsquo of three letters called codons Individual
codons code for specific amino acids The genetic code is a table that relates the codons to the
corresponding amino acids (see Figure 22 1) One important information that we can retrieve
from this table is the start and the stop codons There is only one start codon the Methionine
(AUG combination) and it defines where the translation starts On the other hand there are three
possible combinations for the stop codon (TAA TAG and TGA) whose function is to determine
where the translation ends [GEN] Sometimes due to mutations the stop codon is not present
or misplaced in the strand due to an aberrant alternative splicing When this happens it may be
created an abnormal protein
Figure 22 Genetic code table
Another important concept is the Open Reading Frame (ORF) An ORF is a portion of DNA
that when translated into amino acids has no stop codons A long open reading frame is likely
part of a gene that will serve as basis to encode a protein
A fusion gene is a hybrid gene that is formed from two previously separated genes They can
result by either gene translocation interstitial deletion or chromosomal inversion (see Figure 23)
Nowadays 358 gene fusions involving 337 different genes have been identified and an increasing
number of gene fusions are being recognized as an important diagnostic and prognostic parameters
in malignant haematological disorders and childhood sarcomas An analysis of available data
shows that gene fusions occur in all malignancies and that they account for 20 of human cancer
morbidity [SOdMVN12]
212 Transcriptome Assembly and Gene expression
After the collected samples the next step is to prepare the library for further analysis It is common
for Biologists to use Illumina 2 for this task1Image source httpplatostanfordeduentriesinformation-biologicalGeneticCode
png2Illumina httpwwwilluminacom
7
Basic Concepts and Bibliographic Review
Figure 23 Fusion genes generation types
During the procedure it is performed a process called sequencing 3 that determines the order
of nucleotide bases within a stretch of DNA Next-generation sequencing (NGS) extends this tech-
nique across millions of reactions and involves rapid sequencing of large DNA stretches spanning
entire genomes
On particular for RNA Next-generation RNA sequencing enables researchers to identify and
quantify both rare and common transcripts align sequencing reads across splice junctions and de-
tect isoforms novel transcripts and gene fusions and perform robust whole-transcriptome analysis
on a wide range of samples including low-quality ones 4
A transcriptome is the a set of all RNA molecules transcribed from a RNA template [Wol13]
From the transcriptome and according to the used technique it is possible to count the number
of transcripts and then determine the amount of gene activity (gene expression) in a certain cell
or tissue type This is particularly useful when researchers are trying to discover the function of a
certain gene by analysing a transcriptome and the corresponding gene expression levels it can be
inferred what role does it play whether it is in cell growth or in fat storage for example [Ins] As
such transcriptome assembly is a computational reconstruction of RNA from smaller sequences
called reads and obtained experimentally
Differently from the genome the transcriptome actively changes according to context In
order to follow this changes there is a laboratory technique called microarray that measures the
expression of thousands of genes at the same time providing gene expression profiles [bNE]
The assembly can be done by either aligning the previous libraries obtained from Illumina to
a reference genome or reference transcripts or assembled de novo without the genomic sequence
to produce a genome-scale transcription map that consists of both the transcriptional structure and
or level of expression for each gene [ZW09]
3As in Illumina techniques description at httpwwwilluminacomapplicationssequencinghtml4As seen in httpwwwilluminacomapplicationssequencingrnahtml
8
Basic Concepts and Bibliographic Review
22 RNA-Seq Analysis
As stated in the previous section there are alternative techniques to obtain the gene expression In
this section we compare them and then provide detailed information on RNA-Seq
221 RNA-Seq microarrays and DNA sequencing
For the analysis of genome expression it is commonly used RNA sequencing Firstly it is cho-
sen this technique instead of DNA sequencing because some molecular features like alternative
isoforms can only be observed at the RNA level predicting transcript sequence from genome is
difficult and in functional studies even though genome may be constant an experimental condition
has a pronounced effect on gene expression Also it is a way to interpret mutations that do not
have an obvious effect in the protein sequence but affect what mRNA isoform is expressed and
how much [Gri]
Secondly even though microarrays have facilitated gene expression based analysis but provide
relatively little information about alternative splicing In late 90rsquos microarray experiments were
generally expensive limiting sample sizes which represented a disaster specially when associated
to thousands of independent observations per sample Some attempts have been made to surpass
this problem but none could perform well in brain tissue RNA-Seq then appeared as a method to
mapping and quantifying transcriptomes It has clear advantages over existing approaches since
it has a greater dynamic range detects both coding and noncoding RNAs is superior for gene
network construction detects spliced transcripts and allele specific expression and can be used
to extract genotype information Also by comparing both of them while microarray output is
fluorescence intensity the output from a RNA-Seq experiment is digital and comes in the form of
read counts [HBD+13]
Furthermore RNA-Seq provides a far more precise measurement of levels of transcripts and
their isoforms than other methods It can reveal precise location of transcription boundaries and
is particularly useful to apply on complex transcriptomes In addition RNA-Seq is shown to be
highly accurate for quantifying expression levels while requiring less RNA sample when compared
to another techniques [ZW09] and it also can resolve both gene expression level and alternative
splicing events simultaneously [GCW+10]
222 RNA-Seq Pipeline
RNA-Seq has become the tool of choice for genome-wide analysis of the transcriptome [ORY10
SG15] However a typical RNA-Seq experiment generates millions of raw sequence reads that re-
quire considerable computational resources and programming skills to process the data [GTBK11
ORY10 FPMB14 FMB14] An overview of a basic pipeline for such analysis can be found in
Figure 24
9
Basic Concepts and Bibliographic Review
Figure 24 The essential workflow for RNA-Seq analysis [kn11]
When no reference genome is available it is necessary to construct a de novo assembly This
step will not be considered here since it was not used on the thesis work Given this we are able to
hold this main concepts
Quality control a pre-processing step where quality of raw reads are assessed At this stage bad
ldquoqualityrdquo ones may be excluded from the data set preventing potential mapping mismatches
and providing a better performance in further states
Read alignment that aligns the (quality filtered) reads to a reference genome in order to recon-
struct the larger sequence
Quantification that summarises and aggregates reads over a biologically meaningful unit such as
exons isoforms or genes
Differential expression that identifies genes expressed being the basis for future assessing of
proteins function originating from such genes
Note that this is just a basis workflow for RNA-Seq analysis that provide the possibility to add
or remove some of the stages according to different purposes
iRAP - A pipeline for RNA-Seq
Usually a combination of different tools might be desirable but on the other side time con-
suming since they depend on each others inputoutput and they are frequently focused in single
purposes hence often incompatible with one another [WMM+11]
10
Basic Concepts and Bibliographic Review
iRAP 5 appears as an integrated solution that allows users to choose and apply their preferred
tools for mapping reads quantifying expression and testing for differential expression [FPMB14]
Figure 25 iRAP pipeline for RNA sequencing analysis
The Figure 25 shows the main steps for this methodology that by comparing with the previous
workflow (Figure 24) has two more stages Gene set enrichment and Web reports Gene set
enrichment is a means of analysing genomic data by studying the effects of groups of genes on a
phenotype rather then individual gene analysis [kn10] Web reports facilitate the inspection of the
results produced at different stages of the analysis by providing web pages with tables or plots of
information [FPMB14]
iRAP is also capable of performing analysis starting at any stage of the pipeline by choosing
the right command line options Currently it has the following five different stage options as
described below
setupstage0 check all directories and data files are present and at the expected place
stage1 quality filtering and reporting check fastq file quality and report
stage2 mapping to the transcriptome or to the genome
stage3 estimate gene expression
stage4 estimate differential expression
Furthermore the expert can choose the specific tool for each phase of the system some of
which are described in detail in further sections The current list of tools supported are available
in Appendix A
When using iRAP the user has the possibility to speed up the analysis by using the irap_lsf
command This method accepts the same parameters as iRAP but splits the analysis into multiple
jobs with the aim of reducing the time to analyze the data
5iRAP repository httpscodegooglecompirap
11
Basic Concepts and Bibliographic Review
23 Standard File Formats used
For the implementation of the previous pipeline some file formats are used to input or retrieve
data Below will be presented the most widely used ones along with some short description and
detail when needed
231 FASTA
FASTA 6 is the definition line and sequence character format used by NCBI 7 It is a text-based for-
mat for representing either nucleotide (DNA or RNA) or amino acid (protein) sequences FASTA
is commonly used since it is easy to manipulate and parse using text-processing tools and scripting
languages Usually in iRAP a FASTA format is used to store the a reference genome
232 FASTQ
FASTQ 8 provides a simple extension to the previous format the ability to store a numeric quality
score associated with each nucleotide in a sequence [CFG+10] It is generally used as the first
input with the raw data
233 SAM and BAM
SAM 9 is a generic format for storing large nucleotide sequence alignments It is easy to under-
stand easy to parse and easy to generate and check for errors Despite the presented qualities
SAM is slow to parse so a binary equivalent to it BAM has been developed to deal with this issue
BAM is used to intensive data processing and is useful in most product pipelines while SAM has
appropriate for interconversion with external applications and exploratory analysis Like FASTQ
BAMSAM formats are widely used as containers for raw sequence data
234 GFF and GTF
GFF 10 is a format for describing genes and other features associated with DNA RNA and Protein
sequences It was originally proposed as a protocol for the transfer of genomic feature information
allowing people to develop and test them without having to maintain a complete feature-finding
system The second version also allows for feature sets to be defined over RNA and Protein
sequences as well as genomic DNA
On the other hand GTF 11 stands for Gene transfer format and has been developed on top
of GFF specification The first eight GTF fields are the same as GFF The group field has been
6FASTA format httpgeneticsbwhharvardedupphFASTAhtml7NCBI httpwwwncbinlmnihgov8FASTQ format httpmaqsourceforgenetfastqshtml9SAM and BAM file formats httpsamtoolssourceforgenetSAMv1pdf
10GFF format httpwwwsangeracukresourcessoftwaregffspechtml11GTF format httpwwwensemblorginfowebsiteuploadgffhtml
12
Basic Concepts and Bibliographic Review
expanded into a list of attributes Each attribute consists of a typevalue pair Attributes must end
in a semi-colon and be separated from any following attribute by exactly one space
24 Relevant Data Repositories
It is important to validate results and test along with the implementation of RNA-Seq pipeline As
such real data are needed so that the quality and efficiency of this study is assessed Some repos-
itories are available online such as Gene Expression Omnibus (GEO 12) Genomic Data Sharing
(GDS 13) ENSEMBL 14 UCSC Genome Browser 15 or the ENCODE Project 16 The three last
ones are highlighted in next section
ENSEMBL
The Ensembl project provides information about many vertebrate and other eucaryotic species
being started in 1999 some years before the draft human genome was completed Until today
many genomes have been added over the years as well as the inclusion of comparative genomics
variation and regulatory data [HBB+02]
Between the included working teams of Ensembl the Genebuild is the one who is responsible
to create the gene sets both as developing and mantaining the BioMart 17 data mining tool
It also supplies a REST server 18 as well as an FTP tool for browse and download data [CAB+15]
UCSC Genome Browser
The UCSC Genome Browser is a website that consists of an open-source tool to browse
analyze and query genomic data Currently it grants access to some reference genomes giving the
possibility to retrieve specific data due to the search tool integrated
Along with this tool it is also available an FTP server where data can be accessed and down-
loaded
ENCODE Project
While ENSEMBL has information about many vertebrate and other species ENCODE is a
project to identify all functional elements in the human genome sequence as well as being able
to create comprehensive high quality catalogs of functional elements in the human genome using
highndashthroughput technologies Their mission is to enable the scientific and medical communities
12GEO httpwwwncbinlmnihgovgeo13GDS httpgdsnihgov02dr2html14ENSEMBL httpwwwensemblorgindexhtml15UCSC Genome Browser httpgenomeucscedu16ENCODE project httpswwwencodeprojectorg17BioMart httpbiomartorg18REST server of Ensembl httprestensemblorg
13
Basic Concepts and Bibliographic Review
to interpret the human genome sequence and apply it to understand human biology and improve
health [The04]
Besides their motivation an online repository is being build up indexing gathered data and
allowing users to query different data types regardless of location [Con11] Some samples can
be found at httpswwwencodeprojectorgexperimentsENCSR274JRR for ex-
ample
25 Tools for RNA-seq and Differential Analysis
To perform the RNA-Seq pipeline some tools for each process are required It is now presented
some set of them on the following sections
Bowtie
Bowtie 19 is a tool to align short reads to the human genome To achieve speed and memory-
efficiency Bowtie aligns reads with the aid of an index of the reference genome [Lan10] and can
take advantage of the use of simultaneous multiple processor cores [LTPS09] For the human
genome Burrows-Wheeler is a commonly used indexing process that this tool extends with a
novel quality-aware backtracking algorithm that permits mismatches
TopHat
TopHat 20 is used as a junction mapping tool for RNA-Seq reads Before TopHat current
mapping strategies could only localize reads to known exons in the genome This tool is a read-
mapping algorithm design to align reads to a reference genome without relying on know splice
sites [TPS09]
Cufflinks
Cufflinks 21 assembles transcripts estimates their abundances and tests for differential ex-
pression and regulation in RNA-Seq samples Internally it is made of four different parts Cuf-
flinks that assembles the package Cuffcompare that compares transcript assemblies to annotation
Cuffmerge that merges two or more transcript assemblies and Cuffdiff that takes the aligned reads
and reports genes and transcripts that are differentially expressed [TRG+12a]
HTSeq
19Bowtie httpbowtie-biosourceforgenetindexshtml20TopHat httpccbjhuedusoftwaretophatindexshtml21Cufflinks httpcole-trapnell-labgithubiocufflinks
14
Basic Concepts and Bibliographic Review
HTSeq 22 is a python framework to facilitate the rapid development of scripts to processing
and analysis of high-throughtput sequencing data
FASTQC
FASTQC 23 is a quality control tool for high-throughput sequencing data It receives as input
BAM SAM or FASTQ files provides a quick overview on which areas there may be problems
summarizes graphs and tables for a fast assess of data and exports results to an HTML based report
Samtools
Samtools 24 is a set of utilities to manipulate alignments in the BAM format (output format of
TopHat eg) It does sorting merging and indexing and allows to retrieve in any regions The
files can be either provided via standard input (stdin) of from a remote FTP or HTTP server
deFuse
deFuse 25 is a software for gene fusion discovery from RNA-Seq data It uses clusters of dis-
cordant paired alignments to inform a split read alignment analysis for finding fusion boundaries
As an output it produces a fully annotated output for each predicted fusion
26 Relational and Non-relational Databases
Relational Databases had been introduced in 1970 by Edgar Codd at IBM Almaden Research
Center [Cod70] It has been used for decades and has brought in the concept of relations With
this a relational database is usually represented by a structured model a table in which each row is
a tuple (also considered as an object) and the columns are the attributes of the tuple The database
can be queried in order to retrieve useful data based on their attributes whether in common between
tuples or not To do so it is used a structured query language SQL [LM10] The main set of
operations is known as CRUD Create Read Update and Delete Relational databases are also
know for their fixed schemas that force every tuple to have the exact same attributes
A very common operation in SQL databases are joins Joins are a way to associated data that
share attributes or are somehow related One example is imagining a table of people that have
bank accounts associated and there is another table where the existing banks are described A way
to relate them is to combine these two tables in order to directly view which individual is using
which bank This is a very simple example that can scale very quickly and become a dangerous
operation for the consumed resources to be used to compute the needed relationships
22HTSeq httpwww-huberembldeHTSeqdocoverviewhtml23FASTQC httpwwwbioinformaticsbabrahamacukprojectsfastqc24Samtools httpsamtoolssourceforgenet25deFuse httpsbitbucketorgdranewdefuse
15
Basic Concepts and Bibliographic Review
In contrast with the previous set a Non-relational database commonly doesnrsquot have a fixed
schema and avoid the previous complex operation Within this class of databases there are different
approaches to the used models such as key-value stores big table clones document databases and
graph databases Each of them is used accordingly to the data set complexity
MongoDB 26 is a non-relational database schemaless and is scalable in cluster performance
and data This way it provides a way to store large data sets with the freedom of using different
schemas according to data 27
27 Tecnologies
When developing a web service there are some basic resources and programming languages used
HTML 28 is a standard markup language for describing web documents CSS 29 is used for
defining how the HTML elements are to be displayed Bootstrap 30 is a free front-end frame-
work for faster and easier web development and contains HTML and CSS based design patterns
Javascript 31 serves as a method for programming the behavior of web pages jQuery 32 is a library
of Javascript that greatly specifies Javascriptrsquos usage
Even though commonly used PHP 33 is not the best suitable language for our thesis work
When compared to Python it lacks security and is not used on the Bioinformatics field On the
other hand Perl has been greatly used on this field but it is currently being replaced by Python 34
Furthermore this last one has libraries like BioPython 35 for internal processing of samples and
also has support to web through frameworks like Django 36 or BottlePy 37
Even though Django is trending it has no support for NoSQL relational databases yet Bot-
tlePy for instance is a lightweight web framework simple to use and provides the ability to use
MongoDB
Concerning the situation the combination of Python and BottlePy is the most suitable since it
has
bull Starting to replace Perl in bioinformatics processing
bull Support for NoSQL databases (either the framework and the programming language)
bull Lightweight usage
26MongoDB httpwwwmongodborg27MongoDB scalability httpwwwmongodbcommongodb-scale28HTML httpwwww3schoolscomhtml29CSS httpwwww3schoolscomcssdefaultasp30Bootstrap httpgetbootstrapcom31Javascript httpwwww3schoolscomjs32jQuery httpsjquerycom33PHP httpphpnet34Python httpswwwpythonorg35BioPython httpbiopythonorgwikiMain_Page36Django framework httpswwwdjangoprojectcom37BottlePy httpbottlepyorgdocsdevindexhtml
16
Basic Concepts and Bibliographic Review
Figure 26 Print screen of Galaxy when trying to get data from UCSC
For the purpose of sending the information between devices the FTP server solution was
analysed It allows the creation of an administrator user that has the permissions for writing and
reading but also for anonymous users that can only download data
28 Related Work
Galaxy
Galaxy 38 is an open source web-based platform for data intensive biomedical research
It consists of an embedded website system that provides access to different databases such
as Ensembl or UCSC Genome Browser Although functional the platform has not a consistent
interface which requires the user to learn to use many systems within it An example of this
situation can be viewed in Figure 26 Furthermore it does not provide the ability to choose easily
a stage pipeline like iRAP or to run a full one with personalized tools
BioMart Central Portal
BioMart 39 is a community-driven project to provide unified access to distributed research data
to facilitate the scientific discovery process
38Galaxy httpgalaxyprojectorg39BioMart Central Portal httpcentralbiomartorgsequencegui=Sequence_retrievalamp
mart=metaseq_mart_63_config
17
Basic Concepts and Bibliographic Review
It currently has a sequence retrieval tools that provides searching by database and dataset
Nowadays this tool offers Ensembl as the only available database but it adds up three other fea-
tures like a sequences filters and header information panels where the users can improve their
search
29 Chapter Summary
In this chapter we presented and discussed the technologies suitable for the thesis work We have
surveyed alternative technologies for gene expression computation and alternative splicing tools
The technologies are relevant to solve the Biological domain problem We have also surveyed
the tools for the development of websites and databases to store the data used when solving the
biological problems In the next chapter we describe work in detail
18
Chapter 3
The Gemini framework
Despite the very large number of tools available for Molecular Biology problems they are most
often difficult to use and require sophisticated computational resources As part of the thesis
work we have developed a framework that allows expert users to make RNA-Seq and alternative
splicing analysis using a user friendly web interface and sophisticated computational resources
In this chapter we describe that framework that include the website database resources for storing
data and the computational settings for the analysis
iRAP has been chosen to accomplish the automation of RNA sequencing analysis due to the
simplicity of use and its wide number of tools available for its task Since it is an integrated
tool platform its installation requires not only powerful computer resources but also a long list of
basic equipment necessary to each of them Considering these issues it had not always been easy
to setup the wanted work environment
Despite the difficulties of this scenario we have been able to complete the setup of this tool
and make some control experiments with it
In order to accomplish an iRAP execution a configuration file must be provided (see Ap-
pendix B) Along with the experiment name the name of species being analysed the reference
genome and read data files need to be specified and made available Furthermore the specific
tools for each stage of the pipeline need also to be specified among other possible variables
It is not easy and usually very time consuming for a Biologist to create the configuration file or
to run the command-line interface that controls iRAP pipeline Since this system is a combination
of many different tools there are a long list of available options that may be fulfilled Some of
them are mandatory while other ones are optional After this setting is completed it must be saved
in a text file and made available to run iRAP
Even though the usage of iRAP does not require extensive bioinformatics expertise it does
assume familiarity with UNIX command-line interface which would narrow down the target audi-
ence In order to overcome this situation we designed and developed a framework called Gemini
19
The Gemini framework
that includes a Graphical User Interface and makes RNA-Seq studies much more easy to perform
We have also included extra features for doing more analysis to RNA-Seq data
31 Gemini
Due to the lack of intuitiveness on the process of generating the configuration file it has been
created a more user friendly one through a web form This form asks for input of the main settings
to call a very simple experiment with a commonly used bacteria escherichia ecoli (e coli)
Another important feature is the possibility to fill the form asking what is the stage that the user
wants the pipeline to start with
Another issue was to find and easily download a reference genome for a certain species In
order to add completeness to Gemini and also to simplify the process of download it has been
implemented the functionality to download the reference genome (both fasta and annotation files)
It is used the Ensembl API to obtain the required results The jobs status feature lists the status of
jobs sent by the user for execution
Besides these features one more have been added even though not completed It is the job
results where it is presented the results collected for a determined task
32 Gemini Architecture
321 Physical Architecture
Gemini is divided into two different sets The first one is where the web application is hosted as
well as the database Since dealing with genomic data often requires great computer performance
processing experiments is accomplished in an independent server that later responds with results
Figure 31 Physical architecture of Gemini
Data scheme
MongoDB is NoSQL document based database The information is organized in collections
in which each element is stored as a JSON document NoSQL databases are simpler to use when it
20
The Gemini framework
comes to have different information fields in the same document and at the same time they have
better performance and scalability [SK11] Currently the information is arranjed in two collections
scheme as described on Table 31
Name DescriptionAccounts Stores the users dataJobs Stores the experiments dataTable 31 Collections used to store data
Accounts
An accountrsquos document stores an userrsquos email password and a unique identifier A role has
also been saved for future hierarchy creation in which some levels will grant more permissions
than others like changing accounts settings of other participants
1
2 _id ObjectId(54f5a9b234f76511a82ec3b2)
3 password e10adc3949ba59abbe56e057f20f883e
4 role user
5 email acgggomesgmailcom
6
Jobs
Jobs are related to an user and have the name and description of the experiment It also
stores the reference genomersquos location as well as the readsrsquo one Likewise the date of creation is
preserved When a job is completed the status is modified to finished
1
2 _id ObjectId(5544ecf134f7651d687bba94)
3 name ExpFinal
4 exp_dir data54f5a9b234f76511a82ec3b2ExpFinalreads
5 user 54f5a9b234f76511a82ec3b2
6 description Final test
7 genome_dir genomesEscherichia coli
8 status started
9 date ISODate(2015-05-02T152745249Z)
10
21
The Gemini framework
33 Data Management
In order to create a new job it is required two sets of data namely reference files and raw data
files The raw data is the actual data being analysed while the reference genome serves as basis to
the alignment or control
The typical workflow consists on the expert providing the experience and species names as
well as the raw data that was previously collected in the laboratory Afterwards through a step by
step system the user has the option to choose the reference genome to be used on the experiment
This last files are internally obtained from different FTP servers such as Ensembl and ENCODE
stored locally and reused in further usages
The provided information is then saved in the database and the files stored hierarchically We
use the following sequence of ltsection namegt ltuseridgt ltexperience namegt ltdata filesgt The
ltsection namegt can be conf for storing configuration files data for saving the reads or refer-
ence for keeping the reference genome and annotation files The ltuseridgt is the ID of Accounts
database document and the ltexperience namegt is the same as name in Jobs database document
A directory tree is represented in Figure 32
Figure 32 File system tree demonstrating the hierarchy of saved data files
This information is then passed to the server via a local FTP server that has been created
22
The Gemini framework
for this purpose We have followed an online tutorial 1 for the configuration From this we
created one administrator that has permissions for writing and reading files and we also authorized
anonymous login that may only retrieve files This way on the web application the admin user
creates the reads reference genomes annotation and configuration files On the computational
server an anonymous user authenticates for retrieving the files according to the filenames received
via API
The inside directory of FTP follows the hierarchy of ltuseridgt ltexperience namegt ltdata
filesgt where ltuseridgt is the ID on the Accounts document and ltexperience namegt is the name
on Jobs document When the server is prompted to run an experience it downloads the required
data from the FTP and runs iRAP with the necessary configuration options
34 Web Interface
For the implementation of Gemini python has been used for backend along with a simple fast and
lightweight WSGI micro web-framework called BottlePy 2 It has no dependencies and grants the
main functionalities such as routing templates some class utilities and a built-in server
The first screenshot (Figure 33) shows the home page of Gemini There is top menu bar with
two possible interactions login and register There is also a simple content box that describes the
main features and status of development of the platform Later on a new menu appears with the
possibility to logout on the Welcome tab (as in Figure 34)
Figure 33 Home page
Figure 34 Logout menu
1Tutorial available at httpswwwthomas-krenncomenwikiSetup_FTP_Server_under_Debian
2BottlePy httpbottlepyorgdocsdevindexhtml
23
The Gemini framework
The main feature of the system is the create job (Figure 35) option that is easily accessible on
top menu When the user clicks on it a form is displayed with the variables to introduce on the
configuration file that iRAP needs A description option has been added to provide the freedom to
the researcher to include some extra information that he finds useful
Figure 35 Create job form
The same type of form was used for the reference genomes section (Figure 36) The user is
prompted to choose orderly the species name release number and version Afterwards a table of
elements appears allowing the expert to download the files found
Figure 36 Reference genomes component
24
The Gemini framework
35 Use cases
Gemini was designed to have only one actor the user that will accomplish the experiments This
actor has the possibility to register login and logout of his account create a job and the hability
to download a reference genome of his choice Even though not fully implemented it has been
considered the jobs done functionality
Figure 37 Use cases diagram
36 Case studies
Some case studies with e coli in order to test iRAPrsquos installation and its capabilities For both
of the case studies it has been collected six samples of Escherichia coli reads from European
Nucleotide Archive 3 and the corresponding reference genome and annotation file from Ensembl
361 Full pipeline
In order to call the full pipeline iRAP has been tested with the directive irap conf=ecoli_exconf
Configuration file (ecoli_exconf ) content is as described in Appendix C In this task the system
received the reads and performed the quality control (QC) mapping quantification and differential
expression between the two groups of samples
3ENA httpwwwebiacukena
25
The Gemini framework
This test has been accomplished successfully
362 Stage pipeline
The stage pipeline is a powerful functionality since it allows the user to choose a specific stage of
the pipeline that he wants to execute for his samples
Besides the fact that it is not easy to collect data samples users often want to repeat or analyse
just one step of the pipeline and take some conclusions of it Furthermore this type of pipeline is
less time consuming
A concrete usage example is IPATIMUPrsquos data which contains the output information of the
mapper TopHat and will be further analysed in detail in Chapter 4 Concerning this setup it would
not be possible to call the full pipeline but instead it would require a command specific command
option
For validation purposes the same bacteria from the previous analysis has been used for the
stage pipeline case After calling the setup command to check input the directive irap conf=
ecoli_exconf quality_filtering_and_reporting has been used to perform the stage1
of iRAP The platform was able to perform with success this task
37 Chapter Summary
It has been used Python with BottlePy for the main implementation of the interface of Gemini
MongoDB has been chosen for dealing with information A FTP server was mounted for the
transitions of data between the client and the server The platform allows the expert to call a full or
stage pipeline analysis and provides the download of both fast and annotation files The essential
items are setup for the addition of further functionalities
26
Chapter 4
Case study
In this chapter it is going to be presented the Case Study with data from samples of thyroid carci-
noma along with their charactering and researching results
After the development of an interface to the iRAP tool the following step was to do a case
study with some realistic DNA samples of thyroid cancer patients regarding the partnership with
IPATIMUPrsquos researchers
The purpose of this case study was to do some research of potential differences between dis-
tinct types of the disease In order to accomplish this four samples were collected from Centro
Hospitalar de Satildeo Joatildeo (Porto) Cases 1 and 2 have been categorized as a widely invasive Fol-
licular Thyroid Carcinoma (wFTC) and cases 3 and 4 as a minimally invasive Follicular Thyroid
Carcinoma (mFTC)
41 Samples characterization
Patient from case 1 was female with 82 years old the tumour measuring 2 cm of size and presented
a predominant follicular growth pattern and oncocytic features Patient from case 2 was male with
55 years old the tumour measuring 5 cm of size and presented a predominant solidtrabecular
growth pattern For the group of mFTC patient from case 3 was female 56 years old the tumour
measuring 37 cm of size and with follicular growth pattern patient from case 4 was female 56
years old the tumour measuring 4 cm of size and with follicular growth pattern
42 Researching objectives
The aim of the study was to answer the following questions
bull Differentially expressed genes
bull Total isoforms found either in percentange and in absolute
27
Case study
bull Average of alternative isoforms for each gene spliced
bull Potentially novel isoforms and how do they behave between samplesgroups of samples
bull Compare results between versions of human genome assembly
bull Retrieve fusion genes
43 Protocol of analysis
Collected sample reads have been aligned against reference genome GRCh37 with TopHat version
141 Posterior analysis followed Tuxedo Protocol as described in Trapnell et al [TRG+12b] An
overview of the full protocol can be found in Figure 41
For the implementation of this procedure it were considered as two different groups the cases
1 and 2 (wFTC) against cases 3 and 4 (mFTC) The following step was to assemble transcripts for
each sample with Cufflinks 1 and afterwards create a single merged transcriptome annotation with
Cuffmerge 2 Cuffdiff 3 was then used to find significant changes in transcript expression
In order to find potential isoforms each sample was ran against the reference genome with
Cuffcompare 4
44 Genome version GRCh37 versus GRCh38
Even though IPATIMUPrsquos data have been assembled with reference genome version GRCh37
nowadays a more recent version (GRCh38) has been released in 2013 This new assembly is the
first major revision of the human genome in more than four years 5
The main differences between this two versions are
Alternate sequences several human chromosomal regions have sufficient variability to prevent
adequate representation by a single sequence This new version provides alternate sequence
for selected variant regions through the inclusion of alternate loci 6 scaffolds
Centromere 7 representation Previous method of representing centromeric regions have been
replaced by sequences from centromere models The models provide the approximate repeat
number and order for each centromere and are useful for read mapping and variation studies
Mitochondrial genome The new mitochondrial reference sequence is the Revised Cambridge
Reference Sequence with RefSeq accession number NC_0129201 The previous one was
RefSeq accession number NC_001907 which was not updated when GRCh37 assembly
later transitioned to the new version1Cufflinks httpcole-trapnell-labgithubiocufflinks2Cuffmerge httpcole-trapnell-labgithubiocufflinkscuffmergeindexhtml3Cuffdiff httpcole-trapnell-labgithubiocufflinkscuffdiffindexhtml4Cuffcompare httpcole-trapnell-labgithubiocufflinkscuffcompareindexhtml5As in UCSC mailing list at httpsgroupsgooglecomasoeucsceduforumtopic
genome-announce52Kv41YBXNY6Specific location of a gene on a chromosome
28
Case study
Figure 41 An overview of the Tuxedo Protocol with full steps TopHat for alignment Cufflinkspackage to find differential features between group samples and in the end CummeRbund to plotprevious results
Sequence updates Several erroneous bases and misassembled regions have been corrected and
more than 100 gaps have been filled or reduced
Analysis set The new assembly offers an analysis set that was created to accommodate next
generation sequencing read alignment pipelines Several GRCh38 regions have been elimi-
nated from this set to improve read mapping
29
Case study
45 Fusion genes
After we done some research on the technologies used for finding fusion genes in the reads we
have not been able to perform the analysis to answer the last question of our researching objectives
DeFuse required as input the original reads which were not provided This analysis would have
been interesting for relating the ocurrence of thyroid and the presence of fusion genes as well as if
there was any relevant difference between the samples of wFTC and mFTC
46 Results
461 Case study with reference genome GRCh37
The following table ( 41) demonstrates some genes that were differentially expressed with signif-
icance between mFTC and wFTC According to Celestino et al 8 CRABP1 C1QL1 and LCN2
are biomarkers of thyroid cancer and predictors of extrathyroidal extension It is commonly used
the value of 005 has threshold above which the differential expression is significant By inspect-
ing out the table we can find C1QL1 with a q-value of 0000555 and CRABP1 with a q-value
of 159E-11 which are in concordance with the previous article Furthermore it is verified the
increased gene expression in wFTC when compared to mFTC
Gene ID Gene Chr mFTC wFTC Fold change(log2) Q value
ENSG00000167748 KLK1 19 018672 111924 922742 0ENSG00000104725 NEFL 8 00196645 276961 104599 0ENSG00000174145 KIAA1239 4 00307388 144265 887444 0ENSG00000182379 NXPH4 12 008307 195786 788074 0ENSG00000131094 C1QL1 17 0121453 238957 429828 0000555ENSG00000142677 IL22RAI 1 150905 0384783 -529345 0ENSG00000138615 CILP 15 423569 0052726 -632793 241E-11ENSG00000141431 ASXL3 18 18938 001408 -707148 124E-09ENSG00000166426 CRABP1 15 748375 0367899 -766831 159E-11ENSG00000214145 LINC00887 3 19797 0119327 -737421 0000459
Table 41 Genes differentially expressed between minimally invasive follicular thryoid carcino-mas (mFTCs) and widely invasive follicular thyroid carcinomas (wFTCs)
In response to the previous researching objectives the Table 42 has the statistical results for
taks two and three From the data analysis we could conclude that less than 1 of genes have
isoforms but each one has an average of 389 alternatives
8Ricardo Celestino Torfin Nome Ana Pestana Andreas M Hoff Pedro A Gonccedilalves Catarina Eloy Eva SigstadRagnhild A Lothe Trine Bjoslashro Manuel Sobrinho-Simotildees Rofl I Skotheim Paula Soares CRAPBP1 C1QL1 andLCN2 are biomarkers of thyroid cancer and predictors of extrathyroidal extension subbmited for publication
30
Case study
Total genes 63896Total significant isoforms 689Total unique genes with isoforms 179Ratio of unique genes with isoformsgenes () 028Average of alternatives per gene with isoforms 389
Table 42 Statistical results for researching objectives number 2 and 3
462 Splicing analysis
Forward in the analysis Cuffcompare 9 has been used to search for novel isoforms when com-
pared to the reference genome The method was to compare each sample to the reference genome
and afterwards make an overlap of the results The main objective was then to infer about the
differences among wFTC and mFTC
Sample 1(wFTC)
Sample 2(wFTC)
Sample 3(mFTC)
Sample 4(mFTC)
Total genes 30440 36862 35539 37534Potential novel isoforms 7406 8450 8781 8830Table 43 Potential novel isoforms for each sample of IPATIMUPrsquos data
As demonstrated on Table 43 average there is a percentage of 24 of potentially novel iso-
forms found (at least one spliced junction is shared with a reference transcript) There is been
made an overlap of the results in order to encounter differences between wFTC and mFTC The
Table 44 presents the counting of differences between cases A brief analysis allows us to say
that we can not make any relationship between wFTC and mFTC On average there was a total of
3722 changes among this two sets The average within the sets are 3554 for wFTC and 3992 for
mFTC Given this results there was not a significant divergence to allow us to relate the splicing
and the occurrence of a more invasive Thyroid Carcinoma
Sets ChangesS1 S2 3554S1 S3 3609S1 S4 3612S2 S3 3847S2 S4 3820S3 S4 3929
Table 44 Number of differences between samples Syntax used S1 - Sample 1 S2 - Sample 2S3 - Sample 3 and S4 - Sample 4
9Cuffcompare httpcole-trapnell-labgithubiocufflinkscuffcompareindexhtml
31
Case study
463 Case study with reference genome GRCh38
In order to respond to the last research objective it has been applied the method of analysis has
before with a more recent human genome assembly After using the same protocol with Cufflinks
Cuffmerge and Cuffdiff sequentially we have come to some conclusions
The produced results of differential expression analysis for the same genes were very different
Genes that were highly significant before like C1QL1 and CRABP1 now had no relevance (q-
value gt 005) As mentioned before we had only access to TopHatrsquos output that used version
GRCh37 for the alignment and mapping process so we could not start from scratch the analysis
This outcome demonstrates two topics in particular
1 the introduction of novel annotations can make previous analysis outdated
2 there is the need to save the original reads in order to update earlier studies
The solution to this situation would have been to use the original reads to repeat the assembly
and then follow the Tuxedo protocol to collected correct and updated differential expression data
47 Chapter Summary
These section of development has been introduced in order to confer not only validation but also
to do some researching studies on the subject Four samples were collected and divided into two
distinct groups Tuxedo protocol was followed for responding to the research objectives The
case study for GRCh37 demonstrated the expression of C1QL1 and CRABP1 on wFTC when
compared to mFTC as indicated in the referred article On the other hand the same protocol when
applied with GRCh38 demonstrated the importance of saving the original reads and what is the
influence of newer releases in previous researching results Lastly the splicing analysis results did
not show any evidence of related isoforms count and the manifestation of the different stages of
the disease
32
Chapter 5
Conclusions and Future Work
The research of genomic-based cancers require highly complex data analysis Such analysis re-
quire most often the use of a large number of complex computational resources the gathering
of a lot of information over the Internet and the use of powerful computational resources Fur-
thermore the manipulation of the computational tools and resources require the assistance of an
informatics expert
The thesis work is a contribution towards the solution of the above mention problem We
propose and developed a framework that enables an expert biologist to perform genomic-based
complex analysis in a easy way and using the required powerful computational resources in a
transparent way
Using the developed framework we have used real data to address several research questions
provided by IPATIMUPrsquos researchers Firstly with the human genome GRCh37 we identified
two of the biomarkers of thyroid cancer by differential gene expression analysis Secondly we
found 689 significant isoforms 179 unique out of 63896 genes (ratio of 028) with an average
of 389 isoforms per gene Thirdly when trying to determine potential novel isoforms we came
at no conclusion of the differences of expression when comparing wFTC and mFTC The last
case was applying the Tuxedo protocol with the new GRCh38 on samples The outcome of the
experiment revealed the importance of saving the original reads and that newer releases become
previous analysis outdated
Future Work
This thesis work is just a starting point As stated before the framework was designed so it can be
extended with further modules to enable addressing other research questions
The case studies also showed us that RNA-seq analysis is very time consuming On the other
hand there are a lot of sub-tasks that can be run in parallel (like the task of aligning the reads)
33
Conclusions and Future Work
We will study and compare different techniques and opportunities to make RNA-seq in parallel as
much as possible
34
References
[bNE] Scitable by Nature Education Transcriptome available at httpwwwnaturecomscitabledefinitiontranscriptome-296 last accessJanuary 2015
[CAB+15] Fiona Cunningham M Ridwan Amode Daniel Barrell Kathryn Beal Konstanti-nos Billis Simon Brent Denise Carvalho-Silva Peter Clapham Guy CoatesStephen Fitzgerald Laurent Gil Carlos Garciacutea Giroacuten Leo Gordon ThibautHourlier Sarah E Hunt Sophie H Janacek Nathan Johnson Thomas Juette-mann Andreas K Kaumlhaumlri Stephen Keenan Fergal J Martin Thomas MaurelWilliam McLaren Daniel N Murphy Rishi Nag Bert Overduin Anne ParkerMateus Patricio Emily Perry Miguel Pignatelli Harpreet Singh Riat DanielSheppard Kieron Taylor Anja Thormann Alessandro Vullo Steven P WilderAmonida Zadissa Bronwen L Aken Ewan Birney Jennifer Harrow Rhoda Kin-sella Matthieu Muffato Magali Ruffier Stephen MJ Searle Giulietta SpudichStephen J Trevanion Andy Yates Daniel R Zerbino and Paul Flicek Ensembl2015 Nucleic Acids Research 43(D1)D662ndashD669 2015
[CFG+10] Peter J A Cock Christopher J Fields Naohisa Goto Michael L Heuer and Peter MRice The Sanger FASTQ file format for sequences with quality scores and theSolexaIllumina FASTQ variants Nucleic acids research 38(6)1767ndash71 April2010
[CH07] Geoffrey M Cooper and Robert E Hausman The Cell - A molecular approachAmerican Society for Microbiology 2007
[Cod70] E F Codd A relational model of data for large shared data banks Communica-tions of the ACM 13(6)377ndash387 June 1970
[Con11] The ENCODE Project Consortium A userrsquos guide to the encyclopedia of DNAelements (ENCODE) PLoS biology 9(4)e1001046 April 2011
[FMB14] N A Fonseca J A Marioni and A Brazma RNA-seq gene profiling - a system-atic empirical comparison Technical report May 2014
[FPMB14] Nuno A Fonseca Robert Petryszak John Marioni and Alvis Brazma irap - anintegrated rna-seq analysis pipeline bioRxiv 2014
[GCW+10] Qiang Gan Iouri Chepelev Gang Wei Lama Tarayrah Kairong Cui Keji Zhaoand Xin Chen Dynamic regulation of alternative splicing and chromatin structurein Drosophila gonads revealed by RNA-seq Cell research 20(7)763ndash83 July2010
35
REFERENCES
[GEN] GENIE Dna genes and chromossomes University of Leicesteravailable at httpwww2leacukdepartmentsgeneticsvgecschoolscollegestopicsdna-genes-chromosomes last access Jan-uary 2015
[Gri] Malachi Griffith Bioinformatics for Cancer Genomics (BiCG)available at httpbioinformaticscaworkshops2012bioinformatics-cancer-genomics-bicg last access January 2015
[GTBK11] Angela Goncalves Andrew Tikhonov Alvis Brazma and Misha Kapushesky Apipeline for RNA-seq data processing and quality assessment Bioinformatics (Ox-ford England) 27(6)867ndash9 March 2011
[HBB+02] T Hubbard D Barker E Birney G Cameron Y Chen L Clark T CoxJ Cuff V Curwen T Down R Durbin E Eyras J Gilbert M HammondL Huminiecki A Kasprzyk H Lehvaslaiho P Lijnzaad C Melsopp E Mon-gin R Pettett M Pocock S Potter A Rust E Schmidt S Searle G SlaterJ Smith W Spooner A Stabenau J Stalker E Stupka A Ureta-Vidal I Vastrikand M Clamp The ensembl genome database project Nucleic Acids Research30(1)38ndash41 2002
[HBD+13] R Hitzemann D Bottomly P Darakjian N Walter O Iancu R SearlesB Wilmot and S McWeeney Genes behavior and next-generation RNA se-quencing Genes Brain Behav 12(1)1ndash12 Feb 2013
[Ins] National Human Genome Research Institute Transcriptome available at httpwwwgenomegov13014330 last access January 2015
[Joh03] Jason M Johnson Genome-wide survey of human alternative pre-mrna splicingwith exon junction microarrays Science 3022141ndash2144 December 2003
[kn10] Gene set enrichment a problem of pathways Briefings in functional genomics9(5-6)385ndash90 December 2010
[kn11] Overview of available methods for diverse RNA-Seq data analyses Science ChinaLife sciences 54(12)1121ndash8 December 2011
[Lan10] Ben Langmead Aligning short sequencing reads with Bowtie Current proto-cols in bioinformatics editoral board Andreas D Baxevanis [et al] Chapter11Unit 117 December 2010
[LM10] Adam Lith and Jakob Mattsson Investigating storage solutions for large data - acomparison of well performing and scalable data storage solutions for real timeextraction and batch insertion of data Masterrsquos thesis 2010
[LTPS09] Ben Langmead Cole Trapnell Mihai Pop and Steven L Salzberg Ultrafastand memory-efficient alignment of short DNA sequences to the human genomeGenome biology 10(3)R25 January 2009
[ORY10] Alicia Oshlack Mark D Robinson and Matthew D Young From RNA-seq readsto differential expression results Genome biology 11(12)220 January 2010
[SG15] Marc W Schmid and Ueli Grossniklaus Rcount simple and flexible RNA-Seqread counting Bioinformatics 31(3)436ndash437 February 2015
36
REFERENCES
[SK11] Christof Strauch and Walter Kriha NoSQL databases Lecture Notes StuttgartMedia University February 2011
[SOdMVN12] Mikhail Shugay Intildeigo Ortiz de Mendiacutebil Joseacute L Vizmanos and Francisco JNovo Genomic hallmarks of genes involved in chromosomal translocations inhematological cancer PLoS Comput Biol 8(12)e1002797 12 2012
[The04] The ENCODE Project Consortium The ENCODE (ENCyclopedia Of DNA Ele-ments) Project Science (New York NY) 306(5696)636ndash40 October 2004
[TPS09] Cole Trapnell Lior Pachter and Steven L Salzberg TopHat discovering splicejunctions with RNA-Seq Bioinformatics (Oxford England) 25(9)1105ndash11 May2009
[TRG+12a] Cole Trapnell Adam Roberts Loyal Goff Geo Pertea Daehwan Kim David RKelley Harold Pimentel Steven L Salzberg John L Rinn and Lior Pachter Dif-ferential gene and transcript expression analysis of RNA-seq experiments withTopHat and Cufflinks Nature protocols 7(3)562ndash78 March 2012
[TRG+12b] Cole Trapnell Adam Roberts Loyal Goff Geo Pertea Daehwan Kim David RKelley Harold Pimentel Steven L Salzberg John L Rinn and Lior Pachter Dif-ferential gene and transcript expression analysis of RNA-seq experiments withTopHat and Cufflinks Nature protocols 7(3)562ndash78 March 2012
[WMM+11] Ying Wang Gaurang Mehta Rajiv Mayani Jingxi Lu Tade Souaiaia YanghoChen Andrew Clark Hee Jae Yoon Lin Wan Oleg V Evgrafov James AKnowles Ewa Deelman and Ting Chen RseqFlow workflows for RNA-Seq dataanalysis Bioinformatics (Oxford England) 27(18)2598ndash600 September 2011
[Wol13] Jochen B W Wolf Principles of transcriptome analysis and gene expressionquantification an rna-seq tutorial Molecular Ecology Resources 13(4)559ndash5722013
[ZW09] Mark Gerstein |amp Michael Snyder Zhong Wang Rna-seq a revolutionary tool fortranscriptomics Nature Reviews Genetics 1057ndash63 January 2009
37
REFERENCES
38
Appendix A
iRAP tools supported
A1 Mappers
Mapper Option name (mapper)TopHat 1 tophat1TopHat 2 tophat2SMALT smaltGSNAP gsnapSOAPsplice soapspliceBWA bwa1BWA bwa2Bowtie 1 bowtie1Bowtie2 bowtie2GEM gemSTAR starOSA osaMapSplice mapsplice
A2 Quantification
Quantifier Option name (quant_method)FluxCapacitor flux_capHT-Seq (union mode) htseq1HT-Seq (intersection non-empty mode) htseq2Cufflinks 1 (try to find novel transcripts-g) cufflinks1Cufflinks 2 (try to find novel transcripts-g) cufflinks2Cufflinks 1 (do not assemble novel transcripts-G) cufflinks1_ndCufflinks 2 (do not assemble novel transcripts-G) cufflinks2_ndNURD nurd
39
iRAP tools supported
A3 Differential expression [DE]
Method Option name (de_method)DESeq deseqDESeq2 deseq2EdgeR edgerCuffdiff 1 cuffdiff1Cuffdiff 2 cuffdiff2
A4 Gene set enrichment analysis [GSE]
Tool Option name (gse_tool)Piano piano
40
Appendix B
iRAP model of configuration file
1 This is a comment (lines that start with a are ignored by iRAP)
2 =============================================================================
3 name that you want to give to the experiment (no spaces)
4 All files produced by irap will be placed in a folder with the given name
5 name=myexp
6
7
8 =============================================================================
9 name of the species
10 species=homo_sapiens
11
12 =============================================================================
13 Fasta file with the reference genome
14 reference=Homo_sapiensGRCh3766dnafa
15
16 =============================================================================
17 GTF file with the annotations
18 gtf_file=Homo_sapiensGRCh3766gtf
19
20 =============================================================================
21 IRAP options (may be providedoverriden in the command line)
22
23
24 Mapper
25 mapper=
26
27
28 Quantification method
29 quant_method=
30
31
32 Dif expression method
33 Requires contrasts to be defined (see below)
41
iRAP model of configuration file
34 de_method=
35
36
37 Gene set enrichment (GSE) analysis
38 Requires de_method to be defined
39 Tool to use (none|piano)
40 gse_tool=piano
41
42 gse_method (mean|median|sum|fisher|fisher-exact|stouffer|tailStrength|wilcoxon|
reporter|page) see Piano vignete documentation for more details
43 gse_method=fisher
44 gse_pvalue=005
45 Minimum number of genes in a gene set
46 gse_minsize=3
47
48
49
50 TSV file with gene annotation
51 Format IDNamelocussourcelnameGOGOtermKEGG
52 Description
53 ID=gene_id (this is mandatory and should match the one given in the gtf file)
54 Name=gene name
55 locus=chrstart--end
56 source=biotype
57 lname=gene name
58 GO=go ids (multiple values can be separated by)
59 GO=GO terms (multiple values can be separated by)
60 KEGG=Kegg ids (multiple values can be separated by)
61 If auto is defined then iRAP will try to generate the file
62 - this may take a considerable amount of time and will only work
63 for a reduced number of species
64 off - default value
65 annot_tsv=
66
67
68 QC
69 Check data (reads) quality (on|off|none)
70 on - reads are filtered out based on their quality
71 off - the quality of the reads is assessed but no filtering is done
72 none- no quality control is performed
73 qual_filtering=on
74
75 Trim all reads to the minimum read size after quality trimming - Yes (y)| No (n)
76 only applicable if qual_filtering is on
77 trim_reads=y
78
79 Minimum base quality accepted (def 10)
80 min_read_quality=10
81
42
iRAP model of configuration file
82 Contamination check (cont_index parameter) Reads that likely
83 originate from organisms other than the one under study can be
84 discarded during pre-processment of the reads This is done by
85 aligning the reads to the genomes of organisms that might be a
86 source of contamination and discard those that map with a high
87 degree of fidelity By default iRAP will check if the data is
88 contaminated by e-coli An example to create a contamination
89 database is provided in the examplesex_add2contaminationDBsh
90 script The value of the parameter should be the file name prefix of
91 the bowtie index files
92
93 Disable contamination check
94 cont_index=no
95 Default value
96 cont_index=$(data_dir)contaminatione_coli
97
98
99 Misc options
100
101 Number of threads that may be used by IRAP
102 max_threads=1
103
104 Exon level quantification Yes (y)| No (n)
105 exon_quant=y
106
107 Transcript level quantification Yes (y)| No (n)
108 transcript_quant=y
109 =============================================================================
110 full or relative path to the directory where all the data can be found
111 data_dir=data
112
113 the directory should be organized as follows (see directory data in IRAP toplevel
directory)
114
115 $data_dir
116 $data_dir
117 contamination
118 e_coli1ebwt
119 e_coli2ebwt
120 e_coli3ebwt
121 e_coli4ebwt
122 e_coliREADME
123 e_colirev1ebwt
124 e_colirev2eb
125 raw_data
126 $species
127 fastq
128 fastq
129
43
iRAP model of configuration file
130 reference
131 $species
132 $gtf_file
133 $reference
134
135 Notes
136 1) $ denotes the value defined for the variable
137 2) Since version 050 the raw data (fastqbam) files may be
138 distributed across several sub-folders
139
140
141 =============================================================================
142 Only necessary if you intend to perform Differential Expression analysis
143
144 contrasts=contrast_def [contrast_def ]
145 contrasts=purpleVsPink purpleVsGrey
146
147 definition of each constrast
148 contrast= group group [ group ]
149 purlpleVsPink=Purple Pink
150 purlpleVsGrey=Purple Grey
151
152 groups
153 GroupName= Library_name [Library_name ]
154 Purlple=myLib1 myLib2
155 Pink=myLib3
156 Grey=myLib4
157
158 optional parameter used in the report (HTML) generation
159 groups=Purple Pink Grey
160
161 technical replicates
162 technicalreplicates=myLib1myLib2myLib3mylib4
163
164 Note names of groups contrasts and libraries should start with a letter and
contain only alphanumeric characters and the character _
165
166 =============================================================================
167 Data
168
169
170 Information for each library
171 LibName=Fastq file
172 Note
173 1 LibName should start with a letter and contain only alphanumeric characters
and the character _ LibName should not contain in _1 or _2
174 2 LibName should be different from the name of the fastq file for instance
175 f1=f1fastq
176 will produce an error
44
iRAP model of configuration file
177
178 Single-end
179 myLib1=f1fastq
180 read size
181 myLib1_rs=75
182 quality encoding (33 or 64)
183 myLib1_qual=33
184
185 strand specific protocol
186 mylib1_strand=first
187 mylib1_strand=second
188 Default value is both (strands)
189 mylib1_strand=both
190
191 Have the file in a different sub-folder
192 mylib1_dir=somesubfolder
193
194 See SAMBAM specification for more details about the following two parameters
195 read group id (to be included in the BAM file) - this is not supported by all
mappers
196 myLib1_rgid=
197 sambam header lines to include in the BAM file
198 myLib1_shl=COtThis is a commentnCOtand another line
199
200 LibName=Fastq file
201 myLib2=f2fastq
202 read size
203 myLib2_rs=75
204 quality encoding (33 or 64)
205 myLib2_qual=33
206
207
208 Paired-end
209 LibName=Fastq files
210 myLib3=f3_1fastq f3_2fastq
211 read size
212 myLib3_rs=50
213 quality encoding (33 or 64)
214 myLib3_qual=33
215 insert size
216 myLib3_ins=350
217 standard deviation
218 myLib3_sd=60
219
220 LibName=Fastq files
221 myLib4=f4_1fastq f4_2fastq
222 read size
223 myLib4_rs=50
224 quality encoding (33 or 64)
45
iRAP model of configuration file
225 myLib4_qual=33
226 insert size
227 myLib4_ins=350
228 standard deviation
229 myLib4_sd=60
230
231
232
233
234 list the names of your single-end (se) and paired (pe) libraries
235 se=myLib1 myLib2
236 pe=myLib3 myLib4
237 No SE data
238 se=
239 No PE data
240 pe=
241
242
243
244 Passingoverriding parameters
245
246 It is possible to pass parameters to the mappers and quantification
247 methods but that should be done carefully since it may break the
248 pipeline (if the location of the input andor output files is
249 changed)
250
251 Overridingchanging the mappersrsquo parameters
252 _map_options=options
253 Example
254 tophat2_map_options=--min-intron-length 5 --no-coverage-search
255
256 Overridingchanging the parameters of the quantification methods
257 _params=options
258 Example
259 htseq_params= -q
46
Appendix C
iRAP example configuration file
1 minimal configuration file for DE
2 experiment name
3 name=ecoli_ex
4 species
5 species=ecoli_k12
6 reference genome
7 reference=Escherichia_coli_str_k_12_substr_mg1655GCA_000005845119dnatoplevel
fagz
8 gtf file
9 gtf_file=Escherichia_coli_str_k_12_substr_mg1655GCA_000005845119gtfgz
10 Enable filtering based on quality
11 qual_filtering=on
12 Use a contamination data set to filter out reads
13 cont_index=no
14 Toplevel directory with the data
15 data_dir=
16
17 some contrasts
18 GA=Group A
19 contrasts=GAvsGB GBvsGA
20 GAvsGB=GA GB
21 GBvsGA=GB GA
22 GA=FA FB FC
23 GB=FD FE FF
24
25 se=FA FB FC FD FE FF
26
27 FA=SRR933983fastqgz
28 FA_rs=50
29 FA_qual=33
30
31 FB=SRR933984fastqgz
32 FB_rs=50
47
iRAP example configuration file
33 FB_qual=33
34
35 FC=SRR933985fastqgz
36 FC_rs=50
37 FC_qual=33
38
39 FD=SRR933989fastqgz
40 FD_rs=50
41 FD_qual=33
42
43 FE=SRR933990fastqgz
44 FE_rs=50
45 FE_qual=33
46
47 FF=SRR933990fastqgz
48 FF_rs=50
49 FF_qual=33
50 EOF
48
- Front Page
- Table of Contents
- List of Figures
- List of Tables
- 1 Introduction
-
- 11 Context
- 12 Motivation and Goals
- 13 Proposed Solution
- 14 Structure of the Dissertation
-
- 2 Basic Concepts and Bibliographic Review
-
- 21 Biological Basic Concepts
-
- 211 Genome
- 212 Transcriptome Assembly and Gene expression
-
- 22 RNA-Seq Analysis
-
- 221 RNA-Seq microarrays and DNA sequencing
- 222 RNA-Seq Pipeline
-
- 23 Standard File Formats used
-
- 231 FASTA
- 232 FASTQ
- 233 SAM and BAM
- 234 GFF and GTF
-
- 24 Relevant Data Repositories
- 25 Tools for RNA-seq and Differential Analysis
- 26 Relational and Non-relational Databases
- 27 Tecnologies
- 28 Related Work
- 29 Chapter Summary
-
- 3 The Gemini framework
-
- 31 Gemini
- 32 Gemini Architecture
-
- 321 Physical Architecture
-
- 33 Data Management
- 34 Web Interface
- 35 Use cases
- 36 Case studies
-
- 361 Full pipeline
- 362 Stage pipeline
-
- 37 Chapter Summary
-
- 4 Case study
-
- 41 Samples characterization
- 42 Researching objectives
- 43 Protocol of analysis
- 44 Genome version GRCh37 versus GRCh38
- 45 Fusion genes
- 46 Results
-
- 461 Case study with reference genome GRCh37
- 462 Splicing analysis
- 463 Case study with reference genome GRCh38
-
- 47 Chapter Summary
-
- 5 Conclusions and Future Work
- References
- A iRAP tools supported
-
- A1 Mappers
- A2 Quantification
- A3 Differential expression [DE]
- A4 Gene set enrichment analysis [GSE]
-
- B iRAP model of configuration file
- C iRAP example configuration file
-
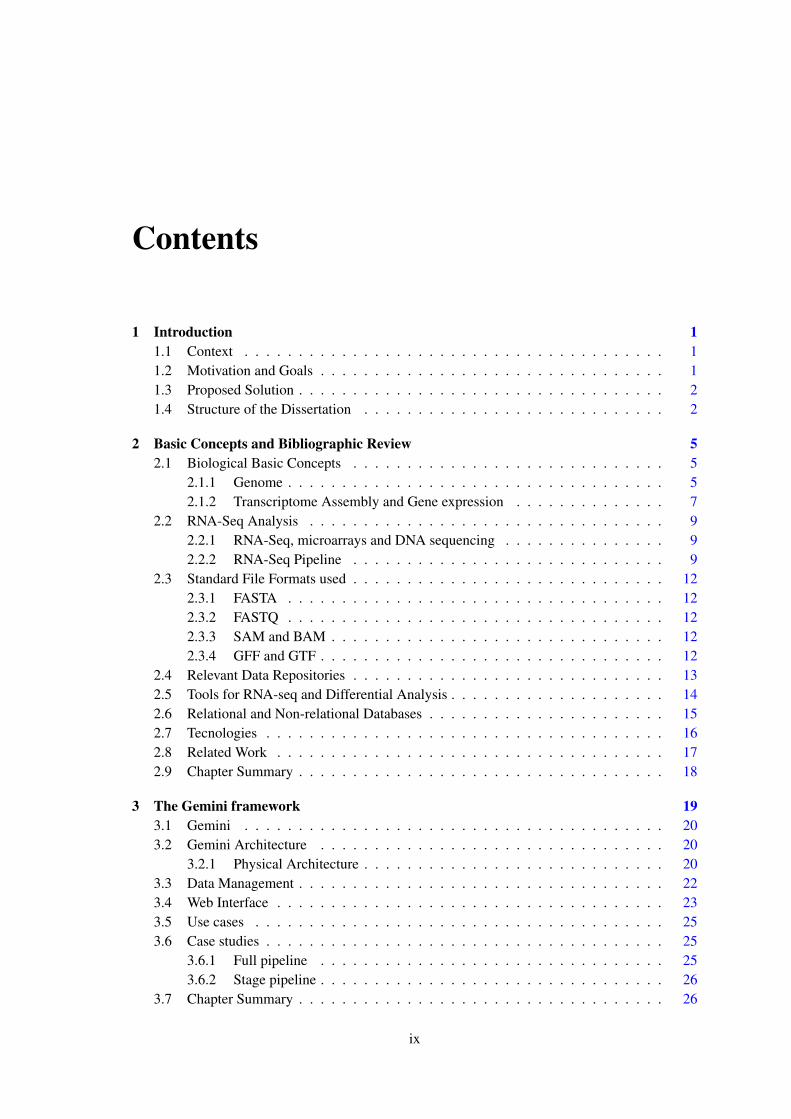
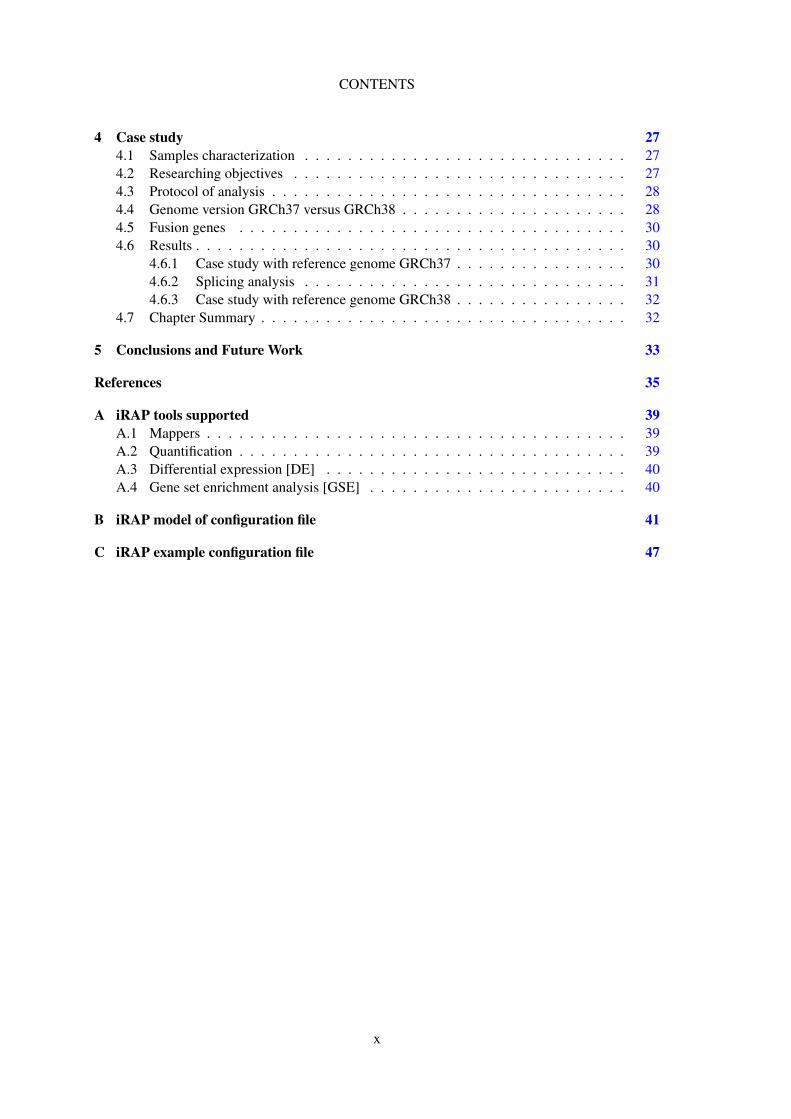
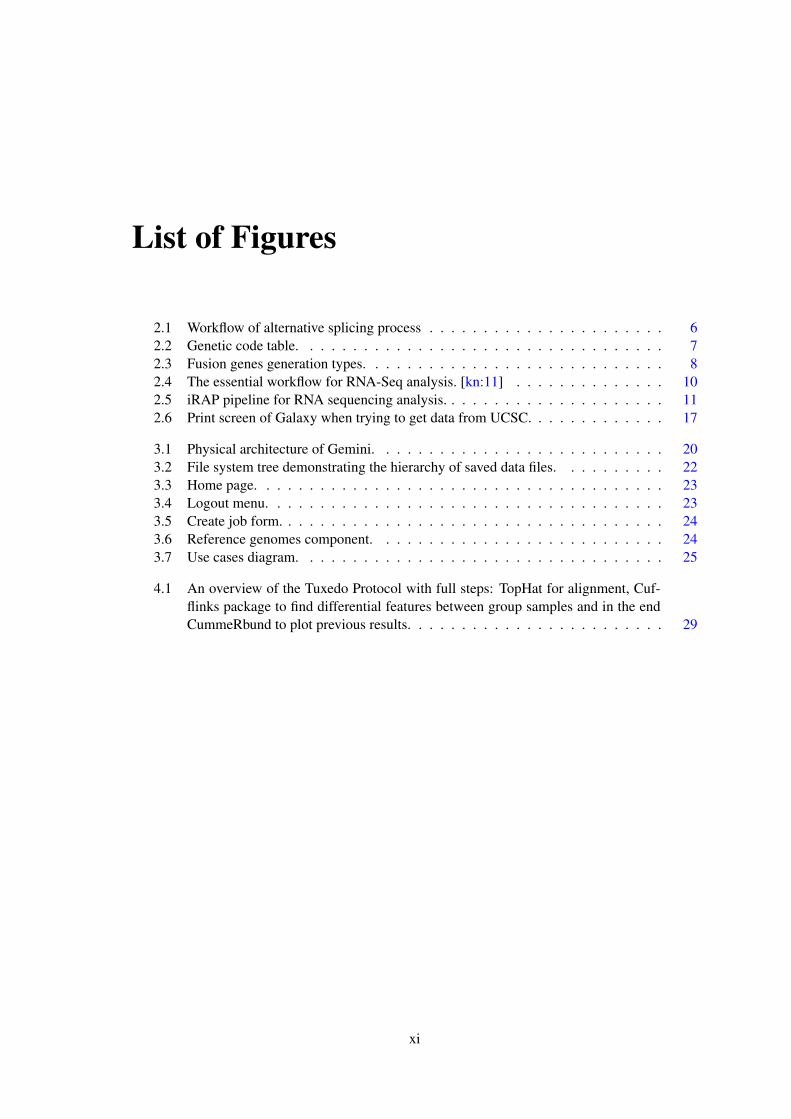
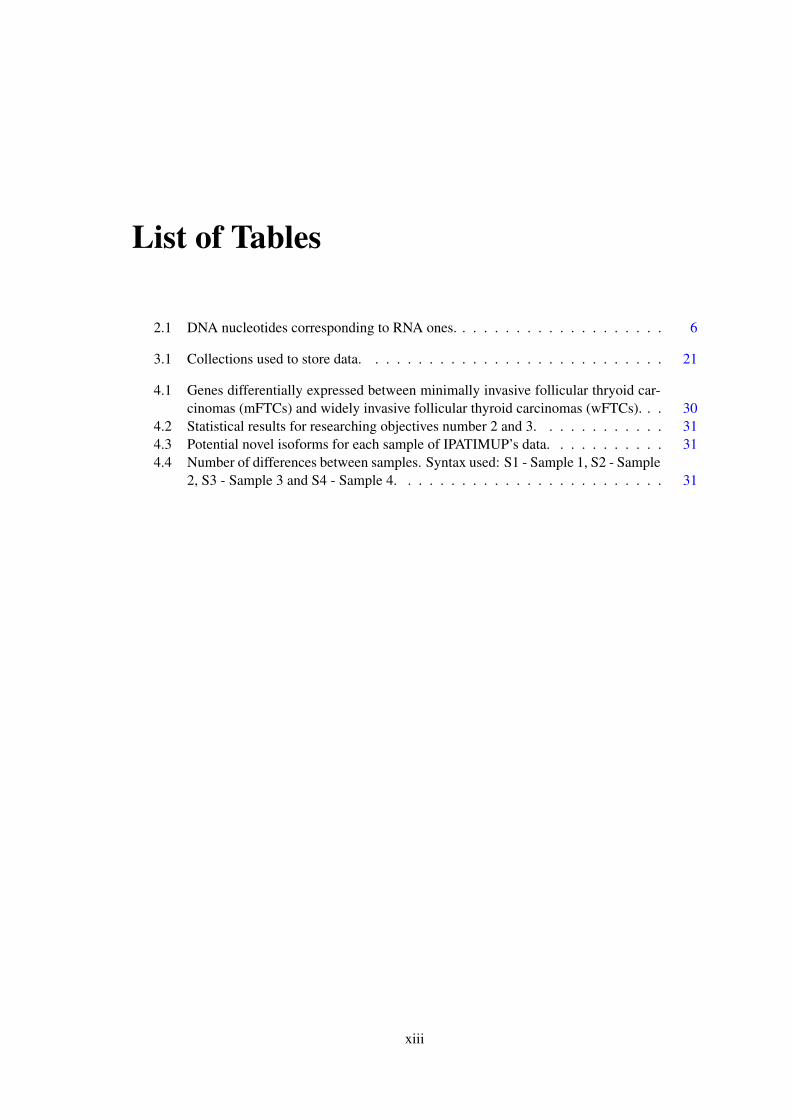
Introduction
large scale by geneticists and Molecular Biologists They require both powerful computational
resources and programming and operating systems skills In order to help the biologist expert to
formulate useful scientific hypotheses genetic-based cancer studies require also the collection of
a large amount of extra information associated with the expressed genes This last task is usually
done by hand over the Internet and is very time consuming
Our goals are threefold to automate as much as possible the full process of RNA-seq analysis
up to the [aberrant] alternative splicing analysis to make the whole process easy to perform
including the data collection over the Internet and to extend the available RNA-seq tools with
software for extra special purposes analysis
13 Proposed Solution
Our proposal consists in the design development and deployment of a computational framework
that enables expert biologists to control the whole analysis process over a Web interface The
framework also includes the control and use of powerful computational resources in a transparent
way for the user
We will use the specific domain problem of assessing the impact of alternative splicing in
cancer as a use and test case by automating the full process from the reads analysis up to the
results of alternative splicing analysis It is also important to provide information enrichment that
might be useful to explain the occurrence of cancer originating from the alternative splicing To
achieve those the work includes the two main tasks design develop and deploy a web interface
to simplify the analysis process and assemble the existing iRAP pipeline Our contribution is
four fold make the whole process easy to use by the biologist expert design and deploy the data
analysis steps extend an existing pipeline with a module specific for splicing and apply our work
in IPATIMUPrsquos data on cancer Automation is the major contribution to improve efficiency and
quality of the scientific research on the impact of alternative splicing in cancer
14 Structure of the Dissertation
Besides this introductory chapter this report has the following structure Chapter 2 presents a
review of the state-of-the-art describing not only some tools from the molecular biology domain
but also the main biological base concepts It is also demonstrated the standard file formats used
as well as the relationship between relational and non-relational databases Lastly there is also a
brief overview of the related work
In Chapter 3 the proposed framework called Gemini is described The framework includes a
Web interface a data base an ftp server and a computational resources server The chapter starts
with the solution description of Gemini Afterwards the details of implementation are described
and finalizes with the characterization of the case studies done for validation purposes
2
Introduction
Chapter 4 introduces the case study where we have used real world data provided by IPA-
TIMUPrsquos researchers It starts with the samples characterization researching objectives and pro-
tocol of analysis Following the data results are described
The final conclusions of this Dissertation are then presented in Chapter 5 In this last chapter
we also point out further directions to extend the work done in the thesis The framework is
conceived in a way that extra modules may be developed and integrated in order to enable other
more specific analysis
3
Introduction
4
Chapter 2
Basic Concepts and BibliographicReview
In this chapter we present the biological basic concepts necessary to understand the thesis work and
we explain what it is gene expression and a more in-depth explanation of the alternative splicing
This will be followed by a state-of-the-art review of some different tools available to analyse RNA
and then a characterization of a pipeline till the gene expression results Some data repositories
are presented together with the data formats that might be used Finally we describe and analyse
some the important technologies used and describe the main differences between relational and
non-relational databases
21 Biological Basic Concepts
We start introducing some of biological basic concepts from the field of molecular biology
211 Genome
The flow of genetic information is known as the central dogma of molecular biology Accord-
ing to it RNA molecules are synthesized from DNA templates (transcription) and proteins are
synthesized from RNA templates (translation) [CH07]
RNA is a single-stranded molecule that is responsible for synthesizing the proteins of the cell
On the other hand DNA is a double-stranded molecule that carries the genetic information in all
cellular forms of life It can be copied or rsquoreplicatedrsquo as each strand can act as a template for the
generation of the complementary strand
Furthermore in DNA the information is stored in the linear sequence of the nucleotides along
each strand Each sequence of these nucleotides is called a gene that later on the translation process
may specify amino acids the elements of a protein
As such genes consist of three types of sequences
5
Basic Concepts and Bibliographic Review
Figure 21 Alternative splicing allows exons to be joined in different combinations resulting inthe formation of three distinct proteins from the single primary transcript
bull Coding regions called exons which specify a sequence of amino acids
bull Non-coding regions called introns which do not specify amino acids
bull Regulatory sequences which play a role in determining when and where the protein is made
In the process of splicing during the transcription the introns are removed and only exons are
included in the messenger RNA that will serve as basis of the production of some protein Even
though these introns do not carry useful information for further steps they allow the exons of a
gene to be joined in different combinations resulting in the synthesis of different proteins from the
same gene as seen in Figure 21 This mechanism is called alternative splicing and provides an
important tool for tissue-specific control of gene expression in complex cells [CH07]
During this process the nucleotides of DNA are transcribed to RNA ones through a par-based
code Each nucleotide of DNA has on its constitution one of the four bases Adenine (A) Guanine
(G) Thymine (T) or Cytosine (C) On the other hand a RNA strand is similar but the four possible
bases are Adenine (A) Guanine (G) Uracil (U) and Cytosine (C) The Table 21 relates each base
of DNA to RNA
DNA base RNA baseAdenine (A) Uracil (U)Thymine (T) Adenine (A)Guanine (G) Cytosine (C)Cytosine (C) Guanine (G)
Table 21 DNA nucleotides corresponding to RNA ones
6
Basic Concepts and Bibliographic Review
On RNA its four-letter rsquoalphabetrsquo forms rsquowordsrsquo of three letters called codons Individual
codons code for specific amino acids The genetic code is a table that relates the codons to the
corresponding amino acids (see Figure 22 1) One important information that we can retrieve
from this table is the start and the stop codons There is only one start codon the Methionine
(AUG combination) and it defines where the translation starts On the other hand there are three
possible combinations for the stop codon (TAA TAG and TGA) whose function is to determine
where the translation ends [GEN] Sometimes due to mutations the stop codon is not present
or misplaced in the strand due to an aberrant alternative splicing When this happens it may be
created an abnormal protein
Figure 22 Genetic code table
Another important concept is the Open Reading Frame (ORF) An ORF is a portion of DNA
that when translated into amino acids has no stop codons A long open reading frame is likely
part of a gene that will serve as basis to encode a protein
A fusion gene is a hybrid gene that is formed from two previously separated genes They can
result by either gene translocation interstitial deletion or chromosomal inversion (see Figure 23)
Nowadays 358 gene fusions involving 337 different genes have been identified and an increasing
number of gene fusions are being recognized as an important diagnostic and prognostic parameters
in malignant haematological disorders and childhood sarcomas An analysis of available data
shows that gene fusions occur in all malignancies and that they account for 20 of human cancer
morbidity [SOdMVN12]
212 Transcriptome Assembly and Gene expression
After the collected samples the next step is to prepare the library for further analysis It is common
for Biologists to use Illumina 2 for this task1Image source httpplatostanfordeduentriesinformation-biologicalGeneticCode
png2Illumina httpwwwilluminacom
7
Basic Concepts and Bibliographic Review
Figure 23 Fusion genes generation types
During the procedure it is performed a process called sequencing 3 that determines the order
of nucleotide bases within a stretch of DNA Next-generation sequencing (NGS) extends this tech-
nique across millions of reactions and involves rapid sequencing of large DNA stretches spanning
entire genomes
On particular for RNA Next-generation RNA sequencing enables researchers to identify and
quantify both rare and common transcripts align sequencing reads across splice junctions and de-
tect isoforms novel transcripts and gene fusions and perform robust whole-transcriptome analysis
on a wide range of samples including low-quality ones 4
A transcriptome is the a set of all RNA molecules transcribed from a RNA template [Wol13]
From the transcriptome and according to the used technique it is possible to count the number
of transcripts and then determine the amount of gene activity (gene expression) in a certain cell
or tissue type This is particularly useful when researchers are trying to discover the function of a
certain gene by analysing a transcriptome and the corresponding gene expression levels it can be
inferred what role does it play whether it is in cell growth or in fat storage for example [Ins] As
such transcriptome assembly is a computational reconstruction of RNA from smaller sequences
called reads and obtained experimentally
Differently from the genome the transcriptome actively changes according to context In
order to follow this changes there is a laboratory technique called microarray that measures the
expression of thousands of genes at the same time providing gene expression profiles [bNE]
The assembly can be done by either aligning the previous libraries obtained from Illumina to
a reference genome or reference transcripts or assembled de novo without the genomic sequence
to produce a genome-scale transcription map that consists of both the transcriptional structure and
or level of expression for each gene [ZW09]
3As in Illumina techniques description at httpwwwilluminacomapplicationssequencinghtml4As seen in httpwwwilluminacomapplicationssequencingrnahtml
8
Basic Concepts and Bibliographic Review
22 RNA-Seq Analysis
As stated in the previous section there are alternative techniques to obtain the gene expression In
this section we compare them and then provide detailed information on RNA-Seq
221 RNA-Seq microarrays and DNA sequencing
For the analysis of genome expression it is commonly used RNA sequencing Firstly it is cho-
sen this technique instead of DNA sequencing because some molecular features like alternative
isoforms can only be observed at the RNA level predicting transcript sequence from genome is
difficult and in functional studies even though genome may be constant an experimental condition
has a pronounced effect on gene expression Also it is a way to interpret mutations that do not
have an obvious effect in the protein sequence but affect what mRNA isoform is expressed and
how much [Gri]
Secondly even though microarrays have facilitated gene expression based analysis but provide
relatively little information about alternative splicing In late 90rsquos microarray experiments were
generally expensive limiting sample sizes which represented a disaster specially when associated
to thousands of independent observations per sample Some attempts have been made to surpass
this problem but none could perform well in brain tissue RNA-Seq then appeared as a method to
mapping and quantifying transcriptomes It has clear advantages over existing approaches since
it has a greater dynamic range detects both coding and noncoding RNAs is superior for gene
network construction detects spliced transcripts and allele specific expression and can be used
to extract genotype information Also by comparing both of them while microarray output is
fluorescence intensity the output from a RNA-Seq experiment is digital and comes in the form of
read counts [HBD+13]
Furthermore RNA-Seq provides a far more precise measurement of levels of transcripts and
their isoforms than other methods It can reveal precise location of transcription boundaries and
is particularly useful to apply on complex transcriptomes In addition RNA-Seq is shown to be
highly accurate for quantifying expression levels while requiring less RNA sample when compared
to another techniques [ZW09] and it also can resolve both gene expression level and alternative
splicing events simultaneously [GCW+10]
222 RNA-Seq Pipeline
RNA-Seq has become the tool of choice for genome-wide analysis of the transcriptome [ORY10
SG15] However a typical RNA-Seq experiment generates millions of raw sequence reads that re-
quire considerable computational resources and programming skills to process the data [GTBK11
ORY10 FPMB14 FMB14] An overview of a basic pipeline for such analysis can be found in
Figure 24
9
Basic Concepts and Bibliographic Review
Figure 24 The essential workflow for RNA-Seq analysis [kn11]
When no reference genome is available it is necessary to construct a de novo assembly This
step will not be considered here since it was not used on the thesis work Given this we are able to
hold this main concepts
Quality control a pre-processing step where quality of raw reads are assessed At this stage bad
ldquoqualityrdquo ones may be excluded from the data set preventing potential mapping mismatches
and providing a better performance in further states
Read alignment that aligns the (quality filtered) reads to a reference genome in order to recon-
struct the larger sequence
Quantification that summarises and aggregates reads over a biologically meaningful unit such as
exons isoforms or genes
Differential expression that identifies genes expressed being the basis for future assessing of
proteins function originating from such genes
Note that this is just a basis workflow for RNA-Seq analysis that provide the possibility to add
or remove some of the stages according to different purposes
iRAP - A pipeline for RNA-Seq
Usually a combination of different tools might be desirable but on the other side time con-
suming since they depend on each others inputoutput and they are frequently focused in single
purposes hence often incompatible with one another [WMM+11]
10
Basic Concepts and Bibliographic Review
iRAP 5 appears as an integrated solution that allows users to choose and apply their preferred
tools for mapping reads quantifying expression and testing for differential expression [FPMB14]
Figure 25 iRAP pipeline for RNA sequencing analysis
The Figure 25 shows the main steps for this methodology that by comparing with the previous
workflow (Figure 24) has two more stages Gene set enrichment and Web reports Gene set
enrichment is a means of analysing genomic data by studying the effects of groups of genes on a
phenotype rather then individual gene analysis [kn10] Web reports facilitate the inspection of the
results produced at different stages of the analysis by providing web pages with tables or plots of
information [FPMB14]
iRAP is also capable of performing analysis starting at any stage of the pipeline by choosing
the right command line options Currently it has the following five different stage options as
described below
setupstage0 check all directories and data files are present and at the expected place
stage1 quality filtering and reporting check fastq file quality and report
stage2 mapping to the transcriptome or to the genome
stage3 estimate gene expression
stage4 estimate differential expression
Furthermore the expert can choose the specific tool for each phase of the system some of
which are described in detail in further sections The current list of tools supported are available
in Appendix A
When using iRAP the user has the possibility to speed up the analysis by using the irap_lsf
command This method accepts the same parameters as iRAP but splits the analysis into multiple
jobs with the aim of reducing the time to analyze the data
5iRAP repository httpscodegooglecompirap
11
Basic Concepts and Bibliographic Review
23 Standard File Formats used
For the implementation of the previous pipeline some file formats are used to input or retrieve
data Below will be presented the most widely used ones along with some short description and
detail when needed
231 FASTA
FASTA 6 is the definition line and sequence character format used by NCBI 7 It is a text-based for-
mat for representing either nucleotide (DNA or RNA) or amino acid (protein) sequences FASTA
is commonly used since it is easy to manipulate and parse using text-processing tools and scripting
languages Usually in iRAP a FASTA format is used to store the a reference genome
232 FASTQ
FASTQ 8 provides a simple extension to the previous format the ability to store a numeric quality
score associated with each nucleotide in a sequence [CFG+10] It is generally used as the first
input with the raw data
233 SAM and BAM
SAM 9 is a generic format for storing large nucleotide sequence alignments It is easy to under-
stand easy to parse and easy to generate and check for errors Despite the presented qualities
SAM is slow to parse so a binary equivalent to it BAM has been developed to deal with this issue
BAM is used to intensive data processing and is useful in most product pipelines while SAM has
appropriate for interconversion with external applications and exploratory analysis Like FASTQ
BAMSAM formats are widely used as containers for raw sequence data
234 GFF and GTF
GFF 10 is a format for describing genes and other features associated with DNA RNA and Protein
sequences It was originally proposed as a protocol for the transfer of genomic feature information
allowing people to develop and test them without having to maintain a complete feature-finding
system The second version also allows for feature sets to be defined over RNA and Protein
sequences as well as genomic DNA
On the other hand GTF 11 stands for Gene transfer format and has been developed on top
of GFF specification The first eight GTF fields are the same as GFF The group field has been
6FASTA format httpgeneticsbwhharvardedupphFASTAhtml7NCBI httpwwwncbinlmnihgov8FASTQ format httpmaqsourceforgenetfastqshtml9SAM and BAM file formats httpsamtoolssourceforgenetSAMv1pdf
10GFF format httpwwwsangeracukresourcessoftwaregffspechtml11GTF format httpwwwensemblorginfowebsiteuploadgffhtml
12
Basic Concepts and Bibliographic Review
expanded into a list of attributes Each attribute consists of a typevalue pair Attributes must end
in a semi-colon and be separated from any following attribute by exactly one space
24 Relevant Data Repositories
It is important to validate results and test along with the implementation of RNA-Seq pipeline As
such real data are needed so that the quality and efficiency of this study is assessed Some repos-
itories are available online such as Gene Expression Omnibus (GEO 12) Genomic Data Sharing
(GDS 13) ENSEMBL 14 UCSC Genome Browser 15 or the ENCODE Project 16 The three last
ones are highlighted in next section
ENSEMBL
The Ensembl project provides information about many vertebrate and other eucaryotic species
being started in 1999 some years before the draft human genome was completed Until today
many genomes have been added over the years as well as the inclusion of comparative genomics
variation and regulatory data [HBB+02]
Between the included working teams of Ensembl the Genebuild is the one who is responsible
to create the gene sets both as developing and mantaining the BioMart 17 data mining tool
It also supplies a REST server 18 as well as an FTP tool for browse and download data [CAB+15]
UCSC Genome Browser
The UCSC Genome Browser is a website that consists of an open-source tool to browse
analyze and query genomic data Currently it grants access to some reference genomes giving the
possibility to retrieve specific data due to the search tool integrated
Along with this tool it is also available an FTP server where data can be accessed and down-
loaded
ENCODE Project
While ENSEMBL has information about many vertebrate and other species ENCODE is a
project to identify all functional elements in the human genome sequence as well as being able
to create comprehensive high quality catalogs of functional elements in the human genome using
highndashthroughput technologies Their mission is to enable the scientific and medical communities
12GEO httpwwwncbinlmnihgovgeo13GDS httpgdsnihgov02dr2html14ENSEMBL httpwwwensemblorgindexhtml15UCSC Genome Browser httpgenomeucscedu16ENCODE project httpswwwencodeprojectorg17BioMart httpbiomartorg18REST server of Ensembl httprestensemblorg
13
Basic Concepts and Bibliographic Review
to interpret the human genome sequence and apply it to understand human biology and improve
health [The04]
Besides their motivation an online repository is being build up indexing gathered data and
allowing users to query different data types regardless of location [Con11] Some samples can
be found at httpswwwencodeprojectorgexperimentsENCSR274JRR for ex-
ample
25 Tools for RNA-seq and Differential Analysis
To perform the RNA-Seq pipeline some tools for each process are required It is now presented
some set of them on the following sections
Bowtie
Bowtie 19 is a tool to align short reads to the human genome To achieve speed and memory-
efficiency Bowtie aligns reads with the aid of an index of the reference genome [Lan10] and can
take advantage of the use of simultaneous multiple processor cores [LTPS09] For the human
genome Burrows-Wheeler is a commonly used indexing process that this tool extends with a
novel quality-aware backtracking algorithm that permits mismatches
TopHat
TopHat 20 is used as a junction mapping tool for RNA-Seq reads Before TopHat current
mapping strategies could only localize reads to known exons in the genome This tool is a read-
mapping algorithm design to align reads to a reference genome without relying on know splice
sites [TPS09]
Cufflinks
Cufflinks 21 assembles transcripts estimates their abundances and tests for differential ex-
pression and regulation in RNA-Seq samples Internally it is made of four different parts Cuf-
flinks that assembles the package Cuffcompare that compares transcript assemblies to annotation
Cuffmerge that merges two or more transcript assemblies and Cuffdiff that takes the aligned reads
and reports genes and transcripts that are differentially expressed [TRG+12a]
HTSeq
19Bowtie httpbowtie-biosourceforgenetindexshtml20TopHat httpccbjhuedusoftwaretophatindexshtml21Cufflinks httpcole-trapnell-labgithubiocufflinks
14
Basic Concepts and Bibliographic Review
HTSeq 22 is a python framework to facilitate the rapid development of scripts to processing
and analysis of high-throughtput sequencing data
FASTQC
FASTQC 23 is a quality control tool for high-throughput sequencing data It receives as input
BAM SAM or FASTQ files provides a quick overview on which areas there may be problems
summarizes graphs and tables for a fast assess of data and exports results to an HTML based report
Samtools
Samtools 24 is a set of utilities to manipulate alignments in the BAM format (output format of
TopHat eg) It does sorting merging and indexing and allows to retrieve in any regions The
files can be either provided via standard input (stdin) of from a remote FTP or HTTP server
deFuse
deFuse 25 is a software for gene fusion discovery from RNA-Seq data It uses clusters of dis-
cordant paired alignments to inform a split read alignment analysis for finding fusion boundaries
As an output it produces a fully annotated output for each predicted fusion
26 Relational and Non-relational Databases
Relational Databases had been introduced in 1970 by Edgar Codd at IBM Almaden Research
Center [Cod70] It has been used for decades and has brought in the concept of relations With
this a relational database is usually represented by a structured model a table in which each row is
a tuple (also considered as an object) and the columns are the attributes of the tuple The database
can be queried in order to retrieve useful data based on their attributes whether in common between
tuples or not To do so it is used a structured query language SQL [LM10] The main set of
operations is known as CRUD Create Read Update and Delete Relational databases are also
know for their fixed schemas that force every tuple to have the exact same attributes
A very common operation in SQL databases are joins Joins are a way to associated data that
share attributes or are somehow related One example is imagining a table of people that have
bank accounts associated and there is another table where the existing banks are described A way
to relate them is to combine these two tables in order to directly view which individual is using
which bank This is a very simple example that can scale very quickly and become a dangerous
operation for the consumed resources to be used to compute the needed relationships
22HTSeq httpwww-huberembldeHTSeqdocoverviewhtml23FASTQC httpwwwbioinformaticsbabrahamacukprojectsfastqc24Samtools httpsamtoolssourceforgenet25deFuse httpsbitbucketorgdranewdefuse
15
Basic Concepts and Bibliographic Review
In contrast with the previous set a Non-relational database commonly doesnrsquot have a fixed
schema and avoid the previous complex operation Within this class of databases there are different
approaches to the used models such as key-value stores big table clones document databases and
graph databases Each of them is used accordingly to the data set complexity
MongoDB 26 is a non-relational database schemaless and is scalable in cluster performance
and data This way it provides a way to store large data sets with the freedom of using different
schemas according to data 27
27 Tecnologies
When developing a web service there are some basic resources and programming languages used
HTML 28 is a standard markup language for describing web documents CSS 29 is used for
defining how the HTML elements are to be displayed Bootstrap 30 is a free front-end frame-
work for faster and easier web development and contains HTML and CSS based design patterns
Javascript 31 serves as a method for programming the behavior of web pages jQuery 32 is a library
of Javascript that greatly specifies Javascriptrsquos usage
Even though commonly used PHP 33 is not the best suitable language for our thesis work
When compared to Python it lacks security and is not used on the Bioinformatics field On the
other hand Perl has been greatly used on this field but it is currently being replaced by Python 34
Furthermore this last one has libraries like BioPython 35 for internal processing of samples and
also has support to web through frameworks like Django 36 or BottlePy 37
Even though Django is trending it has no support for NoSQL relational databases yet Bot-
tlePy for instance is a lightweight web framework simple to use and provides the ability to use
MongoDB
Concerning the situation the combination of Python and BottlePy is the most suitable since it
has
bull Starting to replace Perl in bioinformatics processing
bull Support for NoSQL databases (either the framework and the programming language)
bull Lightweight usage
26MongoDB httpwwwmongodborg27MongoDB scalability httpwwwmongodbcommongodb-scale28HTML httpwwww3schoolscomhtml29CSS httpwwww3schoolscomcssdefaultasp30Bootstrap httpgetbootstrapcom31Javascript httpwwww3schoolscomjs32jQuery httpsjquerycom33PHP httpphpnet34Python httpswwwpythonorg35BioPython httpbiopythonorgwikiMain_Page36Django framework httpswwwdjangoprojectcom37BottlePy httpbottlepyorgdocsdevindexhtml
16
Basic Concepts and Bibliographic Review
Figure 26 Print screen of Galaxy when trying to get data from UCSC
For the purpose of sending the information between devices the FTP server solution was
analysed It allows the creation of an administrator user that has the permissions for writing and
reading but also for anonymous users that can only download data
28 Related Work
Galaxy
Galaxy 38 is an open source web-based platform for data intensive biomedical research
It consists of an embedded website system that provides access to different databases such
as Ensembl or UCSC Genome Browser Although functional the platform has not a consistent
interface which requires the user to learn to use many systems within it An example of this
situation can be viewed in Figure 26 Furthermore it does not provide the ability to choose easily
a stage pipeline like iRAP or to run a full one with personalized tools
BioMart Central Portal
BioMart 39 is a community-driven project to provide unified access to distributed research data
to facilitate the scientific discovery process
38Galaxy httpgalaxyprojectorg39BioMart Central Portal httpcentralbiomartorgsequencegui=Sequence_retrievalamp
mart=metaseq_mart_63_config
17
Basic Concepts and Bibliographic Review
It currently has a sequence retrieval tools that provides searching by database and dataset
Nowadays this tool offers Ensembl as the only available database but it adds up three other fea-
tures like a sequences filters and header information panels where the users can improve their
search
29 Chapter Summary
In this chapter we presented and discussed the technologies suitable for the thesis work We have
surveyed alternative technologies for gene expression computation and alternative splicing tools
The technologies are relevant to solve the Biological domain problem We have also surveyed
the tools for the development of websites and databases to store the data used when solving the
biological problems In the next chapter we describe work in detail
18
Chapter 3
The Gemini framework
Despite the very large number of tools available for Molecular Biology problems they are most
often difficult to use and require sophisticated computational resources As part of the thesis
work we have developed a framework that allows expert users to make RNA-Seq and alternative
splicing analysis using a user friendly web interface and sophisticated computational resources
In this chapter we describe that framework that include the website database resources for storing
data and the computational settings for the analysis
iRAP has been chosen to accomplish the automation of RNA sequencing analysis due to the
simplicity of use and its wide number of tools available for its task Since it is an integrated
tool platform its installation requires not only powerful computer resources but also a long list of
basic equipment necessary to each of them Considering these issues it had not always been easy
to setup the wanted work environment
Despite the difficulties of this scenario we have been able to complete the setup of this tool
and make some control experiments with it
In order to accomplish an iRAP execution a configuration file must be provided (see Ap-
pendix B) Along with the experiment name the name of species being analysed the reference
genome and read data files need to be specified and made available Furthermore the specific
tools for each stage of the pipeline need also to be specified among other possible variables
It is not easy and usually very time consuming for a Biologist to create the configuration file or
to run the command-line interface that controls iRAP pipeline Since this system is a combination
of many different tools there are a long list of available options that may be fulfilled Some of
them are mandatory while other ones are optional After this setting is completed it must be saved
in a text file and made available to run iRAP
Even though the usage of iRAP does not require extensive bioinformatics expertise it does
assume familiarity with UNIX command-line interface which would narrow down the target audi-
ence In order to overcome this situation we designed and developed a framework called Gemini
19
The Gemini framework
that includes a Graphical User Interface and makes RNA-Seq studies much more easy to perform
We have also included extra features for doing more analysis to RNA-Seq data
31 Gemini
Due to the lack of intuitiveness on the process of generating the configuration file it has been
created a more user friendly one through a web form This form asks for input of the main settings
to call a very simple experiment with a commonly used bacteria escherichia ecoli (e coli)
Another important feature is the possibility to fill the form asking what is the stage that the user
wants the pipeline to start with
Another issue was to find and easily download a reference genome for a certain species In
order to add completeness to Gemini and also to simplify the process of download it has been
implemented the functionality to download the reference genome (both fasta and annotation files)
It is used the Ensembl API to obtain the required results The jobs status feature lists the status of
jobs sent by the user for execution
Besides these features one more have been added even though not completed It is the job
results where it is presented the results collected for a determined task
32 Gemini Architecture
321 Physical Architecture
Gemini is divided into two different sets The first one is where the web application is hosted as
well as the database Since dealing with genomic data often requires great computer performance
processing experiments is accomplished in an independent server that later responds with results
Figure 31 Physical architecture of Gemini
Data scheme
MongoDB is NoSQL document based database The information is organized in collections
in which each element is stored as a JSON document NoSQL databases are simpler to use when it
20
The Gemini framework
comes to have different information fields in the same document and at the same time they have
better performance and scalability [SK11] Currently the information is arranjed in two collections
scheme as described on Table 31
Name DescriptionAccounts Stores the users dataJobs Stores the experiments dataTable 31 Collections used to store data
Accounts
An accountrsquos document stores an userrsquos email password and a unique identifier A role has
also been saved for future hierarchy creation in which some levels will grant more permissions
than others like changing accounts settings of other participants
1
2 _id ObjectId(54f5a9b234f76511a82ec3b2)
3 password e10adc3949ba59abbe56e057f20f883e
4 role user
5 email acgggomesgmailcom
6
Jobs
Jobs are related to an user and have the name and description of the experiment It also
stores the reference genomersquos location as well as the readsrsquo one Likewise the date of creation is
preserved When a job is completed the status is modified to finished
1
2 _id ObjectId(5544ecf134f7651d687bba94)
3 name ExpFinal
4 exp_dir data54f5a9b234f76511a82ec3b2ExpFinalreads
5 user 54f5a9b234f76511a82ec3b2
6 description Final test
7 genome_dir genomesEscherichia coli
8 status started
9 date ISODate(2015-05-02T152745249Z)
10
21
The Gemini framework
33 Data Management
In order to create a new job it is required two sets of data namely reference files and raw data
files The raw data is the actual data being analysed while the reference genome serves as basis to
the alignment or control
The typical workflow consists on the expert providing the experience and species names as
well as the raw data that was previously collected in the laboratory Afterwards through a step by
step system the user has the option to choose the reference genome to be used on the experiment
This last files are internally obtained from different FTP servers such as Ensembl and ENCODE
stored locally and reused in further usages
The provided information is then saved in the database and the files stored hierarchically We
use the following sequence of ltsection namegt ltuseridgt ltexperience namegt ltdata filesgt The
ltsection namegt can be conf for storing configuration files data for saving the reads or refer-
ence for keeping the reference genome and annotation files The ltuseridgt is the ID of Accounts
database document and the ltexperience namegt is the same as name in Jobs database document
A directory tree is represented in Figure 32
Figure 32 File system tree demonstrating the hierarchy of saved data files
This information is then passed to the server via a local FTP server that has been created
22
The Gemini framework
for this purpose We have followed an online tutorial 1 for the configuration From this we
created one administrator that has permissions for writing and reading files and we also authorized
anonymous login that may only retrieve files This way on the web application the admin user
creates the reads reference genomes annotation and configuration files On the computational
server an anonymous user authenticates for retrieving the files according to the filenames received
via API
The inside directory of FTP follows the hierarchy of ltuseridgt ltexperience namegt ltdata
filesgt where ltuseridgt is the ID on the Accounts document and ltexperience namegt is the name
on Jobs document When the server is prompted to run an experience it downloads the required
data from the FTP and runs iRAP with the necessary configuration options
34 Web Interface
For the implementation of Gemini python has been used for backend along with a simple fast and
lightweight WSGI micro web-framework called BottlePy 2 It has no dependencies and grants the
main functionalities such as routing templates some class utilities and a built-in server
The first screenshot (Figure 33) shows the home page of Gemini There is top menu bar with
two possible interactions login and register There is also a simple content box that describes the
main features and status of development of the platform Later on a new menu appears with the
possibility to logout on the Welcome tab (as in Figure 34)
Figure 33 Home page
Figure 34 Logout menu
1Tutorial available at httpswwwthomas-krenncomenwikiSetup_FTP_Server_under_Debian
2BottlePy httpbottlepyorgdocsdevindexhtml
23
The Gemini framework
The main feature of the system is the create job (Figure 35) option that is easily accessible on
top menu When the user clicks on it a form is displayed with the variables to introduce on the
configuration file that iRAP needs A description option has been added to provide the freedom to
the researcher to include some extra information that he finds useful
Figure 35 Create job form
The same type of form was used for the reference genomes section (Figure 36) The user is
prompted to choose orderly the species name release number and version Afterwards a table of
elements appears allowing the expert to download the files found
Figure 36 Reference genomes component
24
The Gemini framework
35 Use cases
Gemini was designed to have only one actor the user that will accomplish the experiments This
actor has the possibility to register login and logout of his account create a job and the hability
to download a reference genome of his choice Even though not fully implemented it has been
considered the jobs done functionality
Figure 37 Use cases diagram
36 Case studies
Some case studies with e coli in order to test iRAPrsquos installation and its capabilities For both
of the case studies it has been collected six samples of Escherichia coli reads from European
Nucleotide Archive 3 and the corresponding reference genome and annotation file from Ensembl
361 Full pipeline
In order to call the full pipeline iRAP has been tested with the directive irap conf=ecoli_exconf
Configuration file (ecoli_exconf ) content is as described in Appendix C In this task the system
received the reads and performed the quality control (QC) mapping quantification and differential
expression between the two groups of samples
3ENA httpwwwebiacukena
25
The Gemini framework
This test has been accomplished successfully
362 Stage pipeline
The stage pipeline is a powerful functionality since it allows the user to choose a specific stage of
the pipeline that he wants to execute for his samples
Besides the fact that it is not easy to collect data samples users often want to repeat or analyse
just one step of the pipeline and take some conclusions of it Furthermore this type of pipeline is
less time consuming
A concrete usage example is IPATIMUPrsquos data which contains the output information of the
mapper TopHat and will be further analysed in detail in Chapter 4 Concerning this setup it would
not be possible to call the full pipeline but instead it would require a command specific command
option
For validation purposes the same bacteria from the previous analysis has been used for the
stage pipeline case After calling the setup command to check input the directive irap conf=
ecoli_exconf quality_filtering_and_reporting has been used to perform the stage1
of iRAP The platform was able to perform with success this task
37 Chapter Summary
It has been used Python with BottlePy for the main implementation of the interface of Gemini
MongoDB has been chosen for dealing with information A FTP server was mounted for the
transitions of data between the client and the server The platform allows the expert to call a full or
stage pipeline analysis and provides the download of both fast and annotation files The essential
items are setup for the addition of further functionalities
26
Chapter 4
Case study
In this chapter it is going to be presented the Case Study with data from samples of thyroid carci-
noma along with their charactering and researching results
After the development of an interface to the iRAP tool the following step was to do a case
study with some realistic DNA samples of thyroid cancer patients regarding the partnership with
IPATIMUPrsquos researchers
The purpose of this case study was to do some research of potential differences between dis-
tinct types of the disease In order to accomplish this four samples were collected from Centro
Hospitalar de Satildeo Joatildeo (Porto) Cases 1 and 2 have been categorized as a widely invasive Fol-
licular Thyroid Carcinoma (wFTC) and cases 3 and 4 as a minimally invasive Follicular Thyroid
Carcinoma (mFTC)
41 Samples characterization
Patient from case 1 was female with 82 years old the tumour measuring 2 cm of size and presented
a predominant follicular growth pattern and oncocytic features Patient from case 2 was male with
55 years old the tumour measuring 5 cm of size and presented a predominant solidtrabecular
growth pattern For the group of mFTC patient from case 3 was female 56 years old the tumour
measuring 37 cm of size and with follicular growth pattern patient from case 4 was female 56
years old the tumour measuring 4 cm of size and with follicular growth pattern
42 Researching objectives
The aim of the study was to answer the following questions
bull Differentially expressed genes
bull Total isoforms found either in percentange and in absolute
27
Case study
bull Average of alternative isoforms for each gene spliced
bull Potentially novel isoforms and how do they behave between samplesgroups of samples
bull Compare results between versions of human genome assembly
bull Retrieve fusion genes
43 Protocol of analysis
Collected sample reads have been aligned against reference genome GRCh37 with TopHat version
141 Posterior analysis followed Tuxedo Protocol as described in Trapnell et al [TRG+12b] An
overview of the full protocol can be found in Figure 41
For the implementation of this procedure it were considered as two different groups the cases
1 and 2 (wFTC) against cases 3 and 4 (mFTC) The following step was to assemble transcripts for
each sample with Cufflinks 1 and afterwards create a single merged transcriptome annotation with
Cuffmerge 2 Cuffdiff 3 was then used to find significant changes in transcript expression
In order to find potential isoforms each sample was ran against the reference genome with
Cuffcompare 4
44 Genome version GRCh37 versus GRCh38
Even though IPATIMUPrsquos data have been assembled with reference genome version GRCh37
nowadays a more recent version (GRCh38) has been released in 2013 This new assembly is the
first major revision of the human genome in more than four years 5
The main differences between this two versions are
Alternate sequences several human chromosomal regions have sufficient variability to prevent
adequate representation by a single sequence This new version provides alternate sequence
for selected variant regions through the inclusion of alternate loci 6 scaffolds
Centromere 7 representation Previous method of representing centromeric regions have been
replaced by sequences from centromere models The models provide the approximate repeat
number and order for each centromere and are useful for read mapping and variation studies
Mitochondrial genome The new mitochondrial reference sequence is the Revised Cambridge
Reference Sequence with RefSeq accession number NC_0129201 The previous one was
RefSeq accession number NC_001907 which was not updated when GRCh37 assembly
later transitioned to the new version1Cufflinks httpcole-trapnell-labgithubiocufflinks2Cuffmerge httpcole-trapnell-labgithubiocufflinkscuffmergeindexhtml3Cuffdiff httpcole-trapnell-labgithubiocufflinkscuffdiffindexhtml4Cuffcompare httpcole-trapnell-labgithubiocufflinkscuffcompareindexhtml5As in UCSC mailing list at httpsgroupsgooglecomasoeucsceduforumtopic
genome-announce52Kv41YBXNY6Specific location of a gene on a chromosome
28
Case study
Figure 41 An overview of the Tuxedo Protocol with full steps TopHat for alignment Cufflinkspackage to find differential features between group samples and in the end CummeRbund to plotprevious results
Sequence updates Several erroneous bases and misassembled regions have been corrected and
more than 100 gaps have been filled or reduced
Analysis set The new assembly offers an analysis set that was created to accommodate next
generation sequencing read alignment pipelines Several GRCh38 regions have been elimi-
nated from this set to improve read mapping
29
Case study
45 Fusion genes
After we done some research on the technologies used for finding fusion genes in the reads we
have not been able to perform the analysis to answer the last question of our researching objectives
DeFuse required as input the original reads which were not provided This analysis would have
been interesting for relating the ocurrence of thyroid and the presence of fusion genes as well as if
there was any relevant difference between the samples of wFTC and mFTC
46 Results
461 Case study with reference genome GRCh37
The following table ( 41) demonstrates some genes that were differentially expressed with signif-
icance between mFTC and wFTC According to Celestino et al 8 CRABP1 C1QL1 and LCN2
are biomarkers of thyroid cancer and predictors of extrathyroidal extension It is commonly used
the value of 005 has threshold above which the differential expression is significant By inspect-
ing out the table we can find C1QL1 with a q-value of 0000555 and CRABP1 with a q-value
of 159E-11 which are in concordance with the previous article Furthermore it is verified the
increased gene expression in wFTC when compared to mFTC
Gene ID Gene Chr mFTC wFTC Fold change(log2) Q value
ENSG00000167748 KLK1 19 018672 111924 922742 0ENSG00000104725 NEFL 8 00196645 276961 104599 0ENSG00000174145 KIAA1239 4 00307388 144265 887444 0ENSG00000182379 NXPH4 12 008307 195786 788074 0ENSG00000131094 C1QL1 17 0121453 238957 429828 0000555ENSG00000142677 IL22RAI 1 150905 0384783 -529345 0ENSG00000138615 CILP 15 423569 0052726 -632793 241E-11ENSG00000141431 ASXL3 18 18938 001408 -707148 124E-09ENSG00000166426 CRABP1 15 748375 0367899 -766831 159E-11ENSG00000214145 LINC00887 3 19797 0119327 -737421 0000459
Table 41 Genes differentially expressed between minimally invasive follicular thryoid carcino-mas (mFTCs) and widely invasive follicular thyroid carcinomas (wFTCs)
In response to the previous researching objectives the Table 42 has the statistical results for
taks two and three From the data analysis we could conclude that less than 1 of genes have
isoforms but each one has an average of 389 alternatives
8Ricardo Celestino Torfin Nome Ana Pestana Andreas M Hoff Pedro A Gonccedilalves Catarina Eloy Eva SigstadRagnhild A Lothe Trine Bjoslashro Manuel Sobrinho-Simotildees Rofl I Skotheim Paula Soares CRAPBP1 C1QL1 andLCN2 are biomarkers of thyroid cancer and predictors of extrathyroidal extension subbmited for publication
30
Case study
Total genes 63896Total significant isoforms 689Total unique genes with isoforms 179Ratio of unique genes with isoformsgenes () 028Average of alternatives per gene with isoforms 389
Table 42 Statistical results for researching objectives number 2 and 3
462 Splicing analysis
Forward in the analysis Cuffcompare 9 has been used to search for novel isoforms when com-
pared to the reference genome The method was to compare each sample to the reference genome
and afterwards make an overlap of the results The main objective was then to infer about the
differences among wFTC and mFTC
Sample 1(wFTC)
Sample 2(wFTC)
Sample 3(mFTC)
Sample 4(mFTC)
Total genes 30440 36862 35539 37534Potential novel isoforms 7406 8450 8781 8830Table 43 Potential novel isoforms for each sample of IPATIMUPrsquos data
As demonstrated on Table 43 average there is a percentage of 24 of potentially novel iso-
forms found (at least one spliced junction is shared with a reference transcript) There is been
made an overlap of the results in order to encounter differences between wFTC and mFTC The
Table 44 presents the counting of differences between cases A brief analysis allows us to say
that we can not make any relationship between wFTC and mFTC On average there was a total of
3722 changes among this two sets The average within the sets are 3554 for wFTC and 3992 for
mFTC Given this results there was not a significant divergence to allow us to relate the splicing
and the occurrence of a more invasive Thyroid Carcinoma
Sets ChangesS1 S2 3554S1 S3 3609S1 S4 3612S2 S3 3847S2 S4 3820S3 S4 3929
Table 44 Number of differences between samples Syntax used S1 - Sample 1 S2 - Sample 2S3 - Sample 3 and S4 - Sample 4
9Cuffcompare httpcole-trapnell-labgithubiocufflinkscuffcompareindexhtml
31
Case study
463 Case study with reference genome GRCh38
In order to respond to the last research objective it has been applied the method of analysis has
before with a more recent human genome assembly After using the same protocol with Cufflinks
Cuffmerge and Cuffdiff sequentially we have come to some conclusions
The produced results of differential expression analysis for the same genes were very different
Genes that were highly significant before like C1QL1 and CRABP1 now had no relevance (q-
value gt 005) As mentioned before we had only access to TopHatrsquos output that used version
GRCh37 for the alignment and mapping process so we could not start from scratch the analysis
This outcome demonstrates two topics in particular
1 the introduction of novel annotations can make previous analysis outdated
2 there is the need to save the original reads in order to update earlier studies
The solution to this situation would have been to use the original reads to repeat the assembly
and then follow the Tuxedo protocol to collected correct and updated differential expression data
47 Chapter Summary
These section of development has been introduced in order to confer not only validation but also
to do some researching studies on the subject Four samples were collected and divided into two
distinct groups Tuxedo protocol was followed for responding to the research objectives The
case study for GRCh37 demonstrated the expression of C1QL1 and CRABP1 on wFTC when
compared to mFTC as indicated in the referred article On the other hand the same protocol when
applied with GRCh38 demonstrated the importance of saving the original reads and what is the
influence of newer releases in previous researching results Lastly the splicing analysis results did
not show any evidence of related isoforms count and the manifestation of the different stages of
the disease
32
Chapter 5
Conclusions and Future Work
The research of genomic-based cancers require highly complex data analysis Such analysis re-
quire most often the use of a large number of complex computational resources the gathering
of a lot of information over the Internet and the use of powerful computational resources Fur-
thermore the manipulation of the computational tools and resources require the assistance of an
informatics expert
The thesis work is a contribution towards the solution of the above mention problem We
propose and developed a framework that enables an expert biologist to perform genomic-based
complex analysis in a easy way and using the required powerful computational resources in a
transparent way
Using the developed framework we have used real data to address several research questions
provided by IPATIMUPrsquos researchers Firstly with the human genome GRCh37 we identified
two of the biomarkers of thyroid cancer by differential gene expression analysis Secondly we
found 689 significant isoforms 179 unique out of 63896 genes (ratio of 028) with an average
of 389 isoforms per gene Thirdly when trying to determine potential novel isoforms we came
at no conclusion of the differences of expression when comparing wFTC and mFTC The last
case was applying the Tuxedo protocol with the new GRCh38 on samples The outcome of the
experiment revealed the importance of saving the original reads and that newer releases become
previous analysis outdated
Future Work
This thesis work is just a starting point As stated before the framework was designed so it can be
extended with further modules to enable addressing other research questions
The case studies also showed us that RNA-seq analysis is very time consuming On the other
hand there are a lot of sub-tasks that can be run in parallel (like the task of aligning the reads)
33
Conclusions and Future Work
We will study and compare different techniques and opportunities to make RNA-seq in parallel as
much as possible
34
References
[bNE] Scitable by Nature Education Transcriptome available at httpwwwnaturecomscitabledefinitiontranscriptome-296 last accessJanuary 2015
[CAB+15] Fiona Cunningham M Ridwan Amode Daniel Barrell Kathryn Beal Konstanti-nos Billis Simon Brent Denise Carvalho-Silva Peter Clapham Guy CoatesStephen Fitzgerald Laurent Gil Carlos Garciacutea Giroacuten Leo Gordon ThibautHourlier Sarah E Hunt Sophie H Janacek Nathan Johnson Thomas Juette-mann Andreas K Kaumlhaumlri Stephen Keenan Fergal J Martin Thomas MaurelWilliam McLaren Daniel N Murphy Rishi Nag Bert Overduin Anne ParkerMateus Patricio Emily Perry Miguel Pignatelli Harpreet Singh Riat DanielSheppard Kieron Taylor Anja Thormann Alessandro Vullo Steven P WilderAmonida Zadissa Bronwen L Aken Ewan Birney Jennifer Harrow Rhoda Kin-sella Matthieu Muffato Magali Ruffier Stephen MJ Searle Giulietta SpudichStephen J Trevanion Andy Yates Daniel R Zerbino and Paul Flicek Ensembl2015 Nucleic Acids Research 43(D1)D662ndashD669 2015
[CFG+10] Peter J A Cock Christopher J Fields Naohisa Goto Michael L Heuer and Peter MRice The Sanger FASTQ file format for sequences with quality scores and theSolexaIllumina FASTQ variants Nucleic acids research 38(6)1767ndash71 April2010
[CH07] Geoffrey M Cooper and Robert E Hausman The Cell - A molecular approachAmerican Society for Microbiology 2007
[Cod70] E F Codd A relational model of data for large shared data banks Communica-tions of the ACM 13(6)377ndash387 June 1970
[Con11] The ENCODE Project Consortium A userrsquos guide to the encyclopedia of DNAelements (ENCODE) PLoS biology 9(4)e1001046 April 2011
[FMB14] N A Fonseca J A Marioni and A Brazma RNA-seq gene profiling - a system-atic empirical comparison Technical report May 2014
[FPMB14] Nuno A Fonseca Robert Petryszak John Marioni and Alvis Brazma irap - anintegrated rna-seq analysis pipeline bioRxiv 2014
[GCW+10] Qiang Gan Iouri Chepelev Gang Wei Lama Tarayrah Kairong Cui Keji Zhaoand Xin Chen Dynamic regulation of alternative splicing and chromatin structurein Drosophila gonads revealed by RNA-seq Cell research 20(7)763ndash83 July2010
35
REFERENCES
[GEN] GENIE Dna genes and chromossomes University of Leicesteravailable at httpwww2leacukdepartmentsgeneticsvgecschoolscollegestopicsdna-genes-chromosomes last access Jan-uary 2015
[Gri] Malachi Griffith Bioinformatics for Cancer Genomics (BiCG)available at httpbioinformaticscaworkshops2012bioinformatics-cancer-genomics-bicg last access January 2015
[GTBK11] Angela Goncalves Andrew Tikhonov Alvis Brazma and Misha Kapushesky Apipeline for RNA-seq data processing and quality assessment Bioinformatics (Ox-ford England) 27(6)867ndash9 March 2011
[HBB+02] T Hubbard D Barker E Birney G Cameron Y Chen L Clark T CoxJ Cuff V Curwen T Down R Durbin E Eyras J Gilbert M HammondL Huminiecki A Kasprzyk H Lehvaslaiho P Lijnzaad C Melsopp E Mon-gin R Pettett M Pocock S Potter A Rust E Schmidt S Searle G SlaterJ Smith W Spooner A Stabenau J Stalker E Stupka A Ureta-Vidal I Vastrikand M Clamp The ensembl genome database project Nucleic Acids Research30(1)38ndash41 2002
[HBD+13] R Hitzemann D Bottomly P Darakjian N Walter O Iancu R SearlesB Wilmot and S McWeeney Genes behavior and next-generation RNA se-quencing Genes Brain Behav 12(1)1ndash12 Feb 2013
[Ins] National Human Genome Research Institute Transcriptome available at httpwwwgenomegov13014330 last access January 2015
[Joh03] Jason M Johnson Genome-wide survey of human alternative pre-mrna splicingwith exon junction microarrays Science 3022141ndash2144 December 2003
[kn10] Gene set enrichment a problem of pathways Briefings in functional genomics9(5-6)385ndash90 December 2010
[kn11] Overview of available methods for diverse RNA-Seq data analyses Science ChinaLife sciences 54(12)1121ndash8 December 2011
[Lan10] Ben Langmead Aligning short sequencing reads with Bowtie Current proto-cols in bioinformatics editoral board Andreas D Baxevanis [et al] Chapter11Unit 117 December 2010
[LM10] Adam Lith and Jakob Mattsson Investigating storage solutions for large data - acomparison of well performing and scalable data storage solutions for real timeextraction and batch insertion of data Masterrsquos thesis 2010
[LTPS09] Ben Langmead Cole Trapnell Mihai Pop and Steven L Salzberg Ultrafastand memory-efficient alignment of short DNA sequences to the human genomeGenome biology 10(3)R25 January 2009
[ORY10] Alicia Oshlack Mark D Robinson and Matthew D Young From RNA-seq readsto differential expression results Genome biology 11(12)220 January 2010
[SG15] Marc W Schmid and Ueli Grossniklaus Rcount simple and flexible RNA-Seqread counting Bioinformatics 31(3)436ndash437 February 2015
36
REFERENCES
[SK11] Christof Strauch and Walter Kriha NoSQL databases Lecture Notes StuttgartMedia University February 2011
[SOdMVN12] Mikhail Shugay Intildeigo Ortiz de Mendiacutebil Joseacute L Vizmanos and Francisco JNovo Genomic hallmarks of genes involved in chromosomal translocations inhematological cancer PLoS Comput Biol 8(12)e1002797 12 2012
[The04] The ENCODE Project Consortium The ENCODE (ENCyclopedia Of DNA Ele-ments) Project Science (New York NY) 306(5696)636ndash40 October 2004
[TPS09] Cole Trapnell Lior Pachter and Steven L Salzberg TopHat discovering splicejunctions with RNA-Seq Bioinformatics (Oxford England) 25(9)1105ndash11 May2009
[TRG+12a] Cole Trapnell Adam Roberts Loyal Goff Geo Pertea Daehwan Kim David RKelley Harold Pimentel Steven L Salzberg John L Rinn and Lior Pachter Dif-ferential gene and transcript expression analysis of RNA-seq experiments withTopHat and Cufflinks Nature protocols 7(3)562ndash78 March 2012
[TRG+12b] Cole Trapnell Adam Roberts Loyal Goff Geo Pertea Daehwan Kim David RKelley Harold Pimentel Steven L Salzberg John L Rinn and Lior Pachter Dif-ferential gene and transcript expression analysis of RNA-seq experiments withTopHat and Cufflinks Nature protocols 7(3)562ndash78 March 2012
[WMM+11] Ying Wang Gaurang Mehta Rajiv Mayani Jingxi Lu Tade Souaiaia YanghoChen Andrew Clark Hee Jae Yoon Lin Wan Oleg V Evgrafov James AKnowles Ewa Deelman and Ting Chen RseqFlow workflows for RNA-Seq dataanalysis Bioinformatics (Oxford England) 27(18)2598ndash600 September 2011
[Wol13] Jochen B W Wolf Principles of transcriptome analysis and gene expressionquantification an rna-seq tutorial Molecular Ecology Resources 13(4)559ndash5722013
[ZW09] Mark Gerstein |amp Michael Snyder Zhong Wang Rna-seq a revolutionary tool fortranscriptomics Nature Reviews Genetics 1057ndash63 January 2009
37
REFERENCES
38
Appendix A
iRAP tools supported
A1 Mappers
Mapper Option name (mapper)TopHat 1 tophat1TopHat 2 tophat2SMALT smaltGSNAP gsnapSOAPsplice soapspliceBWA bwa1BWA bwa2Bowtie 1 bowtie1Bowtie2 bowtie2GEM gemSTAR starOSA osaMapSplice mapsplice
A2 Quantification
Quantifier Option name (quant_method)FluxCapacitor flux_capHT-Seq (union mode) htseq1HT-Seq (intersection non-empty mode) htseq2Cufflinks 1 (try to find novel transcripts-g) cufflinks1Cufflinks 2 (try to find novel transcripts-g) cufflinks2Cufflinks 1 (do not assemble novel transcripts-G) cufflinks1_ndCufflinks 2 (do not assemble novel transcripts-G) cufflinks2_ndNURD nurd
39
iRAP tools supported
A3 Differential expression [DE]
Method Option name (de_method)DESeq deseqDESeq2 deseq2EdgeR edgerCuffdiff 1 cuffdiff1Cuffdiff 2 cuffdiff2
A4 Gene set enrichment analysis [GSE]
Tool Option name (gse_tool)Piano piano
40
Appendix B
iRAP model of configuration file
1 This is a comment (lines that start with a are ignored by iRAP)
2 =============================================================================
3 name that you want to give to the experiment (no spaces)
4 All files produced by irap will be placed in a folder with the given name
5 name=myexp
6
7
8 =============================================================================
9 name of the species
10 species=homo_sapiens
11
12 =============================================================================
13 Fasta file with the reference genome
14 reference=Homo_sapiensGRCh3766dnafa
15
16 =============================================================================
17 GTF file with the annotations
18 gtf_file=Homo_sapiensGRCh3766gtf
19
20 =============================================================================
21 IRAP options (may be providedoverriden in the command line)
22
23
24 Mapper
25 mapper=
26
27
28 Quantification method
29 quant_method=
30
31
32 Dif expression method
33 Requires contrasts to be defined (see below)
41
iRAP model of configuration file
34 de_method=
35
36
37 Gene set enrichment (GSE) analysis
38 Requires de_method to be defined
39 Tool to use (none|piano)
40 gse_tool=piano
41
42 gse_method (mean|median|sum|fisher|fisher-exact|stouffer|tailStrength|wilcoxon|
reporter|page) see Piano vignete documentation for more details
43 gse_method=fisher
44 gse_pvalue=005
45 Minimum number of genes in a gene set
46 gse_minsize=3
47
48
49
50 TSV file with gene annotation
51 Format IDNamelocussourcelnameGOGOtermKEGG
52 Description
53 ID=gene_id (this is mandatory and should match the one given in the gtf file)
54 Name=gene name
55 locus=chrstart--end
56 source=biotype
57 lname=gene name
58 GO=go ids (multiple values can be separated by)
59 GO=GO terms (multiple values can be separated by)
60 KEGG=Kegg ids (multiple values can be separated by)
61 If auto is defined then iRAP will try to generate the file
62 - this may take a considerable amount of time and will only work
63 for a reduced number of species
64 off - default value
65 annot_tsv=
66
67
68 QC
69 Check data (reads) quality (on|off|none)
70 on - reads are filtered out based on their quality
71 off - the quality of the reads is assessed but no filtering is done
72 none- no quality control is performed
73 qual_filtering=on
74
75 Trim all reads to the minimum read size after quality trimming - Yes (y)| No (n)
76 only applicable if qual_filtering is on
77 trim_reads=y
78
79 Minimum base quality accepted (def 10)
80 min_read_quality=10
81
42
iRAP model of configuration file
82 Contamination check (cont_index parameter) Reads that likely
83 originate from organisms other than the one under study can be
84 discarded during pre-processment of the reads This is done by
85 aligning the reads to the genomes of organisms that might be a
86 source of contamination and discard those that map with a high
87 degree of fidelity By default iRAP will check if the data is
88 contaminated by e-coli An example to create a contamination
89 database is provided in the examplesex_add2contaminationDBsh
90 script The value of the parameter should be the file name prefix of
91 the bowtie index files
92
93 Disable contamination check
94 cont_index=no
95 Default value
96 cont_index=$(data_dir)contaminatione_coli
97
98
99 Misc options
100
101 Number of threads that may be used by IRAP
102 max_threads=1
103
104 Exon level quantification Yes (y)| No (n)
105 exon_quant=y
106
107 Transcript level quantification Yes (y)| No (n)
108 transcript_quant=y
109 =============================================================================
110 full or relative path to the directory where all the data can be found
111 data_dir=data
112
113 the directory should be organized as follows (see directory data in IRAP toplevel
directory)
114
115 $data_dir
116 $data_dir
117 contamination
118 e_coli1ebwt
119 e_coli2ebwt
120 e_coli3ebwt
121 e_coli4ebwt
122 e_coliREADME
123 e_colirev1ebwt
124 e_colirev2eb
125 raw_data
126 $species
127 fastq
128 fastq
129
43
iRAP model of configuration file
130 reference
131 $species
132 $gtf_file
133 $reference
134
135 Notes
136 1) $ denotes the value defined for the variable
137 2) Since version 050 the raw data (fastqbam) files may be
138 distributed across several sub-folders
139
140
141 =============================================================================
142 Only necessary if you intend to perform Differential Expression analysis
143
144 contrasts=contrast_def [contrast_def ]
145 contrasts=purpleVsPink purpleVsGrey
146
147 definition of each constrast
148 contrast= group group [ group ]
149 purlpleVsPink=Purple Pink
150 purlpleVsGrey=Purple Grey
151
152 groups
153 GroupName= Library_name [Library_name ]
154 Purlple=myLib1 myLib2
155 Pink=myLib3
156 Grey=myLib4
157
158 optional parameter used in the report (HTML) generation
159 groups=Purple Pink Grey
160
161 technical replicates
162 technicalreplicates=myLib1myLib2myLib3mylib4
163
164 Note names of groups contrasts and libraries should start with a letter and
contain only alphanumeric characters and the character _
165
166 =============================================================================
167 Data
168
169
170 Information for each library
171 LibName=Fastq file
172 Note
173 1 LibName should start with a letter and contain only alphanumeric characters
and the character _ LibName should not contain in _1 or _2
174 2 LibName should be different from the name of the fastq file for instance
175 f1=f1fastq
176 will produce an error
44
iRAP model of configuration file
177
178 Single-end
179 myLib1=f1fastq
180 read size
181 myLib1_rs=75
182 quality encoding (33 or 64)
183 myLib1_qual=33
184
185 strand specific protocol
186 mylib1_strand=first
187 mylib1_strand=second
188 Default value is both (strands)
189 mylib1_strand=both
190
191 Have the file in a different sub-folder
192 mylib1_dir=somesubfolder
193
194 See SAMBAM specification for more details about the following two parameters
195 read group id (to be included in the BAM file) - this is not supported by all
mappers
196 myLib1_rgid=
197 sambam header lines to include in the BAM file
198 myLib1_shl=COtThis is a commentnCOtand another line
199
200 LibName=Fastq file
201 myLib2=f2fastq
202 read size
203 myLib2_rs=75
204 quality encoding (33 or 64)
205 myLib2_qual=33
206
207
208 Paired-end
209 LibName=Fastq files
210 myLib3=f3_1fastq f3_2fastq
211 read size
212 myLib3_rs=50
213 quality encoding (33 or 64)
214 myLib3_qual=33
215 insert size
216 myLib3_ins=350
217 standard deviation
218 myLib3_sd=60
219
220 LibName=Fastq files
221 myLib4=f4_1fastq f4_2fastq
222 read size
223 myLib4_rs=50
224 quality encoding (33 or 64)
45
iRAP model of configuration file
225 myLib4_qual=33
226 insert size
227 myLib4_ins=350
228 standard deviation
229 myLib4_sd=60
230
231
232
233
234 list the names of your single-end (se) and paired (pe) libraries
235 se=myLib1 myLib2
236 pe=myLib3 myLib4
237 No SE data
238 se=
239 No PE data
240 pe=
241
242
243
244 Passingoverriding parameters
245
246 It is possible to pass parameters to the mappers and quantification
247 methods but that should be done carefully since it may break the
248 pipeline (if the location of the input andor output files is
249 changed)
250
251 Overridingchanging the mappersrsquo parameters
252 _map_options=options
253 Example
254 tophat2_map_options=--min-intron-length 5 --no-coverage-search
255
256 Overridingchanging the parameters of the quantification methods
257 _params=options
258 Example
259 htseq_params= -q
46
Appendix C
iRAP example configuration file
1 minimal configuration file for DE
2 experiment name
3 name=ecoli_ex
4 species
5 species=ecoli_k12
6 reference genome
7 reference=Escherichia_coli_str_k_12_substr_mg1655GCA_000005845119dnatoplevel
fagz
8 gtf file
9 gtf_file=Escherichia_coli_str_k_12_substr_mg1655GCA_000005845119gtfgz
10 Enable filtering based on quality
11 qual_filtering=on
12 Use a contamination data set to filter out reads
13 cont_index=no
14 Toplevel directory with the data
15 data_dir=
16
17 some contrasts
18 GA=Group A
19 contrasts=GAvsGB GBvsGA
20 GAvsGB=GA GB
21 GBvsGA=GB GA
22 GA=FA FB FC
23 GB=FD FE FF
24
25 se=FA FB FC FD FE FF
26
27 FA=SRR933983fastqgz
28 FA_rs=50
29 FA_qual=33
30
31 FB=SRR933984fastqgz
32 FB_rs=50
47
iRAP example configuration file
33 FB_qual=33
34
35 FC=SRR933985fastqgz
36 FC_rs=50
37 FC_qual=33
38
39 FD=SRR933989fastqgz
40 FD_rs=50
41 FD_qual=33
42
43 FE=SRR933990fastqgz
44 FE_rs=50
45 FE_qual=33
46
47 FF=SRR933990fastqgz
48 FF_rs=50
49 FF_qual=33
50 EOF
48
- Front Page
- Table of Contents
- List of Figures
- List of Tables
- 1 Introduction
-
- 11 Context
- 12 Motivation and Goals
- 13 Proposed Solution
- 14 Structure of the Dissertation
-
- 2 Basic Concepts and Bibliographic Review
-
- 21 Biological Basic Concepts
-
- 211 Genome
- 212 Transcriptome Assembly and Gene expression
-
- 22 RNA-Seq Analysis
-
- 221 RNA-Seq microarrays and DNA sequencing
- 222 RNA-Seq Pipeline
-
- 23 Standard File Formats used
-
- 231 FASTA
- 232 FASTQ
- 233 SAM and BAM
- 234 GFF and GTF
-
- 24 Relevant Data Repositories
- 25 Tools for RNA-seq and Differential Analysis
- 26 Relational and Non-relational Databases
- 27 Tecnologies
- 28 Related Work
- 29 Chapter Summary
-
- 3 The Gemini framework
-
- 31 Gemini
- 32 Gemini Architecture
-
- 321 Physical Architecture
-
- 33 Data Management
- 34 Web Interface
- 35 Use cases
- 36 Case studies
-
- 361 Full pipeline
- 362 Stage pipeline
-
- 37 Chapter Summary
-
- 4 Case study
-
- 41 Samples characterization
- 42 Researching objectives
- 43 Protocol of analysis
- 44 Genome version GRCh37 versus GRCh38
- 45 Fusion genes
- 46 Results
-
- 461 Case study with reference genome GRCh37
- 462 Splicing analysis
- 463 Case study with reference genome GRCh38
-
- 47 Chapter Summary
-
- 5 Conclusions and Future Work
- References
- A iRAP tools supported
-
- A1 Mappers
- A2 Quantification
- A3 Differential expression [DE]
- A4 Gene set enrichment analysis [GSE]
-
- B iRAP model of configuration file
- C iRAP example configuration file
-

Introduction
Chapter 4 introduces the case study where we have used real world data provided by IPA-
TIMUPrsquos researchers It starts with the samples characterization researching objectives and pro-
tocol of analysis Following the data results are described
The final conclusions of this Dissertation are then presented in Chapter 5 In this last chapter
we also point out further directions to extend the work done in the thesis The framework is
conceived in a way that extra modules may be developed and integrated in order to enable other
more specific analysis
3
Introduction
4
Chapter 2
Basic Concepts and BibliographicReview
In this chapter we present the biological basic concepts necessary to understand the thesis work and
we explain what it is gene expression and a more in-depth explanation of the alternative splicing
This will be followed by a state-of-the-art review of some different tools available to analyse RNA
and then a characterization of a pipeline till the gene expression results Some data repositories
are presented together with the data formats that might be used Finally we describe and analyse
some the important technologies used and describe the main differences between relational and
non-relational databases
21 Biological Basic Concepts
We start introducing some of biological basic concepts from the field of molecular biology
211 Genome
The flow of genetic information is known as the central dogma of molecular biology Accord-
ing to it RNA molecules are synthesized from DNA templates (transcription) and proteins are
synthesized from RNA templates (translation) [CH07]
RNA is a single-stranded molecule that is responsible for synthesizing the proteins of the cell
On the other hand DNA is a double-stranded molecule that carries the genetic information in all
cellular forms of life It can be copied or rsquoreplicatedrsquo as each strand can act as a template for the
generation of the complementary strand
Furthermore in DNA the information is stored in the linear sequence of the nucleotides along
each strand Each sequence of these nucleotides is called a gene that later on the translation process
may specify amino acids the elements of a protein
As such genes consist of three types of sequences
5
Basic Concepts and Bibliographic Review
Figure 21 Alternative splicing allows exons to be joined in different combinations resulting inthe formation of three distinct proteins from the single primary transcript
bull Coding regions called exons which specify a sequence of amino acids
bull Non-coding regions called introns which do not specify amino acids
bull Regulatory sequences which play a role in determining when and where the protein is made
In the process of splicing during the transcription the introns are removed and only exons are
included in the messenger RNA that will serve as basis of the production of some protein Even
though these introns do not carry useful information for further steps they allow the exons of a
gene to be joined in different combinations resulting in the synthesis of different proteins from the
same gene as seen in Figure 21 This mechanism is called alternative splicing and provides an
important tool for tissue-specific control of gene expression in complex cells [CH07]
During this process the nucleotides of DNA are transcribed to RNA ones through a par-based
code Each nucleotide of DNA has on its constitution one of the four bases Adenine (A) Guanine
(G) Thymine (T) or Cytosine (C) On the other hand a RNA strand is similar but the four possible
bases are Adenine (A) Guanine (G) Uracil (U) and Cytosine (C) The Table 21 relates each base
of DNA to RNA
DNA base RNA baseAdenine (A) Uracil (U)Thymine (T) Adenine (A)Guanine (G) Cytosine (C)Cytosine (C) Guanine (G)
Table 21 DNA nucleotides corresponding to RNA ones
6
Basic Concepts and Bibliographic Review
On RNA its four-letter rsquoalphabetrsquo forms rsquowordsrsquo of three letters called codons Individual
codons code for specific amino acids The genetic code is a table that relates the codons to the
corresponding amino acids (see Figure 22 1) One important information that we can retrieve
from this table is the start and the stop codons There is only one start codon the Methionine
(AUG combination) and it defines where the translation starts On the other hand there are three
possible combinations for the stop codon (TAA TAG and TGA) whose function is to determine
where the translation ends [GEN] Sometimes due to mutations the stop codon is not present
or misplaced in the strand due to an aberrant alternative splicing When this happens it may be
created an abnormal protein
Figure 22 Genetic code table
Another important concept is the Open Reading Frame (ORF) An ORF is a portion of DNA
that when translated into amino acids has no stop codons A long open reading frame is likely
part of a gene that will serve as basis to encode a protein
A fusion gene is a hybrid gene that is formed from two previously separated genes They can
result by either gene translocation interstitial deletion or chromosomal inversion (see Figure 23)
Nowadays 358 gene fusions involving 337 different genes have been identified and an increasing
number of gene fusions are being recognized as an important diagnostic and prognostic parameters
in malignant haematological disorders and childhood sarcomas An analysis of available data
shows that gene fusions occur in all malignancies and that they account for 20 of human cancer
morbidity [SOdMVN12]
212 Transcriptome Assembly and Gene expression
After the collected samples the next step is to prepare the library for further analysis It is common
for Biologists to use Illumina 2 for this task1Image source httpplatostanfordeduentriesinformation-biologicalGeneticCode
png2Illumina httpwwwilluminacom
7
Basic Concepts and Bibliographic Review
Figure 23 Fusion genes generation types
During the procedure it is performed a process called sequencing 3 that determines the order
of nucleotide bases within a stretch of DNA Next-generation sequencing (NGS) extends this tech-
nique across millions of reactions and involves rapid sequencing of large DNA stretches spanning
entire genomes
On particular for RNA Next-generation RNA sequencing enables researchers to identify and
quantify both rare and common transcripts align sequencing reads across splice junctions and de-
tect isoforms novel transcripts and gene fusions and perform robust whole-transcriptome analysis
on a wide range of samples including low-quality ones 4
A transcriptome is the a set of all RNA molecules transcribed from a RNA template [Wol13]
From the transcriptome and according to the used technique it is possible to count the number
of transcripts and then determine the amount of gene activity (gene expression) in a certain cell
or tissue type This is particularly useful when researchers are trying to discover the function of a
certain gene by analysing a transcriptome and the corresponding gene expression levels it can be
inferred what role does it play whether it is in cell growth or in fat storage for example [Ins] As
such transcriptome assembly is a computational reconstruction of RNA from smaller sequences
called reads and obtained experimentally
Differently from the genome the transcriptome actively changes according to context In
order to follow this changes there is a laboratory technique called microarray that measures the
expression of thousands of genes at the same time providing gene expression profiles [bNE]
The assembly can be done by either aligning the previous libraries obtained from Illumina to
a reference genome or reference transcripts or assembled de novo without the genomic sequence
to produce a genome-scale transcription map that consists of both the transcriptional structure and
or level of expression for each gene [ZW09]
3As in Illumina techniques description at httpwwwilluminacomapplicationssequencinghtml4As seen in httpwwwilluminacomapplicationssequencingrnahtml
8
Basic Concepts and Bibliographic Review
22 RNA-Seq Analysis
As stated in the previous section there are alternative techniques to obtain the gene expression In
this section we compare them and then provide detailed information on RNA-Seq
221 RNA-Seq microarrays and DNA sequencing
For the analysis of genome expression it is commonly used RNA sequencing Firstly it is cho-
sen this technique instead of DNA sequencing because some molecular features like alternative
isoforms can only be observed at the RNA level predicting transcript sequence from genome is
difficult and in functional studies even though genome may be constant an experimental condition
has a pronounced effect on gene expression Also it is a way to interpret mutations that do not
have an obvious effect in the protein sequence but affect what mRNA isoform is expressed and
how much [Gri]
Secondly even though microarrays have facilitated gene expression based analysis but provide
relatively little information about alternative splicing In late 90rsquos microarray experiments were
generally expensive limiting sample sizes which represented a disaster specially when associated
to thousands of independent observations per sample Some attempts have been made to surpass
this problem but none could perform well in brain tissue RNA-Seq then appeared as a method to
mapping and quantifying transcriptomes It has clear advantages over existing approaches since
it has a greater dynamic range detects both coding and noncoding RNAs is superior for gene
network construction detects spliced transcripts and allele specific expression and can be used
to extract genotype information Also by comparing both of them while microarray output is
fluorescence intensity the output from a RNA-Seq experiment is digital and comes in the form of
read counts [HBD+13]
Furthermore RNA-Seq provides a far more precise measurement of levels of transcripts and
their isoforms than other methods It can reveal precise location of transcription boundaries and
is particularly useful to apply on complex transcriptomes In addition RNA-Seq is shown to be
highly accurate for quantifying expression levels while requiring less RNA sample when compared
to another techniques [ZW09] and it also can resolve both gene expression level and alternative
splicing events simultaneously [GCW+10]
222 RNA-Seq Pipeline
RNA-Seq has become the tool of choice for genome-wide analysis of the transcriptome [ORY10
SG15] However a typical RNA-Seq experiment generates millions of raw sequence reads that re-
quire considerable computational resources and programming skills to process the data [GTBK11
ORY10 FPMB14 FMB14] An overview of a basic pipeline for such analysis can be found in
Figure 24
9
Basic Concepts and Bibliographic Review
Figure 24 The essential workflow for RNA-Seq analysis [kn11]
When no reference genome is available it is necessary to construct a de novo assembly This
step will not be considered here since it was not used on the thesis work Given this we are able to
hold this main concepts
Quality control a pre-processing step where quality of raw reads are assessed At this stage bad
ldquoqualityrdquo ones may be excluded from the data set preventing potential mapping mismatches
and providing a better performance in further states
Read alignment that aligns the (quality filtered) reads to a reference genome in order to recon-
struct the larger sequence
Quantification that summarises and aggregates reads over a biologically meaningful unit such as
exons isoforms or genes
Differential expression that identifies genes expressed being the basis for future assessing of
proteins function originating from such genes
Note that this is just a basis workflow for RNA-Seq analysis that provide the possibility to add
or remove some of the stages according to different purposes
iRAP - A pipeline for RNA-Seq
Usually a combination of different tools might be desirable but on the other side time con-
suming since they depend on each others inputoutput and they are frequently focused in single
purposes hence often incompatible with one another [WMM+11]
10
Basic Concepts and Bibliographic Review
iRAP 5 appears as an integrated solution that allows users to choose and apply their preferred
tools for mapping reads quantifying expression and testing for differential expression [FPMB14]
Figure 25 iRAP pipeline for RNA sequencing analysis
The Figure 25 shows the main steps for this methodology that by comparing with the previous
workflow (Figure 24) has two more stages Gene set enrichment and Web reports Gene set
enrichment is a means of analysing genomic data by studying the effects of groups of genes on a
phenotype rather then individual gene analysis [kn10] Web reports facilitate the inspection of the
results produced at different stages of the analysis by providing web pages with tables or plots of
information [FPMB14]
iRAP is also capable of performing analysis starting at any stage of the pipeline by choosing
the right command line options Currently it has the following five different stage options as
described below
setupstage0 check all directories and data files are present and at the expected place
stage1 quality filtering and reporting check fastq file quality and report
stage2 mapping to the transcriptome or to the genome
stage3 estimate gene expression
stage4 estimate differential expression
Furthermore the expert can choose the specific tool for each phase of the system some of
which are described in detail in further sections The current list of tools supported are available
in Appendix A
When using iRAP the user has the possibility to speed up the analysis by using the irap_lsf
command This method accepts the same parameters as iRAP but splits the analysis into multiple
jobs with the aim of reducing the time to analyze the data
5iRAP repository httpscodegooglecompirap
11
Basic Concepts and Bibliographic Review
23 Standard File Formats used
For the implementation of the previous pipeline some file formats are used to input or retrieve
data Below will be presented the most widely used ones along with some short description and
detail when needed
231 FASTA
FASTA 6 is the definition line and sequence character format used by NCBI 7 It is a text-based for-
mat for representing either nucleotide (DNA or RNA) or amino acid (protein) sequences FASTA
is commonly used since it is easy to manipulate and parse using text-processing tools and scripting
languages Usually in iRAP a FASTA format is used to store the a reference genome
232 FASTQ
FASTQ 8 provides a simple extension to the previous format the ability to store a numeric quality
score associated with each nucleotide in a sequence [CFG+10] It is generally used as the first
input with the raw data
233 SAM and BAM
SAM 9 is a generic format for storing large nucleotide sequence alignments It is easy to under-
stand easy to parse and easy to generate and check for errors Despite the presented qualities
SAM is slow to parse so a binary equivalent to it BAM has been developed to deal with this issue
BAM is used to intensive data processing and is useful in most product pipelines while SAM has
appropriate for interconversion with external applications and exploratory analysis Like FASTQ
BAMSAM formats are widely used as containers for raw sequence data
234 GFF and GTF
GFF 10 is a format for describing genes and other features associated with DNA RNA and Protein
sequences It was originally proposed as a protocol for the transfer of genomic feature information
allowing people to develop and test them without having to maintain a complete feature-finding
system The second version also allows for feature sets to be defined over RNA and Protein
sequences as well as genomic DNA
On the other hand GTF 11 stands for Gene transfer format and has been developed on top
of GFF specification The first eight GTF fields are the same as GFF The group field has been
6FASTA format httpgeneticsbwhharvardedupphFASTAhtml7NCBI httpwwwncbinlmnihgov8FASTQ format httpmaqsourceforgenetfastqshtml9SAM and BAM file formats httpsamtoolssourceforgenetSAMv1pdf
10GFF format httpwwwsangeracukresourcessoftwaregffspechtml11GTF format httpwwwensemblorginfowebsiteuploadgffhtml
12
Basic Concepts and Bibliographic Review
expanded into a list of attributes Each attribute consists of a typevalue pair Attributes must end
in a semi-colon and be separated from any following attribute by exactly one space
24 Relevant Data Repositories
It is important to validate results and test along with the implementation of RNA-Seq pipeline As
such real data are needed so that the quality and efficiency of this study is assessed Some repos-
itories are available online such as Gene Expression Omnibus (GEO 12) Genomic Data Sharing
(GDS 13) ENSEMBL 14 UCSC Genome Browser 15 or the ENCODE Project 16 The three last
ones are highlighted in next section
ENSEMBL
The Ensembl project provides information about many vertebrate and other eucaryotic species
being started in 1999 some years before the draft human genome was completed Until today
many genomes have been added over the years as well as the inclusion of comparative genomics
variation and regulatory data [HBB+02]
Between the included working teams of Ensembl the Genebuild is the one who is responsible
to create the gene sets both as developing and mantaining the BioMart 17 data mining tool
It also supplies a REST server 18 as well as an FTP tool for browse and download data [CAB+15]
UCSC Genome Browser
The UCSC Genome Browser is a website that consists of an open-source tool to browse
analyze and query genomic data Currently it grants access to some reference genomes giving the
possibility to retrieve specific data due to the search tool integrated
Along with this tool it is also available an FTP server where data can be accessed and down-
loaded
ENCODE Project
While ENSEMBL has information about many vertebrate and other species ENCODE is a
project to identify all functional elements in the human genome sequence as well as being able
to create comprehensive high quality catalogs of functional elements in the human genome using
highndashthroughput technologies Their mission is to enable the scientific and medical communities
12GEO httpwwwncbinlmnihgovgeo13GDS httpgdsnihgov02dr2html14ENSEMBL httpwwwensemblorgindexhtml15UCSC Genome Browser httpgenomeucscedu16ENCODE project httpswwwencodeprojectorg17BioMart httpbiomartorg18REST server of Ensembl httprestensemblorg
13
Basic Concepts and Bibliographic Review
to interpret the human genome sequence and apply it to understand human biology and improve
health [The04]
Besides their motivation an online repository is being build up indexing gathered data and
allowing users to query different data types regardless of location [Con11] Some samples can
be found at httpswwwencodeprojectorgexperimentsENCSR274JRR for ex-
ample
25 Tools for RNA-seq and Differential Analysis
To perform the RNA-Seq pipeline some tools for each process are required It is now presented
some set of them on the following sections
Bowtie
Bowtie 19 is a tool to align short reads to the human genome To achieve speed and memory-
efficiency Bowtie aligns reads with the aid of an index of the reference genome [Lan10] and can
take advantage of the use of simultaneous multiple processor cores [LTPS09] For the human
genome Burrows-Wheeler is a commonly used indexing process that this tool extends with a
novel quality-aware backtracking algorithm that permits mismatches
TopHat
TopHat 20 is used as a junction mapping tool for RNA-Seq reads Before TopHat current
mapping strategies could only localize reads to known exons in the genome This tool is a read-
mapping algorithm design to align reads to a reference genome without relying on know splice
sites [TPS09]
Cufflinks
Cufflinks 21 assembles transcripts estimates their abundances and tests for differential ex-
pression and regulation in RNA-Seq samples Internally it is made of four different parts Cuf-
flinks that assembles the package Cuffcompare that compares transcript assemblies to annotation
Cuffmerge that merges two or more transcript assemblies and Cuffdiff that takes the aligned reads
and reports genes and transcripts that are differentially expressed [TRG+12a]
HTSeq
19Bowtie httpbowtie-biosourceforgenetindexshtml20TopHat httpccbjhuedusoftwaretophatindexshtml21Cufflinks httpcole-trapnell-labgithubiocufflinks
14
Basic Concepts and Bibliographic Review
HTSeq 22 is a python framework to facilitate the rapid development of scripts to processing
and analysis of high-throughtput sequencing data
FASTQC
FASTQC 23 is a quality control tool for high-throughput sequencing data It receives as input
BAM SAM or FASTQ files provides a quick overview on which areas there may be problems
summarizes graphs and tables for a fast assess of data and exports results to an HTML based report
Samtools
Samtools 24 is a set of utilities to manipulate alignments in the BAM format (output format of
TopHat eg) It does sorting merging and indexing and allows to retrieve in any regions The
files can be either provided via standard input (stdin) of from a remote FTP or HTTP server
deFuse
deFuse 25 is a software for gene fusion discovery from RNA-Seq data It uses clusters of dis-
cordant paired alignments to inform a split read alignment analysis for finding fusion boundaries
As an output it produces a fully annotated output for each predicted fusion
26 Relational and Non-relational Databases
Relational Databases had been introduced in 1970 by Edgar Codd at IBM Almaden Research
Center [Cod70] It has been used for decades and has brought in the concept of relations With
this a relational database is usually represented by a structured model a table in which each row is
a tuple (also considered as an object) and the columns are the attributes of the tuple The database
can be queried in order to retrieve useful data based on their attributes whether in common between
tuples or not To do so it is used a structured query language SQL [LM10] The main set of
operations is known as CRUD Create Read Update and Delete Relational databases are also
know for their fixed schemas that force every tuple to have the exact same attributes
A very common operation in SQL databases are joins Joins are a way to associated data that
share attributes or are somehow related One example is imagining a table of people that have
bank accounts associated and there is another table where the existing banks are described A way
to relate them is to combine these two tables in order to directly view which individual is using
which bank This is a very simple example that can scale very quickly and become a dangerous
operation for the consumed resources to be used to compute the needed relationships
22HTSeq httpwww-huberembldeHTSeqdocoverviewhtml23FASTQC httpwwwbioinformaticsbabrahamacukprojectsfastqc24Samtools httpsamtoolssourceforgenet25deFuse httpsbitbucketorgdranewdefuse
15
Basic Concepts and Bibliographic Review
In contrast with the previous set a Non-relational database commonly doesnrsquot have a fixed
schema and avoid the previous complex operation Within this class of databases there are different
approaches to the used models such as key-value stores big table clones document databases and
graph databases Each of them is used accordingly to the data set complexity
MongoDB 26 is a non-relational database schemaless and is scalable in cluster performance
and data This way it provides a way to store large data sets with the freedom of using different
schemas according to data 27
27 Tecnologies
When developing a web service there are some basic resources and programming languages used
HTML 28 is a standard markup language for describing web documents CSS 29 is used for
defining how the HTML elements are to be displayed Bootstrap 30 is a free front-end frame-
work for faster and easier web development and contains HTML and CSS based design patterns
Javascript 31 serves as a method for programming the behavior of web pages jQuery 32 is a library
of Javascript that greatly specifies Javascriptrsquos usage
Even though commonly used PHP 33 is not the best suitable language for our thesis work
When compared to Python it lacks security and is not used on the Bioinformatics field On the
other hand Perl has been greatly used on this field but it is currently being replaced by Python 34
Furthermore this last one has libraries like BioPython 35 for internal processing of samples and
also has support to web through frameworks like Django 36 or BottlePy 37
Even though Django is trending it has no support for NoSQL relational databases yet Bot-
tlePy for instance is a lightweight web framework simple to use and provides the ability to use
MongoDB
Concerning the situation the combination of Python and BottlePy is the most suitable since it
has
bull Starting to replace Perl in bioinformatics processing
bull Support for NoSQL databases (either the framework and the programming language)
bull Lightweight usage
26MongoDB httpwwwmongodborg27MongoDB scalability httpwwwmongodbcommongodb-scale28HTML httpwwww3schoolscomhtml29CSS httpwwww3schoolscomcssdefaultasp30Bootstrap httpgetbootstrapcom31Javascript httpwwww3schoolscomjs32jQuery httpsjquerycom33PHP httpphpnet34Python httpswwwpythonorg35BioPython httpbiopythonorgwikiMain_Page36Django framework httpswwwdjangoprojectcom37BottlePy httpbottlepyorgdocsdevindexhtml
16
Basic Concepts and Bibliographic Review
Figure 26 Print screen of Galaxy when trying to get data from UCSC
For the purpose of sending the information between devices the FTP server solution was
analysed It allows the creation of an administrator user that has the permissions for writing and
reading but also for anonymous users that can only download data
28 Related Work
Galaxy
Galaxy 38 is an open source web-based platform for data intensive biomedical research
It consists of an embedded website system that provides access to different databases such
as Ensembl or UCSC Genome Browser Although functional the platform has not a consistent
interface which requires the user to learn to use many systems within it An example of this
situation can be viewed in Figure 26 Furthermore it does not provide the ability to choose easily
a stage pipeline like iRAP or to run a full one with personalized tools
BioMart Central Portal
BioMart 39 is a community-driven project to provide unified access to distributed research data
to facilitate the scientific discovery process
38Galaxy httpgalaxyprojectorg39BioMart Central Portal httpcentralbiomartorgsequencegui=Sequence_retrievalamp
mart=metaseq_mart_63_config
17
Basic Concepts and Bibliographic Review
It currently has a sequence retrieval tools that provides searching by database and dataset
Nowadays this tool offers Ensembl as the only available database but it adds up three other fea-
tures like a sequences filters and header information panels where the users can improve their
search
29 Chapter Summary
In this chapter we presented and discussed the technologies suitable for the thesis work We have
surveyed alternative technologies for gene expression computation and alternative splicing tools
The technologies are relevant to solve the Biological domain problem We have also surveyed
the tools for the development of websites and databases to store the data used when solving the
biological problems In the next chapter we describe work in detail
18
Chapter 3
The Gemini framework
Despite the very large number of tools available for Molecular Biology problems they are most
often difficult to use and require sophisticated computational resources As part of the thesis
work we have developed a framework that allows expert users to make RNA-Seq and alternative
splicing analysis using a user friendly web interface and sophisticated computational resources
In this chapter we describe that framework that include the website database resources for storing
data and the computational settings for the analysis
iRAP has been chosen to accomplish the automation of RNA sequencing analysis due to the
simplicity of use and its wide number of tools available for its task Since it is an integrated
tool platform its installation requires not only powerful computer resources but also a long list of
basic equipment necessary to each of them Considering these issues it had not always been easy
to setup the wanted work environment
Despite the difficulties of this scenario we have been able to complete the setup of this tool
and make some control experiments with it
In order to accomplish an iRAP execution a configuration file must be provided (see Ap-
pendix B) Along with the experiment name the name of species being analysed the reference
genome and read data files need to be specified and made available Furthermore the specific
tools for each stage of the pipeline need also to be specified among other possible variables
It is not easy and usually very time consuming for a Biologist to create the configuration file or
to run the command-line interface that controls iRAP pipeline Since this system is a combination
of many different tools there are a long list of available options that may be fulfilled Some of
them are mandatory while other ones are optional After this setting is completed it must be saved
in a text file and made available to run iRAP
Even though the usage of iRAP does not require extensive bioinformatics expertise it does
assume familiarity with UNIX command-line interface which would narrow down the target audi-
ence In order to overcome this situation we designed and developed a framework called Gemini
19
The Gemini framework
that includes a Graphical User Interface and makes RNA-Seq studies much more easy to perform
We have also included extra features for doing more analysis to RNA-Seq data
31 Gemini
Due to the lack of intuitiveness on the process of generating the configuration file it has been
created a more user friendly one through a web form This form asks for input of the main settings
to call a very simple experiment with a commonly used bacteria escherichia ecoli (e coli)
Another important feature is the possibility to fill the form asking what is the stage that the user
wants the pipeline to start with
Another issue was to find and easily download a reference genome for a certain species In
order to add completeness to Gemini and also to simplify the process of download it has been
implemented the functionality to download the reference genome (both fasta and annotation files)
It is used the Ensembl API to obtain the required results The jobs status feature lists the status of
jobs sent by the user for execution
Besides these features one more have been added even though not completed It is the job
results where it is presented the results collected for a determined task
32 Gemini Architecture
321 Physical Architecture
Gemini is divided into two different sets The first one is where the web application is hosted as
well as the database Since dealing with genomic data often requires great computer performance
processing experiments is accomplished in an independent server that later responds with results
Figure 31 Physical architecture of Gemini
Data scheme
MongoDB is NoSQL document based database The information is organized in collections
in which each element is stored as a JSON document NoSQL databases are simpler to use when it
20
The Gemini framework
comes to have different information fields in the same document and at the same time they have
better performance and scalability [SK11] Currently the information is arranjed in two collections
scheme as described on Table 31
Name DescriptionAccounts Stores the users dataJobs Stores the experiments dataTable 31 Collections used to store data
Accounts
An accountrsquos document stores an userrsquos email password and a unique identifier A role has
also been saved for future hierarchy creation in which some levels will grant more permissions
than others like changing accounts settings of other participants
1
2 _id ObjectId(54f5a9b234f76511a82ec3b2)
3 password e10adc3949ba59abbe56e057f20f883e
4 role user
5 email acgggomesgmailcom
6
Jobs
Jobs are related to an user and have the name and description of the experiment It also
stores the reference genomersquos location as well as the readsrsquo one Likewise the date of creation is
preserved When a job is completed the status is modified to finished
1
2 _id ObjectId(5544ecf134f7651d687bba94)
3 name ExpFinal
4 exp_dir data54f5a9b234f76511a82ec3b2ExpFinalreads
5 user 54f5a9b234f76511a82ec3b2
6 description Final test
7 genome_dir genomesEscherichia coli
8 status started
9 date ISODate(2015-05-02T152745249Z)
10
21
The Gemini framework
33 Data Management
In order to create a new job it is required two sets of data namely reference files and raw data
files The raw data is the actual data being analysed while the reference genome serves as basis to
the alignment or control
The typical workflow consists on the expert providing the experience and species names as
well as the raw data that was previously collected in the laboratory Afterwards through a step by
step system the user has the option to choose the reference genome to be used on the experiment
This last files are internally obtained from different FTP servers such as Ensembl and ENCODE
stored locally and reused in further usages
The provided information is then saved in the database and the files stored hierarchically We
use the following sequence of ltsection namegt ltuseridgt ltexperience namegt ltdata filesgt The
ltsection namegt can be conf for storing configuration files data for saving the reads or refer-
ence for keeping the reference genome and annotation files The ltuseridgt is the ID of Accounts
database document and the ltexperience namegt is the same as name in Jobs database document
A directory tree is represented in Figure 32
Figure 32 File system tree demonstrating the hierarchy of saved data files
This information is then passed to the server via a local FTP server that has been created
22
The Gemini framework
for this purpose We have followed an online tutorial 1 for the configuration From this we
created one administrator that has permissions for writing and reading files and we also authorized
anonymous login that may only retrieve files This way on the web application the admin user
creates the reads reference genomes annotation and configuration files On the computational
server an anonymous user authenticates for retrieving the files according to the filenames received
via API
The inside directory of FTP follows the hierarchy of ltuseridgt ltexperience namegt ltdata
filesgt where ltuseridgt is the ID on the Accounts document and ltexperience namegt is the name
on Jobs document When the server is prompted to run an experience it downloads the required
data from the FTP and runs iRAP with the necessary configuration options
34 Web Interface
For the implementation of Gemini python has been used for backend along with a simple fast and
lightweight WSGI micro web-framework called BottlePy 2 It has no dependencies and grants the
main functionalities such as routing templates some class utilities and a built-in server
The first screenshot (Figure 33) shows the home page of Gemini There is top menu bar with
two possible interactions login and register There is also a simple content box that describes the
main features and status of development of the platform Later on a new menu appears with the
possibility to logout on the Welcome tab (as in Figure 34)
Figure 33 Home page
Figure 34 Logout menu
1Tutorial available at httpswwwthomas-krenncomenwikiSetup_FTP_Server_under_Debian
2BottlePy httpbottlepyorgdocsdevindexhtml
23
The Gemini framework
The main feature of the system is the create job (Figure 35) option that is easily accessible on
top menu When the user clicks on it a form is displayed with the variables to introduce on the
configuration file that iRAP needs A description option has been added to provide the freedom to
the researcher to include some extra information that he finds useful
Figure 35 Create job form
The same type of form was used for the reference genomes section (Figure 36) The user is
prompted to choose orderly the species name release number and version Afterwards a table of
elements appears allowing the expert to download the files found
Figure 36 Reference genomes component
24
The Gemini framework
35 Use cases
Gemini was designed to have only one actor the user that will accomplish the experiments This
actor has the possibility to register login and logout of his account create a job and the hability
to download a reference genome of his choice Even though not fully implemented it has been
considered the jobs done functionality
Figure 37 Use cases diagram
36 Case studies
Some case studies with e coli in order to test iRAPrsquos installation and its capabilities For both
of the case studies it has been collected six samples of Escherichia coli reads from European
Nucleotide Archive 3 and the corresponding reference genome and annotation file from Ensembl
361 Full pipeline
In order to call the full pipeline iRAP has been tested with the directive irap conf=ecoli_exconf
Configuration file (ecoli_exconf ) content is as described in Appendix C In this task the system
received the reads and performed the quality control (QC) mapping quantification and differential
expression between the two groups of samples
3ENA httpwwwebiacukena
25
The Gemini framework
This test has been accomplished successfully
362 Stage pipeline
The stage pipeline is a powerful functionality since it allows the user to choose a specific stage of
the pipeline that he wants to execute for his samples
Besides the fact that it is not easy to collect data samples users often want to repeat or analyse
just one step of the pipeline and take some conclusions of it Furthermore this type of pipeline is
less time consuming
A concrete usage example is IPATIMUPrsquos data which contains the output information of the
mapper TopHat and will be further analysed in detail in Chapter 4 Concerning this setup it would
not be possible to call the full pipeline but instead it would require a command specific command
option
For validation purposes the same bacteria from the previous analysis has been used for the
stage pipeline case After calling the setup command to check input the directive irap conf=
ecoli_exconf quality_filtering_and_reporting has been used to perform the stage1
of iRAP The platform was able to perform with success this task
37 Chapter Summary
It has been used Python with BottlePy for the main implementation of the interface of Gemini
MongoDB has been chosen for dealing with information A FTP server was mounted for the
transitions of data between the client and the server The platform allows the expert to call a full or
stage pipeline analysis and provides the download of both fast and annotation files The essential
items are setup for the addition of further functionalities
26
Chapter 4
Case study
In this chapter it is going to be presented the Case Study with data from samples of thyroid carci-
noma along with their charactering and researching results
After the development of an interface to the iRAP tool the following step was to do a case
study with some realistic DNA samples of thyroid cancer patients regarding the partnership with
IPATIMUPrsquos researchers
The purpose of this case study was to do some research of potential differences between dis-
tinct types of the disease In order to accomplish this four samples were collected from Centro
Hospitalar de Satildeo Joatildeo (Porto) Cases 1 and 2 have been categorized as a widely invasive Fol-
licular Thyroid Carcinoma (wFTC) and cases 3 and 4 as a minimally invasive Follicular Thyroid
Carcinoma (mFTC)
41 Samples characterization
Patient from case 1 was female with 82 years old the tumour measuring 2 cm of size and presented
a predominant follicular growth pattern and oncocytic features Patient from case 2 was male with
55 years old the tumour measuring 5 cm of size and presented a predominant solidtrabecular
growth pattern For the group of mFTC patient from case 3 was female 56 years old the tumour
measuring 37 cm of size and with follicular growth pattern patient from case 4 was female 56
years old the tumour measuring 4 cm of size and with follicular growth pattern
42 Researching objectives
The aim of the study was to answer the following questions
bull Differentially expressed genes
bull Total isoforms found either in percentange and in absolute
27
Case study
bull Average of alternative isoforms for each gene spliced
bull Potentially novel isoforms and how do they behave between samplesgroups of samples
bull Compare results between versions of human genome assembly
bull Retrieve fusion genes
43 Protocol of analysis
Collected sample reads have been aligned against reference genome GRCh37 with TopHat version
141 Posterior analysis followed Tuxedo Protocol as described in Trapnell et al [TRG+12b] An
overview of the full protocol can be found in Figure 41
For the implementation of this procedure it were considered as two different groups the cases
1 and 2 (wFTC) against cases 3 and 4 (mFTC) The following step was to assemble transcripts for
each sample with Cufflinks 1 and afterwards create a single merged transcriptome annotation with
Cuffmerge 2 Cuffdiff 3 was then used to find significant changes in transcript expression
In order to find potential isoforms each sample was ran against the reference genome with
Cuffcompare 4
44 Genome version GRCh37 versus GRCh38
Even though IPATIMUPrsquos data have been assembled with reference genome version GRCh37
nowadays a more recent version (GRCh38) has been released in 2013 This new assembly is the
first major revision of the human genome in more than four years 5
The main differences between this two versions are
Alternate sequences several human chromosomal regions have sufficient variability to prevent
adequate representation by a single sequence This new version provides alternate sequence
for selected variant regions through the inclusion of alternate loci 6 scaffolds
Centromere 7 representation Previous method of representing centromeric regions have been
replaced by sequences from centromere models The models provide the approximate repeat
number and order for each centromere and are useful for read mapping and variation studies
Mitochondrial genome The new mitochondrial reference sequence is the Revised Cambridge
Reference Sequence with RefSeq accession number NC_0129201 The previous one was
RefSeq accession number NC_001907 which was not updated when GRCh37 assembly
later transitioned to the new version1Cufflinks httpcole-trapnell-labgithubiocufflinks2Cuffmerge httpcole-trapnell-labgithubiocufflinkscuffmergeindexhtml3Cuffdiff httpcole-trapnell-labgithubiocufflinkscuffdiffindexhtml4Cuffcompare httpcole-trapnell-labgithubiocufflinkscuffcompareindexhtml5As in UCSC mailing list at httpsgroupsgooglecomasoeucsceduforumtopic
genome-announce52Kv41YBXNY6Specific location of a gene on a chromosome
28
Case study
Figure 41 An overview of the Tuxedo Protocol with full steps TopHat for alignment Cufflinkspackage to find differential features between group samples and in the end CummeRbund to plotprevious results
Sequence updates Several erroneous bases and misassembled regions have been corrected and
more than 100 gaps have been filled or reduced
Analysis set The new assembly offers an analysis set that was created to accommodate next
generation sequencing read alignment pipelines Several GRCh38 regions have been elimi-
nated from this set to improve read mapping
29
Case study
45 Fusion genes
After we done some research on the technologies used for finding fusion genes in the reads we
have not been able to perform the analysis to answer the last question of our researching objectives
DeFuse required as input the original reads which were not provided This analysis would have
been interesting for relating the ocurrence of thyroid and the presence of fusion genes as well as if
there was any relevant difference between the samples of wFTC and mFTC
46 Results
461 Case study with reference genome GRCh37
The following table ( 41) demonstrates some genes that were differentially expressed with signif-
icance between mFTC and wFTC According to Celestino et al 8 CRABP1 C1QL1 and LCN2
are biomarkers of thyroid cancer and predictors of extrathyroidal extension It is commonly used
the value of 005 has threshold above which the differential expression is significant By inspect-
ing out the table we can find C1QL1 with a q-value of 0000555 and CRABP1 with a q-value
of 159E-11 which are in concordance with the previous article Furthermore it is verified the
increased gene expression in wFTC when compared to mFTC
Gene ID Gene Chr mFTC wFTC Fold change(log2) Q value
ENSG00000167748 KLK1 19 018672 111924 922742 0ENSG00000104725 NEFL 8 00196645 276961 104599 0ENSG00000174145 KIAA1239 4 00307388 144265 887444 0ENSG00000182379 NXPH4 12 008307 195786 788074 0ENSG00000131094 C1QL1 17 0121453 238957 429828 0000555ENSG00000142677 IL22RAI 1 150905 0384783 -529345 0ENSG00000138615 CILP 15 423569 0052726 -632793 241E-11ENSG00000141431 ASXL3 18 18938 001408 -707148 124E-09ENSG00000166426 CRABP1 15 748375 0367899 -766831 159E-11ENSG00000214145 LINC00887 3 19797 0119327 -737421 0000459
Table 41 Genes differentially expressed between minimally invasive follicular thryoid carcino-mas (mFTCs) and widely invasive follicular thyroid carcinomas (wFTCs)
In response to the previous researching objectives the Table 42 has the statistical results for
taks two and three From the data analysis we could conclude that less than 1 of genes have
isoforms but each one has an average of 389 alternatives
8Ricardo Celestino Torfin Nome Ana Pestana Andreas M Hoff Pedro A Gonccedilalves Catarina Eloy Eva SigstadRagnhild A Lothe Trine Bjoslashro Manuel Sobrinho-Simotildees Rofl I Skotheim Paula Soares CRAPBP1 C1QL1 andLCN2 are biomarkers of thyroid cancer and predictors of extrathyroidal extension subbmited for publication
30
Case study
Total genes 63896Total significant isoforms 689Total unique genes with isoforms 179Ratio of unique genes with isoformsgenes () 028Average of alternatives per gene with isoforms 389
Table 42 Statistical results for researching objectives number 2 and 3
462 Splicing analysis
Forward in the analysis Cuffcompare 9 has been used to search for novel isoforms when com-
pared to the reference genome The method was to compare each sample to the reference genome
and afterwards make an overlap of the results The main objective was then to infer about the
differences among wFTC and mFTC
Sample 1(wFTC)
Sample 2(wFTC)
Sample 3(mFTC)
Sample 4(mFTC)
Total genes 30440 36862 35539 37534Potential novel isoforms 7406 8450 8781 8830Table 43 Potential novel isoforms for each sample of IPATIMUPrsquos data
As demonstrated on Table 43 average there is a percentage of 24 of potentially novel iso-
forms found (at least one spliced junction is shared with a reference transcript) There is been
made an overlap of the results in order to encounter differences between wFTC and mFTC The
Table 44 presents the counting of differences between cases A brief analysis allows us to say
that we can not make any relationship between wFTC and mFTC On average there was a total of
3722 changes among this two sets The average within the sets are 3554 for wFTC and 3992 for
mFTC Given this results there was not a significant divergence to allow us to relate the splicing
and the occurrence of a more invasive Thyroid Carcinoma
Sets ChangesS1 S2 3554S1 S3 3609S1 S4 3612S2 S3 3847S2 S4 3820S3 S4 3929
Table 44 Number of differences between samples Syntax used S1 - Sample 1 S2 - Sample 2S3 - Sample 3 and S4 - Sample 4
9Cuffcompare httpcole-trapnell-labgithubiocufflinkscuffcompareindexhtml
31
Case study
463 Case study with reference genome GRCh38
In order to respond to the last research objective it has been applied the method of analysis has
before with a more recent human genome assembly After using the same protocol with Cufflinks
Cuffmerge and Cuffdiff sequentially we have come to some conclusions
The produced results of differential expression analysis for the same genes were very different
Genes that were highly significant before like C1QL1 and CRABP1 now had no relevance (q-
value gt 005) As mentioned before we had only access to TopHatrsquos output that used version
GRCh37 for the alignment and mapping process so we could not start from scratch the analysis
This outcome demonstrates two topics in particular
1 the introduction of novel annotations can make previous analysis outdated
2 there is the need to save the original reads in order to update earlier studies
The solution to this situation would have been to use the original reads to repeat the assembly
and then follow the Tuxedo protocol to collected correct and updated differential expression data
47 Chapter Summary
These section of development has been introduced in order to confer not only validation but also
to do some researching studies on the subject Four samples were collected and divided into two
distinct groups Tuxedo protocol was followed for responding to the research objectives The
case study for GRCh37 demonstrated the expression of C1QL1 and CRABP1 on wFTC when
compared to mFTC as indicated in the referred article On the other hand the same protocol when
applied with GRCh38 demonstrated the importance of saving the original reads and what is the
influence of newer releases in previous researching results Lastly the splicing analysis results did
not show any evidence of related isoforms count and the manifestation of the different stages of
the disease
32
Chapter 5
Conclusions and Future Work
The research of genomic-based cancers require highly complex data analysis Such analysis re-
quire most often the use of a large number of complex computational resources the gathering
of a lot of information over the Internet and the use of powerful computational resources Fur-
thermore the manipulation of the computational tools and resources require the assistance of an
informatics expert
The thesis work is a contribution towards the solution of the above mention problem We
propose and developed a framework that enables an expert biologist to perform genomic-based
complex analysis in a easy way and using the required powerful computational resources in a
transparent way
Using the developed framework we have used real data to address several research questions
provided by IPATIMUPrsquos researchers Firstly with the human genome GRCh37 we identified
two of the biomarkers of thyroid cancer by differential gene expression analysis Secondly we
found 689 significant isoforms 179 unique out of 63896 genes (ratio of 028) with an average
of 389 isoforms per gene Thirdly when trying to determine potential novel isoforms we came
at no conclusion of the differences of expression when comparing wFTC and mFTC The last
case was applying the Tuxedo protocol with the new GRCh38 on samples The outcome of the
experiment revealed the importance of saving the original reads and that newer releases become
previous analysis outdated
Future Work
This thesis work is just a starting point As stated before the framework was designed so it can be
extended with further modules to enable addressing other research questions
The case studies also showed us that RNA-seq analysis is very time consuming On the other
hand there are a lot of sub-tasks that can be run in parallel (like the task of aligning the reads)
33
Conclusions and Future Work
We will study and compare different techniques and opportunities to make RNA-seq in parallel as
much as possible
34
References
[bNE] Scitable by Nature Education Transcriptome available at httpwwwnaturecomscitabledefinitiontranscriptome-296 last accessJanuary 2015
[CAB+15] Fiona Cunningham M Ridwan Amode Daniel Barrell Kathryn Beal Konstanti-nos Billis Simon Brent Denise Carvalho-Silva Peter Clapham Guy CoatesStephen Fitzgerald Laurent Gil Carlos Garciacutea Giroacuten Leo Gordon ThibautHourlier Sarah E Hunt Sophie H Janacek Nathan Johnson Thomas Juette-mann Andreas K Kaumlhaumlri Stephen Keenan Fergal J Martin Thomas MaurelWilliam McLaren Daniel N Murphy Rishi Nag Bert Overduin Anne ParkerMateus Patricio Emily Perry Miguel Pignatelli Harpreet Singh Riat DanielSheppard Kieron Taylor Anja Thormann Alessandro Vullo Steven P WilderAmonida Zadissa Bronwen L Aken Ewan Birney Jennifer Harrow Rhoda Kin-sella Matthieu Muffato Magali Ruffier Stephen MJ Searle Giulietta SpudichStephen J Trevanion Andy Yates Daniel R Zerbino and Paul Flicek Ensembl2015 Nucleic Acids Research 43(D1)D662ndashD669 2015
[CFG+10] Peter J A Cock Christopher J Fields Naohisa Goto Michael L Heuer and Peter MRice The Sanger FASTQ file format for sequences with quality scores and theSolexaIllumina FASTQ variants Nucleic acids research 38(6)1767ndash71 April2010
[CH07] Geoffrey M Cooper and Robert E Hausman The Cell - A molecular approachAmerican Society for Microbiology 2007
[Cod70] E F Codd A relational model of data for large shared data banks Communica-tions of the ACM 13(6)377ndash387 June 1970
[Con11] The ENCODE Project Consortium A userrsquos guide to the encyclopedia of DNAelements (ENCODE) PLoS biology 9(4)e1001046 April 2011
[FMB14] N A Fonseca J A Marioni and A Brazma RNA-seq gene profiling - a system-atic empirical comparison Technical report May 2014
[FPMB14] Nuno A Fonseca Robert Petryszak John Marioni and Alvis Brazma irap - anintegrated rna-seq analysis pipeline bioRxiv 2014
[GCW+10] Qiang Gan Iouri Chepelev Gang Wei Lama Tarayrah Kairong Cui Keji Zhaoand Xin Chen Dynamic regulation of alternative splicing and chromatin structurein Drosophila gonads revealed by RNA-seq Cell research 20(7)763ndash83 July2010
35
REFERENCES
[GEN] GENIE Dna genes and chromossomes University of Leicesteravailable at httpwww2leacukdepartmentsgeneticsvgecschoolscollegestopicsdna-genes-chromosomes last access Jan-uary 2015
[Gri] Malachi Griffith Bioinformatics for Cancer Genomics (BiCG)available at httpbioinformaticscaworkshops2012bioinformatics-cancer-genomics-bicg last access January 2015
[GTBK11] Angela Goncalves Andrew Tikhonov Alvis Brazma and Misha Kapushesky Apipeline for RNA-seq data processing and quality assessment Bioinformatics (Ox-ford England) 27(6)867ndash9 March 2011
[HBB+02] T Hubbard D Barker E Birney G Cameron Y Chen L Clark T CoxJ Cuff V Curwen T Down R Durbin E Eyras J Gilbert M HammondL Huminiecki A Kasprzyk H Lehvaslaiho P Lijnzaad C Melsopp E Mon-gin R Pettett M Pocock S Potter A Rust E Schmidt S Searle G SlaterJ Smith W Spooner A Stabenau J Stalker E Stupka A Ureta-Vidal I Vastrikand M Clamp The ensembl genome database project Nucleic Acids Research30(1)38ndash41 2002
[HBD+13] R Hitzemann D Bottomly P Darakjian N Walter O Iancu R SearlesB Wilmot and S McWeeney Genes behavior and next-generation RNA se-quencing Genes Brain Behav 12(1)1ndash12 Feb 2013
[Ins] National Human Genome Research Institute Transcriptome available at httpwwwgenomegov13014330 last access January 2015
[Joh03] Jason M Johnson Genome-wide survey of human alternative pre-mrna splicingwith exon junction microarrays Science 3022141ndash2144 December 2003
[kn10] Gene set enrichment a problem of pathways Briefings in functional genomics9(5-6)385ndash90 December 2010
[kn11] Overview of available methods for diverse RNA-Seq data analyses Science ChinaLife sciences 54(12)1121ndash8 December 2011
[Lan10] Ben Langmead Aligning short sequencing reads with Bowtie Current proto-cols in bioinformatics editoral board Andreas D Baxevanis [et al] Chapter11Unit 117 December 2010
[LM10] Adam Lith and Jakob Mattsson Investigating storage solutions for large data - acomparison of well performing and scalable data storage solutions for real timeextraction and batch insertion of data Masterrsquos thesis 2010
[LTPS09] Ben Langmead Cole Trapnell Mihai Pop and Steven L Salzberg Ultrafastand memory-efficient alignment of short DNA sequences to the human genomeGenome biology 10(3)R25 January 2009
[ORY10] Alicia Oshlack Mark D Robinson and Matthew D Young From RNA-seq readsto differential expression results Genome biology 11(12)220 January 2010
[SG15] Marc W Schmid and Ueli Grossniklaus Rcount simple and flexible RNA-Seqread counting Bioinformatics 31(3)436ndash437 February 2015
36
REFERENCES
[SK11] Christof Strauch and Walter Kriha NoSQL databases Lecture Notes StuttgartMedia University February 2011
[SOdMVN12] Mikhail Shugay Intildeigo Ortiz de Mendiacutebil Joseacute L Vizmanos and Francisco JNovo Genomic hallmarks of genes involved in chromosomal translocations inhematological cancer PLoS Comput Biol 8(12)e1002797 12 2012
[The04] The ENCODE Project Consortium The ENCODE (ENCyclopedia Of DNA Ele-ments) Project Science (New York NY) 306(5696)636ndash40 October 2004
[TPS09] Cole Trapnell Lior Pachter and Steven L Salzberg TopHat discovering splicejunctions with RNA-Seq Bioinformatics (Oxford England) 25(9)1105ndash11 May2009
[TRG+12a] Cole Trapnell Adam Roberts Loyal Goff Geo Pertea Daehwan Kim David RKelley Harold Pimentel Steven L Salzberg John L Rinn and Lior Pachter Dif-ferential gene and transcript expression analysis of RNA-seq experiments withTopHat and Cufflinks Nature protocols 7(3)562ndash78 March 2012
[TRG+12b] Cole Trapnell Adam Roberts Loyal Goff Geo Pertea Daehwan Kim David RKelley Harold Pimentel Steven L Salzberg John L Rinn and Lior Pachter Dif-ferential gene and transcript expression analysis of RNA-seq experiments withTopHat and Cufflinks Nature protocols 7(3)562ndash78 March 2012
[WMM+11] Ying Wang Gaurang Mehta Rajiv Mayani Jingxi Lu Tade Souaiaia YanghoChen Andrew Clark Hee Jae Yoon Lin Wan Oleg V Evgrafov James AKnowles Ewa Deelman and Ting Chen RseqFlow workflows for RNA-Seq dataanalysis Bioinformatics (Oxford England) 27(18)2598ndash600 September 2011
[Wol13] Jochen B W Wolf Principles of transcriptome analysis and gene expressionquantification an rna-seq tutorial Molecular Ecology Resources 13(4)559ndash5722013
[ZW09] Mark Gerstein |amp Michael Snyder Zhong Wang Rna-seq a revolutionary tool fortranscriptomics Nature Reviews Genetics 1057ndash63 January 2009
37
REFERENCES
38
Appendix A
iRAP tools supported
A1 Mappers
Mapper Option name (mapper)TopHat 1 tophat1TopHat 2 tophat2SMALT smaltGSNAP gsnapSOAPsplice soapspliceBWA bwa1BWA bwa2Bowtie 1 bowtie1Bowtie2 bowtie2GEM gemSTAR starOSA osaMapSplice mapsplice
A2 Quantification
Quantifier Option name (quant_method)FluxCapacitor flux_capHT-Seq (union mode) htseq1HT-Seq (intersection non-empty mode) htseq2Cufflinks 1 (try to find novel transcripts-g) cufflinks1Cufflinks 2 (try to find novel transcripts-g) cufflinks2Cufflinks 1 (do not assemble novel transcripts-G) cufflinks1_ndCufflinks 2 (do not assemble novel transcripts-G) cufflinks2_ndNURD nurd
39
iRAP tools supported
A3 Differential expression [DE]
Method Option name (de_method)DESeq deseqDESeq2 deseq2EdgeR edgerCuffdiff 1 cuffdiff1Cuffdiff 2 cuffdiff2
A4 Gene set enrichment analysis [GSE]
Tool Option name (gse_tool)Piano piano
40
Appendix B
iRAP model of configuration file
1 This is a comment (lines that start with a are ignored by iRAP)
2 =============================================================================
3 name that you want to give to the experiment (no spaces)
4 All files produced by irap will be placed in a folder with the given name
5 name=myexp
6
7
8 =============================================================================
9 name of the species
10 species=homo_sapiens
11
12 =============================================================================
13 Fasta file with the reference genome
14 reference=Homo_sapiensGRCh3766dnafa
15
16 =============================================================================
17 GTF file with the annotations
18 gtf_file=Homo_sapiensGRCh3766gtf
19
20 =============================================================================
21 IRAP options (may be providedoverriden in the command line)
22
23
24 Mapper
25 mapper=
26
27
28 Quantification method
29 quant_method=
30
31
32 Dif expression method
33 Requires contrasts to be defined (see below)
41
iRAP model of configuration file
34 de_method=
35
36
37 Gene set enrichment (GSE) analysis
38 Requires de_method to be defined
39 Tool to use (none|piano)
40 gse_tool=piano
41
42 gse_method (mean|median|sum|fisher|fisher-exact|stouffer|tailStrength|wilcoxon|
reporter|page) see Piano vignete documentation for more details
43 gse_method=fisher
44 gse_pvalue=005
45 Minimum number of genes in a gene set
46 gse_minsize=3
47
48
49
50 TSV file with gene annotation
51 Format IDNamelocussourcelnameGOGOtermKEGG
52 Description
53 ID=gene_id (this is mandatory and should match the one given in the gtf file)
54 Name=gene name
55 locus=chrstart--end
56 source=biotype
57 lname=gene name
58 GO=go ids (multiple values can be separated by)
59 GO=GO terms (multiple values can be separated by)
60 KEGG=Kegg ids (multiple values can be separated by)
61 If auto is defined then iRAP will try to generate the file
62 - this may take a considerable amount of time and will only work
63 for a reduced number of species
64 off - default value
65 annot_tsv=
66
67
68 QC
69 Check data (reads) quality (on|off|none)
70 on - reads are filtered out based on their quality
71 off - the quality of the reads is assessed but no filtering is done
72 none- no quality control is performed
73 qual_filtering=on
74
75 Trim all reads to the minimum read size after quality trimming - Yes (y)| No (n)
76 only applicable if qual_filtering is on
77 trim_reads=y
78
79 Minimum base quality accepted (def 10)
80 min_read_quality=10
81
42
iRAP model of configuration file
82 Contamination check (cont_index parameter) Reads that likely
83 originate from organisms other than the one under study can be
84 discarded during pre-processment of the reads This is done by
85 aligning the reads to the genomes of organisms that might be a
86 source of contamination and discard those that map with a high
87 degree of fidelity By default iRAP will check if the data is
88 contaminated by e-coli An example to create a contamination
89 database is provided in the examplesex_add2contaminationDBsh
90 script The value of the parameter should be the file name prefix of
91 the bowtie index files
92
93 Disable contamination check
94 cont_index=no
95 Default value
96 cont_index=$(data_dir)contaminatione_coli
97
98
99 Misc options
100
101 Number of threads that may be used by IRAP
102 max_threads=1
103
104 Exon level quantification Yes (y)| No (n)
105 exon_quant=y
106
107 Transcript level quantification Yes (y)| No (n)
108 transcript_quant=y
109 =============================================================================
110 full or relative path to the directory where all the data can be found
111 data_dir=data
112
113 the directory should be organized as follows (see directory data in IRAP toplevel
directory)
114
115 $data_dir
116 $data_dir
117 contamination
118 e_coli1ebwt
119 e_coli2ebwt
120 e_coli3ebwt
121 e_coli4ebwt
122 e_coliREADME
123 e_colirev1ebwt
124 e_colirev2eb
125 raw_data
126 $species
127 fastq
128 fastq
129
43
iRAP model of configuration file
130 reference
131 $species
132 $gtf_file
133 $reference
134
135 Notes
136 1) $ denotes the value defined for the variable
137 2) Since version 050 the raw data (fastqbam) files may be
138 distributed across several sub-folders
139
140
141 =============================================================================
142 Only necessary if you intend to perform Differential Expression analysis
143
144 contrasts=contrast_def [contrast_def ]
145 contrasts=purpleVsPink purpleVsGrey
146
147 definition of each constrast
148 contrast= group group [ group ]
149 purlpleVsPink=Purple Pink
150 purlpleVsGrey=Purple Grey
151
152 groups
153 GroupName= Library_name [Library_name ]
154 Purlple=myLib1 myLib2
155 Pink=myLib3
156 Grey=myLib4
157
158 optional parameter used in the report (HTML) generation
159 groups=Purple Pink Grey
160
161 technical replicates
162 technicalreplicates=myLib1myLib2myLib3mylib4
163
164 Note names of groups contrasts and libraries should start with a letter and
contain only alphanumeric characters and the character _
165
166 =============================================================================
167 Data
168
169
170 Information for each library
171 LibName=Fastq file
172 Note
173 1 LibName should start with a letter and contain only alphanumeric characters
and the character _ LibName should not contain in _1 or _2
174 2 LibName should be different from the name of the fastq file for instance
175 f1=f1fastq
176 will produce an error
44
iRAP model of configuration file
177
178 Single-end
179 myLib1=f1fastq
180 read size
181 myLib1_rs=75
182 quality encoding (33 or 64)
183 myLib1_qual=33
184
185 strand specific protocol
186 mylib1_strand=first
187 mylib1_strand=second
188 Default value is both (strands)
189 mylib1_strand=both
190
191 Have the file in a different sub-folder
192 mylib1_dir=somesubfolder
193
194 See SAMBAM specification for more details about the following two parameters
195 read group id (to be included in the BAM file) - this is not supported by all
mappers
196 myLib1_rgid=
197 sambam header lines to include in the BAM file
198 myLib1_shl=COtThis is a commentnCOtand another line
199
200 LibName=Fastq file
201 myLib2=f2fastq
202 read size
203 myLib2_rs=75
204 quality encoding (33 or 64)
205 myLib2_qual=33
206
207
208 Paired-end
209 LibName=Fastq files
210 myLib3=f3_1fastq f3_2fastq
211 read size
212 myLib3_rs=50
213 quality encoding (33 or 64)
214 myLib3_qual=33
215 insert size
216 myLib3_ins=350
217 standard deviation
218 myLib3_sd=60
219
220 LibName=Fastq files
221 myLib4=f4_1fastq f4_2fastq
222 read size
223 myLib4_rs=50
224 quality encoding (33 or 64)
45
iRAP model of configuration file
225 myLib4_qual=33
226 insert size
227 myLib4_ins=350
228 standard deviation
229 myLib4_sd=60
230
231
232
233
234 list the names of your single-end (se) and paired (pe) libraries
235 se=myLib1 myLib2
236 pe=myLib3 myLib4
237 No SE data
238 se=
239 No PE data
240 pe=
241
242
243
244 Passingoverriding parameters
245
246 It is possible to pass parameters to the mappers and quantification
247 methods but that should be done carefully since it may break the
248 pipeline (if the location of the input andor output files is
249 changed)
250
251 Overridingchanging the mappersrsquo parameters
252 _map_options=options
253 Example
254 tophat2_map_options=--min-intron-length 5 --no-coverage-search
255
256 Overridingchanging the parameters of the quantification methods
257 _params=options
258 Example
259 htseq_params= -q
46
Appendix C
iRAP example configuration file
1 minimal configuration file for DE
2 experiment name
3 name=ecoli_ex
4 species
5 species=ecoli_k12
6 reference genome
7 reference=Escherichia_coli_str_k_12_substr_mg1655GCA_000005845119dnatoplevel
fagz
8 gtf file
9 gtf_file=Escherichia_coli_str_k_12_substr_mg1655GCA_000005845119gtfgz
10 Enable filtering based on quality
11 qual_filtering=on
12 Use a contamination data set to filter out reads
13 cont_index=no
14 Toplevel directory with the data
15 data_dir=
16
17 some contrasts
18 GA=Group A
19 contrasts=GAvsGB GBvsGA
20 GAvsGB=GA GB
21 GBvsGA=GB GA
22 GA=FA FB FC
23 GB=FD FE FF
24
25 se=FA FB FC FD FE FF
26
27 FA=SRR933983fastqgz
28 FA_rs=50
29 FA_qual=33
30
31 FB=SRR933984fastqgz
32 FB_rs=50
47
iRAP example configuration file
33 FB_qual=33
34
35 FC=SRR933985fastqgz
36 FC_rs=50
37 FC_qual=33
38
39 FD=SRR933989fastqgz
40 FD_rs=50
41 FD_qual=33
42
43 FE=SRR933990fastqgz
44 FE_rs=50
45 FE_qual=33
46
47 FF=SRR933990fastqgz
48 FF_rs=50
49 FF_qual=33
50 EOF
48
- Front Page
- Table of Contents
- List of Figures
- List of Tables
- 1 Introduction
-
- 11 Context
- 12 Motivation and Goals
- 13 Proposed Solution
- 14 Structure of the Dissertation
-
- 2 Basic Concepts and Bibliographic Review
-
- 21 Biological Basic Concepts
-
- 211 Genome
- 212 Transcriptome Assembly and Gene expression
-
- 22 RNA-Seq Analysis
-
- 221 RNA-Seq microarrays and DNA sequencing
- 222 RNA-Seq Pipeline
-
- 23 Standard File Formats used
-
- 231 FASTA
- 232 FASTQ
- 233 SAM and BAM
- 234 GFF and GTF
-
- 24 Relevant Data Repositories
- 25 Tools for RNA-seq and Differential Analysis
- 26 Relational and Non-relational Databases
- 27 Tecnologies
- 28 Related Work
- 29 Chapter Summary
-
- 3 The Gemini framework
-
- 31 Gemini
- 32 Gemini Architecture
-
- 321 Physical Architecture
-
- 33 Data Management
- 34 Web Interface
- 35 Use cases
- 36 Case studies
-
- 361 Full pipeline
- 362 Stage pipeline
-
- 37 Chapter Summary
-
- 4 Case study
-
- 41 Samples characterization
- 42 Researching objectives
- 43 Protocol of analysis
- 44 Genome version GRCh37 versus GRCh38
- 45 Fusion genes
- 46 Results
-
- 461 Case study with reference genome GRCh37
- 462 Splicing analysis
- 463 Case study with reference genome GRCh38
-
- 47 Chapter Summary
-
- 5 Conclusions and Future Work
- References
- A iRAP tools supported
-
- A1 Mappers
- A2 Quantification
- A3 Differential expression [DE]
- A4 Gene set enrichment analysis [GSE]
-
- B iRAP model of configuration file
- C iRAP example configuration file
-

Basic Concepts and Bibliographic Review
On RNA its four-letter rsquoalphabetrsquo forms rsquowordsrsquo of three letters called codons Individual
codons code for specific amino acids The genetic code is a table that relates the codons to the
corresponding amino acids (see Figure 22 1) One important information that we can retrieve
from this table is the start and the stop codons There is only one start codon the Methionine
(AUG combination) and it defines where the translation starts On the other hand there are three
possible combinations for the stop codon (TAA TAG and TGA) whose function is to determine
where the translation ends [GEN] Sometimes due to mutations the stop codon is not present
or misplaced in the strand due to an aberrant alternative splicing When this happens it may be
created an abnormal protein
Figure 22 Genetic code table
Another important concept is the Open Reading Frame (ORF) An ORF is a portion of DNA
that when translated into amino acids has no stop codons A long open reading frame is likely
part of a gene that will serve as basis to encode a protein
A fusion gene is a hybrid gene that is formed from two previously separated genes They can
result by either gene translocation interstitial deletion or chromosomal inversion (see Figure 23)
Nowadays 358 gene fusions involving 337 different genes have been identified and an increasing
number of gene fusions are being recognized as an important diagnostic and prognostic parameters
in malignant haematological disorders and childhood sarcomas An analysis of available data
shows that gene fusions occur in all malignancies and that they account for 20 of human cancer
morbidity [SOdMVN12]
212 Transcriptome Assembly and Gene expression
After the collected samples the next step is to prepare the library for further analysis It is common
for Biologists to use Illumina 2 for this task1Image source httpplatostanfordeduentriesinformation-biologicalGeneticCode
png2Illumina httpwwwilluminacom
7
Basic Concepts and Bibliographic Review
Figure 23 Fusion genes generation types
During the procedure it is performed a process called sequencing 3 that determines the order
of nucleotide bases within a stretch of DNA Next-generation sequencing (NGS) extends this tech-
nique across millions of reactions and involves rapid sequencing of large DNA stretches spanning
entire genomes
On particular for RNA Next-generation RNA sequencing enables researchers to identify and
quantify both rare and common transcripts align sequencing reads across splice junctions and de-
tect isoforms novel transcripts and gene fusions and perform robust whole-transcriptome analysis
on a wide range of samples including low-quality ones 4
A transcriptome is the a set of all RNA molecules transcribed from a RNA template [Wol13]
From the transcriptome and according to the used technique it is possible to count the number
of transcripts and then determine the amount of gene activity (gene expression) in a certain cell
or tissue type This is particularly useful when researchers are trying to discover the function of a
certain gene by analysing a transcriptome and the corresponding gene expression levels it can be
inferred what role does it play whether it is in cell growth or in fat storage for example [Ins] As
such transcriptome assembly is a computational reconstruction of RNA from smaller sequences
called reads and obtained experimentally
Differently from the genome the transcriptome actively changes according to context In
order to follow this changes there is a laboratory technique called microarray that measures the
expression of thousands of genes at the same time providing gene expression profiles [bNE]
The assembly can be done by either aligning the previous libraries obtained from Illumina to
a reference genome or reference transcripts or assembled de novo without the genomic sequence
to produce a genome-scale transcription map that consists of both the transcriptional structure and
or level of expression for each gene [ZW09]
3As in Illumina techniques description at httpwwwilluminacomapplicationssequencinghtml4As seen in httpwwwilluminacomapplicationssequencingrnahtml
8
Basic Concepts and Bibliographic Review
22 RNA-Seq Analysis
As stated in the previous section there are alternative techniques to obtain the gene expression In
this section we compare them and then provide detailed information on RNA-Seq
221 RNA-Seq microarrays and DNA sequencing
For the analysis of genome expression it is commonly used RNA sequencing Firstly it is cho-
sen this technique instead of DNA sequencing because some molecular features like alternative
isoforms can only be observed at the RNA level predicting transcript sequence from genome is
difficult and in functional studies even though genome may be constant an experimental condition
has a pronounced effect on gene expression Also it is a way to interpret mutations that do not
have an obvious effect in the protein sequence but affect what mRNA isoform is expressed and
how much [Gri]
Secondly even though microarrays have facilitated gene expression based analysis but provide
relatively little information about alternative splicing In late 90rsquos microarray experiments were
generally expensive limiting sample sizes which represented a disaster specially when associated
to thousands of independent observations per sample Some attempts have been made to surpass
this problem but none could perform well in brain tissue RNA-Seq then appeared as a method to
mapping and quantifying transcriptomes It has clear advantages over existing approaches since
it has a greater dynamic range detects both coding and noncoding RNAs is superior for gene
network construction detects spliced transcripts and allele specific expression and can be used
to extract genotype information Also by comparing both of them while microarray output is
fluorescence intensity the output from a RNA-Seq experiment is digital and comes in the form of
read counts [HBD+13]
Furthermore RNA-Seq provides a far more precise measurement of levels of transcripts and
their isoforms than other methods It can reveal precise location of transcription boundaries and
is particularly useful to apply on complex transcriptomes In addition RNA-Seq is shown to be
highly accurate for quantifying expression levels while requiring less RNA sample when compared
to another techniques [ZW09] and it also can resolve both gene expression level and alternative
splicing events simultaneously [GCW+10]
222 RNA-Seq Pipeline
RNA-Seq has become the tool of choice for genome-wide analysis of the transcriptome [ORY10
SG15] However a typical RNA-Seq experiment generates millions of raw sequence reads that re-
quire considerable computational resources and programming skills to process the data [GTBK11
ORY10 FPMB14 FMB14] An overview of a basic pipeline for such analysis can be found in
Figure 24
9
Basic Concepts and Bibliographic Review
Figure 24 The essential workflow for RNA-Seq analysis [kn11]
When no reference genome is available it is necessary to construct a de novo assembly This
step will not be considered here since it was not used on the thesis work Given this we are able to
hold this main concepts
Quality control a pre-processing step where quality of raw reads are assessed At this stage bad
ldquoqualityrdquo ones may be excluded from the data set preventing potential mapping mismatches
and providing a better performance in further states
Read alignment that aligns the (quality filtered) reads to a reference genome in order to recon-
struct the larger sequence
Quantification that summarises and aggregates reads over a biologically meaningful unit such as
exons isoforms or genes
Differential expression that identifies genes expressed being the basis for future assessing of
proteins function originating from such genes
Note that this is just a basis workflow for RNA-Seq analysis that provide the possibility to add
or remove some of the stages according to different purposes
iRAP - A pipeline for RNA-Seq
Usually a combination of different tools might be desirable but on the other side time con-
suming since they depend on each others inputoutput and they are frequently focused in single
purposes hence often incompatible with one another [WMM+11]
10
Basic Concepts and Bibliographic Review
iRAP 5 appears as an integrated solution that allows users to choose and apply their preferred
tools for mapping reads quantifying expression and testing for differential expression [FPMB14]
Figure 25 iRAP pipeline for RNA sequencing analysis
The Figure 25 shows the main steps for this methodology that by comparing with the previous
workflow (Figure 24) has two more stages Gene set enrichment and Web reports Gene set
enrichment is a means of analysing genomic data by studying the effects of groups of genes on a
phenotype rather then individual gene analysis [kn10] Web reports facilitate the inspection of the
results produced at different stages of the analysis by providing web pages with tables or plots of
information [FPMB14]
iRAP is also capable of performing analysis starting at any stage of the pipeline by choosing
the right command line options Currently it has the following five different stage options as
described below
setupstage0 check all directories and data files are present and at the expected place
stage1 quality filtering and reporting check fastq file quality and report
stage2 mapping to the transcriptome or to the genome
stage3 estimate gene expression
stage4 estimate differential expression
Furthermore the expert can choose the specific tool for each phase of the system some of
which are described in detail in further sections The current list of tools supported are available
in Appendix A
When using iRAP the user has the possibility to speed up the analysis by using the irap_lsf
command This method accepts the same parameters as iRAP but splits the analysis into multiple
jobs with the aim of reducing the time to analyze the data
5iRAP repository httpscodegooglecompirap
11
Basic Concepts and Bibliographic Review
23 Standard File Formats used
For the implementation of the previous pipeline some file formats are used to input or retrieve
data Below will be presented the most widely used ones along with some short description and
detail when needed
231 FASTA
FASTA 6 is the definition line and sequence character format used by NCBI 7 It is a text-based for-
mat for representing either nucleotide (DNA or RNA) or amino acid (protein) sequences FASTA
is commonly used since it is easy to manipulate and parse using text-processing tools and scripting
languages Usually in iRAP a FASTA format is used to store the a reference genome
232 FASTQ
FASTQ 8 provides a simple extension to the previous format the ability to store a numeric quality
score associated with each nucleotide in a sequence [CFG+10] It is generally used as the first
input with the raw data
233 SAM and BAM
SAM 9 is a generic format for storing large nucleotide sequence alignments It is easy to under-
stand easy to parse and easy to generate and check for errors Despite the presented qualities
SAM is slow to parse so a binary equivalent to it BAM has been developed to deal with this issue
BAM is used to intensive data processing and is useful in most product pipelines while SAM has
appropriate for interconversion with external applications and exploratory analysis Like FASTQ
BAMSAM formats are widely used as containers for raw sequence data
234 GFF and GTF
GFF 10 is a format for describing genes and other features associated with DNA RNA and Protein
sequences It was originally proposed as a protocol for the transfer of genomic feature information
allowing people to develop and test them without having to maintain a complete feature-finding
system The second version also allows for feature sets to be defined over RNA and Protein
sequences as well as genomic DNA
On the other hand GTF 11 stands for Gene transfer format and has been developed on top
of GFF specification The first eight GTF fields are the same as GFF The group field has been
6FASTA format httpgeneticsbwhharvardedupphFASTAhtml7NCBI httpwwwncbinlmnihgov8FASTQ format httpmaqsourceforgenetfastqshtml9SAM and BAM file formats httpsamtoolssourceforgenetSAMv1pdf
10GFF format httpwwwsangeracukresourcessoftwaregffspechtml11GTF format httpwwwensemblorginfowebsiteuploadgffhtml
12
Basic Concepts and Bibliographic Review
expanded into a list of attributes Each attribute consists of a typevalue pair Attributes must end
in a semi-colon and be separated from any following attribute by exactly one space
24 Relevant Data Repositories
It is important to validate results and test along with the implementation of RNA-Seq pipeline As
such real data are needed so that the quality and efficiency of this study is assessed Some repos-
itories are available online such as Gene Expression Omnibus (GEO 12) Genomic Data Sharing
(GDS 13) ENSEMBL 14 UCSC Genome Browser 15 or the ENCODE Project 16 The three last
ones are highlighted in next section
ENSEMBL
The Ensembl project provides information about many vertebrate and other eucaryotic species
being started in 1999 some years before the draft human genome was completed Until today
many genomes have been added over the years as well as the inclusion of comparative genomics
variation and regulatory data [HBB+02]
Between the included working teams of Ensembl the Genebuild is the one who is responsible
to create the gene sets both as developing and mantaining the BioMart 17 data mining tool
It also supplies a REST server 18 as well as an FTP tool for browse and download data [CAB+15]
UCSC Genome Browser
The UCSC Genome Browser is a website that consists of an open-source tool to browse
analyze and query genomic data Currently it grants access to some reference genomes giving the
possibility to retrieve specific data due to the search tool integrated
Along with this tool it is also available an FTP server where data can be accessed and down-
loaded
ENCODE Project
While ENSEMBL has information about many vertebrate and other species ENCODE is a
project to identify all functional elements in the human genome sequence as well as being able
to create comprehensive high quality catalogs of functional elements in the human genome using
highndashthroughput technologies Their mission is to enable the scientific and medical communities
12GEO httpwwwncbinlmnihgovgeo13GDS httpgdsnihgov02dr2html14ENSEMBL httpwwwensemblorgindexhtml15UCSC Genome Browser httpgenomeucscedu16ENCODE project httpswwwencodeprojectorg17BioMart httpbiomartorg18REST server of Ensembl httprestensemblorg
13
Basic Concepts and Bibliographic Review
to interpret the human genome sequence and apply it to understand human biology and improve
health [The04]
Besides their motivation an online repository is being build up indexing gathered data and
allowing users to query different data types regardless of location [Con11] Some samples can
be found at httpswwwencodeprojectorgexperimentsENCSR274JRR for ex-
ample
25 Tools for RNA-seq and Differential Analysis
To perform the RNA-Seq pipeline some tools for each process are required It is now presented
some set of them on the following sections
Bowtie
Bowtie 19 is a tool to align short reads to the human genome To achieve speed and memory-
efficiency Bowtie aligns reads with the aid of an index of the reference genome [Lan10] and can
take advantage of the use of simultaneous multiple processor cores [LTPS09] For the human
genome Burrows-Wheeler is a commonly used indexing process that this tool extends with a
novel quality-aware backtracking algorithm that permits mismatches
TopHat
TopHat 20 is used as a junction mapping tool for RNA-Seq reads Before TopHat current
mapping strategies could only localize reads to known exons in the genome This tool is a read-
mapping algorithm design to align reads to a reference genome without relying on know splice
sites [TPS09]
Cufflinks
Cufflinks 21 assembles transcripts estimates their abundances and tests for differential ex-
pression and regulation in RNA-Seq samples Internally it is made of four different parts Cuf-
flinks that assembles the package Cuffcompare that compares transcript assemblies to annotation
Cuffmerge that merges two or more transcript assemblies and Cuffdiff that takes the aligned reads
and reports genes and transcripts that are differentially expressed [TRG+12a]
HTSeq
19Bowtie httpbowtie-biosourceforgenetindexshtml20TopHat httpccbjhuedusoftwaretophatindexshtml21Cufflinks httpcole-trapnell-labgithubiocufflinks
14
Basic Concepts and Bibliographic Review
HTSeq 22 is a python framework to facilitate the rapid development of scripts to processing
and analysis of high-throughtput sequencing data
FASTQC
FASTQC 23 is a quality control tool for high-throughput sequencing data It receives as input
BAM SAM or FASTQ files provides a quick overview on which areas there may be problems
summarizes graphs and tables for a fast assess of data and exports results to an HTML based report
Samtools
Samtools 24 is a set of utilities to manipulate alignments in the BAM format (output format of
TopHat eg) It does sorting merging and indexing and allows to retrieve in any regions The
files can be either provided via standard input (stdin) of from a remote FTP or HTTP server
deFuse
deFuse 25 is a software for gene fusion discovery from RNA-Seq data It uses clusters of dis-
cordant paired alignments to inform a split read alignment analysis for finding fusion boundaries
As an output it produces a fully annotated output for each predicted fusion
26 Relational and Non-relational Databases
Relational Databases had been introduced in 1970 by Edgar Codd at IBM Almaden Research
Center [Cod70] It has been used for decades and has brought in the concept of relations With
this a relational database is usually represented by a structured model a table in which each row is
a tuple (also considered as an object) and the columns are the attributes of the tuple The database
can be queried in order to retrieve useful data based on their attributes whether in common between
tuples or not To do so it is used a structured query language SQL [LM10] The main set of
operations is known as CRUD Create Read Update and Delete Relational databases are also
know for their fixed schemas that force every tuple to have the exact same attributes
A very common operation in SQL databases are joins Joins are a way to associated data that
share attributes or are somehow related One example is imagining a table of people that have
bank accounts associated and there is another table where the existing banks are described A way
to relate them is to combine these two tables in order to directly view which individual is using
which bank This is a very simple example that can scale very quickly and become a dangerous
operation for the consumed resources to be used to compute the needed relationships
22HTSeq httpwww-huberembldeHTSeqdocoverviewhtml23FASTQC httpwwwbioinformaticsbabrahamacukprojectsfastqc24Samtools httpsamtoolssourceforgenet25deFuse httpsbitbucketorgdranewdefuse
15
Basic Concepts and Bibliographic Review
In contrast with the previous set a Non-relational database commonly doesnrsquot have a fixed
schema and avoid the previous complex operation Within this class of databases there are different
approaches to the used models such as key-value stores big table clones document databases and
graph databases Each of them is used accordingly to the data set complexity
MongoDB 26 is a non-relational database schemaless and is scalable in cluster performance
and data This way it provides a way to store large data sets with the freedom of using different
schemas according to data 27
27 Tecnologies
When developing a web service there are some basic resources and programming languages used
HTML 28 is a standard markup language for describing web documents CSS 29 is used for
defining how the HTML elements are to be displayed Bootstrap 30 is a free front-end frame-
work for faster and easier web development and contains HTML and CSS based design patterns
Javascript 31 serves as a method for programming the behavior of web pages jQuery 32 is a library
of Javascript that greatly specifies Javascriptrsquos usage
Even though commonly used PHP 33 is not the best suitable language for our thesis work
When compared to Python it lacks security and is not used on the Bioinformatics field On the
other hand Perl has been greatly used on this field but it is currently being replaced by Python 34
Furthermore this last one has libraries like BioPython 35 for internal processing of samples and
also has support to web through frameworks like Django 36 or BottlePy 37
Even though Django is trending it has no support for NoSQL relational databases yet Bot-
tlePy for instance is a lightweight web framework simple to use and provides the ability to use
MongoDB
Concerning the situation the combination of Python and BottlePy is the most suitable since it
has
bull Starting to replace Perl in bioinformatics processing
bull Support for NoSQL databases (either the framework and the programming language)
bull Lightweight usage
26MongoDB httpwwwmongodborg27MongoDB scalability httpwwwmongodbcommongodb-scale28HTML httpwwww3schoolscomhtml29CSS httpwwww3schoolscomcssdefaultasp30Bootstrap httpgetbootstrapcom31Javascript httpwwww3schoolscomjs32jQuery httpsjquerycom33PHP httpphpnet34Python httpswwwpythonorg35BioPython httpbiopythonorgwikiMain_Page36Django framework httpswwwdjangoprojectcom37BottlePy httpbottlepyorgdocsdevindexhtml
16
Basic Concepts and Bibliographic Review
Figure 26 Print screen of Galaxy when trying to get data from UCSC
For the purpose of sending the information between devices the FTP server solution was
analysed It allows the creation of an administrator user that has the permissions for writing and
reading but also for anonymous users that can only download data
28 Related Work
Galaxy
Galaxy 38 is an open source web-based platform for data intensive biomedical research
It consists of an embedded website system that provides access to different databases such
as Ensembl or UCSC Genome Browser Although functional the platform has not a consistent
interface which requires the user to learn to use many systems within it An example of this
situation can be viewed in Figure 26 Furthermore it does not provide the ability to choose easily
a stage pipeline like iRAP or to run a full one with personalized tools
BioMart Central Portal
BioMart 39 is a community-driven project to provide unified access to distributed research data
to facilitate the scientific discovery process
38Galaxy httpgalaxyprojectorg39BioMart Central Portal httpcentralbiomartorgsequencegui=Sequence_retrievalamp
mart=metaseq_mart_63_config
17
Basic Concepts and Bibliographic Review
It currently has a sequence retrieval tools that provides searching by database and dataset
Nowadays this tool offers Ensembl as the only available database but it adds up three other fea-
tures like a sequences filters and header information panels where the users can improve their
search
29 Chapter Summary
In this chapter we presented and discussed the technologies suitable for the thesis work We have
surveyed alternative technologies for gene expression computation and alternative splicing tools
The technologies are relevant to solve the Biological domain problem We have also surveyed
the tools for the development of websites and databases to store the data used when solving the
biological problems In the next chapter we describe work in detail
18
Chapter 3
The Gemini framework
Despite the very large number of tools available for Molecular Biology problems they are most
often difficult to use and require sophisticated computational resources As part of the thesis
work we have developed a framework that allows expert users to make RNA-Seq and alternative
splicing analysis using a user friendly web interface and sophisticated computational resources
In this chapter we describe that framework that include the website database resources for storing
data and the computational settings for the analysis
iRAP has been chosen to accomplish the automation of RNA sequencing analysis due to the
simplicity of use and its wide number of tools available for its task Since it is an integrated
tool platform its installation requires not only powerful computer resources but also a long list of
basic equipment necessary to each of them Considering these issues it had not always been easy
to setup the wanted work environment
Despite the difficulties of this scenario we have been able to complete the setup of this tool
and make some control experiments with it
In order to accomplish an iRAP execution a configuration file must be provided (see Ap-
pendix B) Along with the experiment name the name of species being analysed the reference
genome and read data files need to be specified and made available Furthermore the specific
tools for each stage of the pipeline need also to be specified among other possible variables
It is not easy and usually very time consuming for a Biologist to create the configuration file or
to run the command-line interface that controls iRAP pipeline Since this system is a combination
of many different tools there are a long list of available options that may be fulfilled Some of
them are mandatory while other ones are optional After this setting is completed it must be saved
in a text file and made available to run iRAP
Even though the usage of iRAP does not require extensive bioinformatics expertise it does
assume familiarity with UNIX command-line interface which would narrow down the target audi-
ence In order to overcome this situation we designed and developed a framework called Gemini
19
The Gemini framework
that includes a Graphical User Interface and makes RNA-Seq studies much more easy to perform
We have also included extra features for doing more analysis to RNA-Seq data
31 Gemini
Due to the lack of intuitiveness on the process of generating the configuration file it has been
created a more user friendly one through a web form This form asks for input of the main settings
to call a very simple experiment with a commonly used bacteria escherichia ecoli (e coli)
Another important feature is the possibility to fill the form asking what is the stage that the user
wants the pipeline to start with
Another issue was to find and easily download a reference genome for a certain species In
order to add completeness to Gemini and also to simplify the process of download it has been
implemented the functionality to download the reference genome (both fasta and annotation files)
It is used the Ensembl API to obtain the required results The jobs status feature lists the status of
jobs sent by the user for execution
Besides these features one more have been added even though not completed It is the job
results where it is presented the results collected for a determined task
32 Gemini Architecture
321 Physical Architecture
Gemini is divided into two different sets The first one is where the web application is hosted as
well as the database Since dealing with genomic data often requires great computer performance
processing experiments is accomplished in an independent server that later responds with results
Figure 31 Physical architecture of Gemini
Data scheme
MongoDB is NoSQL document based database The information is organized in collections
in which each element is stored as a JSON document NoSQL databases are simpler to use when it
20
The Gemini framework
comes to have different information fields in the same document and at the same time they have
better performance and scalability [SK11] Currently the information is arranjed in two collections
scheme as described on Table 31
Name DescriptionAccounts Stores the users dataJobs Stores the experiments dataTable 31 Collections used to store data
Accounts
An accountrsquos document stores an userrsquos email password and a unique identifier A role has
also been saved for future hierarchy creation in which some levels will grant more permissions
than others like changing accounts settings of other participants
1
2 _id ObjectId(54f5a9b234f76511a82ec3b2)
3 password e10adc3949ba59abbe56e057f20f883e
4 role user
5 email acgggomesgmailcom
6
Jobs
Jobs are related to an user and have the name and description of the experiment It also
stores the reference genomersquos location as well as the readsrsquo one Likewise the date of creation is
preserved When a job is completed the status is modified to finished
1
2 _id ObjectId(5544ecf134f7651d687bba94)
3 name ExpFinal
4 exp_dir data54f5a9b234f76511a82ec3b2ExpFinalreads
5 user 54f5a9b234f76511a82ec3b2
6 description Final test
7 genome_dir genomesEscherichia coli
8 status started
9 date ISODate(2015-05-02T152745249Z)
10
21
The Gemini framework
33 Data Management
In order to create a new job it is required two sets of data namely reference files and raw data
files The raw data is the actual data being analysed while the reference genome serves as basis to
the alignment or control
The typical workflow consists on the expert providing the experience and species names as
well as the raw data that was previously collected in the laboratory Afterwards through a step by
step system the user has the option to choose the reference genome to be used on the experiment
This last files are internally obtained from different FTP servers such as Ensembl and ENCODE
stored locally and reused in further usages
The provided information is then saved in the database and the files stored hierarchically We
use the following sequence of ltsection namegt ltuseridgt ltexperience namegt ltdata filesgt The
ltsection namegt can be conf for storing configuration files data for saving the reads or refer-
ence for keeping the reference genome and annotation files The ltuseridgt is the ID of Accounts
database document and the ltexperience namegt is the same as name in Jobs database document
A directory tree is represented in Figure 32
Figure 32 File system tree demonstrating the hierarchy of saved data files
This information is then passed to the server via a local FTP server that has been created
22
The Gemini framework
for this purpose We have followed an online tutorial 1 for the configuration From this we
created one administrator that has permissions for writing and reading files and we also authorized
anonymous login that may only retrieve files This way on the web application the admin user
creates the reads reference genomes annotation and configuration files On the computational
server an anonymous user authenticates for retrieving the files according to the filenames received
via API
The inside directory of FTP follows the hierarchy of ltuseridgt ltexperience namegt ltdata
filesgt where ltuseridgt is the ID on the Accounts document and ltexperience namegt is the name
on Jobs document When the server is prompted to run an experience it downloads the required
data from the FTP and runs iRAP with the necessary configuration options
34 Web Interface
For the implementation of Gemini python has been used for backend along with a simple fast and
lightweight WSGI micro web-framework called BottlePy 2 It has no dependencies and grants the
main functionalities such as routing templates some class utilities and a built-in server
The first screenshot (Figure 33) shows the home page of Gemini There is top menu bar with
two possible interactions login and register There is also a simple content box that describes the
main features and status of development of the platform Later on a new menu appears with the
possibility to logout on the Welcome tab (as in Figure 34)
Figure 33 Home page
Figure 34 Logout menu
1Tutorial available at httpswwwthomas-krenncomenwikiSetup_FTP_Server_under_Debian
2BottlePy httpbottlepyorgdocsdevindexhtml
23
The Gemini framework
The main feature of the system is the create job (Figure 35) option that is easily accessible on
top menu When the user clicks on it a form is displayed with the variables to introduce on the
configuration file that iRAP needs A description option has been added to provide the freedom to
the researcher to include some extra information that he finds useful
Figure 35 Create job form
The same type of form was used for the reference genomes section (Figure 36) The user is
prompted to choose orderly the species name release number and version Afterwards a table of
elements appears allowing the expert to download the files found
Figure 36 Reference genomes component
24
The Gemini framework
35 Use cases
Gemini was designed to have only one actor the user that will accomplish the experiments This
actor has the possibility to register login and logout of his account create a job and the hability
to download a reference genome of his choice Even though not fully implemented it has been
considered the jobs done functionality
Figure 37 Use cases diagram
36 Case studies
Some case studies with e coli in order to test iRAPrsquos installation and its capabilities For both
of the case studies it has been collected six samples of Escherichia coli reads from European
Nucleotide Archive 3 and the corresponding reference genome and annotation file from Ensembl
361 Full pipeline
In order to call the full pipeline iRAP has been tested with the directive irap conf=ecoli_exconf
Configuration file (ecoli_exconf ) content is as described in Appendix C In this task the system
received the reads and performed the quality control (QC) mapping quantification and differential
expression between the two groups of samples
3ENA httpwwwebiacukena
25
The Gemini framework
This test has been accomplished successfully
362 Stage pipeline
The stage pipeline is a powerful functionality since it allows the user to choose a specific stage of
the pipeline that he wants to execute for his samples
Besides the fact that it is not easy to collect data samples users often want to repeat or analyse
just one step of the pipeline and take some conclusions of it Furthermore this type of pipeline is
less time consuming
A concrete usage example is IPATIMUPrsquos data which contains the output information of the
mapper TopHat and will be further analysed in detail in Chapter 4 Concerning this setup it would
not be possible to call the full pipeline but instead it would require a command specific command
option
For validation purposes the same bacteria from the previous analysis has been used for the
stage pipeline case After calling the setup command to check input the directive irap conf=
ecoli_exconf quality_filtering_and_reporting has been used to perform the stage1
of iRAP The platform was able to perform with success this task
37 Chapter Summary
It has been used Python with BottlePy for the main implementation of the interface of Gemini
MongoDB has been chosen for dealing with information A FTP server was mounted for the
transitions of data between the client and the server The platform allows the expert to call a full or
stage pipeline analysis and provides the download of both fast and annotation files The essential
items are setup for the addition of further functionalities
26
Chapter 4
Case study
In this chapter it is going to be presented the Case Study with data from samples of thyroid carci-
noma along with their charactering and researching results
After the development of an interface to the iRAP tool the following step was to do a case
study with some realistic DNA samples of thyroid cancer patients regarding the partnership with
IPATIMUPrsquos researchers
The purpose of this case study was to do some research of potential differences between dis-
tinct types of the disease In order to accomplish this four samples were collected from Centro
Hospitalar de Satildeo Joatildeo (Porto) Cases 1 and 2 have been categorized as a widely invasive Fol-
licular Thyroid Carcinoma (wFTC) and cases 3 and 4 as a minimally invasive Follicular Thyroid
Carcinoma (mFTC)
41 Samples characterization
Patient from case 1 was female with 82 years old the tumour measuring 2 cm of size and presented
a predominant follicular growth pattern and oncocytic features Patient from case 2 was male with
55 years old the tumour measuring 5 cm of size and presented a predominant solidtrabecular
growth pattern For the group of mFTC patient from case 3 was female 56 years old the tumour
measuring 37 cm of size and with follicular growth pattern patient from case 4 was female 56
years old the tumour measuring 4 cm of size and with follicular growth pattern
42 Researching objectives
The aim of the study was to answer the following questions
bull Differentially expressed genes
bull Total isoforms found either in percentange and in absolute
27
Case study
bull Average of alternative isoforms for each gene spliced
bull Potentially novel isoforms and how do they behave between samplesgroups of samples
bull Compare results between versions of human genome assembly
bull Retrieve fusion genes
43 Protocol of analysis
Collected sample reads have been aligned against reference genome GRCh37 with TopHat version
141 Posterior analysis followed Tuxedo Protocol as described in Trapnell et al [TRG+12b] An
overview of the full protocol can be found in Figure 41
For the implementation of this procedure it were considered as two different groups the cases
1 and 2 (wFTC) against cases 3 and 4 (mFTC) The following step was to assemble transcripts for
each sample with Cufflinks 1 and afterwards create a single merged transcriptome annotation with
Cuffmerge 2 Cuffdiff 3 was then used to find significant changes in transcript expression
In order to find potential isoforms each sample was ran against the reference genome with
Cuffcompare 4
44 Genome version GRCh37 versus GRCh38
Even though IPATIMUPrsquos data have been assembled with reference genome version GRCh37
nowadays a more recent version (GRCh38) has been released in 2013 This new assembly is the
first major revision of the human genome in more than four years 5
The main differences between this two versions are
Alternate sequences several human chromosomal regions have sufficient variability to prevent
adequate representation by a single sequence This new version provides alternate sequence
for selected variant regions through the inclusion of alternate loci 6 scaffolds
Centromere 7 representation Previous method of representing centromeric regions have been
replaced by sequences from centromere models The models provide the approximate repeat
number and order for each centromere and are useful for read mapping and variation studies
Mitochondrial genome The new mitochondrial reference sequence is the Revised Cambridge
Reference Sequence with RefSeq accession number NC_0129201 The previous one was
RefSeq accession number NC_001907 which was not updated when GRCh37 assembly
later transitioned to the new version1Cufflinks httpcole-trapnell-labgithubiocufflinks2Cuffmerge httpcole-trapnell-labgithubiocufflinkscuffmergeindexhtml3Cuffdiff httpcole-trapnell-labgithubiocufflinkscuffdiffindexhtml4Cuffcompare httpcole-trapnell-labgithubiocufflinkscuffcompareindexhtml5As in UCSC mailing list at httpsgroupsgooglecomasoeucsceduforumtopic
genome-announce52Kv41YBXNY6Specific location of a gene on a chromosome
28
Case study
Figure 41 An overview of the Tuxedo Protocol with full steps TopHat for alignment Cufflinkspackage to find differential features between group samples and in the end CummeRbund to plotprevious results
Sequence updates Several erroneous bases and misassembled regions have been corrected and
more than 100 gaps have been filled or reduced
Analysis set The new assembly offers an analysis set that was created to accommodate next
generation sequencing read alignment pipelines Several GRCh38 regions have been elimi-
nated from this set to improve read mapping
29
Case study
45 Fusion genes
After we done some research on the technologies used for finding fusion genes in the reads we
have not been able to perform the analysis to answer the last question of our researching objectives
DeFuse required as input the original reads which were not provided This analysis would have
been interesting for relating the ocurrence of thyroid and the presence of fusion genes as well as if
there was any relevant difference between the samples of wFTC and mFTC
46 Results
461 Case study with reference genome GRCh37
The following table ( 41) demonstrates some genes that were differentially expressed with signif-
icance between mFTC and wFTC According to Celestino et al 8 CRABP1 C1QL1 and LCN2
are biomarkers of thyroid cancer and predictors of extrathyroidal extension It is commonly used
the value of 005 has threshold above which the differential expression is significant By inspect-
ing out the table we can find C1QL1 with a q-value of 0000555 and CRABP1 with a q-value
of 159E-11 which are in concordance with the previous article Furthermore it is verified the
increased gene expression in wFTC when compared to mFTC
Gene ID Gene Chr mFTC wFTC Fold change(log2) Q value
ENSG00000167748 KLK1 19 018672 111924 922742 0ENSG00000104725 NEFL 8 00196645 276961 104599 0ENSG00000174145 KIAA1239 4 00307388 144265 887444 0ENSG00000182379 NXPH4 12 008307 195786 788074 0ENSG00000131094 C1QL1 17 0121453 238957 429828 0000555ENSG00000142677 IL22RAI 1 150905 0384783 -529345 0ENSG00000138615 CILP 15 423569 0052726 -632793 241E-11ENSG00000141431 ASXL3 18 18938 001408 -707148 124E-09ENSG00000166426 CRABP1 15 748375 0367899 -766831 159E-11ENSG00000214145 LINC00887 3 19797 0119327 -737421 0000459
Table 41 Genes differentially expressed between minimally invasive follicular thryoid carcino-mas (mFTCs) and widely invasive follicular thyroid carcinomas (wFTCs)
In response to the previous researching objectives the Table 42 has the statistical results for
taks two and three From the data analysis we could conclude that less than 1 of genes have
isoforms but each one has an average of 389 alternatives
8Ricardo Celestino Torfin Nome Ana Pestana Andreas M Hoff Pedro A Gonccedilalves Catarina Eloy Eva SigstadRagnhild A Lothe Trine Bjoslashro Manuel Sobrinho-Simotildees Rofl I Skotheim Paula Soares CRAPBP1 C1QL1 andLCN2 are biomarkers of thyroid cancer and predictors of extrathyroidal extension subbmited for publication
30
Case study
Total genes 63896Total significant isoforms 689Total unique genes with isoforms 179Ratio of unique genes with isoformsgenes () 028Average of alternatives per gene with isoforms 389
Table 42 Statistical results for researching objectives number 2 and 3
462 Splicing analysis
Forward in the analysis Cuffcompare 9 has been used to search for novel isoforms when com-
pared to the reference genome The method was to compare each sample to the reference genome
and afterwards make an overlap of the results The main objective was then to infer about the
differences among wFTC and mFTC
Sample 1(wFTC)
Sample 2(wFTC)
Sample 3(mFTC)
Sample 4(mFTC)
Total genes 30440 36862 35539 37534Potential novel isoforms 7406 8450 8781 8830Table 43 Potential novel isoforms for each sample of IPATIMUPrsquos data
As demonstrated on Table 43 average there is a percentage of 24 of potentially novel iso-
forms found (at least one spliced junction is shared with a reference transcript) There is been
made an overlap of the results in order to encounter differences between wFTC and mFTC The
Table 44 presents the counting of differences between cases A brief analysis allows us to say
that we can not make any relationship between wFTC and mFTC On average there was a total of
3722 changes among this two sets The average within the sets are 3554 for wFTC and 3992 for
mFTC Given this results there was not a significant divergence to allow us to relate the splicing
and the occurrence of a more invasive Thyroid Carcinoma
Sets ChangesS1 S2 3554S1 S3 3609S1 S4 3612S2 S3 3847S2 S4 3820S3 S4 3929
Table 44 Number of differences between samples Syntax used S1 - Sample 1 S2 - Sample 2S3 - Sample 3 and S4 - Sample 4
9Cuffcompare httpcole-trapnell-labgithubiocufflinkscuffcompareindexhtml
31
Case study
463 Case study with reference genome GRCh38
In order to respond to the last research objective it has been applied the method of analysis has
before with a more recent human genome assembly After using the same protocol with Cufflinks
Cuffmerge and Cuffdiff sequentially we have come to some conclusions
The produced results of differential expression analysis for the same genes were very different
Genes that were highly significant before like C1QL1 and CRABP1 now had no relevance (q-
value gt 005) As mentioned before we had only access to TopHatrsquos output that used version
GRCh37 for the alignment and mapping process so we could not start from scratch the analysis
This outcome demonstrates two topics in particular
1 the introduction of novel annotations can make previous analysis outdated
2 there is the need to save the original reads in order to update earlier studies
The solution to this situation would have been to use the original reads to repeat the assembly
and then follow the Tuxedo protocol to collected correct and updated differential expression data
47 Chapter Summary
These section of development has been introduced in order to confer not only validation but also
to do some researching studies on the subject Four samples were collected and divided into two
distinct groups Tuxedo protocol was followed for responding to the research objectives The
case study for GRCh37 demonstrated the expression of C1QL1 and CRABP1 on wFTC when
compared to mFTC as indicated in the referred article On the other hand the same protocol when
applied with GRCh38 demonstrated the importance of saving the original reads and what is the
influence of newer releases in previous researching results Lastly the splicing analysis results did
not show any evidence of related isoforms count and the manifestation of the different stages of
the disease
32
Chapter 5
Conclusions and Future Work
The research of genomic-based cancers require highly complex data analysis Such analysis re-
quire most often the use of a large number of complex computational resources the gathering
of a lot of information over the Internet and the use of powerful computational resources Fur-
thermore the manipulation of the computational tools and resources require the assistance of an
informatics expert
The thesis work is a contribution towards the solution of the above mention problem We
propose and developed a framework that enables an expert biologist to perform genomic-based
complex analysis in a easy way and using the required powerful computational resources in a
transparent way
Using the developed framework we have used real data to address several research questions
provided by IPATIMUPrsquos researchers Firstly with the human genome GRCh37 we identified
two of the biomarkers of thyroid cancer by differential gene expression analysis Secondly we
found 689 significant isoforms 179 unique out of 63896 genes (ratio of 028) with an average
of 389 isoforms per gene Thirdly when trying to determine potential novel isoforms we came
at no conclusion of the differences of expression when comparing wFTC and mFTC The last
case was applying the Tuxedo protocol with the new GRCh38 on samples The outcome of the
experiment revealed the importance of saving the original reads and that newer releases become
previous analysis outdated
Future Work
This thesis work is just a starting point As stated before the framework was designed so it can be
extended with further modules to enable addressing other research questions
The case studies also showed us that RNA-seq analysis is very time consuming On the other
hand there are a lot of sub-tasks that can be run in parallel (like the task of aligning the reads)
33
Conclusions and Future Work
We will study and compare different techniques and opportunities to make RNA-seq in parallel as
much as possible
34
References
[bNE] Scitable by Nature Education Transcriptome available at httpwwwnaturecomscitabledefinitiontranscriptome-296 last accessJanuary 2015
[CAB+15] Fiona Cunningham M Ridwan Amode Daniel Barrell Kathryn Beal Konstanti-nos Billis Simon Brent Denise Carvalho-Silva Peter Clapham Guy CoatesStephen Fitzgerald Laurent Gil Carlos Garciacutea Giroacuten Leo Gordon ThibautHourlier Sarah E Hunt Sophie H Janacek Nathan Johnson Thomas Juette-mann Andreas K Kaumlhaumlri Stephen Keenan Fergal J Martin Thomas MaurelWilliam McLaren Daniel N Murphy Rishi Nag Bert Overduin Anne ParkerMateus Patricio Emily Perry Miguel Pignatelli Harpreet Singh Riat DanielSheppard Kieron Taylor Anja Thormann Alessandro Vullo Steven P WilderAmonida Zadissa Bronwen L Aken Ewan Birney Jennifer Harrow Rhoda Kin-sella Matthieu Muffato Magali Ruffier Stephen MJ Searle Giulietta SpudichStephen J Trevanion Andy Yates Daniel R Zerbino and Paul Flicek Ensembl2015 Nucleic Acids Research 43(D1)D662ndashD669 2015
[CFG+10] Peter J A Cock Christopher J Fields Naohisa Goto Michael L Heuer and Peter MRice The Sanger FASTQ file format for sequences with quality scores and theSolexaIllumina FASTQ variants Nucleic acids research 38(6)1767ndash71 April2010
[CH07] Geoffrey M Cooper and Robert E Hausman The Cell - A molecular approachAmerican Society for Microbiology 2007
[Cod70] E F Codd A relational model of data for large shared data banks Communica-tions of the ACM 13(6)377ndash387 June 1970
[Con11] The ENCODE Project Consortium A userrsquos guide to the encyclopedia of DNAelements (ENCODE) PLoS biology 9(4)e1001046 April 2011
[FMB14] N A Fonseca J A Marioni and A Brazma RNA-seq gene profiling - a system-atic empirical comparison Technical report May 2014
[FPMB14] Nuno A Fonseca Robert Petryszak John Marioni and Alvis Brazma irap - anintegrated rna-seq analysis pipeline bioRxiv 2014
[GCW+10] Qiang Gan Iouri Chepelev Gang Wei Lama Tarayrah Kairong Cui Keji Zhaoand Xin Chen Dynamic regulation of alternative splicing and chromatin structurein Drosophila gonads revealed by RNA-seq Cell research 20(7)763ndash83 July2010
35
REFERENCES
[GEN] GENIE Dna genes and chromossomes University of Leicesteravailable at httpwww2leacukdepartmentsgeneticsvgecschoolscollegestopicsdna-genes-chromosomes last access Jan-uary 2015
[Gri] Malachi Griffith Bioinformatics for Cancer Genomics (BiCG)available at httpbioinformaticscaworkshops2012bioinformatics-cancer-genomics-bicg last access January 2015
[GTBK11] Angela Goncalves Andrew Tikhonov Alvis Brazma and Misha Kapushesky Apipeline for RNA-seq data processing and quality assessment Bioinformatics (Ox-ford England) 27(6)867ndash9 March 2011
[HBB+02] T Hubbard D Barker E Birney G Cameron Y Chen L Clark T CoxJ Cuff V Curwen T Down R Durbin E Eyras J Gilbert M HammondL Huminiecki A Kasprzyk H Lehvaslaiho P Lijnzaad C Melsopp E Mon-gin R Pettett M Pocock S Potter A Rust E Schmidt S Searle G SlaterJ Smith W Spooner A Stabenau J Stalker E Stupka A Ureta-Vidal I Vastrikand M Clamp The ensembl genome database project Nucleic Acids Research30(1)38ndash41 2002
[HBD+13] R Hitzemann D Bottomly P Darakjian N Walter O Iancu R SearlesB Wilmot and S McWeeney Genes behavior and next-generation RNA se-quencing Genes Brain Behav 12(1)1ndash12 Feb 2013
[Ins] National Human Genome Research Institute Transcriptome available at httpwwwgenomegov13014330 last access January 2015
[Joh03] Jason M Johnson Genome-wide survey of human alternative pre-mrna splicingwith exon junction microarrays Science 3022141ndash2144 December 2003
[kn10] Gene set enrichment a problem of pathways Briefings in functional genomics9(5-6)385ndash90 December 2010
[kn11] Overview of available methods for diverse RNA-Seq data analyses Science ChinaLife sciences 54(12)1121ndash8 December 2011
[Lan10] Ben Langmead Aligning short sequencing reads with Bowtie Current proto-cols in bioinformatics editoral board Andreas D Baxevanis [et al] Chapter11Unit 117 December 2010
[LM10] Adam Lith and Jakob Mattsson Investigating storage solutions for large data - acomparison of well performing and scalable data storage solutions for real timeextraction and batch insertion of data Masterrsquos thesis 2010
[LTPS09] Ben Langmead Cole Trapnell Mihai Pop and Steven L Salzberg Ultrafastand memory-efficient alignment of short DNA sequences to the human genomeGenome biology 10(3)R25 January 2009
[ORY10] Alicia Oshlack Mark D Robinson and Matthew D Young From RNA-seq readsto differential expression results Genome biology 11(12)220 January 2010
[SG15] Marc W Schmid and Ueli Grossniklaus Rcount simple and flexible RNA-Seqread counting Bioinformatics 31(3)436ndash437 February 2015
36
REFERENCES
[SK11] Christof Strauch and Walter Kriha NoSQL databases Lecture Notes StuttgartMedia University February 2011
[SOdMVN12] Mikhail Shugay Intildeigo Ortiz de Mendiacutebil Joseacute L Vizmanos and Francisco JNovo Genomic hallmarks of genes involved in chromosomal translocations inhematological cancer PLoS Comput Biol 8(12)e1002797 12 2012
[The04] The ENCODE Project Consortium The ENCODE (ENCyclopedia Of DNA Ele-ments) Project Science (New York NY) 306(5696)636ndash40 October 2004
[TPS09] Cole Trapnell Lior Pachter and Steven L Salzberg TopHat discovering splicejunctions with RNA-Seq Bioinformatics (Oxford England) 25(9)1105ndash11 May2009
[TRG+12a] Cole Trapnell Adam Roberts Loyal Goff Geo Pertea Daehwan Kim David RKelley Harold Pimentel Steven L Salzberg John L Rinn and Lior Pachter Dif-ferential gene and transcript expression analysis of RNA-seq experiments withTopHat and Cufflinks Nature protocols 7(3)562ndash78 March 2012
[TRG+12b] Cole Trapnell Adam Roberts Loyal Goff Geo Pertea Daehwan Kim David RKelley Harold Pimentel Steven L Salzberg John L Rinn and Lior Pachter Dif-ferential gene and transcript expression analysis of RNA-seq experiments withTopHat and Cufflinks Nature protocols 7(3)562ndash78 March 2012
[WMM+11] Ying Wang Gaurang Mehta Rajiv Mayani Jingxi Lu Tade Souaiaia YanghoChen Andrew Clark Hee Jae Yoon Lin Wan Oleg V Evgrafov James AKnowles Ewa Deelman and Ting Chen RseqFlow workflows for RNA-Seq dataanalysis Bioinformatics (Oxford England) 27(18)2598ndash600 September 2011
[Wol13] Jochen B W Wolf Principles of transcriptome analysis and gene expressionquantification an rna-seq tutorial Molecular Ecology Resources 13(4)559ndash5722013
[ZW09] Mark Gerstein |amp Michael Snyder Zhong Wang Rna-seq a revolutionary tool fortranscriptomics Nature Reviews Genetics 1057ndash63 January 2009
37
REFERENCES
38
Appendix A
iRAP tools supported
A1 Mappers
Mapper Option name (mapper)TopHat 1 tophat1TopHat 2 tophat2SMALT smaltGSNAP gsnapSOAPsplice soapspliceBWA bwa1BWA bwa2Bowtie 1 bowtie1Bowtie2 bowtie2GEM gemSTAR starOSA osaMapSplice mapsplice
A2 Quantification
Quantifier Option name (quant_method)FluxCapacitor flux_capHT-Seq (union mode) htseq1HT-Seq (intersection non-empty mode) htseq2Cufflinks 1 (try to find novel transcripts-g) cufflinks1Cufflinks 2 (try to find novel transcripts-g) cufflinks2Cufflinks 1 (do not assemble novel transcripts-G) cufflinks1_ndCufflinks 2 (do not assemble novel transcripts-G) cufflinks2_ndNURD nurd
39
iRAP tools supported
A3 Differential expression [DE]
Method Option name (de_method)DESeq deseqDESeq2 deseq2EdgeR edgerCuffdiff 1 cuffdiff1Cuffdiff 2 cuffdiff2
A4 Gene set enrichment analysis [GSE]
Tool Option name (gse_tool)Piano piano
40
Appendix B
iRAP model of configuration file
1 This is a comment (lines that start with a are ignored by iRAP)
2 =============================================================================
3 name that you want to give to the experiment (no spaces)
4 All files produced by irap will be placed in a folder with the given name
5 name=myexp
6
7
8 =============================================================================
9 name of the species
10 species=homo_sapiens
11
12 =============================================================================
13 Fasta file with the reference genome
14 reference=Homo_sapiensGRCh3766dnafa
15
16 =============================================================================
17 GTF file with the annotations
18 gtf_file=Homo_sapiensGRCh3766gtf
19
20 =============================================================================
21 IRAP options (may be providedoverriden in the command line)
22
23
24 Mapper
25 mapper=
26
27
28 Quantification method
29 quant_method=
30
31
32 Dif expression method
33 Requires contrasts to be defined (see below)
41
iRAP model of configuration file
34 de_method=
35
36
37 Gene set enrichment (GSE) analysis
38 Requires de_method to be defined
39 Tool to use (none|piano)
40 gse_tool=piano
41
42 gse_method (mean|median|sum|fisher|fisher-exact|stouffer|tailStrength|wilcoxon|
reporter|page) see Piano vignete documentation for more details
43 gse_method=fisher
44 gse_pvalue=005
45 Minimum number of genes in a gene set
46 gse_minsize=3
47
48
49
50 TSV file with gene annotation
51 Format IDNamelocussourcelnameGOGOtermKEGG
52 Description
53 ID=gene_id (this is mandatory and should match the one given in the gtf file)
54 Name=gene name
55 locus=chrstart--end
56 source=biotype
57 lname=gene name
58 GO=go ids (multiple values can be separated by)
59 GO=GO terms (multiple values can be separated by)
60 KEGG=Kegg ids (multiple values can be separated by)
61 If auto is defined then iRAP will try to generate the file
62 - this may take a considerable amount of time and will only work
63 for a reduced number of species
64 off - default value
65 annot_tsv=
66
67
68 QC
69 Check data (reads) quality (on|off|none)
70 on - reads are filtered out based on their quality
71 off - the quality of the reads is assessed but no filtering is done
72 none- no quality control is performed
73 qual_filtering=on
74
75 Trim all reads to the minimum read size after quality trimming - Yes (y)| No (n)
76 only applicable if qual_filtering is on
77 trim_reads=y
78
79 Minimum base quality accepted (def 10)
80 min_read_quality=10
81
42
iRAP model of configuration file
82 Contamination check (cont_index parameter) Reads that likely
83 originate from organisms other than the one under study can be
84 discarded during pre-processment of the reads This is done by
85 aligning the reads to the genomes of organisms that might be a
86 source of contamination and discard those that map with a high
87 degree of fidelity By default iRAP will check if the data is
88 contaminated by e-coli An example to create a contamination
89 database is provided in the examplesex_add2contaminationDBsh
90 script The value of the parameter should be the file name prefix of
91 the bowtie index files
92
93 Disable contamination check
94 cont_index=no
95 Default value
96 cont_index=$(data_dir)contaminatione_coli
97
98
99 Misc options
100
101 Number of threads that may be used by IRAP
102 max_threads=1
103
104 Exon level quantification Yes (y)| No (n)
105 exon_quant=y
106
107 Transcript level quantification Yes (y)| No (n)
108 transcript_quant=y
109 =============================================================================
110 full or relative path to the directory where all the data can be found
111 data_dir=data
112
113 the directory should be organized as follows (see directory data in IRAP toplevel
directory)
114
115 $data_dir
116 $data_dir
117 contamination
118 e_coli1ebwt
119 e_coli2ebwt
120 e_coli3ebwt
121 e_coli4ebwt
122 e_coliREADME
123 e_colirev1ebwt
124 e_colirev2eb
125 raw_data
126 $species
127 fastq
128 fastq
129
43
iRAP model of configuration file
130 reference
131 $species
132 $gtf_file
133 $reference
134
135 Notes
136 1) $ denotes the value defined for the variable
137 2) Since version 050 the raw data (fastqbam) files may be
138 distributed across several sub-folders
139
140
141 =============================================================================
142 Only necessary if you intend to perform Differential Expression analysis
143
144 contrasts=contrast_def [contrast_def ]
145 contrasts=purpleVsPink purpleVsGrey
146
147 definition of each constrast
148 contrast= group group [ group ]
149 purlpleVsPink=Purple Pink
150 purlpleVsGrey=Purple Grey
151
152 groups
153 GroupName= Library_name [Library_name ]
154 Purlple=myLib1 myLib2
155 Pink=myLib3
156 Grey=myLib4
157
158 optional parameter used in the report (HTML) generation
159 groups=Purple Pink Grey
160
161 technical replicates
162 technicalreplicates=myLib1myLib2myLib3mylib4
163
164 Note names of groups contrasts and libraries should start with a letter and
contain only alphanumeric characters and the character _
165
166 =============================================================================
167 Data
168
169
170 Information for each library
171 LibName=Fastq file
172 Note
173 1 LibName should start with a letter and contain only alphanumeric characters
and the character _ LibName should not contain in _1 or _2
174 2 LibName should be different from the name of the fastq file for instance
175 f1=f1fastq
176 will produce an error
44
iRAP model of configuration file
177
178 Single-end
179 myLib1=f1fastq
180 read size
181 myLib1_rs=75
182 quality encoding (33 or 64)
183 myLib1_qual=33
184
185 strand specific protocol
186 mylib1_strand=first
187 mylib1_strand=second
188 Default value is both (strands)
189 mylib1_strand=both
190
191 Have the file in a different sub-folder
192 mylib1_dir=somesubfolder
193
194 See SAMBAM specification for more details about the following two parameters
195 read group id (to be included in the BAM file) - this is not supported by all
mappers
196 myLib1_rgid=
197 sambam header lines to include in the BAM file
198 myLib1_shl=COtThis is a commentnCOtand another line
199
200 LibName=Fastq file
201 myLib2=f2fastq
202 read size
203 myLib2_rs=75
204 quality encoding (33 or 64)
205 myLib2_qual=33
206
207
208 Paired-end
209 LibName=Fastq files
210 myLib3=f3_1fastq f3_2fastq
211 read size
212 myLib3_rs=50
213 quality encoding (33 or 64)
214 myLib3_qual=33
215 insert size
216 myLib3_ins=350
217 standard deviation
218 myLib3_sd=60
219
220 LibName=Fastq files
221 myLib4=f4_1fastq f4_2fastq
222 read size
223 myLib4_rs=50
224 quality encoding (33 or 64)
45
iRAP model of configuration file
225 myLib4_qual=33
226 insert size
227 myLib4_ins=350
228 standard deviation
229 myLib4_sd=60
230
231
232
233
234 list the names of your single-end (se) and paired (pe) libraries
235 se=myLib1 myLib2
236 pe=myLib3 myLib4
237 No SE data
238 se=
239 No PE data
240 pe=
241
242
243
244 Passingoverriding parameters
245
246 It is possible to pass parameters to the mappers and quantification
247 methods but that should be done carefully since it may break the
248 pipeline (if the location of the input andor output files is
249 changed)
250
251 Overridingchanging the mappersrsquo parameters
252 _map_options=options
253 Example
254 tophat2_map_options=--min-intron-length 5 --no-coverage-search
255
256 Overridingchanging the parameters of the quantification methods
257 _params=options
258 Example
259 htseq_params= -q
46
Appendix C
iRAP example configuration file
1 minimal configuration file for DE
2 experiment name
3 name=ecoli_ex
4 species
5 species=ecoli_k12
6 reference genome
7 reference=Escherichia_coli_str_k_12_substr_mg1655GCA_000005845119dnatoplevel
fagz
8 gtf file
9 gtf_file=Escherichia_coli_str_k_12_substr_mg1655GCA_000005845119gtfgz
10 Enable filtering based on quality
11 qual_filtering=on
12 Use a contamination data set to filter out reads
13 cont_index=no
14 Toplevel directory with the data
15 data_dir=
16
17 some contrasts
18 GA=Group A
19 contrasts=GAvsGB GBvsGA
20 GAvsGB=GA GB
21 GBvsGA=GB GA
22 GA=FA FB FC
23 GB=FD FE FF
24
25 se=FA FB FC FD FE FF
26
27 FA=SRR933983fastqgz
28 FA_rs=50
29 FA_qual=33
30
31 FB=SRR933984fastqgz
32 FB_rs=50
47
iRAP example configuration file
33 FB_qual=33
34
35 FC=SRR933985fastqgz
36 FC_rs=50
37 FC_qual=33
38
39 FD=SRR933989fastqgz
40 FD_rs=50
41 FD_qual=33
42
43 FE=SRR933990fastqgz
44 FE_rs=50
45 FE_qual=33
46
47 FF=SRR933990fastqgz
48 FF_rs=50
49 FF_qual=33
50 EOF
48
- Front Page
- Table of Contents
- List of Figures
- List of Tables
- 1 Introduction
-
- 11 Context
- 12 Motivation and Goals
- 13 Proposed Solution
- 14 Structure of the Dissertation
-
- 2 Basic Concepts and Bibliographic Review
-
- 21 Biological Basic Concepts
-
- 211 Genome
- 212 Transcriptome Assembly and Gene expression
-
- 22 RNA-Seq Analysis
-
- 221 RNA-Seq microarrays and DNA sequencing
- 222 RNA-Seq Pipeline
-
- 23 Standard File Formats used
-
- 231 FASTA
- 232 FASTQ
- 233 SAM and BAM
- 234 GFF and GTF
-
- 24 Relevant Data Repositories
- 25 Tools for RNA-seq and Differential Analysis
- 26 Relational and Non-relational Databases
- 27 Tecnologies
- 28 Related Work
- 29 Chapter Summary
-
- 3 The Gemini framework
-
- 31 Gemini
- 32 Gemini Architecture
-
- 321 Physical Architecture
-
- 33 Data Management
- 34 Web Interface
- 35 Use cases
- 36 Case studies
-
- 361 Full pipeline
- 362 Stage pipeline
-
- 37 Chapter Summary
-
- 4 Case study
-
- 41 Samples characterization
- 42 Researching objectives
- 43 Protocol of analysis
- 44 Genome version GRCh37 versus GRCh38
- 45 Fusion genes
- 46 Results
-
- 461 Case study with reference genome GRCh37
- 462 Splicing analysis
- 463 Case study with reference genome GRCh38
-
- 47 Chapter Summary
-
- 5 Conclusions and Future Work
- References
- A iRAP tools supported
-
- A1 Mappers
- A2 Quantification
- A3 Differential expression [DE]
- A4 Gene set enrichment analysis [GSE]
-
- B iRAP model of configuration file
- C iRAP example configuration file
-
Basic Concepts and Bibliographic Review
Figure 23 Fusion genes generation types
During the procedure it is performed a process called sequencing 3 that determines the order
of nucleotide bases within a stretch of DNA Next-generation sequencing (NGS) extends this tech-
nique across millions of reactions and involves rapid sequencing of large DNA stretches spanning
entire genomes
On particular for RNA Next-generation RNA sequencing enables researchers to identify and
quantify both rare and common transcripts align sequencing reads across splice junctions and de-
tect isoforms novel transcripts and gene fusions and perform robust whole-transcriptome analysis
on a wide range of samples including low-quality ones 4
A transcriptome is the a set of all RNA molecules transcribed from a RNA template [Wol13]
From the transcriptome and according to the used technique it is possible to count the number
of transcripts and then determine the amount of gene activity (gene expression) in a certain cell
or tissue type This is particularly useful when researchers are trying to discover the function of a
certain gene by analysing a transcriptome and the corresponding gene expression levels it can be
inferred what role does it play whether it is in cell growth or in fat storage for example [Ins] As
such transcriptome assembly is a computational reconstruction of RNA from smaller sequences
called reads and obtained experimentally
Differently from the genome the transcriptome actively changes according to context In
order to follow this changes there is a laboratory technique called microarray that measures the
expression of thousands of genes at the same time providing gene expression profiles [bNE]
The assembly can be done by either aligning the previous libraries obtained from Illumina to
a reference genome or reference transcripts or assembled de novo without the genomic sequence
to produce a genome-scale transcription map that consists of both the transcriptional structure and
or level of expression for each gene [ZW09]
3As in Illumina techniques description at httpwwwilluminacomapplicationssequencinghtml4As seen in httpwwwilluminacomapplicationssequencingrnahtml
8
Basic Concepts and Bibliographic Review
22 RNA-Seq Analysis
As stated in the previous section there are alternative techniques to obtain the gene expression In
this section we compare them and then provide detailed information on RNA-Seq
221 RNA-Seq microarrays and DNA sequencing
For the analysis of genome expression it is commonly used RNA sequencing Firstly it is cho-
sen this technique instead of DNA sequencing because some molecular features like alternative
isoforms can only be observed at the RNA level predicting transcript sequence from genome is
difficult and in functional studies even though genome may be constant an experimental condition
has a pronounced effect on gene expression Also it is a way to interpret mutations that do not
have an obvious effect in the protein sequence but affect what mRNA isoform is expressed and
how much [Gri]
Secondly even though microarrays have facilitated gene expression based analysis but provide
relatively little information about alternative splicing In late 90rsquos microarray experiments were
generally expensive limiting sample sizes which represented a disaster specially when associated
to thousands of independent observations per sample Some attempts have been made to surpass
this problem but none could perform well in brain tissue RNA-Seq then appeared as a method to
mapping and quantifying transcriptomes It has clear advantages over existing approaches since
it has a greater dynamic range detects both coding and noncoding RNAs is superior for gene
network construction detects spliced transcripts and allele specific expression and can be used
to extract genotype information Also by comparing both of them while microarray output is
fluorescence intensity the output from a RNA-Seq experiment is digital and comes in the form of
read counts [HBD+13]
Furthermore RNA-Seq provides a far more precise measurement of levels of transcripts and
their isoforms than other methods It can reveal precise location of transcription boundaries and
is particularly useful to apply on complex transcriptomes In addition RNA-Seq is shown to be
highly accurate for quantifying expression levels while requiring less RNA sample when compared
to another techniques [ZW09] and it also can resolve both gene expression level and alternative
splicing events simultaneously [GCW+10]
222 RNA-Seq Pipeline
RNA-Seq has become the tool of choice for genome-wide analysis of the transcriptome [ORY10
SG15] However a typical RNA-Seq experiment generates millions of raw sequence reads that re-
quire considerable computational resources and programming skills to process the data [GTBK11
ORY10 FPMB14 FMB14] An overview of a basic pipeline for such analysis can be found in
Figure 24
9
Basic Concepts and Bibliographic Review
Figure 24 The essential workflow for RNA-Seq analysis [kn11]
When no reference genome is available it is necessary to construct a de novo assembly This
step will not be considered here since it was not used on the thesis work Given this we are able to
hold this main concepts
Quality control a pre-processing step where quality of raw reads are assessed At this stage bad
ldquoqualityrdquo ones may be excluded from the data set preventing potential mapping mismatches
and providing a better performance in further states
Read alignment that aligns the (quality filtered) reads to a reference genome in order to recon-
struct the larger sequence
Quantification that summarises and aggregates reads over a biologically meaningful unit such as
exons isoforms or genes
Differential expression that identifies genes expressed being the basis for future assessing of
proteins function originating from such genes
Note that this is just a basis workflow for RNA-Seq analysis that provide the possibility to add
or remove some of the stages according to different purposes
iRAP - A pipeline for RNA-Seq
Usually a combination of different tools might be desirable but on the other side time con-
suming since they depend on each others inputoutput and they are frequently focused in single
purposes hence often incompatible with one another [WMM+11]
10
Basic Concepts and Bibliographic Review
iRAP 5 appears as an integrated solution that allows users to choose and apply their preferred
tools for mapping reads quantifying expression and testing for differential expression [FPMB14]
Figure 25 iRAP pipeline for RNA sequencing analysis
The Figure 25 shows the main steps for this methodology that by comparing with the previous
workflow (Figure 24) has two more stages Gene set enrichment and Web reports Gene set
enrichment is a means of analysing genomic data by studying the effects of groups of genes on a
phenotype rather then individual gene analysis [kn10] Web reports facilitate the inspection of the
results produced at different stages of the analysis by providing web pages with tables or plots of
information [FPMB14]
iRAP is also capable of performing analysis starting at any stage of the pipeline by choosing
the right command line options Currently it has the following five different stage options as
described below
setupstage0 check all directories and data files are present and at the expected place
stage1 quality filtering and reporting check fastq file quality and report
stage2 mapping to the transcriptome or to the genome
stage3 estimate gene expression
stage4 estimate differential expression
Furthermore the expert can choose the specific tool for each phase of the system some of
which are described in detail in further sections The current list of tools supported are available
in Appendix A
When using iRAP the user has the possibility to speed up the analysis by using the irap_lsf
command This method accepts the same parameters as iRAP but splits the analysis into multiple
jobs with the aim of reducing the time to analyze the data
5iRAP repository httpscodegooglecompirap
11
Basic Concepts and Bibliographic Review
23 Standard File Formats used
For the implementation of the previous pipeline some file formats are used to input or retrieve
data Below will be presented the most widely used ones along with some short description and
detail when needed
231 FASTA
FASTA 6 is the definition line and sequence character format used by NCBI 7 It is a text-based for-
mat for representing either nucleotide (DNA or RNA) or amino acid (protein) sequences FASTA
is commonly used since it is easy to manipulate and parse using text-processing tools and scripting
languages Usually in iRAP a FASTA format is used to store the a reference genome
232 FASTQ
FASTQ 8 provides a simple extension to the previous format the ability to store a numeric quality
score associated with each nucleotide in a sequence [CFG+10] It is generally used as the first
input with the raw data
233 SAM and BAM
SAM 9 is a generic format for storing large nucleotide sequence alignments It is easy to under-
stand easy to parse and easy to generate and check for errors Despite the presented qualities
SAM is slow to parse so a binary equivalent to it BAM has been developed to deal with this issue
BAM is used to intensive data processing and is useful in most product pipelines while SAM has
appropriate for interconversion with external applications and exploratory analysis Like FASTQ
BAMSAM formats are widely used as containers for raw sequence data
234 GFF and GTF
GFF 10 is a format for describing genes and other features associated with DNA RNA and Protein
sequences It was originally proposed as a protocol for the transfer of genomic feature information
allowing people to develop and test them without having to maintain a complete feature-finding
system The second version also allows for feature sets to be defined over RNA and Protein
sequences as well as genomic DNA
On the other hand GTF 11 stands for Gene transfer format and has been developed on top
of GFF specification The first eight GTF fields are the same as GFF The group field has been
6FASTA format httpgeneticsbwhharvardedupphFASTAhtml7NCBI httpwwwncbinlmnihgov8FASTQ format httpmaqsourceforgenetfastqshtml9SAM and BAM file formats httpsamtoolssourceforgenetSAMv1pdf
10GFF format httpwwwsangeracukresourcessoftwaregffspechtml11GTF format httpwwwensemblorginfowebsiteuploadgffhtml
12
Basic Concepts and Bibliographic Review
expanded into a list of attributes Each attribute consists of a typevalue pair Attributes must end
in a semi-colon and be separated from any following attribute by exactly one space
24 Relevant Data Repositories
It is important to validate results and test along with the implementation of RNA-Seq pipeline As
such real data are needed so that the quality and efficiency of this study is assessed Some repos-
itories are available online such as Gene Expression Omnibus (GEO 12) Genomic Data Sharing
(GDS 13) ENSEMBL 14 UCSC Genome Browser 15 or the ENCODE Project 16 The three last
ones are highlighted in next section
ENSEMBL
The Ensembl project provides information about many vertebrate and other eucaryotic species
being started in 1999 some years before the draft human genome was completed Until today
many genomes have been added over the years as well as the inclusion of comparative genomics
variation and regulatory data [HBB+02]
Between the included working teams of Ensembl the Genebuild is the one who is responsible
to create the gene sets both as developing and mantaining the BioMart 17 data mining tool
It also supplies a REST server 18 as well as an FTP tool for browse and download data [CAB+15]
UCSC Genome Browser
The UCSC Genome Browser is a website that consists of an open-source tool to browse
analyze and query genomic data Currently it grants access to some reference genomes giving the
possibility to retrieve specific data due to the search tool integrated
Along with this tool it is also available an FTP server where data can be accessed and down-
loaded
ENCODE Project
While ENSEMBL has information about many vertebrate and other species ENCODE is a
project to identify all functional elements in the human genome sequence as well as being able
to create comprehensive high quality catalogs of functional elements in the human genome using
highndashthroughput technologies Their mission is to enable the scientific and medical communities
12GEO httpwwwncbinlmnihgovgeo13GDS httpgdsnihgov02dr2html14ENSEMBL httpwwwensemblorgindexhtml15UCSC Genome Browser httpgenomeucscedu16ENCODE project httpswwwencodeprojectorg17BioMart httpbiomartorg18REST server of Ensembl httprestensemblorg
13
Basic Concepts and Bibliographic Review
to interpret the human genome sequence and apply it to understand human biology and improve
health [The04]
Besides their motivation an online repository is being build up indexing gathered data and
allowing users to query different data types regardless of location [Con11] Some samples can
be found at httpswwwencodeprojectorgexperimentsENCSR274JRR for ex-
ample
25 Tools for RNA-seq and Differential Analysis
To perform the RNA-Seq pipeline some tools for each process are required It is now presented
some set of them on the following sections
Bowtie
Bowtie 19 is a tool to align short reads to the human genome To achieve speed and memory-
efficiency Bowtie aligns reads with the aid of an index of the reference genome [Lan10] and can
take advantage of the use of simultaneous multiple processor cores [LTPS09] For the human
genome Burrows-Wheeler is a commonly used indexing process that this tool extends with a
novel quality-aware backtracking algorithm that permits mismatches
TopHat
TopHat 20 is used as a junction mapping tool for RNA-Seq reads Before TopHat current
mapping strategies could only localize reads to known exons in the genome This tool is a read-
mapping algorithm design to align reads to a reference genome without relying on know splice
sites [TPS09]
Cufflinks
Cufflinks 21 assembles transcripts estimates their abundances and tests for differential ex-
pression and regulation in RNA-Seq samples Internally it is made of four different parts Cuf-
flinks that assembles the package Cuffcompare that compares transcript assemblies to annotation
Cuffmerge that merges two or more transcript assemblies and Cuffdiff that takes the aligned reads
and reports genes and transcripts that are differentially expressed [TRG+12a]
HTSeq
19Bowtie httpbowtie-biosourceforgenetindexshtml20TopHat httpccbjhuedusoftwaretophatindexshtml21Cufflinks httpcole-trapnell-labgithubiocufflinks
14
Basic Concepts and Bibliographic Review
HTSeq 22 is a python framework to facilitate the rapid development of scripts to processing
and analysis of high-throughtput sequencing data
FASTQC
FASTQC 23 is a quality control tool for high-throughput sequencing data It receives as input
BAM SAM or FASTQ files provides a quick overview on which areas there may be problems
summarizes graphs and tables for a fast assess of data and exports results to an HTML based report
Samtools
Samtools 24 is a set of utilities to manipulate alignments in the BAM format (output format of
TopHat eg) It does sorting merging and indexing and allows to retrieve in any regions The
files can be either provided via standard input (stdin) of from a remote FTP or HTTP server
deFuse
deFuse 25 is a software for gene fusion discovery from RNA-Seq data It uses clusters of dis-
cordant paired alignments to inform a split read alignment analysis for finding fusion boundaries
As an output it produces a fully annotated output for each predicted fusion
26 Relational and Non-relational Databases
Relational Databases had been introduced in 1970 by Edgar Codd at IBM Almaden Research
Center [Cod70] It has been used for decades and has brought in the concept of relations With
this a relational database is usually represented by a structured model a table in which each row is
a tuple (also considered as an object) and the columns are the attributes of the tuple The database
can be queried in order to retrieve useful data based on their attributes whether in common between
tuples or not To do so it is used a structured query language SQL [LM10] The main set of
operations is known as CRUD Create Read Update and Delete Relational databases are also
know for their fixed schemas that force every tuple to have the exact same attributes
A very common operation in SQL databases are joins Joins are a way to associated data that
share attributes or are somehow related One example is imagining a table of people that have
bank accounts associated and there is another table where the existing banks are described A way
to relate them is to combine these two tables in order to directly view which individual is using
which bank This is a very simple example that can scale very quickly and become a dangerous
operation for the consumed resources to be used to compute the needed relationships
22HTSeq httpwww-huberembldeHTSeqdocoverviewhtml23FASTQC httpwwwbioinformaticsbabrahamacukprojectsfastqc24Samtools httpsamtoolssourceforgenet25deFuse httpsbitbucketorgdranewdefuse
15
Basic Concepts and Bibliographic Review
In contrast with the previous set a Non-relational database commonly doesnrsquot have a fixed
schema and avoid the previous complex operation Within this class of databases there are different
approaches to the used models such as key-value stores big table clones document databases and
graph databases Each of them is used accordingly to the data set complexity
MongoDB 26 is a non-relational database schemaless and is scalable in cluster performance
and data This way it provides a way to store large data sets with the freedom of using different
schemas according to data 27
27 Tecnologies
When developing a web service there are some basic resources and programming languages used
HTML 28 is a standard markup language for describing web documents CSS 29 is used for
defining how the HTML elements are to be displayed Bootstrap 30 is a free front-end frame-
work for faster and easier web development and contains HTML and CSS based design patterns
Javascript 31 serves as a method for programming the behavior of web pages jQuery 32 is a library
of Javascript that greatly specifies Javascriptrsquos usage
Even though commonly used PHP 33 is not the best suitable language for our thesis work
When compared to Python it lacks security and is not used on the Bioinformatics field On the
other hand Perl has been greatly used on this field but it is currently being replaced by Python 34
Furthermore this last one has libraries like BioPython 35 for internal processing of samples and
also has support to web through frameworks like Django 36 or BottlePy 37
Even though Django is trending it has no support for NoSQL relational databases yet Bot-
tlePy for instance is a lightweight web framework simple to use and provides the ability to use
MongoDB
Concerning the situation the combination of Python and BottlePy is the most suitable since it
has
bull Starting to replace Perl in bioinformatics processing
bull Support for NoSQL databases (either the framework and the programming language)
bull Lightweight usage
26MongoDB httpwwwmongodborg27MongoDB scalability httpwwwmongodbcommongodb-scale28HTML httpwwww3schoolscomhtml29CSS httpwwww3schoolscomcssdefaultasp30Bootstrap httpgetbootstrapcom31Javascript httpwwww3schoolscomjs32jQuery httpsjquerycom33PHP httpphpnet34Python httpswwwpythonorg35BioPython httpbiopythonorgwikiMain_Page36Django framework httpswwwdjangoprojectcom37BottlePy httpbottlepyorgdocsdevindexhtml
16
Basic Concepts and Bibliographic Review
Figure 26 Print screen of Galaxy when trying to get data from UCSC
For the purpose of sending the information between devices the FTP server solution was
analysed It allows the creation of an administrator user that has the permissions for writing and
reading but also for anonymous users that can only download data
28 Related Work
Galaxy
Galaxy 38 is an open source web-based platform for data intensive biomedical research
It consists of an embedded website system that provides access to different databases such
as Ensembl or UCSC Genome Browser Although functional the platform has not a consistent
interface which requires the user to learn to use many systems within it An example of this
situation can be viewed in Figure 26 Furthermore it does not provide the ability to choose easily
a stage pipeline like iRAP or to run a full one with personalized tools
BioMart Central Portal
BioMart 39 is a community-driven project to provide unified access to distributed research data
to facilitate the scientific discovery process
38Galaxy httpgalaxyprojectorg39BioMart Central Portal httpcentralbiomartorgsequencegui=Sequence_retrievalamp
mart=metaseq_mart_63_config
17
Basic Concepts and Bibliographic Review
It currently has a sequence retrieval tools that provides searching by database and dataset
Nowadays this tool offers Ensembl as the only available database but it adds up three other fea-
tures like a sequences filters and header information panels where the users can improve their
search
29 Chapter Summary
In this chapter we presented and discussed the technologies suitable for the thesis work We have
surveyed alternative technologies for gene expression computation and alternative splicing tools
The technologies are relevant to solve the Biological domain problem We have also surveyed
the tools for the development of websites and databases to store the data used when solving the
biological problems In the next chapter we describe work in detail
18
Chapter 3
The Gemini framework
Despite the very large number of tools available for Molecular Biology problems they are most
often difficult to use and require sophisticated computational resources As part of the thesis
work we have developed a framework that allows expert users to make RNA-Seq and alternative
splicing analysis using a user friendly web interface and sophisticated computational resources
In this chapter we describe that framework that include the website database resources for storing
data and the computational settings for the analysis
iRAP has been chosen to accomplish the automation of RNA sequencing analysis due to the
simplicity of use and its wide number of tools available for its task Since it is an integrated
tool platform its installation requires not only powerful computer resources but also a long list of
basic equipment necessary to each of them Considering these issues it had not always been easy
to setup the wanted work environment
Despite the difficulties of this scenario we have been able to complete the setup of this tool
and make some control experiments with it
In order to accomplish an iRAP execution a configuration file must be provided (see Ap-
pendix B) Along with the experiment name the name of species being analysed the reference
genome and read data files need to be specified and made available Furthermore the specific
tools for each stage of the pipeline need also to be specified among other possible variables
It is not easy and usually very time consuming for a Biologist to create the configuration file or
to run the command-line interface that controls iRAP pipeline Since this system is a combination
of many different tools there are a long list of available options that may be fulfilled Some of
them are mandatory while other ones are optional After this setting is completed it must be saved
in a text file and made available to run iRAP
Even though the usage of iRAP does not require extensive bioinformatics expertise it does
assume familiarity with UNIX command-line interface which would narrow down the target audi-
ence In order to overcome this situation we designed and developed a framework called Gemini
19
The Gemini framework
that includes a Graphical User Interface and makes RNA-Seq studies much more easy to perform
We have also included extra features for doing more analysis to RNA-Seq data
31 Gemini
Due to the lack of intuitiveness on the process of generating the configuration file it has been
created a more user friendly one through a web form This form asks for input of the main settings
to call a very simple experiment with a commonly used bacteria escherichia ecoli (e coli)
Another important feature is the possibility to fill the form asking what is the stage that the user
wants the pipeline to start with
Another issue was to find and easily download a reference genome for a certain species In
order to add completeness to Gemini and also to simplify the process of download it has been
implemented the functionality to download the reference genome (both fasta and annotation files)
It is used the Ensembl API to obtain the required results The jobs status feature lists the status of
jobs sent by the user for execution
Besides these features one more have been added even though not completed It is the job
results where it is presented the results collected for a determined task
32 Gemini Architecture
321 Physical Architecture
Gemini is divided into two different sets The first one is where the web application is hosted as
well as the database Since dealing with genomic data often requires great computer performance
processing experiments is accomplished in an independent server that later responds with results
Figure 31 Physical architecture of Gemini
Data scheme
MongoDB is NoSQL document based database The information is organized in collections
in which each element is stored as a JSON document NoSQL databases are simpler to use when it
20
The Gemini framework
comes to have different information fields in the same document and at the same time they have
better performance and scalability [SK11] Currently the information is arranjed in two collections
scheme as described on Table 31
Name DescriptionAccounts Stores the users dataJobs Stores the experiments dataTable 31 Collections used to store data
Accounts
An accountrsquos document stores an userrsquos email password and a unique identifier A role has
also been saved for future hierarchy creation in which some levels will grant more permissions
than others like changing accounts settings of other participants
1
2 _id ObjectId(54f5a9b234f76511a82ec3b2)
3 password e10adc3949ba59abbe56e057f20f883e
4 role user
5 email acgggomesgmailcom
6
Jobs
Jobs are related to an user and have the name and description of the experiment It also
stores the reference genomersquos location as well as the readsrsquo one Likewise the date of creation is
preserved When a job is completed the status is modified to finished
1
2 _id ObjectId(5544ecf134f7651d687bba94)
3 name ExpFinal
4 exp_dir data54f5a9b234f76511a82ec3b2ExpFinalreads
5 user 54f5a9b234f76511a82ec3b2
6 description Final test
7 genome_dir genomesEscherichia coli
8 status started
9 date ISODate(2015-05-02T152745249Z)
10
21
The Gemini framework
33 Data Management
In order to create a new job it is required two sets of data namely reference files and raw data
files The raw data is the actual data being analysed while the reference genome serves as basis to
the alignment or control
The typical workflow consists on the expert providing the experience and species names as
well as the raw data that was previously collected in the laboratory Afterwards through a step by
step system the user has the option to choose the reference genome to be used on the experiment
This last files are internally obtained from different FTP servers such as Ensembl and ENCODE
stored locally and reused in further usages
The provided information is then saved in the database and the files stored hierarchically We
use the following sequence of ltsection namegt ltuseridgt ltexperience namegt ltdata filesgt The
ltsection namegt can be conf for storing configuration files data for saving the reads or refer-
ence for keeping the reference genome and annotation files The ltuseridgt is the ID of Accounts
database document and the ltexperience namegt is the same as name in Jobs database document
A directory tree is represented in Figure 32
Figure 32 File system tree demonstrating the hierarchy of saved data files
This information is then passed to the server via a local FTP server that has been created
22
The Gemini framework
for this purpose We have followed an online tutorial 1 for the configuration From this we
created one administrator that has permissions for writing and reading files and we also authorized
anonymous login that may only retrieve files This way on the web application the admin user
creates the reads reference genomes annotation and configuration files On the computational
server an anonymous user authenticates for retrieving the files according to the filenames received
via API
The inside directory of FTP follows the hierarchy of ltuseridgt ltexperience namegt ltdata
filesgt where ltuseridgt is the ID on the Accounts document and ltexperience namegt is the name
on Jobs document When the server is prompted to run an experience it downloads the required
data from the FTP and runs iRAP with the necessary configuration options
34 Web Interface
For the implementation of Gemini python has been used for backend along with a simple fast and
lightweight WSGI micro web-framework called BottlePy 2 It has no dependencies and grants the
main functionalities such as routing templates some class utilities and a built-in server
The first screenshot (Figure 33) shows the home page of Gemini There is top menu bar with
two possible interactions login and register There is also a simple content box that describes the
main features and status of development of the platform Later on a new menu appears with the
possibility to logout on the Welcome tab (as in Figure 34)
Figure 33 Home page
Figure 34 Logout menu
1Tutorial available at httpswwwthomas-krenncomenwikiSetup_FTP_Server_under_Debian
2BottlePy httpbottlepyorgdocsdevindexhtml
23
The Gemini framework
The main feature of the system is the create job (Figure 35) option that is easily accessible on
top menu When the user clicks on it a form is displayed with the variables to introduce on the
configuration file that iRAP needs A description option has been added to provide the freedom to
the researcher to include some extra information that he finds useful
Figure 35 Create job form
The same type of form was used for the reference genomes section (Figure 36) The user is
prompted to choose orderly the species name release number and version Afterwards a table of
elements appears allowing the expert to download the files found
Figure 36 Reference genomes component
24
The Gemini framework
35 Use cases
Gemini was designed to have only one actor the user that will accomplish the experiments This
actor has the possibility to register login and logout of his account create a job and the hability
to download a reference genome of his choice Even though not fully implemented it has been
considered the jobs done functionality
Figure 37 Use cases diagram
36 Case studies
Some case studies with e coli in order to test iRAPrsquos installation and its capabilities For both
of the case studies it has been collected six samples of Escherichia coli reads from European
Nucleotide Archive 3 and the corresponding reference genome and annotation file from Ensembl
361 Full pipeline
In order to call the full pipeline iRAP has been tested with the directive irap conf=ecoli_exconf
Configuration file (ecoli_exconf ) content is as described in Appendix C In this task the system
received the reads and performed the quality control (QC) mapping quantification and differential
expression between the two groups of samples
3ENA httpwwwebiacukena
25
The Gemini framework
This test has been accomplished successfully
362 Stage pipeline
The stage pipeline is a powerful functionality since it allows the user to choose a specific stage of
the pipeline that he wants to execute for his samples
Besides the fact that it is not easy to collect data samples users often want to repeat or analyse
just one step of the pipeline and take some conclusions of it Furthermore this type of pipeline is
less time consuming
A concrete usage example is IPATIMUPrsquos data which contains the output information of the
mapper TopHat and will be further analysed in detail in Chapter 4 Concerning this setup it would
not be possible to call the full pipeline but instead it would require a command specific command
option
For validation purposes the same bacteria from the previous analysis has been used for the
stage pipeline case After calling the setup command to check input the directive irap conf=
ecoli_exconf quality_filtering_and_reporting has been used to perform the stage1
of iRAP The platform was able to perform with success this task
37 Chapter Summary
It has been used Python with BottlePy for the main implementation of the interface of Gemini
MongoDB has been chosen for dealing with information A FTP server was mounted for the
transitions of data between the client and the server The platform allows the expert to call a full or
stage pipeline analysis and provides the download of both fast and annotation files The essential
items are setup for the addition of further functionalities
26
Chapter 4
Case study
In this chapter it is going to be presented the Case Study with data from samples of thyroid carci-
noma along with their charactering and researching results
After the development of an interface to the iRAP tool the following step was to do a case
study with some realistic DNA samples of thyroid cancer patients regarding the partnership with
IPATIMUPrsquos researchers
The purpose of this case study was to do some research of potential differences between dis-
tinct types of the disease In order to accomplish this four samples were collected from Centro
Hospitalar de Satildeo Joatildeo (Porto) Cases 1 and 2 have been categorized as a widely invasive Fol-
licular Thyroid Carcinoma (wFTC) and cases 3 and 4 as a minimally invasive Follicular Thyroid
Carcinoma (mFTC)
41 Samples characterization
Patient from case 1 was female with 82 years old the tumour measuring 2 cm of size and presented
a predominant follicular growth pattern and oncocytic features Patient from case 2 was male with
55 years old the tumour measuring 5 cm of size and presented a predominant solidtrabecular
growth pattern For the group of mFTC patient from case 3 was female 56 years old the tumour
measuring 37 cm of size and with follicular growth pattern patient from case 4 was female 56
years old the tumour measuring 4 cm of size and with follicular growth pattern
42 Researching objectives
The aim of the study was to answer the following questions
bull Differentially expressed genes
bull Total isoforms found either in percentange and in absolute
27
Case study
bull Average of alternative isoforms for each gene spliced
bull Potentially novel isoforms and how do they behave between samplesgroups of samples
bull Compare results between versions of human genome assembly
bull Retrieve fusion genes
43 Protocol of analysis
Collected sample reads have been aligned against reference genome GRCh37 with TopHat version
141 Posterior analysis followed Tuxedo Protocol as described in Trapnell et al [TRG+12b] An
overview of the full protocol can be found in Figure 41
For the implementation of this procedure it were considered as two different groups the cases
1 and 2 (wFTC) against cases 3 and 4 (mFTC) The following step was to assemble transcripts for
each sample with Cufflinks 1 and afterwards create a single merged transcriptome annotation with
Cuffmerge 2 Cuffdiff 3 was then used to find significant changes in transcript expression
In order to find potential isoforms each sample was ran against the reference genome with
Cuffcompare 4
44 Genome version GRCh37 versus GRCh38
Even though IPATIMUPrsquos data have been assembled with reference genome version GRCh37
nowadays a more recent version (GRCh38) has been released in 2013 This new assembly is the
first major revision of the human genome in more than four years 5
The main differences between this two versions are
Alternate sequences several human chromosomal regions have sufficient variability to prevent
adequate representation by a single sequence This new version provides alternate sequence
for selected variant regions through the inclusion of alternate loci 6 scaffolds
Centromere 7 representation Previous method of representing centromeric regions have been
replaced by sequences from centromere models The models provide the approximate repeat
number and order for each centromere and are useful for read mapping and variation studies
Mitochondrial genome The new mitochondrial reference sequence is the Revised Cambridge
Reference Sequence with RefSeq accession number NC_0129201 The previous one was
RefSeq accession number NC_001907 which was not updated when GRCh37 assembly
later transitioned to the new version1Cufflinks httpcole-trapnell-labgithubiocufflinks2Cuffmerge httpcole-trapnell-labgithubiocufflinkscuffmergeindexhtml3Cuffdiff httpcole-trapnell-labgithubiocufflinkscuffdiffindexhtml4Cuffcompare httpcole-trapnell-labgithubiocufflinkscuffcompareindexhtml5As in UCSC mailing list at httpsgroupsgooglecomasoeucsceduforumtopic
genome-announce52Kv41YBXNY6Specific location of a gene on a chromosome
28
Case study
Figure 41 An overview of the Tuxedo Protocol with full steps TopHat for alignment Cufflinkspackage to find differential features between group samples and in the end CummeRbund to plotprevious results
Sequence updates Several erroneous bases and misassembled regions have been corrected and
more than 100 gaps have been filled or reduced
Analysis set The new assembly offers an analysis set that was created to accommodate next
generation sequencing read alignment pipelines Several GRCh38 regions have been elimi-
nated from this set to improve read mapping
29
Case study
45 Fusion genes
After we done some research on the technologies used for finding fusion genes in the reads we
have not been able to perform the analysis to answer the last question of our researching objectives
DeFuse required as input the original reads which were not provided This analysis would have
been interesting for relating the ocurrence of thyroid and the presence of fusion genes as well as if
there was any relevant difference between the samples of wFTC and mFTC
46 Results
461 Case study with reference genome GRCh37
The following table ( 41) demonstrates some genes that were differentially expressed with signif-
icance between mFTC and wFTC According to Celestino et al 8 CRABP1 C1QL1 and LCN2
are biomarkers of thyroid cancer and predictors of extrathyroidal extension It is commonly used
the value of 005 has threshold above which the differential expression is significant By inspect-
ing out the table we can find C1QL1 with a q-value of 0000555 and CRABP1 with a q-value
of 159E-11 which are in concordance with the previous article Furthermore it is verified the
increased gene expression in wFTC when compared to mFTC
Gene ID Gene Chr mFTC wFTC Fold change(log2) Q value
ENSG00000167748 KLK1 19 018672 111924 922742 0ENSG00000104725 NEFL 8 00196645 276961 104599 0ENSG00000174145 KIAA1239 4 00307388 144265 887444 0ENSG00000182379 NXPH4 12 008307 195786 788074 0ENSG00000131094 C1QL1 17 0121453 238957 429828 0000555ENSG00000142677 IL22RAI 1 150905 0384783 -529345 0ENSG00000138615 CILP 15 423569 0052726 -632793 241E-11ENSG00000141431 ASXL3 18 18938 001408 -707148 124E-09ENSG00000166426 CRABP1 15 748375 0367899 -766831 159E-11ENSG00000214145 LINC00887 3 19797 0119327 -737421 0000459
Table 41 Genes differentially expressed between minimally invasive follicular thryoid carcino-mas (mFTCs) and widely invasive follicular thyroid carcinomas (wFTCs)
In response to the previous researching objectives the Table 42 has the statistical results for
taks two and three From the data analysis we could conclude that less than 1 of genes have
isoforms but each one has an average of 389 alternatives
8Ricardo Celestino Torfin Nome Ana Pestana Andreas M Hoff Pedro A Gonccedilalves Catarina Eloy Eva SigstadRagnhild A Lothe Trine Bjoslashro Manuel Sobrinho-Simotildees Rofl I Skotheim Paula Soares CRAPBP1 C1QL1 andLCN2 are biomarkers of thyroid cancer and predictors of extrathyroidal extension subbmited for publication
30
Case study
Total genes 63896Total significant isoforms 689Total unique genes with isoforms 179Ratio of unique genes with isoformsgenes () 028Average of alternatives per gene with isoforms 389
Table 42 Statistical results for researching objectives number 2 and 3
462 Splicing analysis
Forward in the analysis Cuffcompare 9 has been used to search for novel isoforms when com-
pared to the reference genome The method was to compare each sample to the reference genome
and afterwards make an overlap of the results The main objective was then to infer about the
differences among wFTC and mFTC
Sample 1(wFTC)
Sample 2(wFTC)
Sample 3(mFTC)
Sample 4(mFTC)
Total genes 30440 36862 35539 37534Potential novel isoforms 7406 8450 8781 8830Table 43 Potential novel isoforms for each sample of IPATIMUPrsquos data
As demonstrated on Table 43 average there is a percentage of 24 of potentially novel iso-
forms found (at least one spliced junction is shared with a reference transcript) There is been
made an overlap of the results in order to encounter differences between wFTC and mFTC The
Table 44 presents the counting of differences between cases A brief analysis allows us to say
that we can not make any relationship between wFTC and mFTC On average there was a total of
3722 changes among this two sets The average within the sets are 3554 for wFTC and 3992 for
mFTC Given this results there was not a significant divergence to allow us to relate the splicing
and the occurrence of a more invasive Thyroid Carcinoma
Sets ChangesS1 S2 3554S1 S3 3609S1 S4 3612S2 S3 3847S2 S4 3820S3 S4 3929
Table 44 Number of differences between samples Syntax used S1 - Sample 1 S2 - Sample 2S3 - Sample 3 and S4 - Sample 4
9Cuffcompare httpcole-trapnell-labgithubiocufflinkscuffcompareindexhtml
31
Case study
463 Case study with reference genome GRCh38
In order to respond to the last research objective it has been applied the method of analysis has
before with a more recent human genome assembly After using the same protocol with Cufflinks
Cuffmerge and Cuffdiff sequentially we have come to some conclusions
The produced results of differential expression analysis for the same genes were very different
Genes that were highly significant before like C1QL1 and CRABP1 now had no relevance (q-
value gt 005) As mentioned before we had only access to TopHatrsquos output that used version
GRCh37 for the alignment and mapping process so we could not start from scratch the analysis
This outcome demonstrates two topics in particular
1 the introduction of novel annotations can make previous analysis outdated
2 there is the need to save the original reads in order to update earlier studies
The solution to this situation would have been to use the original reads to repeat the assembly
and then follow the Tuxedo protocol to collected correct and updated differential expression data
47 Chapter Summary
These section of development has been introduced in order to confer not only validation but also
to do some researching studies on the subject Four samples were collected and divided into two
distinct groups Tuxedo protocol was followed for responding to the research objectives The
case study for GRCh37 demonstrated the expression of C1QL1 and CRABP1 on wFTC when
compared to mFTC as indicated in the referred article On the other hand the same protocol when
applied with GRCh38 demonstrated the importance of saving the original reads and what is the
influence of newer releases in previous researching results Lastly the splicing analysis results did
not show any evidence of related isoforms count and the manifestation of the different stages of
the disease
32
Chapter 5
Conclusions and Future Work
The research of genomic-based cancers require highly complex data analysis Such analysis re-
quire most often the use of a large number of complex computational resources the gathering
of a lot of information over the Internet and the use of powerful computational resources Fur-
thermore the manipulation of the computational tools and resources require the assistance of an
informatics expert
The thesis work is a contribution towards the solution of the above mention problem We
propose and developed a framework that enables an expert biologist to perform genomic-based
complex analysis in a easy way and using the required powerful computational resources in a
transparent way
Using the developed framework we have used real data to address several research questions
provided by IPATIMUPrsquos researchers Firstly with the human genome GRCh37 we identified
two of the biomarkers of thyroid cancer by differential gene expression analysis Secondly we
found 689 significant isoforms 179 unique out of 63896 genes (ratio of 028) with an average
of 389 isoforms per gene Thirdly when trying to determine potential novel isoforms we came
at no conclusion of the differences of expression when comparing wFTC and mFTC The last
case was applying the Tuxedo protocol with the new GRCh38 on samples The outcome of the
experiment revealed the importance of saving the original reads and that newer releases become
previous analysis outdated
Future Work
This thesis work is just a starting point As stated before the framework was designed so it can be
extended with further modules to enable addressing other research questions
The case studies also showed us that RNA-seq analysis is very time consuming On the other
hand there are a lot of sub-tasks that can be run in parallel (like the task of aligning the reads)
33
Conclusions and Future Work
We will study and compare different techniques and opportunities to make RNA-seq in parallel as
much as possible
34
References
[bNE] Scitable by Nature Education Transcriptome available at httpwwwnaturecomscitabledefinitiontranscriptome-296 last accessJanuary 2015
[CAB+15] Fiona Cunningham M Ridwan Amode Daniel Barrell Kathryn Beal Konstanti-nos Billis Simon Brent Denise Carvalho-Silva Peter Clapham Guy CoatesStephen Fitzgerald Laurent Gil Carlos Garciacutea Giroacuten Leo Gordon ThibautHourlier Sarah E Hunt Sophie H Janacek Nathan Johnson Thomas Juette-mann Andreas K Kaumlhaumlri Stephen Keenan Fergal J Martin Thomas MaurelWilliam McLaren Daniel N Murphy Rishi Nag Bert Overduin Anne ParkerMateus Patricio Emily Perry Miguel Pignatelli Harpreet Singh Riat DanielSheppard Kieron Taylor Anja Thormann Alessandro Vullo Steven P WilderAmonida Zadissa Bronwen L Aken Ewan Birney Jennifer Harrow Rhoda Kin-sella Matthieu Muffato Magali Ruffier Stephen MJ Searle Giulietta SpudichStephen J Trevanion Andy Yates Daniel R Zerbino and Paul Flicek Ensembl2015 Nucleic Acids Research 43(D1)D662ndashD669 2015
[CFG+10] Peter J A Cock Christopher J Fields Naohisa Goto Michael L Heuer and Peter MRice The Sanger FASTQ file format for sequences with quality scores and theSolexaIllumina FASTQ variants Nucleic acids research 38(6)1767ndash71 April2010
[CH07] Geoffrey M Cooper and Robert E Hausman The Cell - A molecular approachAmerican Society for Microbiology 2007
[Cod70] E F Codd A relational model of data for large shared data banks Communica-tions of the ACM 13(6)377ndash387 June 1970
[Con11] The ENCODE Project Consortium A userrsquos guide to the encyclopedia of DNAelements (ENCODE) PLoS biology 9(4)e1001046 April 2011
[FMB14] N A Fonseca J A Marioni and A Brazma RNA-seq gene profiling - a system-atic empirical comparison Technical report May 2014
[FPMB14] Nuno A Fonseca Robert Petryszak John Marioni and Alvis Brazma irap - anintegrated rna-seq analysis pipeline bioRxiv 2014
[GCW+10] Qiang Gan Iouri Chepelev Gang Wei Lama Tarayrah Kairong Cui Keji Zhaoand Xin Chen Dynamic regulation of alternative splicing and chromatin structurein Drosophila gonads revealed by RNA-seq Cell research 20(7)763ndash83 July2010
35
REFERENCES
[GEN] GENIE Dna genes and chromossomes University of Leicesteravailable at httpwww2leacukdepartmentsgeneticsvgecschoolscollegestopicsdna-genes-chromosomes last access Jan-uary 2015
[Gri] Malachi Griffith Bioinformatics for Cancer Genomics (BiCG)available at httpbioinformaticscaworkshops2012bioinformatics-cancer-genomics-bicg last access January 2015
[GTBK11] Angela Goncalves Andrew Tikhonov Alvis Brazma and Misha Kapushesky Apipeline for RNA-seq data processing and quality assessment Bioinformatics (Ox-ford England) 27(6)867ndash9 March 2011
[HBB+02] T Hubbard D Barker E Birney G Cameron Y Chen L Clark T CoxJ Cuff V Curwen T Down R Durbin E Eyras J Gilbert M HammondL Huminiecki A Kasprzyk H Lehvaslaiho P Lijnzaad C Melsopp E Mon-gin R Pettett M Pocock S Potter A Rust E Schmidt S Searle G SlaterJ Smith W Spooner A Stabenau J Stalker E Stupka A Ureta-Vidal I Vastrikand M Clamp The ensembl genome database project Nucleic Acids Research30(1)38ndash41 2002
[HBD+13] R Hitzemann D Bottomly P Darakjian N Walter O Iancu R SearlesB Wilmot and S McWeeney Genes behavior and next-generation RNA se-quencing Genes Brain Behav 12(1)1ndash12 Feb 2013
[Ins] National Human Genome Research Institute Transcriptome available at httpwwwgenomegov13014330 last access January 2015
[Joh03] Jason M Johnson Genome-wide survey of human alternative pre-mrna splicingwith exon junction microarrays Science 3022141ndash2144 December 2003
[kn10] Gene set enrichment a problem of pathways Briefings in functional genomics9(5-6)385ndash90 December 2010
[kn11] Overview of available methods for diverse RNA-Seq data analyses Science ChinaLife sciences 54(12)1121ndash8 December 2011
[Lan10] Ben Langmead Aligning short sequencing reads with Bowtie Current proto-cols in bioinformatics editoral board Andreas D Baxevanis [et al] Chapter11Unit 117 December 2010
[LM10] Adam Lith and Jakob Mattsson Investigating storage solutions for large data - acomparison of well performing and scalable data storage solutions for real timeextraction and batch insertion of data Masterrsquos thesis 2010
[LTPS09] Ben Langmead Cole Trapnell Mihai Pop and Steven L Salzberg Ultrafastand memory-efficient alignment of short DNA sequences to the human genomeGenome biology 10(3)R25 January 2009
[ORY10] Alicia Oshlack Mark D Robinson and Matthew D Young From RNA-seq readsto differential expression results Genome biology 11(12)220 January 2010
[SG15] Marc W Schmid and Ueli Grossniklaus Rcount simple and flexible RNA-Seqread counting Bioinformatics 31(3)436ndash437 February 2015
36
REFERENCES
[SK11] Christof Strauch and Walter Kriha NoSQL databases Lecture Notes StuttgartMedia University February 2011
[SOdMVN12] Mikhail Shugay Intildeigo Ortiz de Mendiacutebil Joseacute L Vizmanos and Francisco JNovo Genomic hallmarks of genes involved in chromosomal translocations inhematological cancer PLoS Comput Biol 8(12)e1002797 12 2012
[The04] The ENCODE Project Consortium The ENCODE (ENCyclopedia Of DNA Ele-ments) Project Science (New York NY) 306(5696)636ndash40 October 2004
[TPS09] Cole Trapnell Lior Pachter and Steven L Salzberg TopHat discovering splicejunctions with RNA-Seq Bioinformatics (Oxford England) 25(9)1105ndash11 May2009
[TRG+12a] Cole Trapnell Adam Roberts Loyal Goff Geo Pertea Daehwan Kim David RKelley Harold Pimentel Steven L Salzberg John L Rinn and Lior Pachter Dif-ferential gene and transcript expression analysis of RNA-seq experiments withTopHat and Cufflinks Nature protocols 7(3)562ndash78 March 2012
[TRG+12b] Cole Trapnell Adam Roberts Loyal Goff Geo Pertea Daehwan Kim David RKelley Harold Pimentel Steven L Salzberg John L Rinn and Lior Pachter Dif-ferential gene and transcript expression analysis of RNA-seq experiments withTopHat and Cufflinks Nature protocols 7(3)562ndash78 March 2012
[WMM+11] Ying Wang Gaurang Mehta Rajiv Mayani Jingxi Lu Tade Souaiaia YanghoChen Andrew Clark Hee Jae Yoon Lin Wan Oleg V Evgrafov James AKnowles Ewa Deelman and Ting Chen RseqFlow workflows for RNA-Seq dataanalysis Bioinformatics (Oxford England) 27(18)2598ndash600 September 2011
[Wol13] Jochen B W Wolf Principles of transcriptome analysis and gene expressionquantification an rna-seq tutorial Molecular Ecology Resources 13(4)559ndash5722013
[ZW09] Mark Gerstein |amp Michael Snyder Zhong Wang Rna-seq a revolutionary tool fortranscriptomics Nature Reviews Genetics 1057ndash63 January 2009
37
REFERENCES
38
Appendix A
iRAP tools supported
A1 Mappers
Mapper Option name (mapper)TopHat 1 tophat1TopHat 2 tophat2SMALT smaltGSNAP gsnapSOAPsplice soapspliceBWA bwa1BWA bwa2Bowtie 1 bowtie1Bowtie2 bowtie2GEM gemSTAR starOSA osaMapSplice mapsplice
A2 Quantification
Quantifier Option name (quant_method)FluxCapacitor flux_capHT-Seq (union mode) htseq1HT-Seq (intersection non-empty mode) htseq2Cufflinks 1 (try to find novel transcripts-g) cufflinks1Cufflinks 2 (try to find novel transcripts-g) cufflinks2Cufflinks 1 (do not assemble novel transcripts-G) cufflinks1_ndCufflinks 2 (do not assemble novel transcripts-G) cufflinks2_ndNURD nurd
39
iRAP tools supported
A3 Differential expression [DE]
Method Option name (de_method)DESeq deseqDESeq2 deseq2EdgeR edgerCuffdiff 1 cuffdiff1Cuffdiff 2 cuffdiff2
A4 Gene set enrichment analysis [GSE]
Tool Option name (gse_tool)Piano piano
40
Appendix B
iRAP model of configuration file
1 This is a comment (lines that start with a are ignored by iRAP)
2 =============================================================================
3 name that you want to give to the experiment (no spaces)
4 All files produced by irap will be placed in a folder with the given name
5 name=myexp
6
7
8 =============================================================================
9 name of the species
10 species=homo_sapiens
11
12 =============================================================================
13 Fasta file with the reference genome
14 reference=Homo_sapiensGRCh3766dnafa
15
16 =============================================================================
17 GTF file with the annotations
18 gtf_file=Homo_sapiensGRCh3766gtf
19
20 =============================================================================
21 IRAP options (may be providedoverriden in the command line)
22
23
24 Mapper
25 mapper=
26
27
28 Quantification method
29 quant_method=
30
31
32 Dif expression method
33 Requires contrasts to be defined (see below)
41
iRAP model of configuration file
34 de_method=
35
36
37 Gene set enrichment (GSE) analysis
38 Requires de_method to be defined
39 Tool to use (none|piano)
40 gse_tool=piano
41
42 gse_method (mean|median|sum|fisher|fisher-exact|stouffer|tailStrength|wilcoxon|
reporter|page) see Piano vignete documentation for more details
43 gse_method=fisher
44 gse_pvalue=005
45 Minimum number of genes in a gene set
46 gse_minsize=3
47
48
49
50 TSV file with gene annotation
51 Format IDNamelocussourcelnameGOGOtermKEGG
52 Description
53 ID=gene_id (this is mandatory and should match the one given in the gtf file)
54 Name=gene name
55 locus=chrstart--end
56 source=biotype
57 lname=gene name
58 GO=go ids (multiple values can be separated by)
59 GO=GO terms (multiple values can be separated by)
60 KEGG=Kegg ids (multiple values can be separated by)
61 If auto is defined then iRAP will try to generate the file
62 - this may take a considerable amount of time and will only work
63 for a reduced number of species
64 off - default value
65 annot_tsv=
66
67
68 QC
69 Check data (reads) quality (on|off|none)
70 on - reads are filtered out based on their quality
71 off - the quality of the reads is assessed but no filtering is done
72 none- no quality control is performed
73 qual_filtering=on
74
75 Trim all reads to the minimum read size after quality trimming - Yes (y)| No (n)
76 only applicable if qual_filtering is on
77 trim_reads=y
78
79 Minimum base quality accepted (def 10)
80 min_read_quality=10
81
42
iRAP model of configuration file
82 Contamination check (cont_index parameter) Reads that likely
83 originate from organisms other than the one under study can be
84 discarded during pre-processment of the reads This is done by
85 aligning the reads to the genomes of organisms that might be a
86 source of contamination and discard those that map with a high
87 degree of fidelity By default iRAP will check if the data is
88 contaminated by e-coli An example to create a contamination
89 database is provided in the examplesex_add2contaminationDBsh
90 script The value of the parameter should be the file name prefix of
91 the bowtie index files
92
93 Disable contamination check
94 cont_index=no
95 Default value
96 cont_index=$(data_dir)contaminatione_coli
97
98
99 Misc options
100
101 Number of threads that may be used by IRAP
102 max_threads=1
103
104 Exon level quantification Yes (y)| No (n)
105 exon_quant=y
106
107 Transcript level quantification Yes (y)| No (n)
108 transcript_quant=y
109 =============================================================================
110 full or relative path to the directory where all the data can be found
111 data_dir=data
112
113 the directory should be organized as follows (see directory data in IRAP toplevel
directory)
114
115 $data_dir
116 $data_dir
117 contamination
118 e_coli1ebwt
119 e_coli2ebwt
120 e_coli3ebwt
121 e_coli4ebwt
122 e_coliREADME
123 e_colirev1ebwt
124 e_colirev2eb
125 raw_data
126 $species
127 fastq
128 fastq
129
43
iRAP model of configuration file
130 reference
131 $species
132 $gtf_file
133 $reference
134
135 Notes
136 1) $ denotes the value defined for the variable
137 2) Since version 050 the raw data (fastqbam) files may be
138 distributed across several sub-folders
139
140
141 =============================================================================
142 Only necessary if you intend to perform Differential Expression analysis
143
144 contrasts=contrast_def [contrast_def ]
145 contrasts=purpleVsPink purpleVsGrey
146
147 definition of each constrast
148 contrast= group group [ group ]
149 purlpleVsPink=Purple Pink
150 purlpleVsGrey=Purple Grey
151
152 groups
153 GroupName= Library_name [Library_name ]
154 Purlple=myLib1 myLib2
155 Pink=myLib3
156 Grey=myLib4
157
158 optional parameter used in the report (HTML) generation
159 groups=Purple Pink Grey
160
161 technical replicates
162 technicalreplicates=myLib1myLib2myLib3mylib4
163
164 Note names of groups contrasts and libraries should start with a letter and
contain only alphanumeric characters and the character _
165
166 =============================================================================
167 Data
168
169
170 Information for each library
171 LibName=Fastq file
172 Note
173 1 LibName should start with a letter and contain only alphanumeric characters
and the character _ LibName should not contain in _1 or _2
174 2 LibName should be different from the name of the fastq file for instance
175 f1=f1fastq
176 will produce an error
44
iRAP model of configuration file
177
178 Single-end
179 myLib1=f1fastq
180 read size
181 myLib1_rs=75
182 quality encoding (33 or 64)
183 myLib1_qual=33
184
185 strand specific protocol
186 mylib1_strand=first
187 mylib1_strand=second
188 Default value is both (strands)
189 mylib1_strand=both
190
191 Have the file in a different sub-folder
192 mylib1_dir=somesubfolder
193
194 See SAMBAM specification for more details about the following two parameters
195 read group id (to be included in the BAM file) - this is not supported by all
mappers
196 myLib1_rgid=
197 sambam header lines to include in the BAM file
198 myLib1_shl=COtThis is a commentnCOtand another line
199
200 LibName=Fastq file
201 myLib2=f2fastq
202 read size
203 myLib2_rs=75
204 quality encoding (33 or 64)
205 myLib2_qual=33
206
207
208 Paired-end
209 LibName=Fastq files
210 myLib3=f3_1fastq f3_2fastq
211 read size
212 myLib3_rs=50
213 quality encoding (33 or 64)
214 myLib3_qual=33
215 insert size
216 myLib3_ins=350
217 standard deviation
218 myLib3_sd=60
219
220 LibName=Fastq files
221 myLib4=f4_1fastq f4_2fastq
222 read size
223 myLib4_rs=50
224 quality encoding (33 or 64)
45
iRAP model of configuration file
225 myLib4_qual=33
226 insert size
227 myLib4_ins=350
228 standard deviation
229 myLib4_sd=60
230
231
232
233
234 list the names of your single-end (se) and paired (pe) libraries
235 se=myLib1 myLib2
236 pe=myLib3 myLib4
237 No SE data
238 se=
239 No PE data
240 pe=
241
242
243
244 Passingoverriding parameters
245
246 It is possible to pass parameters to the mappers and quantification
247 methods but that should be done carefully since it may break the
248 pipeline (if the location of the input andor output files is
249 changed)
250
251 Overridingchanging the mappersrsquo parameters
252 _map_options=options
253 Example
254 tophat2_map_options=--min-intron-length 5 --no-coverage-search
255
256 Overridingchanging the parameters of the quantification methods
257 _params=options
258 Example
259 htseq_params= -q
46
Appendix C
iRAP example configuration file
1 minimal configuration file for DE
2 experiment name
3 name=ecoli_ex
4 species
5 species=ecoli_k12
6 reference genome
7 reference=Escherichia_coli_str_k_12_substr_mg1655GCA_000005845119dnatoplevel
fagz
8 gtf file
9 gtf_file=Escherichia_coli_str_k_12_substr_mg1655GCA_000005845119gtfgz
10 Enable filtering based on quality
11 qual_filtering=on
12 Use a contamination data set to filter out reads
13 cont_index=no
14 Toplevel directory with the data
15 data_dir=
16
17 some contrasts
18 GA=Group A
19 contrasts=GAvsGB GBvsGA
20 GAvsGB=GA GB
21 GBvsGA=GB GA
22 GA=FA FB FC
23 GB=FD FE FF
24
25 se=FA FB FC FD FE FF
26
27 FA=SRR933983fastqgz
28 FA_rs=50
29 FA_qual=33
30
31 FB=SRR933984fastqgz
32 FB_rs=50
47
iRAP example configuration file
33 FB_qual=33
34
35 FC=SRR933985fastqgz
36 FC_rs=50
37 FC_qual=33
38
39 FD=SRR933989fastqgz
40 FD_rs=50
41 FD_qual=33
42
43 FE=SRR933990fastqgz
44 FE_rs=50
45 FE_qual=33
46
47 FF=SRR933990fastqgz
48 FF_rs=50
49 FF_qual=33
50 EOF
48
- Front Page
- Table of Contents
- List of Figures
- List of Tables
- 1 Introduction
-
- 11 Context
- 12 Motivation and Goals
- 13 Proposed Solution
- 14 Structure of the Dissertation
-
- 2 Basic Concepts and Bibliographic Review
-
- 21 Biological Basic Concepts
-
- 211 Genome
- 212 Transcriptome Assembly and Gene expression
-
- 22 RNA-Seq Analysis
-
- 221 RNA-Seq microarrays and DNA sequencing
- 222 RNA-Seq Pipeline
-
- 23 Standard File Formats used
-
- 231 FASTA
- 232 FASTQ
- 233 SAM and BAM
- 234 GFF and GTF
-
- 24 Relevant Data Repositories
- 25 Tools for RNA-seq and Differential Analysis
- 26 Relational and Non-relational Databases
- 27 Tecnologies
- 28 Related Work
- 29 Chapter Summary
-
- 3 The Gemini framework
-
- 31 Gemini
- 32 Gemini Architecture
-
- 321 Physical Architecture
-
- 33 Data Management
- 34 Web Interface
- 35 Use cases
- 36 Case studies
-
- 361 Full pipeline
- 362 Stage pipeline
-
- 37 Chapter Summary
-
- 4 Case study
-
- 41 Samples characterization
- 42 Researching objectives
- 43 Protocol of analysis
- 44 Genome version GRCh37 versus GRCh38
- 45 Fusion genes
- 46 Results
-
- 461 Case study with reference genome GRCh37
- 462 Splicing analysis
- 463 Case study with reference genome GRCh38
-
- 47 Chapter Summary
-
- 5 Conclusions and Future Work
- References
- A iRAP tools supported
-
- A1 Mappers
- A2 Quantification
- A3 Differential expression [DE]
- A4 Gene set enrichment analysis [GSE]
-
- B iRAP model of configuration file
- C iRAP example configuration file
-
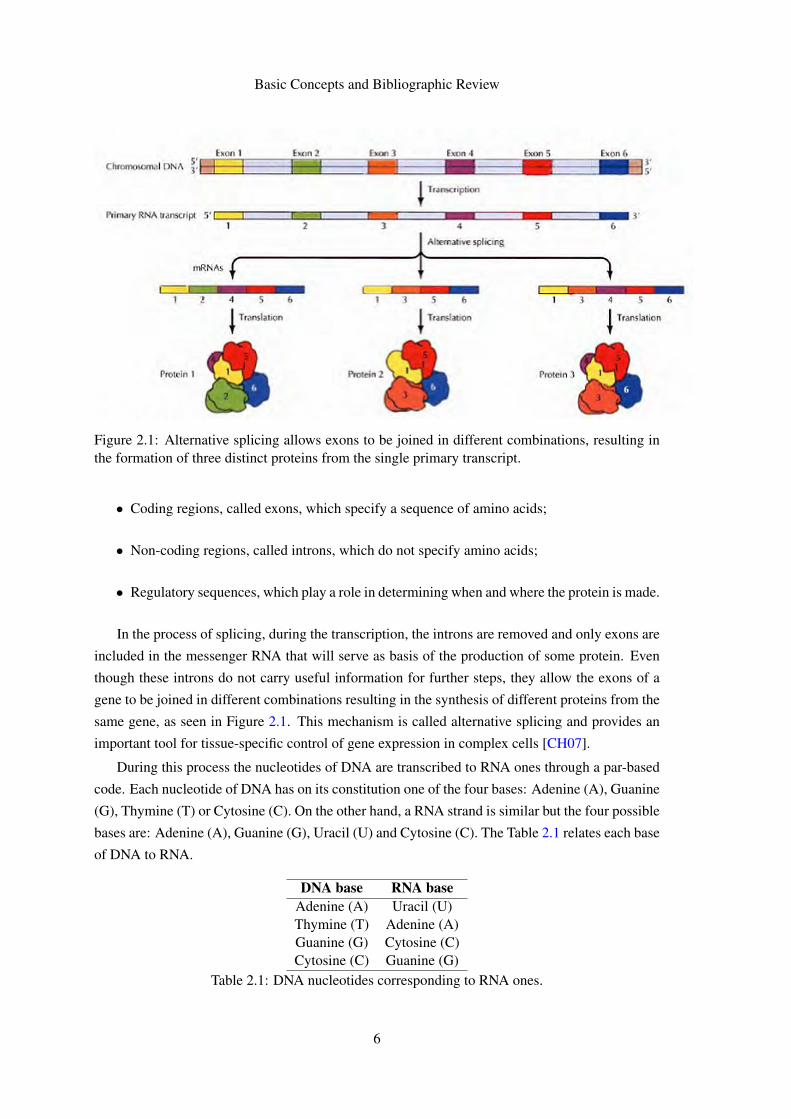
Basic Concepts and Bibliographic Review
22 RNA-Seq Analysis
As stated in the previous section there are alternative techniques to obtain the gene expression In
this section we compare them and then provide detailed information on RNA-Seq
221 RNA-Seq microarrays and DNA sequencing
For the analysis of genome expression it is commonly used RNA sequencing Firstly it is cho-
sen this technique instead of DNA sequencing because some molecular features like alternative
isoforms can only be observed at the RNA level predicting transcript sequence from genome is
difficult and in functional studies even though genome may be constant an experimental condition
has a pronounced effect on gene expression Also it is a way to interpret mutations that do not
have an obvious effect in the protein sequence but affect what mRNA isoform is expressed and
how much [Gri]
Secondly even though microarrays have facilitated gene expression based analysis but provide
relatively little information about alternative splicing In late 90rsquos microarray experiments were
generally expensive limiting sample sizes which represented a disaster specially when associated
to thousands of independent observations per sample Some attempts have been made to surpass
this problem but none could perform well in brain tissue RNA-Seq then appeared as a method to
mapping and quantifying transcriptomes It has clear advantages over existing approaches since
it has a greater dynamic range detects both coding and noncoding RNAs is superior for gene
network construction detects spliced transcripts and allele specific expression and can be used
to extract genotype information Also by comparing both of them while microarray output is
fluorescence intensity the output from a RNA-Seq experiment is digital and comes in the form of
read counts [HBD+13]
Furthermore RNA-Seq provides a far more precise measurement of levels of transcripts and
their isoforms than other methods It can reveal precise location of transcription boundaries and
is particularly useful to apply on complex transcriptomes In addition RNA-Seq is shown to be
highly accurate for quantifying expression levels while requiring less RNA sample when compared
to another techniques [ZW09] and it also can resolve both gene expression level and alternative
splicing events simultaneously [GCW+10]
222 RNA-Seq Pipeline
RNA-Seq has become the tool of choice for genome-wide analysis of the transcriptome [ORY10
SG15] However a typical RNA-Seq experiment generates millions of raw sequence reads that re-
quire considerable computational resources and programming skills to process the data [GTBK11
ORY10 FPMB14 FMB14] An overview of a basic pipeline for such analysis can be found in
Figure 24
9
Basic Concepts and Bibliographic Review
Figure 24 The essential workflow for RNA-Seq analysis [kn11]
When no reference genome is available it is necessary to construct a de novo assembly This
step will not be considered here since it was not used on the thesis work Given this we are able to
hold this main concepts
Quality control a pre-processing step where quality of raw reads are assessed At this stage bad
ldquoqualityrdquo ones may be excluded from the data set preventing potential mapping mismatches
and providing a better performance in further states
Read alignment that aligns the (quality filtered) reads to a reference genome in order to recon-
struct the larger sequence
Quantification that summarises and aggregates reads over a biologically meaningful unit such as
exons isoforms or genes
Differential expression that identifies genes expressed being the basis for future assessing of
proteins function originating from such genes
Note that this is just a basis workflow for RNA-Seq analysis that provide the possibility to add
or remove some of the stages according to different purposes
iRAP - A pipeline for RNA-Seq
Usually a combination of different tools might be desirable but on the other side time con-
suming since they depend on each others inputoutput and they are frequently focused in single
purposes hence often incompatible with one another [WMM+11]
10
Basic Concepts and Bibliographic Review
iRAP 5 appears as an integrated solution that allows users to choose and apply their preferred
tools for mapping reads quantifying expression and testing for differential expression [FPMB14]
Figure 25 iRAP pipeline for RNA sequencing analysis
The Figure 25 shows the main steps for this methodology that by comparing with the previous
workflow (Figure 24) has two more stages Gene set enrichment and Web reports Gene set
enrichment is a means of analysing genomic data by studying the effects of groups of genes on a
phenotype rather then individual gene analysis [kn10] Web reports facilitate the inspection of the
results produced at different stages of the analysis by providing web pages with tables or plots of
information [FPMB14]
iRAP is also capable of performing analysis starting at any stage of the pipeline by choosing
the right command line options Currently it has the following five different stage options as
described below
setupstage0 check all directories and data files are present and at the expected place
stage1 quality filtering and reporting check fastq file quality and report
stage2 mapping to the transcriptome or to the genome
stage3 estimate gene expression
stage4 estimate differential expression
Furthermore the expert can choose the specific tool for each phase of the system some of
which are described in detail in further sections The current list of tools supported are available
in Appendix A
When using iRAP the user has the possibility to speed up the analysis by using the irap_lsf
command This method accepts the same parameters as iRAP but splits the analysis into multiple
jobs with the aim of reducing the time to analyze the data
5iRAP repository httpscodegooglecompirap
11
Basic Concepts and Bibliographic Review
23 Standard File Formats used
For the implementation of the previous pipeline some file formats are used to input or retrieve
data Below will be presented the most widely used ones along with some short description and
detail when needed
231 FASTA
FASTA 6 is the definition line and sequence character format used by NCBI 7 It is a text-based for-
mat for representing either nucleotide (DNA or RNA) or amino acid (protein) sequences FASTA
is commonly used since it is easy to manipulate and parse using text-processing tools and scripting
languages Usually in iRAP a FASTA format is used to store the a reference genome
232 FASTQ
FASTQ 8 provides a simple extension to the previous format the ability to store a numeric quality
score associated with each nucleotide in a sequence [CFG+10] It is generally used as the first
input with the raw data
233 SAM and BAM
SAM 9 is a generic format for storing large nucleotide sequence alignments It is easy to under-
stand easy to parse and easy to generate and check for errors Despite the presented qualities
SAM is slow to parse so a binary equivalent to it BAM has been developed to deal with this issue
BAM is used to intensive data processing and is useful in most product pipelines while SAM has
appropriate for interconversion with external applications and exploratory analysis Like FASTQ
BAMSAM formats are widely used as containers for raw sequence data
234 GFF and GTF
GFF 10 is a format for describing genes and other features associated with DNA RNA and Protein
sequences It was originally proposed as a protocol for the transfer of genomic feature information
allowing people to develop and test them without having to maintain a complete feature-finding
system The second version also allows for feature sets to be defined over RNA and Protein
sequences as well as genomic DNA
On the other hand GTF 11 stands for Gene transfer format and has been developed on top
of GFF specification The first eight GTF fields are the same as GFF The group field has been
6FASTA format httpgeneticsbwhharvardedupphFASTAhtml7NCBI httpwwwncbinlmnihgov8FASTQ format httpmaqsourceforgenetfastqshtml9SAM and BAM file formats httpsamtoolssourceforgenetSAMv1pdf
10GFF format httpwwwsangeracukresourcessoftwaregffspechtml11GTF format httpwwwensemblorginfowebsiteuploadgffhtml
12
Basic Concepts and Bibliographic Review
expanded into a list of attributes Each attribute consists of a typevalue pair Attributes must end
in a semi-colon and be separated from any following attribute by exactly one space
24 Relevant Data Repositories
It is important to validate results and test along with the implementation of RNA-Seq pipeline As
such real data are needed so that the quality and efficiency of this study is assessed Some repos-
itories are available online such as Gene Expression Omnibus (GEO 12) Genomic Data Sharing
(GDS 13) ENSEMBL 14 UCSC Genome Browser 15 or the ENCODE Project 16 The three last
ones are highlighted in next section
ENSEMBL
The Ensembl project provides information about many vertebrate and other eucaryotic species
being started in 1999 some years before the draft human genome was completed Until today
many genomes have been added over the years as well as the inclusion of comparative genomics
variation and regulatory data [HBB+02]
Between the included working teams of Ensembl the Genebuild is the one who is responsible
to create the gene sets both as developing and mantaining the BioMart 17 data mining tool
It also supplies a REST server 18 as well as an FTP tool for browse and download data [CAB+15]
UCSC Genome Browser
The UCSC Genome Browser is a website that consists of an open-source tool to browse
analyze and query genomic data Currently it grants access to some reference genomes giving the
possibility to retrieve specific data due to the search tool integrated
Along with this tool it is also available an FTP server where data can be accessed and down-
loaded
ENCODE Project
While ENSEMBL has information about many vertebrate and other species ENCODE is a
project to identify all functional elements in the human genome sequence as well as being able
to create comprehensive high quality catalogs of functional elements in the human genome using
highndashthroughput technologies Their mission is to enable the scientific and medical communities
12GEO httpwwwncbinlmnihgovgeo13GDS httpgdsnihgov02dr2html14ENSEMBL httpwwwensemblorgindexhtml15UCSC Genome Browser httpgenomeucscedu16ENCODE project httpswwwencodeprojectorg17BioMart httpbiomartorg18REST server of Ensembl httprestensemblorg
13
Basic Concepts and Bibliographic Review
to interpret the human genome sequence and apply it to understand human biology and improve
health [The04]
Besides their motivation an online repository is being build up indexing gathered data and
allowing users to query different data types regardless of location [Con11] Some samples can
be found at httpswwwencodeprojectorgexperimentsENCSR274JRR for ex-
ample
25 Tools for RNA-seq and Differential Analysis
To perform the RNA-Seq pipeline some tools for each process are required It is now presented
some set of them on the following sections
Bowtie
Bowtie 19 is a tool to align short reads to the human genome To achieve speed and memory-
efficiency Bowtie aligns reads with the aid of an index of the reference genome [Lan10] and can
take advantage of the use of simultaneous multiple processor cores [LTPS09] For the human
genome Burrows-Wheeler is a commonly used indexing process that this tool extends with a
novel quality-aware backtracking algorithm that permits mismatches
TopHat
TopHat 20 is used as a junction mapping tool for RNA-Seq reads Before TopHat current
mapping strategies could only localize reads to known exons in the genome This tool is a read-
mapping algorithm design to align reads to a reference genome without relying on know splice
sites [TPS09]
Cufflinks
Cufflinks 21 assembles transcripts estimates their abundances and tests for differential ex-
pression and regulation in RNA-Seq samples Internally it is made of four different parts Cuf-
flinks that assembles the package Cuffcompare that compares transcript assemblies to annotation
Cuffmerge that merges two or more transcript assemblies and Cuffdiff that takes the aligned reads
and reports genes and transcripts that are differentially expressed [TRG+12a]
HTSeq
19Bowtie httpbowtie-biosourceforgenetindexshtml20TopHat httpccbjhuedusoftwaretophatindexshtml21Cufflinks httpcole-trapnell-labgithubiocufflinks
14
Basic Concepts and Bibliographic Review
HTSeq 22 is a python framework to facilitate the rapid development of scripts to processing
and analysis of high-throughtput sequencing data
FASTQC
FASTQC 23 is a quality control tool for high-throughput sequencing data It receives as input
BAM SAM or FASTQ files provides a quick overview on which areas there may be problems
summarizes graphs and tables for a fast assess of data and exports results to an HTML based report
Samtools
Samtools 24 is a set of utilities to manipulate alignments in the BAM format (output format of
TopHat eg) It does sorting merging and indexing and allows to retrieve in any regions The
files can be either provided via standard input (stdin) of from a remote FTP or HTTP server
deFuse
deFuse 25 is a software for gene fusion discovery from RNA-Seq data It uses clusters of dis-
cordant paired alignments to inform a split read alignment analysis for finding fusion boundaries
As an output it produces a fully annotated output for each predicted fusion
26 Relational and Non-relational Databases
Relational Databases had been introduced in 1970 by Edgar Codd at IBM Almaden Research
Center [Cod70] It has been used for decades and has brought in the concept of relations With
this a relational database is usually represented by a structured model a table in which each row is
a tuple (also considered as an object) and the columns are the attributes of the tuple The database
can be queried in order to retrieve useful data based on their attributes whether in common between
tuples or not To do so it is used a structured query language SQL [LM10] The main set of
operations is known as CRUD Create Read Update and Delete Relational databases are also
know for their fixed schemas that force every tuple to have the exact same attributes
A very common operation in SQL databases are joins Joins are a way to associated data that
share attributes or are somehow related One example is imagining a table of people that have
bank accounts associated and there is another table where the existing banks are described A way
to relate them is to combine these two tables in order to directly view which individual is using
which bank This is a very simple example that can scale very quickly and become a dangerous
operation for the consumed resources to be used to compute the needed relationships
22HTSeq httpwww-huberembldeHTSeqdocoverviewhtml23FASTQC httpwwwbioinformaticsbabrahamacukprojectsfastqc24Samtools httpsamtoolssourceforgenet25deFuse httpsbitbucketorgdranewdefuse
15
Basic Concepts and Bibliographic Review
In contrast with the previous set a Non-relational database commonly doesnrsquot have a fixed
schema and avoid the previous complex operation Within this class of databases there are different
approaches to the used models such as key-value stores big table clones document databases and
graph databases Each of them is used accordingly to the data set complexity
MongoDB 26 is a non-relational database schemaless and is scalable in cluster performance
and data This way it provides a way to store large data sets with the freedom of using different
schemas according to data 27
27 Tecnologies
When developing a web service there are some basic resources and programming languages used
HTML 28 is a standard markup language for describing web documents CSS 29 is used for
defining how the HTML elements are to be displayed Bootstrap 30 is a free front-end frame-
work for faster and easier web development and contains HTML and CSS based design patterns
Javascript 31 serves as a method for programming the behavior of web pages jQuery 32 is a library
of Javascript that greatly specifies Javascriptrsquos usage
Even though commonly used PHP 33 is not the best suitable language for our thesis work
When compared to Python it lacks security and is not used on the Bioinformatics field On the
other hand Perl has been greatly used on this field but it is currently being replaced by Python 34
Furthermore this last one has libraries like BioPython 35 for internal processing of samples and
also has support to web through frameworks like Django 36 or BottlePy 37
Even though Django is trending it has no support for NoSQL relational databases yet Bot-
tlePy for instance is a lightweight web framework simple to use and provides the ability to use
MongoDB
Concerning the situation the combination of Python and BottlePy is the most suitable since it
has
bull Starting to replace Perl in bioinformatics processing
bull Support for NoSQL databases (either the framework and the programming language)
bull Lightweight usage
26MongoDB httpwwwmongodborg27MongoDB scalability httpwwwmongodbcommongodb-scale28HTML httpwwww3schoolscomhtml29CSS httpwwww3schoolscomcssdefaultasp30Bootstrap httpgetbootstrapcom31Javascript httpwwww3schoolscomjs32jQuery httpsjquerycom33PHP httpphpnet34Python httpswwwpythonorg35BioPython httpbiopythonorgwikiMain_Page36Django framework httpswwwdjangoprojectcom37BottlePy httpbottlepyorgdocsdevindexhtml
16
Basic Concepts and Bibliographic Review
Figure 26 Print screen of Galaxy when trying to get data from UCSC
For the purpose of sending the information between devices the FTP server solution was
analysed It allows the creation of an administrator user that has the permissions for writing and
reading but also for anonymous users that can only download data
28 Related Work
Galaxy
Galaxy 38 is an open source web-based platform for data intensive biomedical research
It consists of an embedded website system that provides access to different databases such
as Ensembl or UCSC Genome Browser Although functional the platform has not a consistent
interface which requires the user to learn to use many systems within it An example of this
situation can be viewed in Figure 26 Furthermore it does not provide the ability to choose easily
a stage pipeline like iRAP or to run a full one with personalized tools
BioMart Central Portal
BioMart 39 is a community-driven project to provide unified access to distributed research data
to facilitate the scientific discovery process
38Galaxy httpgalaxyprojectorg39BioMart Central Portal httpcentralbiomartorgsequencegui=Sequence_retrievalamp
mart=metaseq_mart_63_config
17
Basic Concepts and Bibliographic Review
It currently has a sequence retrieval tools that provides searching by database and dataset
Nowadays this tool offers Ensembl as the only available database but it adds up three other fea-
tures like a sequences filters and header information panels where the users can improve their
search
29 Chapter Summary
In this chapter we presented and discussed the technologies suitable for the thesis work We have
surveyed alternative technologies for gene expression computation and alternative splicing tools
The technologies are relevant to solve the Biological domain problem We have also surveyed
the tools for the development of websites and databases to store the data used when solving the
biological problems In the next chapter we describe work in detail
18
Chapter 3
The Gemini framework
Despite the very large number of tools available for Molecular Biology problems they are most
often difficult to use and require sophisticated computational resources As part of the thesis
work we have developed a framework that allows expert users to make RNA-Seq and alternative
splicing analysis using a user friendly web interface and sophisticated computational resources
In this chapter we describe that framework that include the website database resources for storing
data and the computational settings for the analysis
iRAP has been chosen to accomplish the automation of RNA sequencing analysis due to the
simplicity of use and its wide number of tools available for its task Since it is an integrated
tool platform its installation requires not only powerful computer resources but also a long list of
basic equipment necessary to each of them Considering these issues it had not always been easy
to setup the wanted work environment
Despite the difficulties of this scenario we have been able to complete the setup of this tool
and make some control experiments with it
In order to accomplish an iRAP execution a configuration file must be provided (see Ap-
pendix B) Along with the experiment name the name of species being analysed the reference
genome and read data files need to be specified and made available Furthermore the specific
tools for each stage of the pipeline need also to be specified among other possible variables
It is not easy and usually very time consuming for a Biologist to create the configuration file or
to run the command-line interface that controls iRAP pipeline Since this system is a combination
of many different tools there are a long list of available options that may be fulfilled Some of
them are mandatory while other ones are optional After this setting is completed it must be saved
in a text file and made available to run iRAP
Even though the usage of iRAP does not require extensive bioinformatics expertise it does
assume familiarity with UNIX command-line interface which would narrow down the target audi-
ence In order to overcome this situation we designed and developed a framework called Gemini
19
The Gemini framework
that includes a Graphical User Interface and makes RNA-Seq studies much more easy to perform
We have also included extra features for doing more analysis to RNA-Seq data
31 Gemini
Due to the lack of intuitiveness on the process of generating the configuration file it has been
created a more user friendly one through a web form This form asks for input of the main settings
to call a very simple experiment with a commonly used bacteria escherichia ecoli (e coli)
Another important feature is the possibility to fill the form asking what is the stage that the user
wants the pipeline to start with
Another issue was to find and easily download a reference genome for a certain species In
order to add completeness to Gemini and also to simplify the process of download it has been
implemented the functionality to download the reference genome (both fasta and annotation files)
It is used the Ensembl API to obtain the required results The jobs status feature lists the status of
jobs sent by the user for execution
Besides these features one more have been added even though not completed It is the job
results where it is presented the results collected for a determined task
32 Gemini Architecture
321 Physical Architecture
Gemini is divided into two different sets The first one is where the web application is hosted as
well as the database Since dealing with genomic data often requires great computer performance
processing experiments is accomplished in an independent server that later responds with results
Figure 31 Physical architecture of Gemini
Data scheme
MongoDB is NoSQL document based database The information is organized in collections
in which each element is stored as a JSON document NoSQL databases are simpler to use when it
20
The Gemini framework
comes to have different information fields in the same document and at the same time they have
better performance and scalability [SK11] Currently the information is arranjed in two collections
scheme as described on Table 31
Name DescriptionAccounts Stores the users dataJobs Stores the experiments dataTable 31 Collections used to store data
Accounts
An accountrsquos document stores an userrsquos email password and a unique identifier A role has
also been saved for future hierarchy creation in which some levels will grant more permissions
than others like changing accounts settings of other participants
1
2 _id ObjectId(54f5a9b234f76511a82ec3b2)
3 password e10adc3949ba59abbe56e057f20f883e
4 role user
5 email acgggomesgmailcom
6
Jobs
Jobs are related to an user and have the name and description of the experiment It also
stores the reference genomersquos location as well as the readsrsquo one Likewise the date of creation is
preserved When a job is completed the status is modified to finished
1
2 _id ObjectId(5544ecf134f7651d687bba94)
3 name ExpFinal
4 exp_dir data54f5a9b234f76511a82ec3b2ExpFinalreads
5 user 54f5a9b234f76511a82ec3b2
6 description Final test
7 genome_dir genomesEscherichia coli
8 status started
9 date ISODate(2015-05-02T152745249Z)
10
21
The Gemini framework
33 Data Management
In order to create a new job it is required two sets of data namely reference files and raw data
files The raw data is the actual data being analysed while the reference genome serves as basis to
the alignment or control
The typical workflow consists on the expert providing the experience and species names as
well as the raw data that was previously collected in the laboratory Afterwards through a step by
step system the user has the option to choose the reference genome to be used on the experiment
This last files are internally obtained from different FTP servers such as Ensembl and ENCODE
stored locally and reused in further usages
The provided information is then saved in the database and the files stored hierarchically We
use the following sequence of ltsection namegt ltuseridgt ltexperience namegt ltdata filesgt The
ltsection namegt can be conf for storing configuration files data for saving the reads or refer-
ence for keeping the reference genome and annotation files The ltuseridgt is the ID of Accounts
database document and the ltexperience namegt is the same as name in Jobs database document
A directory tree is represented in Figure 32
Figure 32 File system tree demonstrating the hierarchy of saved data files
This information is then passed to the server via a local FTP server that has been created
22
The Gemini framework
for this purpose We have followed an online tutorial 1 for the configuration From this we
created one administrator that has permissions for writing and reading files and we also authorized
anonymous login that may only retrieve files This way on the web application the admin user
creates the reads reference genomes annotation and configuration files On the computational
server an anonymous user authenticates for retrieving the files according to the filenames received
via API
The inside directory of FTP follows the hierarchy of ltuseridgt ltexperience namegt ltdata
filesgt where ltuseridgt is the ID on the Accounts document and ltexperience namegt is the name
on Jobs document When the server is prompted to run an experience it downloads the required
data from the FTP and runs iRAP with the necessary configuration options
34 Web Interface
For the implementation of Gemini python has been used for backend along with a simple fast and
lightweight WSGI micro web-framework called BottlePy 2 It has no dependencies and grants the
main functionalities such as routing templates some class utilities and a built-in server
The first screenshot (Figure 33) shows the home page of Gemini There is top menu bar with
two possible interactions login and register There is also a simple content box that describes the
main features and status of development of the platform Later on a new menu appears with the
possibility to logout on the Welcome tab (as in Figure 34)
Figure 33 Home page
Figure 34 Logout menu
1Tutorial available at httpswwwthomas-krenncomenwikiSetup_FTP_Server_under_Debian
2BottlePy httpbottlepyorgdocsdevindexhtml
23
The Gemini framework
The main feature of the system is the create job (Figure 35) option that is easily accessible on
top menu When the user clicks on it a form is displayed with the variables to introduce on the
configuration file that iRAP needs A description option has been added to provide the freedom to
the researcher to include some extra information that he finds useful
Figure 35 Create job form
The same type of form was used for the reference genomes section (Figure 36) The user is
prompted to choose orderly the species name release number and version Afterwards a table of
elements appears allowing the expert to download the files found
Figure 36 Reference genomes component
24
The Gemini framework
35 Use cases
Gemini was designed to have only one actor the user that will accomplish the experiments This
actor has the possibility to register login and logout of his account create a job and the hability
to download a reference genome of his choice Even though not fully implemented it has been
considered the jobs done functionality
Figure 37 Use cases diagram
36 Case studies
Some case studies with e coli in order to test iRAPrsquos installation and its capabilities For both
of the case studies it has been collected six samples of Escherichia coli reads from European
Nucleotide Archive 3 and the corresponding reference genome and annotation file from Ensembl
361 Full pipeline
In order to call the full pipeline iRAP has been tested with the directive irap conf=ecoli_exconf
Configuration file (ecoli_exconf ) content is as described in Appendix C In this task the system
received the reads and performed the quality control (QC) mapping quantification and differential
expression between the two groups of samples
3ENA httpwwwebiacukena
25
The Gemini framework
This test has been accomplished successfully
362 Stage pipeline
The stage pipeline is a powerful functionality since it allows the user to choose a specific stage of
the pipeline that he wants to execute for his samples
Besides the fact that it is not easy to collect data samples users often want to repeat or analyse
just one step of the pipeline and take some conclusions of it Furthermore this type of pipeline is
less time consuming
A concrete usage example is IPATIMUPrsquos data which contains the output information of the
mapper TopHat and will be further analysed in detail in Chapter 4 Concerning this setup it would
not be possible to call the full pipeline but instead it would require a command specific command
option
For validation purposes the same bacteria from the previous analysis has been used for the
stage pipeline case After calling the setup command to check input the directive irap conf=
ecoli_exconf quality_filtering_and_reporting has been used to perform the stage1
of iRAP The platform was able to perform with success this task
37 Chapter Summary
It has been used Python with BottlePy for the main implementation of the interface of Gemini
MongoDB has been chosen for dealing with information A FTP server was mounted for the
transitions of data between the client and the server The platform allows the expert to call a full or
stage pipeline analysis and provides the download of both fast and annotation files The essential
items are setup for the addition of further functionalities
26
Chapter 4
Case study
In this chapter it is going to be presented the Case Study with data from samples of thyroid carci-
noma along with their charactering and researching results
After the development of an interface to the iRAP tool the following step was to do a case
study with some realistic DNA samples of thyroid cancer patients regarding the partnership with
IPATIMUPrsquos researchers
The purpose of this case study was to do some research of potential differences between dis-
tinct types of the disease In order to accomplish this four samples were collected from Centro
Hospitalar de Satildeo Joatildeo (Porto) Cases 1 and 2 have been categorized as a widely invasive Fol-
licular Thyroid Carcinoma (wFTC) and cases 3 and 4 as a minimally invasive Follicular Thyroid
Carcinoma (mFTC)
41 Samples characterization
Patient from case 1 was female with 82 years old the tumour measuring 2 cm of size and presented
a predominant follicular growth pattern and oncocytic features Patient from case 2 was male with
55 years old the tumour measuring 5 cm of size and presented a predominant solidtrabecular
growth pattern For the group of mFTC patient from case 3 was female 56 years old the tumour
measuring 37 cm of size and with follicular growth pattern patient from case 4 was female 56
years old the tumour measuring 4 cm of size and with follicular growth pattern
42 Researching objectives
The aim of the study was to answer the following questions
bull Differentially expressed genes
bull Total isoforms found either in percentange and in absolute
27
Case study
bull Average of alternative isoforms for each gene spliced
bull Potentially novel isoforms and how do they behave between samplesgroups of samples
bull Compare results between versions of human genome assembly
bull Retrieve fusion genes
43 Protocol of analysis
Collected sample reads have been aligned against reference genome GRCh37 with TopHat version
141 Posterior analysis followed Tuxedo Protocol as described in Trapnell et al [TRG+12b] An
overview of the full protocol can be found in Figure 41
For the implementation of this procedure it were considered as two different groups the cases
1 and 2 (wFTC) against cases 3 and 4 (mFTC) The following step was to assemble transcripts for
each sample with Cufflinks 1 and afterwards create a single merged transcriptome annotation with
Cuffmerge 2 Cuffdiff 3 was then used to find significant changes in transcript expression
In order to find potential isoforms each sample was ran against the reference genome with
Cuffcompare 4
44 Genome version GRCh37 versus GRCh38
Even though IPATIMUPrsquos data have been assembled with reference genome version GRCh37
nowadays a more recent version (GRCh38) has been released in 2013 This new assembly is the
first major revision of the human genome in more than four years 5
The main differences between this two versions are
Alternate sequences several human chromosomal regions have sufficient variability to prevent
adequate representation by a single sequence This new version provides alternate sequence
for selected variant regions through the inclusion of alternate loci 6 scaffolds
Centromere 7 representation Previous method of representing centromeric regions have been
replaced by sequences from centromere models The models provide the approximate repeat
number and order for each centromere and are useful for read mapping and variation studies
Mitochondrial genome The new mitochondrial reference sequence is the Revised Cambridge
Reference Sequence with RefSeq accession number NC_0129201 The previous one was
RefSeq accession number NC_001907 which was not updated when GRCh37 assembly
later transitioned to the new version1Cufflinks httpcole-trapnell-labgithubiocufflinks2Cuffmerge httpcole-trapnell-labgithubiocufflinkscuffmergeindexhtml3Cuffdiff httpcole-trapnell-labgithubiocufflinkscuffdiffindexhtml4Cuffcompare httpcole-trapnell-labgithubiocufflinkscuffcompareindexhtml5As in UCSC mailing list at httpsgroupsgooglecomasoeucsceduforumtopic
genome-announce52Kv41YBXNY6Specific location of a gene on a chromosome
28
Case study
Figure 41 An overview of the Tuxedo Protocol with full steps TopHat for alignment Cufflinkspackage to find differential features between group samples and in the end CummeRbund to plotprevious results
Sequence updates Several erroneous bases and misassembled regions have been corrected and
more than 100 gaps have been filled or reduced
Analysis set The new assembly offers an analysis set that was created to accommodate next
generation sequencing read alignment pipelines Several GRCh38 regions have been elimi-
nated from this set to improve read mapping
29
Case study
45 Fusion genes
After we done some research on the technologies used for finding fusion genes in the reads we
have not been able to perform the analysis to answer the last question of our researching objectives
DeFuse required as input the original reads which were not provided This analysis would have
been interesting for relating the ocurrence of thyroid and the presence of fusion genes as well as if
there was any relevant difference between the samples of wFTC and mFTC
46 Results
461 Case study with reference genome GRCh37
The following table ( 41) demonstrates some genes that were differentially expressed with signif-
icance between mFTC and wFTC According to Celestino et al 8 CRABP1 C1QL1 and LCN2
are biomarkers of thyroid cancer and predictors of extrathyroidal extension It is commonly used
the value of 005 has threshold above which the differential expression is significant By inspect-
ing out the table we can find C1QL1 with a q-value of 0000555 and CRABP1 with a q-value
of 159E-11 which are in concordance with the previous article Furthermore it is verified the
increased gene expression in wFTC when compared to mFTC
Gene ID Gene Chr mFTC wFTC Fold change(log2) Q value
ENSG00000167748 KLK1 19 018672 111924 922742 0ENSG00000104725 NEFL 8 00196645 276961 104599 0ENSG00000174145 KIAA1239 4 00307388 144265 887444 0ENSG00000182379 NXPH4 12 008307 195786 788074 0ENSG00000131094 C1QL1 17 0121453 238957 429828 0000555ENSG00000142677 IL22RAI 1 150905 0384783 -529345 0ENSG00000138615 CILP 15 423569 0052726 -632793 241E-11ENSG00000141431 ASXL3 18 18938 001408 -707148 124E-09ENSG00000166426 CRABP1 15 748375 0367899 -766831 159E-11ENSG00000214145 LINC00887 3 19797 0119327 -737421 0000459
Table 41 Genes differentially expressed between minimally invasive follicular thryoid carcino-mas (mFTCs) and widely invasive follicular thyroid carcinomas (wFTCs)
In response to the previous researching objectives the Table 42 has the statistical results for
taks two and three From the data analysis we could conclude that less than 1 of genes have
isoforms but each one has an average of 389 alternatives
8Ricardo Celestino Torfin Nome Ana Pestana Andreas M Hoff Pedro A Gonccedilalves Catarina Eloy Eva SigstadRagnhild A Lothe Trine Bjoslashro Manuel Sobrinho-Simotildees Rofl I Skotheim Paula Soares CRAPBP1 C1QL1 andLCN2 are biomarkers of thyroid cancer and predictors of extrathyroidal extension subbmited for publication
30
Case study
Total genes 63896Total significant isoforms 689Total unique genes with isoforms 179Ratio of unique genes with isoformsgenes () 028Average of alternatives per gene with isoforms 389
Table 42 Statistical results for researching objectives number 2 and 3
462 Splicing analysis
Forward in the analysis Cuffcompare 9 has been used to search for novel isoforms when com-
pared to the reference genome The method was to compare each sample to the reference genome
and afterwards make an overlap of the results The main objective was then to infer about the
differences among wFTC and mFTC
Sample 1(wFTC)
Sample 2(wFTC)
Sample 3(mFTC)
Sample 4(mFTC)
Total genes 30440 36862 35539 37534Potential novel isoforms 7406 8450 8781 8830Table 43 Potential novel isoforms for each sample of IPATIMUPrsquos data
As demonstrated on Table 43 average there is a percentage of 24 of potentially novel iso-
forms found (at least one spliced junction is shared with a reference transcript) There is been
made an overlap of the results in order to encounter differences between wFTC and mFTC The
Table 44 presents the counting of differences between cases A brief analysis allows us to say
that we can not make any relationship between wFTC and mFTC On average there was a total of
3722 changes among this two sets The average within the sets are 3554 for wFTC and 3992 for
mFTC Given this results there was not a significant divergence to allow us to relate the splicing
and the occurrence of a more invasive Thyroid Carcinoma
Sets ChangesS1 S2 3554S1 S3 3609S1 S4 3612S2 S3 3847S2 S4 3820S3 S4 3929
Table 44 Number of differences between samples Syntax used S1 - Sample 1 S2 - Sample 2S3 - Sample 3 and S4 - Sample 4
9Cuffcompare httpcole-trapnell-labgithubiocufflinkscuffcompareindexhtml
31
Case study
463 Case study with reference genome GRCh38
In order to respond to the last research objective it has been applied the method of analysis has
before with a more recent human genome assembly After using the same protocol with Cufflinks
Cuffmerge and Cuffdiff sequentially we have come to some conclusions
The produced results of differential expression analysis for the same genes were very different
Genes that were highly significant before like C1QL1 and CRABP1 now had no relevance (q-
value gt 005) As mentioned before we had only access to TopHatrsquos output that used version
GRCh37 for the alignment and mapping process so we could not start from scratch the analysis
This outcome demonstrates two topics in particular
1 the introduction of novel annotations can make previous analysis outdated
2 there is the need to save the original reads in order to update earlier studies
The solution to this situation would have been to use the original reads to repeat the assembly
and then follow the Tuxedo protocol to collected correct and updated differential expression data
47 Chapter Summary
These section of development has been introduced in order to confer not only validation but also
to do some researching studies on the subject Four samples were collected and divided into two
distinct groups Tuxedo protocol was followed for responding to the research objectives The
case study for GRCh37 demonstrated the expression of C1QL1 and CRABP1 on wFTC when
compared to mFTC as indicated in the referred article On the other hand the same protocol when
applied with GRCh38 demonstrated the importance of saving the original reads and what is the
influence of newer releases in previous researching results Lastly the splicing analysis results did
not show any evidence of related isoforms count and the manifestation of the different stages of
the disease
32
Chapter 5
Conclusions and Future Work
The research of genomic-based cancers require highly complex data analysis Such analysis re-
quire most often the use of a large number of complex computational resources the gathering
of a lot of information over the Internet and the use of powerful computational resources Fur-
thermore the manipulation of the computational tools and resources require the assistance of an
informatics expert
The thesis work is a contribution towards the solution of the above mention problem We
propose and developed a framework that enables an expert biologist to perform genomic-based
complex analysis in a easy way and using the required powerful computational resources in a
transparent way
Using the developed framework we have used real data to address several research questions
provided by IPATIMUPrsquos researchers Firstly with the human genome GRCh37 we identified
two of the biomarkers of thyroid cancer by differential gene expression analysis Secondly we
found 689 significant isoforms 179 unique out of 63896 genes (ratio of 028) with an average
of 389 isoforms per gene Thirdly when trying to determine potential novel isoforms we came
at no conclusion of the differences of expression when comparing wFTC and mFTC The last
case was applying the Tuxedo protocol with the new GRCh38 on samples The outcome of the
experiment revealed the importance of saving the original reads and that newer releases become
previous analysis outdated
Future Work
This thesis work is just a starting point As stated before the framework was designed so it can be
extended with further modules to enable addressing other research questions
The case studies also showed us that RNA-seq analysis is very time consuming On the other
hand there are a lot of sub-tasks that can be run in parallel (like the task of aligning the reads)
33
Conclusions and Future Work
We will study and compare different techniques and opportunities to make RNA-seq in parallel as
much as possible
34
References
[bNE] Scitable by Nature Education Transcriptome available at httpwwwnaturecomscitabledefinitiontranscriptome-296 last accessJanuary 2015
[CAB+15] Fiona Cunningham M Ridwan Amode Daniel Barrell Kathryn Beal Konstanti-nos Billis Simon Brent Denise Carvalho-Silva Peter Clapham Guy CoatesStephen Fitzgerald Laurent Gil Carlos Garciacutea Giroacuten Leo Gordon ThibautHourlier Sarah E Hunt Sophie H Janacek Nathan Johnson Thomas Juette-mann Andreas K Kaumlhaumlri Stephen Keenan Fergal J Martin Thomas MaurelWilliam McLaren Daniel N Murphy Rishi Nag Bert Overduin Anne ParkerMateus Patricio Emily Perry Miguel Pignatelli Harpreet Singh Riat DanielSheppard Kieron Taylor Anja Thormann Alessandro Vullo Steven P WilderAmonida Zadissa Bronwen L Aken Ewan Birney Jennifer Harrow Rhoda Kin-sella Matthieu Muffato Magali Ruffier Stephen MJ Searle Giulietta SpudichStephen J Trevanion Andy Yates Daniel R Zerbino and Paul Flicek Ensembl2015 Nucleic Acids Research 43(D1)D662ndashD669 2015
[CFG+10] Peter J A Cock Christopher J Fields Naohisa Goto Michael L Heuer and Peter MRice The Sanger FASTQ file format for sequences with quality scores and theSolexaIllumina FASTQ variants Nucleic acids research 38(6)1767ndash71 April2010
[CH07] Geoffrey M Cooper and Robert E Hausman The Cell - A molecular approachAmerican Society for Microbiology 2007
[Cod70] E F Codd A relational model of data for large shared data banks Communica-tions of the ACM 13(6)377ndash387 June 1970
[Con11] The ENCODE Project Consortium A userrsquos guide to the encyclopedia of DNAelements (ENCODE) PLoS biology 9(4)e1001046 April 2011
[FMB14] N A Fonseca J A Marioni and A Brazma RNA-seq gene profiling - a system-atic empirical comparison Technical report May 2014
[FPMB14] Nuno A Fonseca Robert Petryszak John Marioni and Alvis Brazma irap - anintegrated rna-seq analysis pipeline bioRxiv 2014
[GCW+10] Qiang Gan Iouri Chepelev Gang Wei Lama Tarayrah Kairong Cui Keji Zhaoand Xin Chen Dynamic regulation of alternative splicing and chromatin structurein Drosophila gonads revealed by RNA-seq Cell research 20(7)763ndash83 July2010
35
REFERENCES
[GEN] GENIE Dna genes and chromossomes University of Leicesteravailable at httpwww2leacukdepartmentsgeneticsvgecschoolscollegestopicsdna-genes-chromosomes last access Jan-uary 2015
[Gri] Malachi Griffith Bioinformatics for Cancer Genomics (BiCG)available at httpbioinformaticscaworkshops2012bioinformatics-cancer-genomics-bicg last access January 2015
[GTBK11] Angela Goncalves Andrew Tikhonov Alvis Brazma and Misha Kapushesky Apipeline for RNA-seq data processing and quality assessment Bioinformatics (Ox-ford England) 27(6)867ndash9 March 2011
[HBB+02] T Hubbard D Barker E Birney G Cameron Y Chen L Clark T CoxJ Cuff V Curwen T Down R Durbin E Eyras J Gilbert M HammondL Huminiecki A Kasprzyk H Lehvaslaiho P Lijnzaad C Melsopp E Mon-gin R Pettett M Pocock S Potter A Rust E Schmidt S Searle G SlaterJ Smith W Spooner A Stabenau J Stalker E Stupka A Ureta-Vidal I Vastrikand M Clamp The ensembl genome database project Nucleic Acids Research30(1)38ndash41 2002
[HBD+13] R Hitzemann D Bottomly P Darakjian N Walter O Iancu R SearlesB Wilmot and S McWeeney Genes behavior and next-generation RNA se-quencing Genes Brain Behav 12(1)1ndash12 Feb 2013
[Ins] National Human Genome Research Institute Transcriptome available at httpwwwgenomegov13014330 last access January 2015
[Joh03] Jason M Johnson Genome-wide survey of human alternative pre-mrna splicingwith exon junction microarrays Science 3022141ndash2144 December 2003
[kn10] Gene set enrichment a problem of pathways Briefings in functional genomics9(5-6)385ndash90 December 2010
[kn11] Overview of available methods for diverse RNA-Seq data analyses Science ChinaLife sciences 54(12)1121ndash8 December 2011
[Lan10] Ben Langmead Aligning short sequencing reads with Bowtie Current proto-cols in bioinformatics editoral board Andreas D Baxevanis [et al] Chapter11Unit 117 December 2010
[LM10] Adam Lith and Jakob Mattsson Investigating storage solutions for large data - acomparison of well performing and scalable data storage solutions for real timeextraction and batch insertion of data Masterrsquos thesis 2010
[LTPS09] Ben Langmead Cole Trapnell Mihai Pop and Steven L Salzberg Ultrafastand memory-efficient alignment of short DNA sequences to the human genomeGenome biology 10(3)R25 January 2009
[ORY10] Alicia Oshlack Mark D Robinson and Matthew D Young From RNA-seq readsto differential expression results Genome biology 11(12)220 January 2010
[SG15] Marc W Schmid and Ueli Grossniklaus Rcount simple and flexible RNA-Seqread counting Bioinformatics 31(3)436ndash437 February 2015
36
REFERENCES
[SK11] Christof Strauch and Walter Kriha NoSQL databases Lecture Notes StuttgartMedia University February 2011
[SOdMVN12] Mikhail Shugay Intildeigo Ortiz de Mendiacutebil Joseacute L Vizmanos and Francisco JNovo Genomic hallmarks of genes involved in chromosomal translocations inhematological cancer PLoS Comput Biol 8(12)e1002797 12 2012
[The04] The ENCODE Project Consortium The ENCODE (ENCyclopedia Of DNA Ele-ments) Project Science (New York NY) 306(5696)636ndash40 October 2004
[TPS09] Cole Trapnell Lior Pachter and Steven L Salzberg TopHat discovering splicejunctions with RNA-Seq Bioinformatics (Oxford England) 25(9)1105ndash11 May2009
[TRG+12a] Cole Trapnell Adam Roberts Loyal Goff Geo Pertea Daehwan Kim David RKelley Harold Pimentel Steven L Salzberg John L Rinn and Lior Pachter Dif-ferential gene and transcript expression analysis of RNA-seq experiments withTopHat and Cufflinks Nature protocols 7(3)562ndash78 March 2012
[TRG+12b] Cole Trapnell Adam Roberts Loyal Goff Geo Pertea Daehwan Kim David RKelley Harold Pimentel Steven L Salzberg John L Rinn and Lior Pachter Dif-ferential gene and transcript expression analysis of RNA-seq experiments withTopHat and Cufflinks Nature protocols 7(3)562ndash78 March 2012
[WMM+11] Ying Wang Gaurang Mehta Rajiv Mayani Jingxi Lu Tade Souaiaia YanghoChen Andrew Clark Hee Jae Yoon Lin Wan Oleg V Evgrafov James AKnowles Ewa Deelman and Ting Chen RseqFlow workflows for RNA-Seq dataanalysis Bioinformatics (Oxford England) 27(18)2598ndash600 September 2011
[Wol13] Jochen B W Wolf Principles of transcriptome analysis and gene expressionquantification an rna-seq tutorial Molecular Ecology Resources 13(4)559ndash5722013
[ZW09] Mark Gerstein |amp Michael Snyder Zhong Wang Rna-seq a revolutionary tool fortranscriptomics Nature Reviews Genetics 1057ndash63 January 2009
37
REFERENCES
38
Appendix A
iRAP tools supported
A1 Mappers
Mapper Option name (mapper)TopHat 1 tophat1TopHat 2 tophat2SMALT smaltGSNAP gsnapSOAPsplice soapspliceBWA bwa1BWA bwa2Bowtie 1 bowtie1Bowtie2 bowtie2GEM gemSTAR starOSA osaMapSplice mapsplice
A2 Quantification
Quantifier Option name (quant_method)FluxCapacitor flux_capHT-Seq (union mode) htseq1HT-Seq (intersection non-empty mode) htseq2Cufflinks 1 (try to find novel transcripts-g) cufflinks1Cufflinks 2 (try to find novel transcripts-g) cufflinks2Cufflinks 1 (do not assemble novel transcripts-G) cufflinks1_ndCufflinks 2 (do not assemble novel transcripts-G) cufflinks2_ndNURD nurd
39
iRAP tools supported
A3 Differential expression [DE]
Method Option name (de_method)DESeq deseqDESeq2 deseq2EdgeR edgerCuffdiff 1 cuffdiff1Cuffdiff 2 cuffdiff2
A4 Gene set enrichment analysis [GSE]
Tool Option name (gse_tool)Piano piano
40
Appendix B
iRAP model of configuration file
1 This is a comment (lines that start with a are ignored by iRAP)
2 =============================================================================
3 name that you want to give to the experiment (no spaces)
4 All files produced by irap will be placed in a folder with the given name
5 name=myexp
6
7
8 =============================================================================
9 name of the species
10 species=homo_sapiens
11
12 =============================================================================
13 Fasta file with the reference genome
14 reference=Homo_sapiensGRCh3766dnafa
15
16 =============================================================================
17 GTF file with the annotations
18 gtf_file=Homo_sapiensGRCh3766gtf
19
20 =============================================================================
21 IRAP options (may be providedoverriden in the command line)
22
23
24 Mapper
25 mapper=
26
27
28 Quantification method
29 quant_method=
30
31
32 Dif expression method
33 Requires contrasts to be defined (see below)
41
iRAP model of configuration file
34 de_method=
35
36
37 Gene set enrichment (GSE) analysis
38 Requires de_method to be defined
39 Tool to use (none|piano)
40 gse_tool=piano
41
42 gse_method (mean|median|sum|fisher|fisher-exact|stouffer|tailStrength|wilcoxon|
reporter|page) see Piano vignete documentation for more details
43 gse_method=fisher
44 gse_pvalue=005
45 Minimum number of genes in a gene set
46 gse_minsize=3
47
48
49
50 TSV file with gene annotation
51 Format IDNamelocussourcelnameGOGOtermKEGG
52 Description
53 ID=gene_id (this is mandatory and should match the one given in the gtf file)
54 Name=gene name
55 locus=chrstart--end
56 source=biotype
57 lname=gene name
58 GO=go ids (multiple values can be separated by)
59 GO=GO terms (multiple values can be separated by)
60 KEGG=Kegg ids (multiple values can be separated by)
61 If auto is defined then iRAP will try to generate the file
62 - this may take a considerable amount of time and will only work
63 for a reduced number of species
64 off - default value
65 annot_tsv=
66
67
68 QC
69 Check data (reads) quality (on|off|none)
70 on - reads are filtered out based on their quality
71 off - the quality of the reads is assessed but no filtering is done
72 none- no quality control is performed
73 qual_filtering=on
74
75 Trim all reads to the minimum read size after quality trimming - Yes (y)| No (n)
76 only applicable if qual_filtering is on
77 trim_reads=y
78
79 Minimum base quality accepted (def 10)
80 min_read_quality=10
81
42
iRAP model of configuration file
82 Contamination check (cont_index parameter) Reads that likely
83 originate from organisms other than the one under study can be
84 discarded during pre-processment of the reads This is done by
85 aligning the reads to the genomes of organisms that might be a
86 source of contamination and discard those that map with a high
87 degree of fidelity By default iRAP will check if the data is
88 contaminated by e-coli An example to create a contamination
89 database is provided in the examplesex_add2contaminationDBsh
90 script The value of the parameter should be the file name prefix of
91 the bowtie index files
92
93 Disable contamination check
94 cont_index=no
95 Default value
96 cont_index=$(data_dir)contaminatione_coli
97
98
99 Misc options
100
101 Number of threads that may be used by IRAP
102 max_threads=1
103
104 Exon level quantification Yes (y)| No (n)
105 exon_quant=y
106
107 Transcript level quantification Yes (y)| No (n)
108 transcript_quant=y
109 =============================================================================
110 full or relative path to the directory where all the data can be found
111 data_dir=data
112
113 the directory should be organized as follows (see directory data in IRAP toplevel
directory)
114
115 $data_dir
116 $data_dir
117 contamination
118 e_coli1ebwt
119 e_coli2ebwt
120 e_coli3ebwt
121 e_coli4ebwt
122 e_coliREADME
123 e_colirev1ebwt
124 e_colirev2eb
125 raw_data
126 $species
127 fastq
128 fastq
129
43
iRAP model of configuration file
130 reference
131 $species
132 $gtf_file
133 $reference
134
135 Notes
136 1) $ denotes the value defined for the variable
137 2) Since version 050 the raw data (fastqbam) files may be
138 distributed across several sub-folders
139
140
141 =============================================================================
142 Only necessary if you intend to perform Differential Expression analysis
143
144 contrasts=contrast_def [contrast_def ]
145 contrasts=purpleVsPink purpleVsGrey
146
147 definition of each constrast
148 contrast= group group [ group ]
149 purlpleVsPink=Purple Pink
150 purlpleVsGrey=Purple Grey
151
152 groups
153 GroupName= Library_name [Library_name ]
154 Purlple=myLib1 myLib2
155 Pink=myLib3
156 Grey=myLib4
157
158 optional parameter used in the report (HTML) generation
159 groups=Purple Pink Grey
160
161 technical replicates
162 technicalreplicates=myLib1myLib2myLib3mylib4
163
164 Note names of groups contrasts and libraries should start with a letter and
contain only alphanumeric characters and the character _
165
166 =============================================================================
167 Data
168
169
170 Information for each library
171 LibName=Fastq file
172 Note
173 1 LibName should start with a letter and contain only alphanumeric characters
and the character _ LibName should not contain in _1 or _2
174 2 LibName should be different from the name of the fastq file for instance
175 f1=f1fastq
176 will produce an error
44
iRAP model of configuration file
177
178 Single-end
179 myLib1=f1fastq
180 read size
181 myLib1_rs=75
182 quality encoding (33 or 64)
183 myLib1_qual=33
184
185 strand specific protocol
186 mylib1_strand=first
187 mylib1_strand=second
188 Default value is both (strands)
189 mylib1_strand=both
190
191 Have the file in a different sub-folder
192 mylib1_dir=somesubfolder
193
194 See SAMBAM specification for more details about the following two parameters
195 read group id (to be included in the BAM file) - this is not supported by all
mappers
196 myLib1_rgid=
197 sambam header lines to include in the BAM file
198 myLib1_shl=COtThis is a commentnCOtand another line
199
200 LibName=Fastq file
201 myLib2=f2fastq
202 read size
203 myLib2_rs=75
204 quality encoding (33 or 64)
205 myLib2_qual=33
206
207
208 Paired-end
209 LibName=Fastq files
210 myLib3=f3_1fastq f3_2fastq
211 read size
212 myLib3_rs=50
213 quality encoding (33 or 64)
214 myLib3_qual=33
215 insert size
216 myLib3_ins=350
217 standard deviation
218 myLib3_sd=60
219
220 LibName=Fastq files
221 myLib4=f4_1fastq f4_2fastq
222 read size
223 myLib4_rs=50
224 quality encoding (33 or 64)
45
iRAP model of configuration file
225 myLib4_qual=33
226 insert size
227 myLib4_ins=350
228 standard deviation
229 myLib4_sd=60
230
231
232
233
234 list the names of your single-end (se) and paired (pe) libraries
235 se=myLib1 myLib2
236 pe=myLib3 myLib4
237 No SE data
238 se=
239 No PE data
240 pe=
241
242
243
244 Passingoverriding parameters
245
246 It is possible to pass parameters to the mappers and quantification
247 methods but that should be done carefully since it may break the
248 pipeline (if the location of the input andor output files is
249 changed)
250
251 Overridingchanging the mappersrsquo parameters
252 _map_options=options
253 Example
254 tophat2_map_options=--min-intron-length 5 --no-coverage-search
255
256 Overridingchanging the parameters of the quantification methods
257 _params=options
258 Example
259 htseq_params= -q
46
Appendix C
iRAP example configuration file
1 minimal configuration file for DE
2 experiment name
3 name=ecoli_ex
4 species
5 species=ecoli_k12
6 reference genome
7 reference=Escherichia_coli_str_k_12_substr_mg1655GCA_000005845119dnatoplevel
fagz
8 gtf file
9 gtf_file=Escherichia_coli_str_k_12_substr_mg1655GCA_000005845119gtfgz
10 Enable filtering based on quality
11 qual_filtering=on
12 Use a contamination data set to filter out reads
13 cont_index=no
14 Toplevel directory with the data
15 data_dir=
16
17 some contrasts
18 GA=Group A
19 contrasts=GAvsGB GBvsGA
20 GAvsGB=GA GB
21 GBvsGA=GB GA
22 GA=FA FB FC
23 GB=FD FE FF
24
25 se=FA FB FC FD FE FF
26
27 FA=SRR933983fastqgz
28 FA_rs=50
29 FA_qual=33
30
31 FB=SRR933984fastqgz
32 FB_rs=50
47
iRAP example configuration file
33 FB_qual=33
34
35 FC=SRR933985fastqgz
36 FC_rs=50
37 FC_qual=33
38
39 FD=SRR933989fastqgz
40 FD_rs=50
41 FD_qual=33
42
43 FE=SRR933990fastqgz
44 FE_rs=50
45 FE_qual=33
46
47 FF=SRR933990fastqgz
48 FF_rs=50
49 FF_qual=33
50 EOF
48
- Front Page
- Table of Contents
- List of Figures
- List of Tables
- 1 Introduction
-
- 11 Context
- 12 Motivation and Goals
- 13 Proposed Solution
- 14 Structure of the Dissertation
-
- 2 Basic Concepts and Bibliographic Review
-
- 21 Biological Basic Concepts
-
- 211 Genome
- 212 Transcriptome Assembly and Gene expression
-
- 22 RNA-Seq Analysis
-
- 221 RNA-Seq microarrays and DNA sequencing
- 222 RNA-Seq Pipeline
-
- 23 Standard File Formats used
-
- 231 FASTA
- 232 FASTQ
- 233 SAM and BAM
- 234 GFF and GTF
-
- 24 Relevant Data Repositories
- 25 Tools for RNA-seq and Differential Analysis
- 26 Relational and Non-relational Databases
- 27 Tecnologies
- 28 Related Work
- 29 Chapter Summary
-
- 3 The Gemini framework
-
- 31 Gemini
- 32 Gemini Architecture
-
- 321 Physical Architecture
-
- 33 Data Management
- 34 Web Interface
- 35 Use cases
- 36 Case studies
-
- 361 Full pipeline
- 362 Stage pipeline
-
- 37 Chapter Summary
-
- 4 Case study
-
- 41 Samples characterization
- 42 Researching objectives
- 43 Protocol of analysis
- 44 Genome version GRCh37 versus GRCh38
- 45 Fusion genes
- 46 Results
-
- 461 Case study with reference genome GRCh37
- 462 Splicing analysis
- 463 Case study with reference genome GRCh38
-
- 47 Chapter Summary
-
- 5 Conclusions and Future Work
- References
- A iRAP tools supported
-
- A1 Mappers
- A2 Quantification
- A3 Differential expression [DE]
- A4 Gene set enrichment analysis [GSE]
-
- B iRAP model of configuration file
- C iRAP example configuration file
-
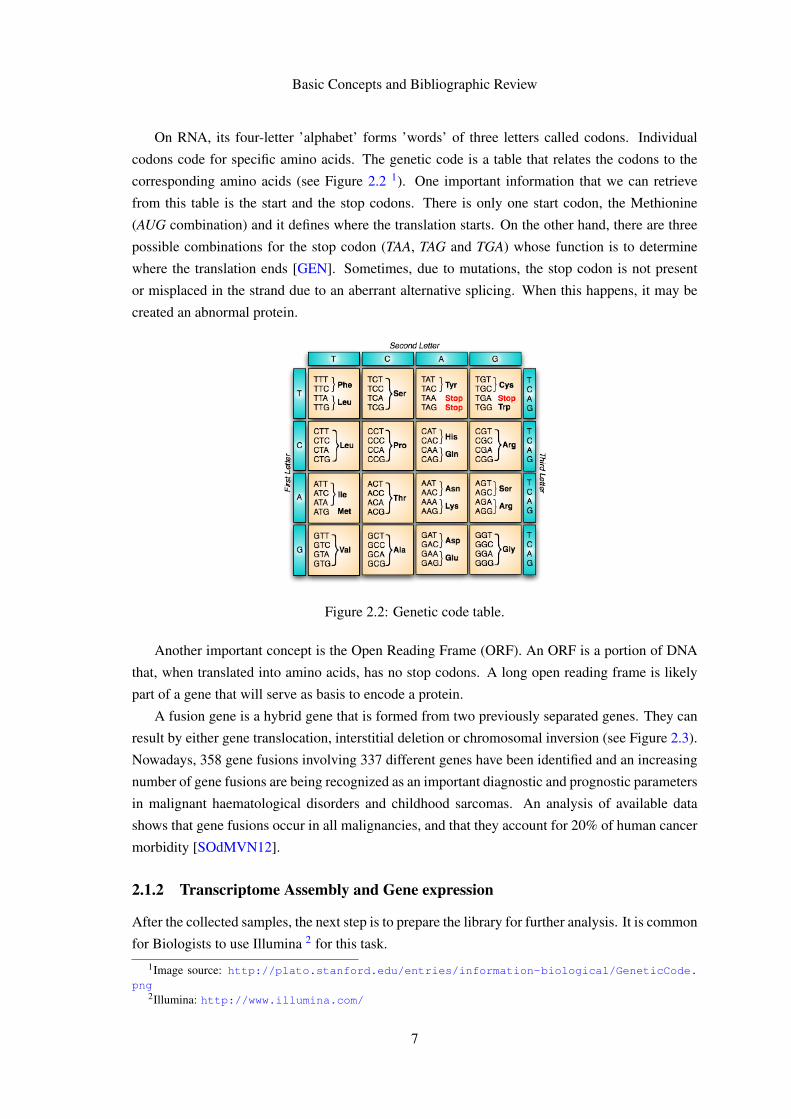
Basic Concepts and Bibliographic Review
Figure 24 The essential workflow for RNA-Seq analysis [kn11]
When no reference genome is available it is necessary to construct a de novo assembly This
step will not be considered here since it was not used on the thesis work Given this we are able to
hold this main concepts
Quality control a pre-processing step where quality of raw reads are assessed At this stage bad
ldquoqualityrdquo ones may be excluded from the data set preventing potential mapping mismatches
and providing a better performance in further states
Read alignment that aligns the (quality filtered) reads to a reference genome in order to recon-
struct the larger sequence
Quantification that summarises and aggregates reads over a biologically meaningful unit such as
exons isoforms or genes
Differential expression that identifies genes expressed being the basis for future assessing of
proteins function originating from such genes
Note that this is just a basis workflow for RNA-Seq analysis that provide the possibility to add
or remove some of the stages according to different purposes
iRAP - A pipeline for RNA-Seq
Usually a combination of different tools might be desirable but on the other side time con-
suming since they depend on each others inputoutput and they are frequently focused in single
purposes hence often incompatible with one another [WMM+11]
10
Basic Concepts and Bibliographic Review
iRAP 5 appears as an integrated solution that allows users to choose and apply their preferred
tools for mapping reads quantifying expression and testing for differential expression [FPMB14]
Figure 25 iRAP pipeline for RNA sequencing analysis
The Figure 25 shows the main steps for this methodology that by comparing with the previous
workflow (Figure 24) has two more stages Gene set enrichment and Web reports Gene set
enrichment is a means of analysing genomic data by studying the effects of groups of genes on a
phenotype rather then individual gene analysis [kn10] Web reports facilitate the inspection of the
results produced at different stages of the analysis by providing web pages with tables or plots of
information [FPMB14]
iRAP is also capable of performing analysis starting at any stage of the pipeline by choosing
the right command line options Currently it has the following five different stage options as
described below
setupstage0 check all directories and data files are present and at the expected place
stage1 quality filtering and reporting check fastq file quality and report
stage2 mapping to the transcriptome or to the genome
stage3 estimate gene expression
stage4 estimate differential expression
Furthermore the expert can choose the specific tool for each phase of the system some of
which are described in detail in further sections The current list of tools supported are available
in Appendix A
When using iRAP the user has the possibility to speed up the analysis by using the irap_lsf
command This method accepts the same parameters as iRAP but splits the analysis into multiple
jobs with the aim of reducing the time to analyze the data
5iRAP repository httpscodegooglecompirap
11
Basic Concepts and Bibliographic Review
23 Standard File Formats used
For the implementation of the previous pipeline some file formats are used to input or retrieve
data Below will be presented the most widely used ones along with some short description and
detail when needed
231 FASTA
FASTA 6 is the definition line and sequence character format used by NCBI 7 It is a text-based for-
mat for representing either nucleotide (DNA or RNA) or amino acid (protein) sequences FASTA
is commonly used since it is easy to manipulate and parse using text-processing tools and scripting
languages Usually in iRAP a FASTA format is used to store the a reference genome
232 FASTQ
FASTQ 8 provides a simple extension to the previous format the ability to store a numeric quality
score associated with each nucleotide in a sequence [CFG+10] It is generally used as the first
input with the raw data
233 SAM and BAM
SAM 9 is a generic format for storing large nucleotide sequence alignments It is easy to under-
stand easy to parse and easy to generate and check for errors Despite the presented qualities
SAM is slow to parse so a binary equivalent to it BAM has been developed to deal with this issue
BAM is used to intensive data processing and is useful in most product pipelines while SAM has
appropriate for interconversion with external applications and exploratory analysis Like FASTQ
BAMSAM formats are widely used as containers for raw sequence data
234 GFF and GTF
GFF 10 is a format for describing genes and other features associated with DNA RNA and Protein
sequences It was originally proposed as a protocol for the transfer of genomic feature information
allowing people to develop and test them without having to maintain a complete feature-finding
system The second version also allows for feature sets to be defined over RNA and Protein
sequences as well as genomic DNA
On the other hand GTF 11 stands for Gene transfer format and has been developed on top
of GFF specification The first eight GTF fields are the same as GFF The group field has been
6FASTA format httpgeneticsbwhharvardedupphFASTAhtml7NCBI httpwwwncbinlmnihgov8FASTQ format httpmaqsourceforgenetfastqshtml9SAM and BAM file formats httpsamtoolssourceforgenetSAMv1pdf
10GFF format httpwwwsangeracukresourcessoftwaregffspechtml11GTF format httpwwwensemblorginfowebsiteuploadgffhtml
12
Basic Concepts and Bibliographic Review
expanded into a list of attributes Each attribute consists of a typevalue pair Attributes must end
in a semi-colon and be separated from any following attribute by exactly one space
24 Relevant Data Repositories
It is important to validate results and test along with the implementation of RNA-Seq pipeline As
such real data are needed so that the quality and efficiency of this study is assessed Some repos-
itories are available online such as Gene Expression Omnibus (GEO 12) Genomic Data Sharing
(GDS 13) ENSEMBL 14 UCSC Genome Browser 15 or the ENCODE Project 16 The three last
ones are highlighted in next section
ENSEMBL
The Ensembl project provides information about many vertebrate and other eucaryotic species
being started in 1999 some years before the draft human genome was completed Until today
many genomes have been added over the years as well as the inclusion of comparative genomics
variation and regulatory data [HBB+02]
Between the included working teams of Ensembl the Genebuild is the one who is responsible
to create the gene sets both as developing and mantaining the BioMart 17 data mining tool
It also supplies a REST server 18 as well as an FTP tool for browse and download data [CAB+15]
UCSC Genome Browser
The UCSC Genome Browser is a website that consists of an open-source tool to browse
analyze and query genomic data Currently it grants access to some reference genomes giving the
possibility to retrieve specific data due to the search tool integrated
Along with this tool it is also available an FTP server where data can be accessed and down-
loaded
ENCODE Project
While ENSEMBL has information about many vertebrate and other species ENCODE is a
project to identify all functional elements in the human genome sequence as well as being able
to create comprehensive high quality catalogs of functional elements in the human genome using
highndashthroughput technologies Their mission is to enable the scientific and medical communities
12GEO httpwwwncbinlmnihgovgeo13GDS httpgdsnihgov02dr2html14ENSEMBL httpwwwensemblorgindexhtml15UCSC Genome Browser httpgenomeucscedu16ENCODE project httpswwwencodeprojectorg17BioMart httpbiomartorg18REST server of Ensembl httprestensemblorg
13
Basic Concepts and Bibliographic Review
to interpret the human genome sequence and apply it to understand human biology and improve
health [The04]
Besides their motivation an online repository is being build up indexing gathered data and
allowing users to query different data types regardless of location [Con11] Some samples can
be found at httpswwwencodeprojectorgexperimentsENCSR274JRR for ex-
ample
25 Tools for RNA-seq and Differential Analysis
To perform the RNA-Seq pipeline some tools for each process are required It is now presented
some set of them on the following sections
Bowtie
Bowtie 19 is a tool to align short reads to the human genome To achieve speed and memory-
efficiency Bowtie aligns reads with the aid of an index of the reference genome [Lan10] and can
take advantage of the use of simultaneous multiple processor cores [LTPS09] For the human
genome Burrows-Wheeler is a commonly used indexing process that this tool extends with a
novel quality-aware backtracking algorithm that permits mismatches
TopHat
TopHat 20 is used as a junction mapping tool for RNA-Seq reads Before TopHat current
mapping strategies could only localize reads to known exons in the genome This tool is a read-
mapping algorithm design to align reads to a reference genome without relying on know splice
sites [TPS09]
Cufflinks
Cufflinks 21 assembles transcripts estimates their abundances and tests for differential ex-
pression and regulation in RNA-Seq samples Internally it is made of four different parts Cuf-
flinks that assembles the package Cuffcompare that compares transcript assemblies to annotation
Cuffmerge that merges two or more transcript assemblies and Cuffdiff that takes the aligned reads
and reports genes and transcripts that are differentially expressed [TRG+12a]
HTSeq
19Bowtie httpbowtie-biosourceforgenetindexshtml20TopHat httpccbjhuedusoftwaretophatindexshtml21Cufflinks httpcole-trapnell-labgithubiocufflinks
14
Basic Concepts and Bibliographic Review
HTSeq 22 is a python framework to facilitate the rapid development of scripts to processing
and analysis of high-throughtput sequencing data
FASTQC
FASTQC 23 is a quality control tool for high-throughput sequencing data It receives as input
BAM SAM or FASTQ files provides a quick overview on which areas there may be problems
summarizes graphs and tables for a fast assess of data and exports results to an HTML based report
Samtools
Samtools 24 is a set of utilities to manipulate alignments in the BAM format (output format of
TopHat eg) It does sorting merging and indexing and allows to retrieve in any regions The
files can be either provided via standard input (stdin) of from a remote FTP or HTTP server
deFuse
deFuse 25 is a software for gene fusion discovery from RNA-Seq data It uses clusters of dis-
cordant paired alignments to inform a split read alignment analysis for finding fusion boundaries
As an output it produces a fully annotated output for each predicted fusion
26 Relational and Non-relational Databases
Relational Databases had been introduced in 1970 by Edgar Codd at IBM Almaden Research
Center [Cod70] It has been used for decades and has brought in the concept of relations With
this a relational database is usually represented by a structured model a table in which each row is
a tuple (also considered as an object) and the columns are the attributes of the tuple The database
can be queried in order to retrieve useful data based on their attributes whether in common between
tuples or not To do so it is used a structured query language SQL [LM10] The main set of
operations is known as CRUD Create Read Update and Delete Relational databases are also
know for their fixed schemas that force every tuple to have the exact same attributes
A very common operation in SQL databases are joins Joins are a way to associated data that
share attributes or are somehow related One example is imagining a table of people that have
bank accounts associated and there is another table where the existing banks are described A way
to relate them is to combine these two tables in order to directly view which individual is using
which bank This is a very simple example that can scale very quickly and become a dangerous
operation for the consumed resources to be used to compute the needed relationships
22HTSeq httpwww-huberembldeHTSeqdocoverviewhtml23FASTQC httpwwwbioinformaticsbabrahamacukprojectsfastqc24Samtools httpsamtoolssourceforgenet25deFuse httpsbitbucketorgdranewdefuse
15
Basic Concepts and Bibliographic Review
In contrast with the previous set a Non-relational database commonly doesnrsquot have a fixed
schema and avoid the previous complex operation Within this class of databases there are different
approaches to the used models such as key-value stores big table clones document databases and
graph databases Each of them is used accordingly to the data set complexity
MongoDB 26 is a non-relational database schemaless and is scalable in cluster performance
and data This way it provides a way to store large data sets with the freedom of using different
schemas according to data 27
27 Tecnologies
When developing a web service there are some basic resources and programming languages used
HTML 28 is a standard markup language for describing web documents CSS 29 is used for
defining how the HTML elements are to be displayed Bootstrap 30 is a free front-end frame-
work for faster and easier web development and contains HTML and CSS based design patterns
Javascript 31 serves as a method for programming the behavior of web pages jQuery 32 is a library
of Javascript that greatly specifies Javascriptrsquos usage
Even though commonly used PHP 33 is not the best suitable language for our thesis work
When compared to Python it lacks security and is not used on the Bioinformatics field On the
other hand Perl has been greatly used on this field but it is currently being replaced by Python 34
Furthermore this last one has libraries like BioPython 35 for internal processing of samples and
also has support to web through frameworks like Django 36 or BottlePy 37
Even though Django is trending it has no support for NoSQL relational databases yet Bot-
tlePy for instance is a lightweight web framework simple to use and provides the ability to use
MongoDB
Concerning the situation the combination of Python and BottlePy is the most suitable since it
has
bull Starting to replace Perl in bioinformatics processing
bull Support for NoSQL databases (either the framework and the programming language)
bull Lightweight usage
26MongoDB httpwwwmongodborg27MongoDB scalability httpwwwmongodbcommongodb-scale28HTML httpwwww3schoolscomhtml29CSS httpwwww3schoolscomcssdefaultasp30Bootstrap httpgetbootstrapcom31Javascript httpwwww3schoolscomjs32jQuery httpsjquerycom33PHP httpphpnet34Python httpswwwpythonorg35BioPython httpbiopythonorgwikiMain_Page36Django framework httpswwwdjangoprojectcom37BottlePy httpbottlepyorgdocsdevindexhtml
16
Basic Concepts and Bibliographic Review
Figure 26 Print screen of Galaxy when trying to get data from UCSC
For the purpose of sending the information between devices the FTP server solution was
analysed It allows the creation of an administrator user that has the permissions for writing and
reading but also for anonymous users that can only download data
28 Related Work
Galaxy
Galaxy 38 is an open source web-based platform for data intensive biomedical research
It consists of an embedded website system that provides access to different databases such
as Ensembl or UCSC Genome Browser Although functional the platform has not a consistent
interface which requires the user to learn to use many systems within it An example of this
situation can be viewed in Figure 26 Furthermore it does not provide the ability to choose easily
a stage pipeline like iRAP or to run a full one with personalized tools
BioMart Central Portal
BioMart 39 is a community-driven project to provide unified access to distributed research data
to facilitate the scientific discovery process
38Galaxy httpgalaxyprojectorg39BioMart Central Portal httpcentralbiomartorgsequencegui=Sequence_retrievalamp
mart=metaseq_mart_63_config
17
Basic Concepts and Bibliographic Review
It currently has a sequence retrieval tools that provides searching by database and dataset
Nowadays this tool offers Ensembl as the only available database but it adds up three other fea-
tures like a sequences filters and header information panels where the users can improve their
search
29 Chapter Summary
In this chapter we presented and discussed the technologies suitable for the thesis work We have
surveyed alternative technologies for gene expression computation and alternative splicing tools
The technologies are relevant to solve the Biological domain problem We have also surveyed
the tools for the development of websites and databases to store the data used when solving the
biological problems In the next chapter we describe work in detail
18
Chapter 3
The Gemini framework
Despite the very large number of tools available for Molecular Biology problems they are most
often difficult to use and require sophisticated computational resources As part of the thesis
work we have developed a framework that allows expert users to make RNA-Seq and alternative
splicing analysis using a user friendly web interface and sophisticated computational resources
In this chapter we describe that framework that include the website database resources for storing
data and the computational settings for the analysis
iRAP has been chosen to accomplish the automation of RNA sequencing analysis due to the
simplicity of use and its wide number of tools available for its task Since it is an integrated
tool platform its installation requires not only powerful computer resources but also a long list of
basic equipment necessary to each of them Considering these issues it had not always been easy
to setup the wanted work environment
Despite the difficulties of this scenario we have been able to complete the setup of this tool
and make some control experiments with it
In order to accomplish an iRAP execution a configuration file must be provided (see Ap-
pendix B) Along with the experiment name the name of species being analysed the reference
genome and read data files need to be specified and made available Furthermore the specific
tools for each stage of the pipeline need also to be specified among other possible variables
It is not easy and usually very time consuming for a Biologist to create the configuration file or
to run the command-line interface that controls iRAP pipeline Since this system is a combination
of many different tools there are a long list of available options that may be fulfilled Some of
them are mandatory while other ones are optional After this setting is completed it must be saved
in a text file and made available to run iRAP
Even though the usage of iRAP does not require extensive bioinformatics expertise it does
assume familiarity with UNIX command-line interface which would narrow down the target audi-
ence In order to overcome this situation we designed and developed a framework called Gemini
19
The Gemini framework
that includes a Graphical User Interface and makes RNA-Seq studies much more easy to perform
We have also included extra features for doing more analysis to RNA-Seq data
31 Gemini
Due to the lack of intuitiveness on the process of generating the configuration file it has been
created a more user friendly one through a web form This form asks for input of the main settings
to call a very simple experiment with a commonly used bacteria escherichia ecoli (e coli)
Another important feature is the possibility to fill the form asking what is the stage that the user
wants the pipeline to start with
Another issue was to find and easily download a reference genome for a certain species In
order to add completeness to Gemini and also to simplify the process of download it has been
implemented the functionality to download the reference genome (both fasta and annotation files)
It is used the Ensembl API to obtain the required results The jobs status feature lists the status of
jobs sent by the user for execution
Besides these features one more have been added even though not completed It is the job
results where it is presented the results collected for a determined task
32 Gemini Architecture
321 Physical Architecture
Gemini is divided into two different sets The first one is where the web application is hosted as
well as the database Since dealing with genomic data often requires great computer performance
processing experiments is accomplished in an independent server that later responds with results
Figure 31 Physical architecture of Gemini
Data scheme
MongoDB is NoSQL document based database The information is organized in collections
in which each element is stored as a JSON document NoSQL databases are simpler to use when it
20
The Gemini framework
comes to have different information fields in the same document and at the same time they have
better performance and scalability [SK11] Currently the information is arranjed in two collections
scheme as described on Table 31
Name DescriptionAccounts Stores the users dataJobs Stores the experiments dataTable 31 Collections used to store data
Accounts
An accountrsquos document stores an userrsquos email password and a unique identifier A role has
also been saved for future hierarchy creation in which some levels will grant more permissions
than others like changing accounts settings of other participants
1
2 _id ObjectId(54f5a9b234f76511a82ec3b2)
3 password e10adc3949ba59abbe56e057f20f883e
4 role user
5 email acgggomesgmailcom
6
Jobs
Jobs are related to an user and have the name and description of the experiment It also
stores the reference genomersquos location as well as the readsrsquo one Likewise the date of creation is
preserved When a job is completed the status is modified to finished
1
2 _id ObjectId(5544ecf134f7651d687bba94)
3 name ExpFinal
4 exp_dir data54f5a9b234f76511a82ec3b2ExpFinalreads
5 user 54f5a9b234f76511a82ec3b2
6 description Final test
7 genome_dir genomesEscherichia coli
8 status started
9 date ISODate(2015-05-02T152745249Z)
10
21
The Gemini framework
33 Data Management
In order to create a new job it is required two sets of data namely reference files and raw data
files The raw data is the actual data being analysed while the reference genome serves as basis to
the alignment or control
The typical workflow consists on the expert providing the experience and species names as
well as the raw data that was previously collected in the laboratory Afterwards through a step by
step system the user has the option to choose the reference genome to be used on the experiment
This last files are internally obtained from different FTP servers such as Ensembl and ENCODE
stored locally and reused in further usages
The provided information is then saved in the database and the files stored hierarchically We
use the following sequence of ltsection namegt ltuseridgt ltexperience namegt ltdata filesgt The
ltsection namegt can be conf for storing configuration files data for saving the reads or refer-
ence for keeping the reference genome and annotation files The ltuseridgt is the ID of Accounts
database document and the ltexperience namegt is the same as name in Jobs database document
A directory tree is represented in Figure 32
Figure 32 File system tree demonstrating the hierarchy of saved data files
This information is then passed to the server via a local FTP server that has been created
22
The Gemini framework
for this purpose We have followed an online tutorial 1 for the configuration From this we
created one administrator that has permissions for writing and reading files and we also authorized
anonymous login that may only retrieve files This way on the web application the admin user
creates the reads reference genomes annotation and configuration files On the computational
server an anonymous user authenticates for retrieving the files according to the filenames received
via API
The inside directory of FTP follows the hierarchy of ltuseridgt ltexperience namegt ltdata
filesgt where ltuseridgt is the ID on the Accounts document and ltexperience namegt is the name
on Jobs document When the server is prompted to run an experience it downloads the required
data from the FTP and runs iRAP with the necessary configuration options
34 Web Interface
For the implementation of Gemini python has been used for backend along with a simple fast and
lightweight WSGI micro web-framework called BottlePy 2 It has no dependencies and grants the
main functionalities such as routing templates some class utilities and a built-in server
The first screenshot (Figure 33) shows the home page of Gemini There is top menu bar with
two possible interactions login and register There is also a simple content box that describes the
main features and status of development of the platform Later on a new menu appears with the
possibility to logout on the Welcome tab (as in Figure 34)
Figure 33 Home page
Figure 34 Logout menu
1Tutorial available at httpswwwthomas-krenncomenwikiSetup_FTP_Server_under_Debian
2BottlePy httpbottlepyorgdocsdevindexhtml
23
The Gemini framework
The main feature of the system is the create job (Figure 35) option that is easily accessible on
top menu When the user clicks on it a form is displayed with the variables to introduce on the
configuration file that iRAP needs A description option has been added to provide the freedom to
the researcher to include some extra information that he finds useful
Figure 35 Create job form
The same type of form was used for the reference genomes section (Figure 36) The user is
prompted to choose orderly the species name release number and version Afterwards a table of
elements appears allowing the expert to download the files found
Figure 36 Reference genomes component
24
The Gemini framework
35 Use cases
Gemini was designed to have only one actor the user that will accomplish the experiments This
actor has the possibility to register login and logout of his account create a job and the hability
to download a reference genome of his choice Even though not fully implemented it has been
considered the jobs done functionality
Figure 37 Use cases diagram
36 Case studies
Some case studies with e coli in order to test iRAPrsquos installation and its capabilities For both
of the case studies it has been collected six samples of Escherichia coli reads from European
Nucleotide Archive 3 and the corresponding reference genome and annotation file from Ensembl
361 Full pipeline
In order to call the full pipeline iRAP has been tested with the directive irap conf=ecoli_exconf
Configuration file (ecoli_exconf ) content is as described in Appendix C In this task the system
received the reads and performed the quality control (QC) mapping quantification and differential
expression between the two groups of samples
3ENA httpwwwebiacukena
25
The Gemini framework
This test has been accomplished successfully
362 Stage pipeline
The stage pipeline is a powerful functionality since it allows the user to choose a specific stage of
the pipeline that he wants to execute for his samples
Besides the fact that it is not easy to collect data samples users often want to repeat or analyse
just one step of the pipeline and take some conclusions of it Furthermore this type of pipeline is
less time consuming
A concrete usage example is IPATIMUPrsquos data which contains the output information of the
mapper TopHat and will be further analysed in detail in Chapter 4 Concerning this setup it would
not be possible to call the full pipeline but instead it would require a command specific command
option
For validation purposes the same bacteria from the previous analysis has been used for the
stage pipeline case After calling the setup command to check input the directive irap conf=
ecoli_exconf quality_filtering_and_reporting has been used to perform the stage1
of iRAP The platform was able to perform with success this task
37 Chapter Summary
It has been used Python with BottlePy for the main implementation of the interface of Gemini
MongoDB has been chosen for dealing with information A FTP server was mounted for the
transitions of data between the client and the server The platform allows the expert to call a full or
stage pipeline analysis and provides the download of both fast and annotation files The essential
items are setup for the addition of further functionalities
26
Chapter 4
Case study
In this chapter it is going to be presented the Case Study with data from samples of thyroid carci-
noma along with their charactering and researching results
After the development of an interface to the iRAP tool the following step was to do a case
study with some realistic DNA samples of thyroid cancer patients regarding the partnership with
IPATIMUPrsquos researchers
The purpose of this case study was to do some research of potential differences between dis-
tinct types of the disease In order to accomplish this four samples were collected from Centro
Hospitalar de Satildeo Joatildeo (Porto) Cases 1 and 2 have been categorized as a widely invasive Fol-
licular Thyroid Carcinoma (wFTC) and cases 3 and 4 as a minimally invasive Follicular Thyroid
Carcinoma (mFTC)
41 Samples characterization
Patient from case 1 was female with 82 years old the tumour measuring 2 cm of size and presented
a predominant follicular growth pattern and oncocytic features Patient from case 2 was male with
55 years old the tumour measuring 5 cm of size and presented a predominant solidtrabecular
growth pattern For the group of mFTC patient from case 3 was female 56 years old the tumour
measuring 37 cm of size and with follicular growth pattern patient from case 4 was female 56
years old the tumour measuring 4 cm of size and with follicular growth pattern
42 Researching objectives
The aim of the study was to answer the following questions
bull Differentially expressed genes
bull Total isoforms found either in percentange and in absolute
27
Case study
bull Average of alternative isoforms for each gene spliced
bull Potentially novel isoforms and how do they behave between samplesgroups of samples
bull Compare results between versions of human genome assembly
bull Retrieve fusion genes
43 Protocol of analysis
Collected sample reads have been aligned against reference genome GRCh37 with TopHat version
141 Posterior analysis followed Tuxedo Protocol as described in Trapnell et al [TRG+12b] An
overview of the full protocol can be found in Figure 41
For the implementation of this procedure it were considered as two different groups the cases
1 and 2 (wFTC) against cases 3 and 4 (mFTC) The following step was to assemble transcripts for
each sample with Cufflinks 1 and afterwards create a single merged transcriptome annotation with
Cuffmerge 2 Cuffdiff 3 was then used to find significant changes in transcript expression
In order to find potential isoforms each sample was ran against the reference genome with
Cuffcompare 4
44 Genome version GRCh37 versus GRCh38
Even though IPATIMUPrsquos data have been assembled with reference genome version GRCh37
nowadays a more recent version (GRCh38) has been released in 2013 This new assembly is the
first major revision of the human genome in more than four years 5
The main differences between this two versions are
Alternate sequences several human chromosomal regions have sufficient variability to prevent
adequate representation by a single sequence This new version provides alternate sequence
for selected variant regions through the inclusion of alternate loci 6 scaffolds
Centromere 7 representation Previous method of representing centromeric regions have been
replaced by sequences from centromere models The models provide the approximate repeat
number and order for each centromere and are useful for read mapping and variation studies
Mitochondrial genome The new mitochondrial reference sequence is the Revised Cambridge
Reference Sequence with RefSeq accession number NC_0129201 The previous one was
RefSeq accession number NC_001907 which was not updated when GRCh37 assembly
later transitioned to the new version1Cufflinks httpcole-trapnell-labgithubiocufflinks2Cuffmerge httpcole-trapnell-labgithubiocufflinkscuffmergeindexhtml3Cuffdiff httpcole-trapnell-labgithubiocufflinkscuffdiffindexhtml4Cuffcompare httpcole-trapnell-labgithubiocufflinkscuffcompareindexhtml5As in UCSC mailing list at httpsgroupsgooglecomasoeucsceduforumtopic
genome-announce52Kv41YBXNY6Specific location of a gene on a chromosome
28
Case study
Figure 41 An overview of the Tuxedo Protocol with full steps TopHat for alignment Cufflinkspackage to find differential features between group samples and in the end CummeRbund to plotprevious results
Sequence updates Several erroneous bases and misassembled regions have been corrected and
more than 100 gaps have been filled or reduced
Analysis set The new assembly offers an analysis set that was created to accommodate next
generation sequencing read alignment pipelines Several GRCh38 regions have been elimi-
nated from this set to improve read mapping
29
Case study
45 Fusion genes
After we done some research on the technologies used for finding fusion genes in the reads we
have not been able to perform the analysis to answer the last question of our researching objectives
DeFuse required as input the original reads which were not provided This analysis would have
been interesting for relating the ocurrence of thyroid and the presence of fusion genes as well as if
there was any relevant difference between the samples of wFTC and mFTC
46 Results
461 Case study with reference genome GRCh37
The following table ( 41) demonstrates some genes that were differentially expressed with signif-
icance between mFTC and wFTC According to Celestino et al 8 CRABP1 C1QL1 and LCN2
are biomarkers of thyroid cancer and predictors of extrathyroidal extension It is commonly used
the value of 005 has threshold above which the differential expression is significant By inspect-
ing out the table we can find C1QL1 with a q-value of 0000555 and CRABP1 with a q-value
of 159E-11 which are in concordance with the previous article Furthermore it is verified the
increased gene expression in wFTC when compared to mFTC
Gene ID Gene Chr mFTC wFTC Fold change(log2) Q value
ENSG00000167748 KLK1 19 018672 111924 922742 0ENSG00000104725 NEFL 8 00196645 276961 104599 0ENSG00000174145 KIAA1239 4 00307388 144265 887444 0ENSG00000182379 NXPH4 12 008307 195786 788074 0ENSG00000131094 C1QL1 17 0121453 238957 429828 0000555ENSG00000142677 IL22RAI 1 150905 0384783 -529345 0ENSG00000138615 CILP 15 423569 0052726 -632793 241E-11ENSG00000141431 ASXL3 18 18938 001408 -707148 124E-09ENSG00000166426 CRABP1 15 748375 0367899 -766831 159E-11ENSG00000214145 LINC00887 3 19797 0119327 -737421 0000459
Table 41 Genes differentially expressed between minimally invasive follicular thryoid carcino-mas (mFTCs) and widely invasive follicular thyroid carcinomas (wFTCs)
In response to the previous researching objectives the Table 42 has the statistical results for
taks two and three From the data analysis we could conclude that less than 1 of genes have
isoforms but each one has an average of 389 alternatives
8Ricardo Celestino Torfin Nome Ana Pestana Andreas M Hoff Pedro A Gonccedilalves Catarina Eloy Eva SigstadRagnhild A Lothe Trine Bjoslashro Manuel Sobrinho-Simotildees Rofl I Skotheim Paula Soares CRAPBP1 C1QL1 andLCN2 are biomarkers of thyroid cancer and predictors of extrathyroidal extension subbmited for publication
30
Case study
Total genes 63896Total significant isoforms 689Total unique genes with isoforms 179Ratio of unique genes with isoformsgenes () 028Average of alternatives per gene with isoforms 389
Table 42 Statistical results for researching objectives number 2 and 3
462 Splicing analysis
Forward in the analysis Cuffcompare 9 has been used to search for novel isoforms when com-
pared to the reference genome The method was to compare each sample to the reference genome
and afterwards make an overlap of the results The main objective was then to infer about the
differences among wFTC and mFTC
Sample 1(wFTC)
Sample 2(wFTC)
Sample 3(mFTC)
Sample 4(mFTC)
Total genes 30440 36862 35539 37534Potential novel isoforms 7406 8450 8781 8830Table 43 Potential novel isoforms for each sample of IPATIMUPrsquos data
As demonstrated on Table 43 average there is a percentage of 24 of potentially novel iso-
forms found (at least one spliced junction is shared with a reference transcript) There is been
made an overlap of the results in order to encounter differences between wFTC and mFTC The
Table 44 presents the counting of differences between cases A brief analysis allows us to say
that we can not make any relationship between wFTC and mFTC On average there was a total of
3722 changes among this two sets The average within the sets are 3554 for wFTC and 3992 for
mFTC Given this results there was not a significant divergence to allow us to relate the splicing
and the occurrence of a more invasive Thyroid Carcinoma
Sets ChangesS1 S2 3554S1 S3 3609S1 S4 3612S2 S3 3847S2 S4 3820S3 S4 3929
Table 44 Number of differences between samples Syntax used S1 - Sample 1 S2 - Sample 2S3 - Sample 3 and S4 - Sample 4
9Cuffcompare httpcole-trapnell-labgithubiocufflinkscuffcompareindexhtml
31
Case study
463 Case study with reference genome GRCh38
In order to respond to the last research objective it has been applied the method of analysis has
before with a more recent human genome assembly After using the same protocol with Cufflinks
Cuffmerge and Cuffdiff sequentially we have come to some conclusions
The produced results of differential expression analysis for the same genes were very different
Genes that were highly significant before like C1QL1 and CRABP1 now had no relevance (q-
value gt 005) As mentioned before we had only access to TopHatrsquos output that used version
GRCh37 for the alignment and mapping process so we could not start from scratch the analysis
This outcome demonstrates two topics in particular
1 the introduction of novel annotations can make previous analysis outdated
2 there is the need to save the original reads in order to update earlier studies
The solution to this situation would have been to use the original reads to repeat the assembly
and then follow the Tuxedo protocol to collected correct and updated differential expression data
47 Chapter Summary
These section of development has been introduced in order to confer not only validation but also
to do some researching studies on the subject Four samples were collected and divided into two
distinct groups Tuxedo protocol was followed for responding to the research objectives The
case study for GRCh37 demonstrated the expression of C1QL1 and CRABP1 on wFTC when
compared to mFTC as indicated in the referred article On the other hand the same protocol when
applied with GRCh38 demonstrated the importance of saving the original reads and what is the
influence of newer releases in previous researching results Lastly the splicing analysis results did
not show any evidence of related isoforms count and the manifestation of the different stages of
the disease
32
Chapter 5
Conclusions and Future Work
The research of genomic-based cancers require highly complex data analysis Such analysis re-
quire most often the use of a large number of complex computational resources the gathering
of a lot of information over the Internet and the use of powerful computational resources Fur-
thermore the manipulation of the computational tools and resources require the assistance of an
informatics expert
The thesis work is a contribution towards the solution of the above mention problem We
propose and developed a framework that enables an expert biologist to perform genomic-based
complex analysis in a easy way and using the required powerful computational resources in a
transparent way
Using the developed framework we have used real data to address several research questions
provided by IPATIMUPrsquos researchers Firstly with the human genome GRCh37 we identified
two of the biomarkers of thyroid cancer by differential gene expression analysis Secondly we
found 689 significant isoforms 179 unique out of 63896 genes (ratio of 028) with an average
of 389 isoforms per gene Thirdly when trying to determine potential novel isoforms we came
at no conclusion of the differences of expression when comparing wFTC and mFTC The last
case was applying the Tuxedo protocol with the new GRCh38 on samples The outcome of the
experiment revealed the importance of saving the original reads and that newer releases become
previous analysis outdated
Future Work
This thesis work is just a starting point As stated before the framework was designed so it can be
extended with further modules to enable addressing other research questions
The case studies also showed us that RNA-seq analysis is very time consuming On the other
hand there are a lot of sub-tasks that can be run in parallel (like the task of aligning the reads)
33
Conclusions and Future Work
We will study and compare different techniques and opportunities to make RNA-seq in parallel as
much as possible
34
References
[bNE] Scitable by Nature Education Transcriptome available at httpwwwnaturecomscitabledefinitiontranscriptome-296 last accessJanuary 2015
[CAB+15] Fiona Cunningham M Ridwan Amode Daniel Barrell Kathryn Beal Konstanti-nos Billis Simon Brent Denise Carvalho-Silva Peter Clapham Guy CoatesStephen Fitzgerald Laurent Gil Carlos Garciacutea Giroacuten Leo Gordon ThibautHourlier Sarah E Hunt Sophie H Janacek Nathan Johnson Thomas Juette-mann Andreas K Kaumlhaumlri Stephen Keenan Fergal J Martin Thomas MaurelWilliam McLaren Daniel N Murphy Rishi Nag Bert Overduin Anne ParkerMateus Patricio Emily Perry Miguel Pignatelli Harpreet Singh Riat DanielSheppard Kieron Taylor Anja Thormann Alessandro Vullo Steven P WilderAmonida Zadissa Bronwen L Aken Ewan Birney Jennifer Harrow Rhoda Kin-sella Matthieu Muffato Magali Ruffier Stephen MJ Searle Giulietta SpudichStephen J Trevanion Andy Yates Daniel R Zerbino and Paul Flicek Ensembl2015 Nucleic Acids Research 43(D1)D662ndashD669 2015
[CFG+10] Peter J A Cock Christopher J Fields Naohisa Goto Michael L Heuer and Peter MRice The Sanger FASTQ file format for sequences with quality scores and theSolexaIllumina FASTQ variants Nucleic acids research 38(6)1767ndash71 April2010
[CH07] Geoffrey M Cooper and Robert E Hausman The Cell - A molecular approachAmerican Society for Microbiology 2007
[Cod70] E F Codd A relational model of data for large shared data banks Communica-tions of the ACM 13(6)377ndash387 June 1970
[Con11] The ENCODE Project Consortium A userrsquos guide to the encyclopedia of DNAelements (ENCODE) PLoS biology 9(4)e1001046 April 2011
[FMB14] N A Fonseca J A Marioni and A Brazma RNA-seq gene profiling - a system-atic empirical comparison Technical report May 2014
[FPMB14] Nuno A Fonseca Robert Petryszak John Marioni and Alvis Brazma irap - anintegrated rna-seq analysis pipeline bioRxiv 2014
[GCW+10] Qiang Gan Iouri Chepelev Gang Wei Lama Tarayrah Kairong Cui Keji Zhaoand Xin Chen Dynamic regulation of alternative splicing and chromatin structurein Drosophila gonads revealed by RNA-seq Cell research 20(7)763ndash83 July2010
35
REFERENCES
[GEN] GENIE Dna genes and chromossomes University of Leicesteravailable at httpwww2leacukdepartmentsgeneticsvgecschoolscollegestopicsdna-genes-chromosomes last access Jan-uary 2015
[Gri] Malachi Griffith Bioinformatics for Cancer Genomics (BiCG)available at httpbioinformaticscaworkshops2012bioinformatics-cancer-genomics-bicg last access January 2015
[GTBK11] Angela Goncalves Andrew Tikhonov Alvis Brazma and Misha Kapushesky Apipeline for RNA-seq data processing and quality assessment Bioinformatics (Ox-ford England) 27(6)867ndash9 March 2011
[HBB+02] T Hubbard D Barker E Birney G Cameron Y Chen L Clark T CoxJ Cuff V Curwen T Down R Durbin E Eyras J Gilbert M HammondL Huminiecki A Kasprzyk H Lehvaslaiho P Lijnzaad C Melsopp E Mon-gin R Pettett M Pocock S Potter A Rust E Schmidt S Searle G SlaterJ Smith W Spooner A Stabenau J Stalker E Stupka A Ureta-Vidal I Vastrikand M Clamp The ensembl genome database project Nucleic Acids Research30(1)38ndash41 2002
[HBD+13] R Hitzemann D Bottomly P Darakjian N Walter O Iancu R SearlesB Wilmot and S McWeeney Genes behavior and next-generation RNA se-quencing Genes Brain Behav 12(1)1ndash12 Feb 2013
[Ins] National Human Genome Research Institute Transcriptome available at httpwwwgenomegov13014330 last access January 2015
[Joh03] Jason M Johnson Genome-wide survey of human alternative pre-mrna splicingwith exon junction microarrays Science 3022141ndash2144 December 2003
[kn10] Gene set enrichment a problem of pathways Briefings in functional genomics9(5-6)385ndash90 December 2010
[kn11] Overview of available methods for diverse RNA-Seq data analyses Science ChinaLife sciences 54(12)1121ndash8 December 2011
[Lan10] Ben Langmead Aligning short sequencing reads with Bowtie Current proto-cols in bioinformatics editoral board Andreas D Baxevanis [et al] Chapter11Unit 117 December 2010
[LM10] Adam Lith and Jakob Mattsson Investigating storage solutions for large data - acomparison of well performing and scalable data storage solutions for real timeextraction and batch insertion of data Masterrsquos thesis 2010
[LTPS09] Ben Langmead Cole Trapnell Mihai Pop and Steven L Salzberg Ultrafastand memory-efficient alignment of short DNA sequences to the human genomeGenome biology 10(3)R25 January 2009
[ORY10] Alicia Oshlack Mark D Robinson and Matthew D Young From RNA-seq readsto differential expression results Genome biology 11(12)220 January 2010
[SG15] Marc W Schmid and Ueli Grossniklaus Rcount simple and flexible RNA-Seqread counting Bioinformatics 31(3)436ndash437 February 2015
36
REFERENCES
[SK11] Christof Strauch and Walter Kriha NoSQL databases Lecture Notes StuttgartMedia University February 2011
[SOdMVN12] Mikhail Shugay Intildeigo Ortiz de Mendiacutebil Joseacute L Vizmanos and Francisco JNovo Genomic hallmarks of genes involved in chromosomal translocations inhematological cancer PLoS Comput Biol 8(12)e1002797 12 2012
[The04] The ENCODE Project Consortium The ENCODE (ENCyclopedia Of DNA Ele-ments) Project Science (New York NY) 306(5696)636ndash40 October 2004
[TPS09] Cole Trapnell Lior Pachter and Steven L Salzberg TopHat discovering splicejunctions with RNA-Seq Bioinformatics (Oxford England) 25(9)1105ndash11 May2009
[TRG+12a] Cole Trapnell Adam Roberts Loyal Goff Geo Pertea Daehwan Kim David RKelley Harold Pimentel Steven L Salzberg John L Rinn and Lior Pachter Dif-ferential gene and transcript expression analysis of RNA-seq experiments withTopHat and Cufflinks Nature protocols 7(3)562ndash78 March 2012
[TRG+12b] Cole Trapnell Adam Roberts Loyal Goff Geo Pertea Daehwan Kim David RKelley Harold Pimentel Steven L Salzberg John L Rinn and Lior Pachter Dif-ferential gene and transcript expression analysis of RNA-seq experiments withTopHat and Cufflinks Nature protocols 7(3)562ndash78 March 2012
[WMM+11] Ying Wang Gaurang Mehta Rajiv Mayani Jingxi Lu Tade Souaiaia YanghoChen Andrew Clark Hee Jae Yoon Lin Wan Oleg V Evgrafov James AKnowles Ewa Deelman and Ting Chen RseqFlow workflows for RNA-Seq dataanalysis Bioinformatics (Oxford England) 27(18)2598ndash600 September 2011
[Wol13] Jochen B W Wolf Principles of transcriptome analysis and gene expressionquantification an rna-seq tutorial Molecular Ecology Resources 13(4)559ndash5722013
[ZW09] Mark Gerstein |amp Michael Snyder Zhong Wang Rna-seq a revolutionary tool fortranscriptomics Nature Reviews Genetics 1057ndash63 January 2009
37
REFERENCES
38
Appendix A
iRAP tools supported
A1 Mappers
Mapper Option name (mapper)TopHat 1 tophat1TopHat 2 tophat2SMALT smaltGSNAP gsnapSOAPsplice soapspliceBWA bwa1BWA bwa2Bowtie 1 bowtie1Bowtie2 bowtie2GEM gemSTAR starOSA osaMapSplice mapsplice
A2 Quantification
Quantifier Option name (quant_method)FluxCapacitor flux_capHT-Seq (union mode) htseq1HT-Seq (intersection non-empty mode) htseq2Cufflinks 1 (try to find novel transcripts-g) cufflinks1Cufflinks 2 (try to find novel transcripts-g) cufflinks2Cufflinks 1 (do not assemble novel transcripts-G) cufflinks1_ndCufflinks 2 (do not assemble novel transcripts-G) cufflinks2_ndNURD nurd
39
iRAP tools supported
A3 Differential expression [DE]
Method Option name (de_method)DESeq deseqDESeq2 deseq2EdgeR edgerCuffdiff 1 cuffdiff1Cuffdiff 2 cuffdiff2
A4 Gene set enrichment analysis [GSE]
Tool Option name (gse_tool)Piano piano
40
Appendix B
iRAP model of configuration file
1 This is a comment (lines that start with a are ignored by iRAP)
2 =============================================================================
3 name that you want to give to the experiment (no spaces)
4 All files produced by irap will be placed in a folder with the given name
5 name=myexp
6
7
8 =============================================================================
9 name of the species
10 species=homo_sapiens
11
12 =============================================================================
13 Fasta file with the reference genome
14 reference=Homo_sapiensGRCh3766dnafa
15
16 =============================================================================
17 GTF file with the annotations
18 gtf_file=Homo_sapiensGRCh3766gtf
19
20 =============================================================================
21 IRAP options (may be providedoverriden in the command line)
22
23
24 Mapper
25 mapper=
26
27
28 Quantification method
29 quant_method=
30
31
32 Dif expression method
33 Requires contrasts to be defined (see below)
41
iRAP model of configuration file
34 de_method=
35
36
37 Gene set enrichment (GSE) analysis
38 Requires de_method to be defined
39 Tool to use (none|piano)
40 gse_tool=piano
41
42 gse_method (mean|median|sum|fisher|fisher-exact|stouffer|tailStrength|wilcoxon|
reporter|page) see Piano vignete documentation for more details
43 gse_method=fisher
44 gse_pvalue=005
45 Minimum number of genes in a gene set
46 gse_minsize=3
47
48
49
50 TSV file with gene annotation
51 Format IDNamelocussourcelnameGOGOtermKEGG
52 Description
53 ID=gene_id (this is mandatory and should match the one given in the gtf file)
54 Name=gene name
55 locus=chrstart--end
56 source=biotype
57 lname=gene name
58 GO=go ids (multiple values can be separated by)
59 GO=GO terms (multiple values can be separated by)
60 KEGG=Kegg ids (multiple values can be separated by)
61 If auto is defined then iRAP will try to generate the file
62 - this may take a considerable amount of time and will only work
63 for a reduced number of species
64 off - default value
65 annot_tsv=
66
67
68 QC
69 Check data (reads) quality (on|off|none)
70 on - reads are filtered out based on their quality
71 off - the quality of the reads is assessed but no filtering is done
72 none- no quality control is performed
73 qual_filtering=on
74
75 Trim all reads to the minimum read size after quality trimming - Yes (y)| No (n)
76 only applicable if qual_filtering is on
77 trim_reads=y
78
79 Minimum base quality accepted (def 10)
80 min_read_quality=10
81
42
iRAP model of configuration file
82 Contamination check (cont_index parameter) Reads that likely
83 originate from organisms other than the one under study can be
84 discarded during pre-processment of the reads This is done by
85 aligning the reads to the genomes of organisms that might be a
86 source of contamination and discard those that map with a high
87 degree of fidelity By default iRAP will check if the data is
88 contaminated by e-coli An example to create a contamination
89 database is provided in the examplesex_add2contaminationDBsh
90 script The value of the parameter should be the file name prefix of
91 the bowtie index files
92
93 Disable contamination check
94 cont_index=no
95 Default value
96 cont_index=$(data_dir)contaminatione_coli
97
98
99 Misc options
100
101 Number of threads that may be used by IRAP
102 max_threads=1
103
104 Exon level quantification Yes (y)| No (n)
105 exon_quant=y
106
107 Transcript level quantification Yes (y)| No (n)
108 transcript_quant=y
109 =============================================================================
110 full or relative path to the directory where all the data can be found
111 data_dir=data
112
113 the directory should be organized as follows (see directory data in IRAP toplevel
directory)
114
115 $data_dir
116 $data_dir
117 contamination
118 e_coli1ebwt
119 e_coli2ebwt
120 e_coli3ebwt
121 e_coli4ebwt
122 e_coliREADME
123 e_colirev1ebwt
124 e_colirev2eb
125 raw_data
126 $species
127 fastq
128 fastq
129
43
iRAP model of configuration file
130 reference
131 $species
132 $gtf_file
133 $reference
134
135 Notes
136 1) $ denotes the value defined for the variable
137 2) Since version 050 the raw data (fastqbam) files may be
138 distributed across several sub-folders
139
140
141 =============================================================================
142 Only necessary if you intend to perform Differential Expression analysis
143
144 contrasts=contrast_def [contrast_def ]
145 contrasts=purpleVsPink purpleVsGrey
146
147 definition of each constrast
148 contrast= group group [ group ]
149 purlpleVsPink=Purple Pink
150 purlpleVsGrey=Purple Grey
151
152 groups
153 GroupName= Library_name [Library_name ]
154 Purlple=myLib1 myLib2
155 Pink=myLib3
156 Grey=myLib4
157
158 optional parameter used in the report (HTML) generation
159 groups=Purple Pink Grey
160
161 technical replicates
162 technicalreplicates=myLib1myLib2myLib3mylib4
163
164 Note names of groups contrasts and libraries should start with a letter and
contain only alphanumeric characters and the character _
165
166 =============================================================================
167 Data
168
169
170 Information for each library
171 LibName=Fastq file
172 Note
173 1 LibName should start with a letter and contain only alphanumeric characters
and the character _ LibName should not contain in _1 or _2
174 2 LibName should be different from the name of the fastq file for instance
175 f1=f1fastq
176 will produce an error
44
iRAP model of configuration file
177
178 Single-end
179 myLib1=f1fastq
180 read size
181 myLib1_rs=75
182 quality encoding (33 or 64)
183 myLib1_qual=33
184
185 strand specific protocol
186 mylib1_strand=first
187 mylib1_strand=second
188 Default value is both (strands)
189 mylib1_strand=both
190
191 Have the file in a different sub-folder
192 mylib1_dir=somesubfolder
193
194 See SAMBAM specification for more details about the following two parameters
195 read group id (to be included in the BAM file) - this is not supported by all
mappers
196 myLib1_rgid=
197 sambam header lines to include in the BAM file
198 myLib1_shl=COtThis is a commentnCOtand another line
199
200 LibName=Fastq file
201 myLib2=f2fastq
202 read size
203 myLib2_rs=75
204 quality encoding (33 or 64)
205 myLib2_qual=33
206
207
208 Paired-end
209 LibName=Fastq files
210 myLib3=f3_1fastq f3_2fastq
211 read size
212 myLib3_rs=50
213 quality encoding (33 or 64)
214 myLib3_qual=33
215 insert size
216 myLib3_ins=350
217 standard deviation
218 myLib3_sd=60
219
220 LibName=Fastq files
221 myLib4=f4_1fastq f4_2fastq
222 read size
223 myLib4_rs=50
224 quality encoding (33 or 64)
45
iRAP model of configuration file
225 myLib4_qual=33
226 insert size
227 myLib4_ins=350
228 standard deviation
229 myLib4_sd=60
230
231
232
233
234 list the names of your single-end (se) and paired (pe) libraries
235 se=myLib1 myLib2
236 pe=myLib3 myLib4
237 No SE data
238 se=
239 No PE data
240 pe=
241
242
243
244 Passingoverriding parameters
245
246 It is possible to pass parameters to the mappers and quantification
247 methods but that should be done carefully since it may break the
248 pipeline (if the location of the input andor output files is
249 changed)
250
251 Overridingchanging the mappersrsquo parameters
252 _map_options=options
253 Example
254 tophat2_map_options=--min-intron-length 5 --no-coverage-search
255
256 Overridingchanging the parameters of the quantification methods
257 _params=options
258 Example
259 htseq_params= -q
46
Appendix C
iRAP example configuration file
1 minimal configuration file for DE
2 experiment name
3 name=ecoli_ex
4 species
5 species=ecoli_k12
6 reference genome
7 reference=Escherichia_coli_str_k_12_substr_mg1655GCA_000005845119dnatoplevel
fagz
8 gtf file
9 gtf_file=Escherichia_coli_str_k_12_substr_mg1655GCA_000005845119gtfgz
10 Enable filtering based on quality
11 qual_filtering=on
12 Use a contamination data set to filter out reads
13 cont_index=no
14 Toplevel directory with the data
15 data_dir=
16
17 some contrasts
18 GA=Group A
19 contrasts=GAvsGB GBvsGA
20 GAvsGB=GA GB
21 GBvsGA=GB GA
22 GA=FA FB FC
23 GB=FD FE FF
24
25 se=FA FB FC FD FE FF
26
27 FA=SRR933983fastqgz
28 FA_rs=50
29 FA_qual=33
30
31 FB=SRR933984fastqgz
32 FB_rs=50
47
iRAP example configuration file
33 FB_qual=33
34
35 FC=SRR933985fastqgz
36 FC_rs=50
37 FC_qual=33
38
39 FD=SRR933989fastqgz
40 FD_rs=50
41 FD_qual=33
42
43 FE=SRR933990fastqgz
44 FE_rs=50
45 FE_qual=33
46
47 FF=SRR933990fastqgz
48 FF_rs=50
49 FF_qual=33
50 EOF
48
- Front Page
- Table of Contents
- List of Figures
- List of Tables
- 1 Introduction
-
- 11 Context
- 12 Motivation and Goals
- 13 Proposed Solution
- 14 Structure of the Dissertation
-
- 2 Basic Concepts and Bibliographic Review
-
- 21 Biological Basic Concepts
-
- 211 Genome
- 212 Transcriptome Assembly and Gene expression
-
- 22 RNA-Seq Analysis
-
- 221 RNA-Seq microarrays and DNA sequencing
- 222 RNA-Seq Pipeline
-
- 23 Standard File Formats used
-
- 231 FASTA
- 232 FASTQ
- 233 SAM and BAM
- 234 GFF and GTF
-
- 24 Relevant Data Repositories
- 25 Tools for RNA-seq and Differential Analysis
- 26 Relational and Non-relational Databases
- 27 Tecnologies
- 28 Related Work
- 29 Chapter Summary
-
- 3 The Gemini framework
-
- 31 Gemini
- 32 Gemini Architecture
-
- 321 Physical Architecture
-
- 33 Data Management
- 34 Web Interface
- 35 Use cases
- 36 Case studies
-
- 361 Full pipeline
- 362 Stage pipeline
-
- 37 Chapter Summary
-
- 4 Case study
-
- 41 Samples characterization
- 42 Researching objectives
- 43 Protocol of analysis
- 44 Genome version GRCh37 versus GRCh38
- 45 Fusion genes
- 46 Results
-
- 461 Case study with reference genome GRCh37
- 462 Splicing analysis
- 463 Case study with reference genome GRCh38
-
- 47 Chapter Summary
-
- 5 Conclusions and Future Work
- References
- A iRAP tools supported
-
- A1 Mappers
- A2 Quantification
- A3 Differential expression [DE]
- A4 Gene set enrichment analysis [GSE]
-
- B iRAP model of configuration file
- C iRAP example configuration file
-
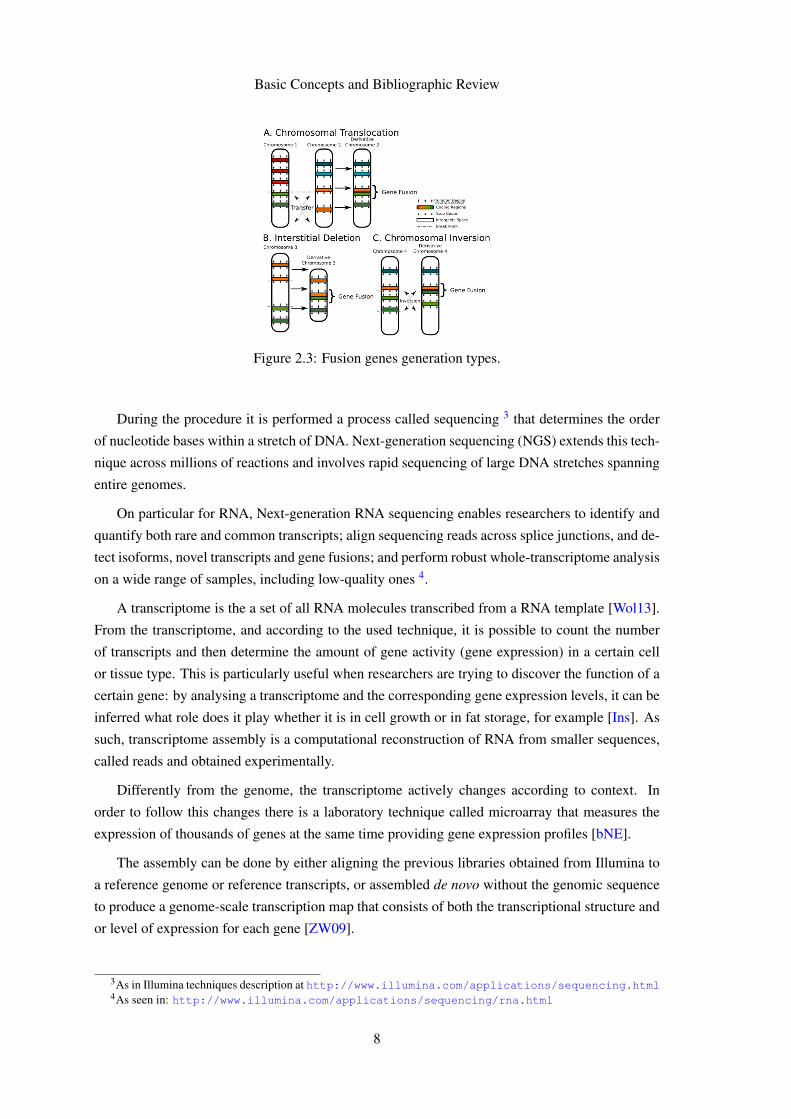
Basic Concepts and Bibliographic Review
iRAP 5 appears as an integrated solution that allows users to choose and apply their preferred
tools for mapping reads quantifying expression and testing for differential expression [FPMB14]
Figure 25 iRAP pipeline for RNA sequencing analysis
The Figure 25 shows the main steps for this methodology that by comparing with the previous
workflow (Figure 24) has two more stages Gene set enrichment and Web reports Gene set
enrichment is a means of analysing genomic data by studying the effects of groups of genes on a
phenotype rather then individual gene analysis [kn10] Web reports facilitate the inspection of the
results produced at different stages of the analysis by providing web pages with tables or plots of
information [FPMB14]
iRAP is also capable of performing analysis starting at any stage of the pipeline by choosing
the right command line options Currently it has the following five different stage options as
described below
setupstage0 check all directories and data files are present and at the expected place
stage1 quality filtering and reporting check fastq file quality and report
stage2 mapping to the transcriptome or to the genome
stage3 estimate gene expression
stage4 estimate differential expression
Furthermore the expert can choose the specific tool for each phase of the system some of
which are described in detail in further sections The current list of tools supported are available
in Appendix A
When using iRAP the user has the possibility to speed up the analysis by using the irap_lsf
command This method accepts the same parameters as iRAP but splits the analysis into multiple
jobs with the aim of reducing the time to analyze the data
5iRAP repository httpscodegooglecompirap
11
Basic Concepts and Bibliographic Review
23 Standard File Formats used
For the implementation of the previous pipeline some file formats are used to input or retrieve
data Below will be presented the most widely used ones along with some short description and
detail when needed
231 FASTA
FASTA 6 is the definition line and sequence character format used by NCBI 7 It is a text-based for-
mat for representing either nucleotide (DNA or RNA) or amino acid (protein) sequences FASTA
is commonly used since it is easy to manipulate and parse using text-processing tools and scripting
languages Usually in iRAP a FASTA format is used to store the a reference genome
232 FASTQ
FASTQ 8 provides a simple extension to the previous format the ability to store a numeric quality
score associated with each nucleotide in a sequence [CFG+10] It is generally used as the first
input with the raw data
233 SAM and BAM
SAM 9 is a generic format for storing large nucleotide sequence alignments It is easy to under-
stand easy to parse and easy to generate and check for errors Despite the presented qualities
SAM is slow to parse so a binary equivalent to it BAM has been developed to deal with this issue
BAM is used to intensive data processing and is useful in most product pipelines while SAM has
appropriate for interconversion with external applications and exploratory analysis Like FASTQ
BAMSAM formats are widely used as containers for raw sequence data
234 GFF and GTF
GFF 10 is a format for describing genes and other features associated with DNA RNA and Protein
sequences It was originally proposed as a protocol for the transfer of genomic feature information
allowing people to develop and test them without having to maintain a complete feature-finding
system The second version also allows for feature sets to be defined over RNA and Protein
sequences as well as genomic DNA
On the other hand GTF 11 stands for Gene transfer format and has been developed on top
of GFF specification The first eight GTF fields are the same as GFF The group field has been
6FASTA format httpgeneticsbwhharvardedupphFASTAhtml7NCBI httpwwwncbinlmnihgov8FASTQ format httpmaqsourceforgenetfastqshtml9SAM and BAM file formats httpsamtoolssourceforgenetSAMv1pdf
10GFF format httpwwwsangeracukresourcessoftwaregffspechtml11GTF format httpwwwensemblorginfowebsiteuploadgffhtml
12
Basic Concepts and Bibliographic Review
expanded into a list of attributes Each attribute consists of a typevalue pair Attributes must end
in a semi-colon and be separated from any following attribute by exactly one space
24 Relevant Data Repositories
It is important to validate results and test along with the implementation of RNA-Seq pipeline As
such real data are needed so that the quality and efficiency of this study is assessed Some repos-
itories are available online such as Gene Expression Omnibus (GEO 12) Genomic Data Sharing
(GDS 13) ENSEMBL 14 UCSC Genome Browser 15 or the ENCODE Project 16 The three last
ones are highlighted in next section
ENSEMBL
The Ensembl project provides information about many vertebrate and other eucaryotic species
being started in 1999 some years before the draft human genome was completed Until today
many genomes have been added over the years as well as the inclusion of comparative genomics
variation and regulatory data [HBB+02]
Between the included working teams of Ensembl the Genebuild is the one who is responsible
to create the gene sets both as developing and mantaining the BioMart 17 data mining tool
It also supplies a REST server 18 as well as an FTP tool for browse and download data [CAB+15]
UCSC Genome Browser
The UCSC Genome Browser is a website that consists of an open-source tool to browse
analyze and query genomic data Currently it grants access to some reference genomes giving the
possibility to retrieve specific data due to the search tool integrated
Along with this tool it is also available an FTP server where data can be accessed and down-
loaded
ENCODE Project
While ENSEMBL has information about many vertebrate and other species ENCODE is a
project to identify all functional elements in the human genome sequence as well as being able
to create comprehensive high quality catalogs of functional elements in the human genome using
highndashthroughput technologies Their mission is to enable the scientific and medical communities
12GEO httpwwwncbinlmnihgovgeo13GDS httpgdsnihgov02dr2html14ENSEMBL httpwwwensemblorgindexhtml15UCSC Genome Browser httpgenomeucscedu16ENCODE project httpswwwencodeprojectorg17BioMart httpbiomartorg18REST server of Ensembl httprestensemblorg
13
Basic Concepts and Bibliographic Review
to interpret the human genome sequence and apply it to understand human biology and improve
health [The04]
Besides their motivation an online repository is being build up indexing gathered data and
allowing users to query different data types regardless of location [Con11] Some samples can
be found at httpswwwencodeprojectorgexperimentsENCSR274JRR for ex-
ample
25 Tools for RNA-seq and Differential Analysis
To perform the RNA-Seq pipeline some tools for each process are required It is now presented
some set of them on the following sections
Bowtie
Bowtie 19 is a tool to align short reads to the human genome To achieve speed and memory-
efficiency Bowtie aligns reads with the aid of an index of the reference genome [Lan10] and can
take advantage of the use of simultaneous multiple processor cores [LTPS09] For the human
genome Burrows-Wheeler is a commonly used indexing process that this tool extends with a
novel quality-aware backtracking algorithm that permits mismatches
TopHat
TopHat 20 is used as a junction mapping tool for RNA-Seq reads Before TopHat current
mapping strategies could only localize reads to known exons in the genome This tool is a read-
mapping algorithm design to align reads to a reference genome without relying on know splice
sites [TPS09]
Cufflinks
Cufflinks 21 assembles transcripts estimates their abundances and tests for differential ex-
pression and regulation in RNA-Seq samples Internally it is made of four different parts Cuf-
flinks that assembles the package Cuffcompare that compares transcript assemblies to annotation
Cuffmerge that merges two or more transcript assemblies and Cuffdiff that takes the aligned reads
and reports genes and transcripts that are differentially expressed [TRG+12a]
HTSeq
19Bowtie httpbowtie-biosourceforgenetindexshtml20TopHat httpccbjhuedusoftwaretophatindexshtml21Cufflinks httpcole-trapnell-labgithubiocufflinks
14
Basic Concepts and Bibliographic Review
HTSeq 22 is a python framework to facilitate the rapid development of scripts to processing
and analysis of high-throughtput sequencing data
FASTQC
FASTQC 23 is a quality control tool for high-throughput sequencing data It receives as input
BAM SAM or FASTQ files provides a quick overview on which areas there may be problems
summarizes graphs and tables for a fast assess of data and exports results to an HTML based report
Samtools
Samtools 24 is a set of utilities to manipulate alignments in the BAM format (output format of
TopHat eg) It does sorting merging and indexing and allows to retrieve in any regions The
files can be either provided via standard input (stdin) of from a remote FTP or HTTP server
deFuse
deFuse 25 is a software for gene fusion discovery from RNA-Seq data It uses clusters of dis-
cordant paired alignments to inform a split read alignment analysis for finding fusion boundaries
As an output it produces a fully annotated output for each predicted fusion
26 Relational and Non-relational Databases
Relational Databases had been introduced in 1970 by Edgar Codd at IBM Almaden Research
Center [Cod70] It has been used for decades and has brought in the concept of relations With
this a relational database is usually represented by a structured model a table in which each row is
a tuple (also considered as an object) and the columns are the attributes of the tuple The database
can be queried in order to retrieve useful data based on their attributes whether in common between
tuples or not To do so it is used a structured query language SQL [LM10] The main set of
operations is known as CRUD Create Read Update and Delete Relational databases are also
know for their fixed schemas that force every tuple to have the exact same attributes
A very common operation in SQL databases are joins Joins are a way to associated data that
share attributes or are somehow related One example is imagining a table of people that have
bank accounts associated and there is another table where the existing banks are described A way
to relate them is to combine these two tables in order to directly view which individual is using
which bank This is a very simple example that can scale very quickly and become a dangerous
operation for the consumed resources to be used to compute the needed relationships
22HTSeq httpwww-huberembldeHTSeqdocoverviewhtml23FASTQC httpwwwbioinformaticsbabrahamacukprojectsfastqc24Samtools httpsamtoolssourceforgenet25deFuse httpsbitbucketorgdranewdefuse
15
Basic Concepts and Bibliographic Review
In contrast with the previous set a Non-relational database commonly doesnrsquot have a fixed
schema and avoid the previous complex operation Within this class of databases there are different
approaches to the used models such as key-value stores big table clones document databases and
graph databases Each of them is used accordingly to the data set complexity
MongoDB 26 is a non-relational database schemaless and is scalable in cluster performance
and data This way it provides a way to store large data sets with the freedom of using different
schemas according to data 27
27 Tecnologies
When developing a web service there are some basic resources and programming languages used
HTML 28 is a standard markup language for describing web documents CSS 29 is used for
defining how the HTML elements are to be displayed Bootstrap 30 is a free front-end frame-
work for faster and easier web development and contains HTML and CSS based design patterns
Javascript 31 serves as a method for programming the behavior of web pages jQuery 32 is a library
of Javascript that greatly specifies Javascriptrsquos usage
Even though commonly used PHP 33 is not the best suitable language for our thesis work
When compared to Python it lacks security and is not used on the Bioinformatics field On the
other hand Perl has been greatly used on this field but it is currently being replaced by Python 34
Furthermore this last one has libraries like BioPython 35 for internal processing of samples and
also has support to web through frameworks like Django 36 or BottlePy 37
Even though Django is trending it has no support for NoSQL relational databases yet Bot-
tlePy for instance is a lightweight web framework simple to use and provides the ability to use
MongoDB
Concerning the situation the combination of Python and BottlePy is the most suitable since it
has
bull Starting to replace Perl in bioinformatics processing
bull Support for NoSQL databases (either the framework and the programming language)
bull Lightweight usage
26MongoDB httpwwwmongodborg27MongoDB scalability httpwwwmongodbcommongodb-scale28HTML httpwwww3schoolscomhtml29CSS httpwwww3schoolscomcssdefaultasp30Bootstrap httpgetbootstrapcom31Javascript httpwwww3schoolscomjs32jQuery httpsjquerycom33PHP httpphpnet34Python httpswwwpythonorg35BioPython httpbiopythonorgwikiMain_Page36Django framework httpswwwdjangoprojectcom37BottlePy httpbottlepyorgdocsdevindexhtml
16
Basic Concepts and Bibliographic Review
Figure 26 Print screen of Galaxy when trying to get data from UCSC
For the purpose of sending the information between devices the FTP server solution was
analysed It allows the creation of an administrator user that has the permissions for writing and
reading but also for anonymous users that can only download data
28 Related Work
Galaxy
Galaxy 38 is an open source web-based platform for data intensive biomedical research
It consists of an embedded website system that provides access to different databases such
as Ensembl or UCSC Genome Browser Although functional the platform has not a consistent
interface which requires the user to learn to use many systems within it An example of this
situation can be viewed in Figure 26 Furthermore it does not provide the ability to choose easily
a stage pipeline like iRAP or to run a full one with personalized tools
BioMart Central Portal
BioMart 39 is a community-driven project to provide unified access to distributed research data
to facilitate the scientific discovery process
38Galaxy httpgalaxyprojectorg39BioMart Central Portal httpcentralbiomartorgsequencegui=Sequence_retrievalamp
mart=metaseq_mart_63_config
17
Basic Concepts and Bibliographic Review
It currently has a sequence retrieval tools that provides searching by database and dataset
Nowadays this tool offers Ensembl as the only available database but it adds up three other fea-
tures like a sequences filters and header information panels where the users can improve their
search
29 Chapter Summary
In this chapter we presented and discussed the technologies suitable for the thesis work We have
surveyed alternative technologies for gene expression computation and alternative splicing tools
The technologies are relevant to solve the Biological domain problem We have also surveyed
the tools for the development of websites and databases to store the data used when solving the
biological problems In the next chapter we describe work in detail
18
Chapter 3
The Gemini framework
Despite the very large number of tools available for Molecular Biology problems they are most
often difficult to use and require sophisticated computational resources As part of the thesis
work we have developed a framework that allows expert users to make RNA-Seq and alternative
splicing analysis using a user friendly web interface and sophisticated computational resources
In this chapter we describe that framework that include the website database resources for storing
data and the computational settings for the analysis
iRAP has been chosen to accomplish the automation of RNA sequencing analysis due to the
simplicity of use and its wide number of tools available for its task Since it is an integrated
tool platform its installation requires not only powerful computer resources but also a long list of
basic equipment necessary to each of them Considering these issues it had not always been easy
to setup the wanted work environment
Despite the difficulties of this scenario we have been able to complete the setup of this tool
and make some control experiments with it
In order to accomplish an iRAP execution a configuration file must be provided (see Ap-
pendix B) Along with the experiment name the name of species being analysed the reference
genome and read data files need to be specified and made available Furthermore the specific
tools for each stage of the pipeline need also to be specified among other possible variables
It is not easy and usually very time consuming for a Biologist to create the configuration file or
to run the command-line interface that controls iRAP pipeline Since this system is a combination
of many different tools there are a long list of available options that may be fulfilled Some of
them are mandatory while other ones are optional After this setting is completed it must be saved
in a text file and made available to run iRAP
Even though the usage of iRAP does not require extensive bioinformatics expertise it does
assume familiarity with UNIX command-line interface which would narrow down the target audi-
ence In order to overcome this situation we designed and developed a framework called Gemini
19
The Gemini framework
that includes a Graphical User Interface and makes RNA-Seq studies much more easy to perform
We have also included extra features for doing more analysis to RNA-Seq data
31 Gemini
Due to the lack of intuitiveness on the process of generating the configuration file it has been
created a more user friendly one through a web form This form asks for input of the main settings
to call a very simple experiment with a commonly used bacteria escherichia ecoli (e coli)
Another important feature is the possibility to fill the form asking what is the stage that the user
wants the pipeline to start with
Another issue was to find and easily download a reference genome for a certain species In
order to add completeness to Gemini and also to simplify the process of download it has been
implemented the functionality to download the reference genome (both fasta and annotation files)
It is used the Ensembl API to obtain the required results The jobs status feature lists the status of
jobs sent by the user for execution
Besides these features one more have been added even though not completed It is the job
results where it is presented the results collected for a determined task
32 Gemini Architecture
321 Physical Architecture
Gemini is divided into two different sets The first one is where the web application is hosted as
well as the database Since dealing with genomic data often requires great computer performance
processing experiments is accomplished in an independent server that later responds with results
Figure 31 Physical architecture of Gemini
Data scheme
MongoDB is NoSQL document based database The information is organized in collections
in which each element is stored as a JSON document NoSQL databases are simpler to use when it
20
The Gemini framework
comes to have different information fields in the same document and at the same time they have
better performance and scalability [SK11] Currently the information is arranjed in two collections
scheme as described on Table 31
Name DescriptionAccounts Stores the users dataJobs Stores the experiments dataTable 31 Collections used to store data
Accounts
An accountrsquos document stores an userrsquos email password and a unique identifier A role has
also been saved for future hierarchy creation in which some levels will grant more permissions
than others like changing accounts settings of other participants
1
2 _id ObjectId(54f5a9b234f76511a82ec3b2)
3 password e10adc3949ba59abbe56e057f20f883e
4 role user
5 email acgggomesgmailcom
6
Jobs
Jobs are related to an user and have the name and description of the experiment It also
stores the reference genomersquos location as well as the readsrsquo one Likewise the date of creation is
preserved When a job is completed the status is modified to finished
1
2 _id ObjectId(5544ecf134f7651d687bba94)
3 name ExpFinal
4 exp_dir data54f5a9b234f76511a82ec3b2ExpFinalreads
5 user 54f5a9b234f76511a82ec3b2
6 description Final test
7 genome_dir genomesEscherichia coli
8 status started
9 date ISODate(2015-05-02T152745249Z)
10
21
The Gemini framework
33 Data Management
In order to create a new job it is required two sets of data namely reference files and raw data
files The raw data is the actual data being analysed while the reference genome serves as basis to
the alignment or control
The typical workflow consists on the expert providing the experience and species names as
well as the raw data that was previously collected in the laboratory Afterwards through a step by
step system the user has the option to choose the reference genome to be used on the experiment
This last files are internally obtained from different FTP servers such as Ensembl and ENCODE
stored locally and reused in further usages
The provided information is then saved in the database and the files stored hierarchically We
use the following sequence of ltsection namegt ltuseridgt ltexperience namegt ltdata filesgt The
ltsection namegt can be conf for storing configuration files data for saving the reads or refer-
ence for keeping the reference genome and annotation files The ltuseridgt is the ID of Accounts
database document and the ltexperience namegt is the same as name in Jobs database document
A directory tree is represented in Figure 32
Figure 32 File system tree demonstrating the hierarchy of saved data files
This information is then passed to the server via a local FTP server that has been created
22
The Gemini framework
for this purpose We have followed an online tutorial 1 for the configuration From this we
created one administrator that has permissions for writing and reading files and we also authorized
anonymous login that may only retrieve files This way on the web application the admin user
creates the reads reference genomes annotation and configuration files On the computational
server an anonymous user authenticates for retrieving the files according to the filenames received
via API
The inside directory of FTP follows the hierarchy of ltuseridgt ltexperience namegt ltdata
filesgt where ltuseridgt is the ID on the Accounts document and ltexperience namegt is the name
on Jobs document When the server is prompted to run an experience it downloads the required
data from the FTP and runs iRAP with the necessary configuration options
34 Web Interface
For the implementation of Gemini python has been used for backend along with a simple fast and
lightweight WSGI micro web-framework called BottlePy 2 It has no dependencies and grants the
main functionalities such as routing templates some class utilities and a built-in server
The first screenshot (Figure 33) shows the home page of Gemini There is top menu bar with
two possible interactions login and register There is also a simple content box that describes the
main features and status of development of the platform Later on a new menu appears with the
possibility to logout on the Welcome tab (as in Figure 34)
Figure 33 Home page
Figure 34 Logout menu
1Tutorial available at httpswwwthomas-krenncomenwikiSetup_FTP_Server_under_Debian
2BottlePy httpbottlepyorgdocsdevindexhtml
23
The Gemini framework
The main feature of the system is the create job (Figure 35) option that is easily accessible on
top menu When the user clicks on it a form is displayed with the variables to introduce on the
configuration file that iRAP needs A description option has been added to provide the freedom to
the researcher to include some extra information that he finds useful
Figure 35 Create job form
The same type of form was used for the reference genomes section (Figure 36) The user is
prompted to choose orderly the species name release number and version Afterwards a table of
elements appears allowing the expert to download the files found
Figure 36 Reference genomes component
24
The Gemini framework
35 Use cases
Gemini was designed to have only one actor the user that will accomplish the experiments This
actor has the possibility to register login and logout of his account create a job and the hability
to download a reference genome of his choice Even though not fully implemented it has been
considered the jobs done functionality
Figure 37 Use cases diagram
36 Case studies
Some case studies with e coli in order to test iRAPrsquos installation and its capabilities For both
of the case studies it has been collected six samples of Escherichia coli reads from European
Nucleotide Archive 3 and the corresponding reference genome and annotation file from Ensembl
361 Full pipeline
In order to call the full pipeline iRAP has been tested with the directive irap conf=ecoli_exconf
Configuration file (ecoli_exconf ) content is as described in Appendix C In this task the system
received the reads and performed the quality control (QC) mapping quantification and differential
expression between the two groups of samples
3ENA httpwwwebiacukena
25
The Gemini framework
This test has been accomplished successfully
362 Stage pipeline
The stage pipeline is a powerful functionality since it allows the user to choose a specific stage of
the pipeline that he wants to execute for his samples
Besides the fact that it is not easy to collect data samples users often want to repeat or analyse
just one step of the pipeline and take some conclusions of it Furthermore this type of pipeline is
less time consuming
A concrete usage example is IPATIMUPrsquos data which contains the output information of the
mapper TopHat and will be further analysed in detail in Chapter 4 Concerning this setup it would
not be possible to call the full pipeline but instead it would require a command specific command
option
For validation purposes the same bacteria from the previous analysis has been used for the
stage pipeline case After calling the setup command to check input the directive irap conf=
ecoli_exconf quality_filtering_and_reporting has been used to perform the stage1
of iRAP The platform was able to perform with success this task
37 Chapter Summary
It has been used Python with BottlePy for the main implementation of the interface of Gemini
MongoDB has been chosen for dealing with information A FTP server was mounted for the
transitions of data between the client and the server The platform allows the expert to call a full or
stage pipeline analysis and provides the download of both fast and annotation files The essential
items are setup for the addition of further functionalities
26
Chapter 4
Case study
In this chapter it is going to be presented the Case Study with data from samples of thyroid carci-
noma along with their charactering and researching results
After the development of an interface to the iRAP tool the following step was to do a case
study with some realistic DNA samples of thyroid cancer patients regarding the partnership with
IPATIMUPrsquos researchers
The purpose of this case study was to do some research of potential differences between dis-
tinct types of the disease In order to accomplish this four samples were collected from Centro
Hospitalar de Satildeo Joatildeo (Porto) Cases 1 and 2 have been categorized as a widely invasive Fol-
licular Thyroid Carcinoma (wFTC) and cases 3 and 4 as a minimally invasive Follicular Thyroid
Carcinoma (mFTC)
41 Samples characterization
Patient from case 1 was female with 82 years old the tumour measuring 2 cm of size and presented
a predominant follicular growth pattern and oncocytic features Patient from case 2 was male with
55 years old the tumour measuring 5 cm of size and presented a predominant solidtrabecular
growth pattern For the group of mFTC patient from case 3 was female 56 years old the tumour
measuring 37 cm of size and with follicular growth pattern patient from case 4 was female 56
years old the tumour measuring 4 cm of size and with follicular growth pattern
42 Researching objectives
The aim of the study was to answer the following questions
bull Differentially expressed genes
bull Total isoforms found either in percentange and in absolute
27
Case study
bull Average of alternative isoforms for each gene spliced
bull Potentially novel isoforms and how do they behave between samplesgroups of samples
bull Compare results between versions of human genome assembly
bull Retrieve fusion genes
43 Protocol of analysis
Collected sample reads have been aligned against reference genome GRCh37 with TopHat version
141 Posterior analysis followed Tuxedo Protocol as described in Trapnell et al [TRG+12b] An
overview of the full protocol can be found in Figure 41
For the implementation of this procedure it were considered as two different groups the cases
1 and 2 (wFTC) against cases 3 and 4 (mFTC) The following step was to assemble transcripts for
each sample with Cufflinks 1 and afterwards create a single merged transcriptome annotation with
Cuffmerge 2 Cuffdiff 3 was then used to find significant changes in transcript expression
In order to find potential isoforms each sample was ran against the reference genome with
Cuffcompare 4
44 Genome version GRCh37 versus GRCh38
Even though IPATIMUPrsquos data have been assembled with reference genome version GRCh37
nowadays a more recent version (GRCh38) has been released in 2013 This new assembly is the
first major revision of the human genome in more than four years 5
The main differences between this two versions are
Alternate sequences several human chromosomal regions have sufficient variability to prevent
adequate representation by a single sequence This new version provides alternate sequence
for selected variant regions through the inclusion of alternate loci 6 scaffolds
Centromere 7 representation Previous method of representing centromeric regions have been
replaced by sequences from centromere models The models provide the approximate repeat
number and order for each centromere and are useful for read mapping and variation studies
Mitochondrial genome The new mitochondrial reference sequence is the Revised Cambridge
Reference Sequence with RefSeq accession number NC_0129201 The previous one was
RefSeq accession number NC_001907 which was not updated when GRCh37 assembly
later transitioned to the new version1Cufflinks httpcole-trapnell-labgithubiocufflinks2Cuffmerge httpcole-trapnell-labgithubiocufflinkscuffmergeindexhtml3Cuffdiff httpcole-trapnell-labgithubiocufflinkscuffdiffindexhtml4Cuffcompare httpcole-trapnell-labgithubiocufflinkscuffcompareindexhtml5As in UCSC mailing list at httpsgroupsgooglecomasoeucsceduforumtopic
genome-announce52Kv41YBXNY6Specific location of a gene on a chromosome
28
Case study
Figure 41 An overview of the Tuxedo Protocol with full steps TopHat for alignment Cufflinkspackage to find differential features between group samples and in the end CummeRbund to plotprevious results
Sequence updates Several erroneous bases and misassembled regions have been corrected and
more than 100 gaps have been filled or reduced
Analysis set The new assembly offers an analysis set that was created to accommodate next
generation sequencing read alignment pipelines Several GRCh38 regions have been elimi-
nated from this set to improve read mapping
29
Case study
45 Fusion genes
After we done some research on the technologies used for finding fusion genes in the reads we
have not been able to perform the analysis to answer the last question of our researching objectives
DeFuse required as input the original reads which were not provided This analysis would have
been interesting for relating the ocurrence of thyroid and the presence of fusion genes as well as if
there was any relevant difference between the samples of wFTC and mFTC
46 Results
461 Case study with reference genome GRCh37
The following table ( 41) demonstrates some genes that were differentially expressed with signif-
icance between mFTC and wFTC According to Celestino et al 8 CRABP1 C1QL1 and LCN2
are biomarkers of thyroid cancer and predictors of extrathyroidal extension It is commonly used
the value of 005 has threshold above which the differential expression is significant By inspect-
ing out the table we can find C1QL1 with a q-value of 0000555 and CRABP1 with a q-value
of 159E-11 which are in concordance with the previous article Furthermore it is verified the
increased gene expression in wFTC when compared to mFTC
Gene ID Gene Chr mFTC wFTC Fold change(log2) Q value
ENSG00000167748 KLK1 19 018672 111924 922742 0ENSG00000104725 NEFL 8 00196645 276961 104599 0ENSG00000174145 KIAA1239 4 00307388 144265 887444 0ENSG00000182379 NXPH4 12 008307 195786 788074 0ENSG00000131094 C1QL1 17 0121453 238957 429828 0000555ENSG00000142677 IL22RAI 1 150905 0384783 -529345 0ENSG00000138615 CILP 15 423569 0052726 -632793 241E-11ENSG00000141431 ASXL3 18 18938 001408 -707148 124E-09ENSG00000166426 CRABP1 15 748375 0367899 -766831 159E-11ENSG00000214145 LINC00887 3 19797 0119327 -737421 0000459
Table 41 Genes differentially expressed between minimally invasive follicular thryoid carcino-mas (mFTCs) and widely invasive follicular thyroid carcinomas (wFTCs)
In response to the previous researching objectives the Table 42 has the statistical results for
taks two and three From the data analysis we could conclude that less than 1 of genes have
isoforms but each one has an average of 389 alternatives
8Ricardo Celestino Torfin Nome Ana Pestana Andreas M Hoff Pedro A Gonccedilalves Catarina Eloy Eva SigstadRagnhild A Lothe Trine Bjoslashro Manuel Sobrinho-Simotildees Rofl I Skotheim Paula Soares CRAPBP1 C1QL1 andLCN2 are biomarkers of thyroid cancer and predictors of extrathyroidal extension subbmited for publication
30
Case study
Total genes 63896Total significant isoforms 689Total unique genes with isoforms 179Ratio of unique genes with isoformsgenes () 028Average of alternatives per gene with isoforms 389
Table 42 Statistical results for researching objectives number 2 and 3
462 Splicing analysis
Forward in the analysis Cuffcompare 9 has been used to search for novel isoforms when com-
pared to the reference genome The method was to compare each sample to the reference genome
and afterwards make an overlap of the results The main objective was then to infer about the
differences among wFTC and mFTC
Sample 1(wFTC)
Sample 2(wFTC)
Sample 3(mFTC)
Sample 4(mFTC)
Total genes 30440 36862 35539 37534Potential novel isoforms 7406 8450 8781 8830Table 43 Potential novel isoforms for each sample of IPATIMUPrsquos data
As demonstrated on Table 43 average there is a percentage of 24 of potentially novel iso-
forms found (at least one spliced junction is shared with a reference transcript) There is been
made an overlap of the results in order to encounter differences between wFTC and mFTC The
Table 44 presents the counting of differences between cases A brief analysis allows us to say
that we can not make any relationship between wFTC and mFTC On average there was a total of
3722 changes among this two sets The average within the sets are 3554 for wFTC and 3992 for
mFTC Given this results there was not a significant divergence to allow us to relate the splicing
and the occurrence of a more invasive Thyroid Carcinoma
Sets ChangesS1 S2 3554S1 S3 3609S1 S4 3612S2 S3 3847S2 S4 3820S3 S4 3929
Table 44 Number of differences between samples Syntax used S1 - Sample 1 S2 - Sample 2S3 - Sample 3 and S4 - Sample 4
9Cuffcompare httpcole-trapnell-labgithubiocufflinkscuffcompareindexhtml
31
Case study
463 Case study with reference genome GRCh38
In order to respond to the last research objective it has been applied the method of analysis has
before with a more recent human genome assembly After using the same protocol with Cufflinks
Cuffmerge and Cuffdiff sequentially we have come to some conclusions
The produced results of differential expression analysis for the same genes were very different
Genes that were highly significant before like C1QL1 and CRABP1 now had no relevance (q-
value gt 005) As mentioned before we had only access to TopHatrsquos output that used version
GRCh37 for the alignment and mapping process so we could not start from scratch the analysis
This outcome demonstrates two topics in particular
1 the introduction of novel annotations can make previous analysis outdated
2 there is the need to save the original reads in order to update earlier studies
The solution to this situation would have been to use the original reads to repeat the assembly
and then follow the Tuxedo protocol to collected correct and updated differential expression data
47 Chapter Summary
These section of development has been introduced in order to confer not only validation but also
to do some researching studies on the subject Four samples were collected and divided into two
distinct groups Tuxedo protocol was followed for responding to the research objectives The
case study for GRCh37 demonstrated the expression of C1QL1 and CRABP1 on wFTC when
compared to mFTC as indicated in the referred article On the other hand the same protocol when
applied with GRCh38 demonstrated the importance of saving the original reads and what is the
influence of newer releases in previous researching results Lastly the splicing analysis results did
not show any evidence of related isoforms count and the manifestation of the different stages of
the disease
32
Chapter 5
Conclusions and Future Work
The research of genomic-based cancers require highly complex data analysis Such analysis re-
quire most often the use of a large number of complex computational resources the gathering
of a lot of information over the Internet and the use of powerful computational resources Fur-
thermore the manipulation of the computational tools and resources require the assistance of an
informatics expert
The thesis work is a contribution towards the solution of the above mention problem We
propose and developed a framework that enables an expert biologist to perform genomic-based
complex analysis in a easy way and using the required powerful computational resources in a
transparent way
Using the developed framework we have used real data to address several research questions
provided by IPATIMUPrsquos researchers Firstly with the human genome GRCh37 we identified
two of the biomarkers of thyroid cancer by differential gene expression analysis Secondly we
found 689 significant isoforms 179 unique out of 63896 genes (ratio of 028) with an average
of 389 isoforms per gene Thirdly when trying to determine potential novel isoforms we came
at no conclusion of the differences of expression when comparing wFTC and mFTC The last
case was applying the Tuxedo protocol with the new GRCh38 on samples The outcome of the
experiment revealed the importance of saving the original reads and that newer releases become
previous analysis outdated
Future Work
This thesis work is just a starting point As stated before the framework was designed so it can be
extended with further modules to enable addressing other research questions
The case studies also showed us that RNA-seq analysis is very time consuming On the other
hand there are a lot of sub-tasks that can be run in parallel (like the task of aligning the reads)
33
Conclusions and Future Work
We will study and compare different techniques and opportunities to make RNA-seq in parallel as
much as possible
34
References
[bNE] Scitable by Nature Education Transcriptome available at httpwwwnaturecomscitabledefinitiontranscriptome-296 last accessJanuary 2015
[CAB+15] Fiona Cunningham M Ridwan Amode Daniel Barrell Kathryn Beal Konstanti-nos Billis Simon Brent Denise Carvalho-Silva Peter Clapham Guy CoatesStephen Fitzgerald Laurent Gil Carlos Garciacutea Giroacuten Leo Gordon ThibautHourlier Sarah E Hunt Sophie H Janacek Nathan Johnson Thomas Juette-mann Andreas K Kaumlhaumlri Stephen Keenan Fergal J Martin Thomas MaurelWilliam McLaren Daniel N Murphy Rishi Nag Bert Overduin Anne ParkerMateus Patricio Emily Perry Miguel Pignatelli Harpreet Singh Riat DanielSheppard Kieron Taylor Anja Thormann Alessandro Vullo Steven P WilderAmonida Zadissa Bronwen L Aken Ewan Birney Jennifer Harrow Rhoda Kin-sella Matthieu Muffato Magali Ruffier Stephen MJ Searle Giulietta SpudichStephen J Trevanion Andy Yates Daniel R Zerbino and Paul Flicek Ensembl2015 Nucleic Acids Research 43(D1)D662ndashD669 2015
[CFG+10] Peter J A Cock Christopher J Fields Naohisa Goto Michael L Heuer and Peter MRice The Sanger FASTQ file format for sequences with quality scores and theSolexaIllumina FASTQ variants Nucleic acids research 38(6)1767ndash71 April2010
[CH07] Geoffrey M Cooper and Robert E Hausman The Cell - A molecular approachAmerican Society for Microbiology 2007
[Cod70] E F Codd A relational model of data for large shared data banks Communica-tions of the ACM 13(6)377ndash387 June 1970
[Con11] The ENCODE Project Consortium A userrsquos guide to the encyclopedia of DNAelements (ENCODE) PLoS biology 9(4)e1001046 April 2011
[FMB14] N A Fonseca J A Marioni and A Brazma RNA-seq gene profiling - a system-atic empirical comparison Technical report May 2014
[FPMB14] Nuno A Fonseca Robert Petryszak John Marioni and Alvis Brazma irap - anintegrated rna-seq analysis pipeline bioRxiv 2014
[GCW+10] Qiang Gan Iouri Chepelev Gang Wei Lama Tarayrah Kairong Cui Keji Zhaoand Xin Chen Dynamic regulation of alternative splicing and chromatin structurein Drosophila gonads revealed by RNA-seq Cell research 20(7)763ndash83 July2010
35
REFERENCES
[GEN] GENIE Dna genes and chromossomes University of Leicesteravailable at httpwww2leacukdepartmentsgeneticsvgecschoolscollegestopicsdna-genes-chromosomes last access Jan-uary 2015
[Gri] Malachi Griffith Bioinformatics for Cancer Genomics (BiCG)available at httpbioinformaticscaworkshops2012bioinformatics-cancer-genomics-bicg last access January 2015
[GTBK11] Angela Goncalves Andrew Tikhonov Alvis Brazma and Misha Kapushesky Apipeline for RNA-seq data processing and quality assessment Bioinformatics (Ox-ford England) 27(6)867ndash9 March 2011
[HBB+02] T Hubbard D Barker E Birney G Cameron Y Chen L Clark T CoxJ Cuff V Curwen T Down R Durbin E Eyras J Gilbert M HammondL Huminiecki A Kasprzyk H Lehvaslaiho P Lijnzaad C Melsopp E Mon-gin R Pettett M Pocock S Potter A Rust E Schmidt S Searle G SlaterJ Smith W Spooner A Stabenau J Stalker E Stupka A Ureta-Vidal I Vastrikand M Clamp The ensembl genome database project Nucleic Acids Research30(1)38ndash41 2002
[HBD+13] R Hitzemann D Bottomly P Darakjian N Walter O Iancu R SearlesB Wilmot and S McWeeney Genes behavior and next-generation RNA se-quencing Genes Brain Behav 12(1)1ndash12 Feb 2013
[Ins] National Human Genome Research Institute Transcriptome available at httpwwwgenomegov13014330 last access January 2015
[Joh03] Jason M Johnson Genome-wide survey of human alternative pre-mrna splicingwith exon junction microarrays Science 3022141ndash2144 December 2003
[kn10] Gene set enrichment a problem of pathways Briefings in functional genomics9(5-6)385ndash90 December 2010
[kn11] Overview of available methods for diverse RNA-Seq data analyses Science ChinaLife sciences 54(12)1121ndash8 December 2011
[Lan10] Ben Langmead Aligning short sequencing reads with Bowtie Current proto-cols in bioinformatics editoral board Andreas D Baxevanis [et al] Chapter11Unit 117 December 2010
[LM10] Adam Lith and Jakob Mattsson Investigating storage solutions for large data - acomparison of well performing and scalable data storage solutions for real timeextraction and batch insertion of data Masterrsquos thesis 2010
[LTPS09] Ben Langmead Cole Trapnell Mihai Pop and Steven L Salzberg Ultrafastand memory-efficient alignment of short DNA sequences to the human genomeGenome biology 10(3)R25 January 2009
[ORY10] Alicia Oshlack Mark D Robinson and Matthew D Young From RNA-seq readsto differential expression results Genome biology 11(12)220 January 2010
[SG15] Marc W Schmid and Ueli Grossniklaus Rcount simple and flexible RNA-Seqread counting Bioinformatics 31(3)436ndash437 February 2015
36
REFERENCES
[SK11] Christof Strauch and Walter Kriha NoSQL databases Lecture Notes StuttgartMedia University February 2011
[SOdMVN12] Mikhail Shugay Intildeigo Ortiz de Mendiacutebil Joseacute L Vizmanos and Francisco JNovo Genomic hallmarks of genes involved in chromosomal translocations inhematological cancer PLoS Comput Biol 8(12)e1002797 12 2012
[The04] The ENCODE Project Consortium The ENCODE (ENCyclopedia Of DNA Ele-ments) Project Science (New York NY) 306(5696)636ndash40 October 2004
[TPS09] Cole Trapnell Lior Pachter and Steven L Salzberg TopHat discovering splicejunctions with RNA-Seq Bioinformatics (Oxford England) 25(9)1105ndash11 May2009
[TRG+12a] Cole Trapnell Adam Roberts Loyal Goff Geo Pertea Daehwan Kim David RKelley Harold Pimentel Steven L Salzberg John L Rinn and Lior Pachter Dif-ferential gene and transcript expression analysis of RNA-seq experiments withTopHat and Cufflinks Nature protocols 7(3)562ndash78 March 2012
[TRG+12b] Cole Trapnell Adam Roberts Loyal Goff Geo Pertea Daehwan Kim David RKelley Harold Pimentel Steven L Salzberg John L Rinn and Lior Pachter Dif-ferential gene and transcript expression analysis of RNA-seq experiments withTopHat and Cufflinks Nature protocols 7(3)562ndash78 March 2012
[WMM+11] Ying Wang Gaurang Mehta Rajiv Mayani Jingxi Lu Tade Souaiaia YanghoChen Andrew Clark Hee Jae Yoon Lin Wan Oleg V Evgrafov James AKnowles Ewa Deelman and Ting Chen RseqFlow workflows for RNA-Seq dataanalysis Bioinformatics (Oxford England) 27(18)2598ndash600 September 2011
[Wol13] Jochen B W Wolf Principles of transcriptome analysis and gene expressionquantification an rna-seq tutorial Molecular Ecology Resources 13(4)559ndash5722013
[ZW09] Mark Gerstein |amp Michael Snyder Zhong Wang Rna-seq a revolutionary tool fortranscriptomics Nature Reviews Genetics 1057ndash63 January 2009
37
REFERENCES
38
Appendix A
iRAP tools supported
A1 Mappers
Mapper Option name (mapper)TopHat 1 tophat1TopHat 2 tophat2SMALT smaltGSNAP gsnapSOAPsplice soapspliceBWA bwa1BWA bwa2Bowtie 1 bowtie1Bowtie2 bowtie2GEM gemSTAR starOSA osaMapSplice mapsplice
A2 Quantification
Quantifier Option name (quant_method)FluxCapacitor flux_capHT-Seq (union mode) htseq1HT-Seq (intersection non-empty mode) htseq2Cufflinks 1 (try to find novel transcripts-g) cufflinks1Cufflinks 2 (try to find novel transcripts-g) cufflinks2Cufflinks 1 (do not assemble novel transcripts-G) cufflinks1_ndCufflinks 2 (do not assemble novel transcripts-G) cufflinks2_ndNURD nurd
39
iRAP tools supported
A3 Differential expression [DE]
Method Option name (de_method)DESeq deseqDESeq2 deseq2EdgeR edgerCuffdiff 1 cuffdiff1Cuffdiff 2 cuffdiff2
A4 Gene set enrichment analysis [GSE]
Tool Option name (gse_tool)Piano piano
40
Appendix B
iRAP model of configuration file
1 This is a comment (lines that start with a are ignored by iRAP)
2 =============================================================================
3 name that you want to give to the experiment (no spaces)
4 All files produced by irap will be placed in a folder with the given name
5 name=myexp
6
7
8 =============================================================================
9 name of the species
10 species=homo_sapiens
11
12 =============================================================================
13 Fasta file with the reference genome
14 reference=Homo_sapiensGRCh3766dnafa
15
16 =============================================================================
17 GTF file with the annotations
18 gtf_file=Homo_sapiensGRCh3766gtf
19
20 =============================================================================
21 IRAP options (may be providedoverriden in the command line)
22
23
24 Mapper
25 mapper=
26
27
28 Quantification method
29 quant_method=
30
31
32 Dif expression method
33 Requires contrasts to be defined (see below)
41
iRAP model of configuration file
34 de_method=
35
36
37 Gene set enrichment (GSE) analysis
38 Requires de_method to be defined
39 Tool to use (none|piano)
40 gse_tool=piano
41
42 gse_method (mean|median|sum|fisher|fisher-exact|stouffer|tailStrength|wilcoxon|
reporter|page) see Piano vignete documentation for more details
43 gse_method=fisher
44 gse_pvalue=005
45 Minimum number of genes in a gene set
46 gse_minsize=3
47
48
49
50 TSV file with gene annotation
51 Format IDNamelocussourcelnameGOGOtermKEGG
52 Description
53 ID=gene_id (this is mandatory and should match the one given in the gtf file)
54 Name=gene name
55 locus=chrstart--end
56 source=biotype
57 lname=gene name
58 GO=go ids (multiple values can be separated by)
59 GO=GO terms (multiple values can be separated by)
60 KEGG=Kegg ids (multiple values can be separated by)
61 If auto is defined then iRAP will try to generate the file
62 - this may take a considerable amount of time and will only work
63 for a reduced number of species
64 off - default value
65 annot_tsv=
66
67
68 QC
69 Check data (reads) quality (on|off|none)
70 on - reads are filtered out based on their quality
71 off - the quality of the reads is assessed but no filtering is done
72 none- no quality control is performed
73 qual_filtering=on
74
75 Trim all reads to the minimum read size after quality trimming - Yes (y)| No (n)
76 only applicable if qual_filtering is on
77 trim_reads=y
78
79 Minimum base quality accepted (def 10)
80 min_read_quality=10
81
42
iRAP model of configuration file
82 Contamination check (cont_index parameter) Reads that likely
83 originate from organisms other than the one under study can be
84 discarded during pre-processment of the reads This is done by
85 aligning the reads to the genomes of organisms that might be a
86 source of contamination and discard those that map with a high
87 degree of fidelity By default iRAP will check if the data is
88 contaminated by e-coli An example to create a contamination
89 database is provided in the examplesex_add2contaminationDBsh
90 script The value of the parameter should be the file name prefix of
91 the bowtie index files
92
93 Disable contamination check
94 cont_index=no
95 Default value
96 cont_index=$(data_dir)contaminatione_coli
97
98
99 Misc options
100
101 Number of threads that may be used by IRAP
102 max_threads=1
103
104 Exon level quantification Yes (y)| No (n)
105 exon_quant=y
106
107 Transcript level quantification Yes (y)| No (n)
108 transcript_quant=y
109 =============================================================================
110 full or relative path to the directory where all the data can be found
111 data_dir=data
112
113 the directory should be organized as follows (see directory data in IRAP toplevel
directory)
114
115 $data_dir
116 $data_dir
117 contamination
118 e_coli1ebwt
119 e_coli2ebwt
120 e_coli3ebwt
121 e_coli4ebwt
122 e_coliREADME
123 e_colirev1ebwt
124 e_colirev2eb
125 raw_data
126 $species
127 fastq
128 fastq
129
43
iRAP model of configuration file
130 reference
131 $species
132 $gtf_file
133 $reference
134
135 Notes
136 1) $ denotes the value defined for the variable
137 2) Since version 050 the raw data (fastqbam) files may be
138 distributed across several sub-folders
139
140
141 =============================================================================
142 Only necessary if you intend to perform Differential Expression analysis
143
144 contrasts=contrast_def [contrast_def ]
145 contrasts=purpleVsPink purpleVsGrey
146
147 definition of each constrast
148 contrast= group group [ group ]
149 purlpleVsPink=Purple Pink
150 purlpleVsGrey=Purple Grey
151
152 groups
153 GroupName= Library_name [Library_name ]
154 Purlple=myLib1 myLib2
155 Pink=myLib3
156 Grey=myLib4
157
158 optional parameter used in the report (HTML) generation
159 groups=Purple Pink Grey
160
161 technical replicates
162 technicalreplicates=myLib1myLib2myLib3mylib4
163
164 Note names of groups contrasts and libraries should start with a letter and
contain only alphanumeric characters and the character _
165
166 =============================================================================
167 Data
168
169
170 Information for each library
171 LibName=Fastq file
172 Note
173 1 LibName should start with a letter and contain only alphanumeric characters
and the character _ LibName should not contain in _1 or _2
174 2 LibName should be different from the name of the fastq file for instance
175 f1=f1fastq
176 will produce an error
44
iRAP model of configuration file
177
178 Single-end
179 myLib1=f1fastq
180 read size
181 myLib1_rs=75
182 quality encoding (33 or 64)
183 myLib1_qual=33
184
185 strand specific protocol
186 mylib1_strand=first
187 mylib1_strand=second
188 Default value is both (strands)
189 mylib1_strand=both
190
191 Have the file in a different sub-folder
192 mylib1_dir=somesubfolder
193
194 See SAMBAM specification for more details about the following two parameters
195 read group id (to be included in the BAM file) - this is not supported by all
mappers
196 myLib1_rgid=
197 sambam header lines to include in the BAM file
198 myLib1_shl=COtThis is a commentnCOtand another line
199
200 LibName=Fastq file
201 myLib2=f2fastq
202 read size
203 myLib2_rs=75
204 quality encoding (33 or 64)
205 myLib2_qual=33
206
207
208 Paired-end
209 LibName=Fastq files
210 myLib3=f3_1fastq f3_2fastq
211 read size
212 myLib3_rs=50
213 quality encoding (33 or 64)
214 myLib3_qual=33
215 insert size
216 myLib3_ins=350
217 standard deviation
218 myLib3_sd=60
219
220 LibName=Fastq files
221 myLib4=f4_1fastq f4_2fastq
222 read size
223 myLib4_rs=50
224 quality encoding (33 or 64)
45
iRAP model of configuration file
225 myLib4_qual=33
226 insert size
227 myLib4_ins=350
228 standard deviation
229 myLib4_sd=60
230
231
232
233
234 list the names of your single-end (se) and paired (pe) libraries
235 se=myLib1 myLib2
236 pe=myLib3 myLib4
237 No SE data
238 se=
239 No PE data
240 pe=
241
242
243
244 Passingoverriding parameters
245
246 It is possible to pass parameters to the mappers and quantification
247 methods but that should be done carefully since it may break the
248 pipeline (if the location of the input andor output files is
249 changed)
250
251 Overridingchanging the mappersrsquo parameters
252 _map_options=options
253 Example
254 tophat2_map_options=--min-intron-length 5 --no-coverage-search
255
256 Overridingchanging the parameters of the quantification methods
257 _params=options
258 Example
259 htseq_params= -q
46
Appendix C
iRAP example configuration file
1 minimal configuration file for DE
2 experiment name
3 name=ecoli_ex
4 species
5 species=ecoli_k12
6 reference genome
7 reference=Escherichia_coli_str_k_12_substr_mg1655GCA_000005845119dnatoplevel
fagz
8 gtf file
9 gtf_file=Escherichia_coli_str_k_12_substr_mg1655GCA_000005845119gtfgz
10 Enable filtering based on quality
11 qual_filtering=on
12 Use a contamination data set to filter out reads
13 cont_index=no
14 Toplevel directory with the data
15 data_dir=
16
17 some contrasts
18 GA=Group A
19 contrasts=GAvsGB GBvsGA
20 GAvsGB=GA GB
21 GBvsGA=GB GA
22 GA=FA FB FC
23 GB=FD FE FF
24
25 se=FA FB FC FD FE FF
26
27 FA=SRR933983fastqgz
28 FA_rs=50
29 FA_qual=33
30
31 FB=SRR933984fastqgz
32 FB_rs=50
47
iRAP example configuration file
33 FB_qual=33
34
35 FC=SRR933985fastqgz
36 FC_rs=50
37 FC_qual=33
38
39 FD=SRR933989fastqgz
40 FD_rs=50
41 FD_qual=33
42
43 FE=SRR933990fastqgz
44 FE_rs=50
45 FE_qual=33
46
47 FF=SRR933990fastqgz
48 FF_rs=50
49 FF_qual=33
50 EOF
48
- Front Page
- Table of Contents
- List of Figures
- List of Tables
- 1 Introduction
-
- 11 Context
- 12 Motivation and Goals
- 13 Proposed Solution
- 14 Structure of the Dissertation
-
- 2 Basic Concepts and Bibliographic Review
-
- 21 Biological Basic Concepts
-
- 211 Genome
- 212 Transcriptome Assembly and Gene expression
-
- 22 RNA-Seq Analysis
-
- 221 RNA-Seq microarrays and DNA sequencing
- 222 RNA-Seq Pipeline
-
- 23 Standard File Formats used
-
- 231 FASTA
- 232 FASTQ
- 233 SAM and BAM
- 234 GFF and GTF
-
- 24 Relevant Data Repositories
- 25 Tools for RNA-seq and Differential Analysis
- 26 Relational and Non-relational Databases
- 27 Tecnologies
- 28 Related Work
- 29 Chapter Summary
-
- 3 The Gemini framework
-
- 31 Gemini
- 32 Gemini Architecture
-
- 321 Physical Architecture
-
- 33 Data Management
- 34 Web Interface
- 35 Use cases
- 36 Case studies
-
- 361 Full pipeline
- 362 Stage pipeline
-
- 37 Chapter Summary
-
- 4 Case study
-
- 41 Samples characterization
- 42 Researching objectives
- 43 Protocol of analysis
- 44 Genome version GRCh37 versus GRCh38
- 45 Fusion genes
- 46 Results
-
- 461 Case study with reference genome GRCh37
- 462 Splicing analysis
- 463 Case study with reference genome GRCh38
-
- 47 Chapter Summary
-
- 5 Conclusions and Future Work
- References
- A iRAP tools supported
-
- A1 Mappers
- A2 Quantification
- A3 Differential expression [DE]
- A4 Gene set enrichment analysis [GSE]
-
- B iRAP model of configuration file
- C iRAP example configuration file
-
Basic Concepts and Bibliographic Review
23 Standard File Formats used
For the implementation of the previous pipeline some file formats are used to input or retrieve
data Below will be presented the most widely used ones along with some short description and
detail when needed
231 FASTA
FASTA 6 is the definition line and sequence character format used by NCBI 7 It is a text-based for-
mat for representing either nucleotide (DNA or RNA) or amino acid (protein) sequences FASTA
is commonly used since it is easy to manipulate and parse using text-processing tools and scripting
languages Usually in iRAP a FASTA format is used to store the a reference genome
232 FASTQ
FASTQ 8 provides a simple extension to the previous format the ability to store a numeric quality
score associated with each nucleotide in a sequence [CFG+10] It is generally used as the first
input with the raw data
233 SAM and BAM
SAM 9 is a generic format for storing large nucleotide sequence alignments It is easy to under-
stand easy to parse and easy to generate and check for errors Despite the presented qualities
SAM is slow to parse so a binary equivalent to it BAM has been developed to deal with this issue
BAM is used to intensive data processing and is useful in most product pipelines while SAM has
appropriate for interconversion with external applications and exploratory analysis Like FASTQ
BAMSAM formats are widely used as containers for raw sequence data
234 GFF and GTF
GFF 10 is a format for describing genes and other features associated with DNA RNA and Protein
sequences It was originally proposed as a protocol for the transfer of genomic feature information
allowing people to develop and test them without having to maintain a complete feature-finding
system The second version also allows for feature sets to be defined over RNA and Protein
sequences as well as genomic DNA
On the other hand GTF 11 stands for Gene transfer format and has been developed on top
of GFF specification The first eight GTF fields are the same as GFF The group field has been
6FASTA format httpgeneticsbwhharvardedupphFASTAhtml7NCBI httpwwwncbinlmnihgov8FASTQ format httpmaqsourceforgenetfastqshtml9SAM and BAM file formats httpsamtoolssourceforgenetSAMv1pdf
10GFF format httpwwwsangeracukresourcessoftwaregffspechtml11GTF format httpwwwensemblorginfowebsiteuploadgffhtml
12
Basic Concepts and Bibliographic Review
expanded into a list of attributes Each attribute consists of a typevalue pair Attributes must end
in a semi-colon and be separated from any following attribute by exactly one space
24 Relevant Data Repositories
It is important to validate results and test along with the implementation of RNA-Seq pipeline As
such real data are needed so that the quality and efficiency of this study is assessed Some repos-
itories are available online such as Gene Expression Omnibus (GEO 12) Genomic Data Sharing
(GDS 13) ENSEMBL 14 UCSC Genome Browser 15 or the ENCODE Project 16 The three last
ones are highlighted in next section
ENSEMBL
The Ensembl project provides information about many vertebrate and other eucaryotic species
being started in 1999 some years before the draft human genome was completed Until today
many genomes have been added over the years as well as the inclusion of comparative genomics
variation and regulatory data [HBB+02]
Between the included working teams of Ensembl the Genebuild is the one who is responsible
to create the gene sets both as developing and mantaining the BioMart 17 data mining tool
It also supplies a REST server 18 as well as an FTP tool for browse and download data [CAB+15]
UCSC Genome Browser
The UCSC Genome Browser is a website that consists of an open-source tool to browse
analyze and query genomic data Currently it grants access to some reference genomes giving the
possibility to retrieve specific data due to the search tool integrated
Along with this tool it is also available an FTP server where data can be accessed and down-
loaded
ENCODE Project
While ENSEMBL has information about many vertebrate and other species ENCODE is a
project to identify all functional elements in the human genome sequence as well as being able
to create comprehensive high quality catalogs of functional elements in the human genome using
highndashthroughput technologies Their mission is to enable the scientific and medical communities
12GEO httpwwwncbinlmnihgovgeo13GDS httpgdsnihgov02dr2html14ENSEMBL httpwwwensemblorgindexhtml15UCSC Genome Browser httpgenomeucscedu16ENCODE project httpswwwencodeprojectorg17BioMart httpbiomartorg18REST server of Ensembl httprestensemblorg
13
Basic Concepts and Bibliographic Review
to interpret the human genome sequence and apply it to understand human biology and improve
health [The04]
Besides their motivation an online repository is being build up indexing gathered data and
allowing users to query different data types regardless of location [Con11] Some samples can
be found at httpswwwencodeprojectorgexperimentsENCSR274JRR for ex-
ample
25 Tools for RNA-seq and Differential Analysis
To perform the RNA-Seq pipeline some tools for each process are required It is now presented
some set of them on the following sections
Bowtie
Bowtie 19 is a tool to align short reads to the human genome To achieve speed and memory-
efficiency Bowtie aligns reads with the aid of an index of the reference genome [Lan10] and can
take advantage of the use of simultaneous multiple processor cores [LTPS09] For the human
genome Burrows-Wheeler is a commonly used indexing process that this tool extends with a
novel quality-aware backtracking algorithm that permits mismatches
TopHat
TopHat 20 is used as a junction mapping tool for RNA-Seq reads Before TopHat current
mapping strategies could only localize reads to known exons in the genome This tool is a read-
mapping algorithm design to align reads to a reference genome without relying on know splice
sites [TPS09]
Cufflinks
Cufflinks 21 assembles transcripts estimates their abundances and tests for differential ex-
pression and regulation in RNA-Seq samples Internally it is made of four different parts Cuf-
flinks that assembles the package Cuffcompare that compares transcript assemblies to annotation
Cuffmerge that merges two or more transcript assemblies and Cuffdiff that takes the aligned reads
and reports genes and transcripts that are differentially expressed [TRG+12a]
HTSeq
19Bowtie httpbowtie-biosourceforgenetindexshtml20TopHat httpccbjhuedusoftwaretophatindexshtml21Cufflinks httpcole-trapnell-labgithubiocufflinks
14
Basic Concepts and Bibliographic Review
HTSeq 22 is a python framework to facilitate the rapid development of scripts to processing
and analysis of high-throughtput sequencing data
FASTQC
FASTQC 23 is a quality control tool for high-throughput sequencing data It receives as input
BAM SAM or FASTQ files provides a quick overview on which areas there may be problems
summarizes graphs and tables for a fast assess of data and exports results to an HTML based report
Samtools
Samtools 24 is a set of utilities to manipulate alignments in the BAM format (output format of
TopHat eg) It does sorting merging and indexing and allows to retrieve in any regions The
files can be either provided via standard input (stdin) of from a remote FTP or HTTP server
deFuse
deFuse 25 is a software for gene fusion discovery from RNA-Seq data It uses clusters of dis-
cordant paired alignments to inform a split read alignment analysis for finding fusion boundaries
As an output it produces a fully annotated output for each predicted fusion
26 Relational and Non-relational Databases
Relational Databases had been introduced in 1970 by Edgar Codd at IBM Almaden Research
Center [Cod70] It has been used for decades and has brought in the concept of relations With
this a relational database is usually represented by a structured model a table in which each row is
a tuple (also considered as an object) and the columns are the attributes of the tuple The database
can be queried in order to retrieve useful data based on their attributes whether in common between
tuples or not To do so it is used a structured query language SQL [LM10] The main set of
operations is known as CRUD Create Read Update and Delete Relational databases are also
know for their fixed schemas that force every tuple to have the exact same attributes
A very common operation in SQL databases are joins Joins are a way to associated data that
share attributes or are somehow related One example is imagining a table of people that have
bank accounts associated and there is another table where the existing banks are described A way
to relate them is to combine these two tables in order to directly view which individual is using
which bank This is a very simple example that can scale very quickly and become a dangerous
operation for the consumed resources to be used to compute the needed relationships
22HTSeq httpwww-huberembldeHTSeqdocoverviewhtml23FASTQC httpwwwbioinformaticsbabrahamacukprojectsfastqc24Samtools httpsamtoolssourceforgenet25deFuse httpsbitbucketorgdranewdefuse
15
Basic Concepts and Bibliographic Review
In contrast with the previous set a Non-relational database commonly doesnrsquot have a fixed
schema and avoid the previous complex operation Within this class of databases there are different
approaches to the used models such as key-value stores big table clones document databases and
graph databases Each of them is used accordingly to the data set complexity
MongoDB 26 is a non-relational database schemaless and is scalable in cluster performance
and data This way it provides a way to store large data sets with the freedom of using different
schemas according to data 27
27 Tecnologies
When developing a web service there are some basic resources and programming languages used
HTML 28 is a standard markup language for describing web documents CSS 29 is used for
defining how the HTML elements are to be displayed Bootstrap 30 is a free front-end frame-
work for faster and easier web development and contains HTML and CSS based design patterns
Javascript 31 serves as a method for programming the behavior of web pages jQuery 32 is a library
of Javascript that greatly specifies Javascriptrsquos usage
Even though commonly used PHP 33 is not the best suitable language for our thesis work
When compared to Python it lacks security and is not used on the Bioinformatics field On the
other hand Perl has been greatly used on this field but it is currently being replaced by Python 34
Furthermore this last one has libraries like BioPython 35 for internal processing of samples and
also has support to web through frameworks like Django 36 or BottlePy 37
Even though Django is trending it has no support for NoSQL relational databases yet Bot-
tlePy for instance is a lightweight web framework simple to use and provides the ability to use
MongoDB
Concerning the situation the combination of Python and BottlePy is the most suitable since it
has
bull Starting to replace Perl in bioinformatics processing
bull Support for NoSQL databases (either the framework and the programming language)
bull Lightweight usage
26MongoDB httpwwwmongodborg27MongoDB scalability httpwwwmongodbcommongodb-scale28HTML httpwwww3schoolscomhtml29CSS httpwwww3schoolscomcssdefaultasp30Bootstrap httpgetbootstrapcom31Javascript httpwwww3schoolscomjs32jQuery httpsjquerycom33PHP httpphpnet34Python httpswwwpythonorg35BioPython httpbiopythonorgwikiMain_Page36Django framework httpswwwdjangoprojectcom37BottlePy httpbottlepyorgdocsdevindexhtml
16
Basic Concepts and Bibliographic Review
Figure 26 Print screen of Galaxy when trying to get data from UCSC
For the purpose of sending the information between devices the FTP server solution was
analysed It allows the creation of an administrator user that has the permissions for writing and
reading but also for anonymous users that can only download data
28 Related Work
Galaxy
Galaxy 38 is an open source web-based platform for data intensive biomedical research
It consists of an embedded website system that provides access to different databases such
as Ensembl or UCSC Genome Browser Although functional the platform has not a consistent
interface which requires the user to learn to use many systems within it An example of this
situation can be viewed in Figure 26 Furthermore it does not provide the ability to choose easily
a stage pipeline like iRAP or to run a full one with personalized tools
BioMart Central Portal
BioMart 39 is a community-driven project to provide unified access to distributed research data
to facilitate the scientific discovery process
38Galaxy httpgalaxyprojectorg39BioMart Central Portal httpcentralbiomartorgsequencegui=Sequence_retrievalamp
mart=metaseq_mart_63_config
17
Basic Concepts and Bibliographic Review
It currently has a sequence retrieval tools that provides searching by database and dataset
Nowadays this tool offers Ensembl as the only available database but it adds up three other fea-
tures like a sequences filters and header information panels where the users can improve their
search
29 Chapter Summary
In this chapter we presented and discussed the technologies suitable for the thesis work We have
surveyed alternative technologies for gene expression computation and alternative splicing tools
The technologies are relevant to solve the Biological domain problem We have also surveyed
the tools for the development of websites and databases to store the data used when solving the
biological problems In the next chapter we describe work in detail
18
Chapter 3
The Gemini framework
Despite the very large number of tools available for Molecular Biology problems they are most
often difficult to use and require sophisticated computational resources As part of the thesis
work we have developed a framework that allows expert users to make RNA-Seq and alternative
splicing analysis using a user friendly web interface and sophisticated computational resources
In this chapter we describe that framework that include the website database resources for storing
data and the computational settings for the analysis
iRAP has been chosen to accomplish the automation of RNA sequencing analysis due to the
simplicity of use and its wide number of tools available for its task Since it is an integrated
tool platform its installation requires not only powerful computer resources but also a long list of
basic equipment necessary to each of them Considering these issues it had not always been easy
to setup the wanted work environment
Despite the difficulties of this scenario we have been able to complete the setup of this tool
and make some control experiments with it
In order to accomplish an iRAP execution a configuration file must be provided (see Ap-
pendix B) Along with the experiment name the name of species being analysed the reference
genome and read data files need to be specified and made available Furthermore the specific
tools for each stage of the pipeline need also to be specified among other possible variables
It is not easy and usually very time consuming for a Biologist to create the configuration file or
to run the command-line interface that controls iRAP pipeline Since this system is a combination
of many different tools there are a long list of available options that may be fulfilled Some of
them are mandatory while other ones are optional After this setting is completed it must be saved
in a text file and made available to run iRAP
Even though the usage of iRAP does not require extensive bioinformatics expertise it does
assume familiarity with UNIX command-line interface which would narrow down the target audi-
ence In order to overcome this situation we designed and developed a framework called Gemini
19
The Gemini framework
that includes a Graphical User Interface and makes RNA-Seq studies much more easy to perform
We have also included extra features for doing more analysis to RNA-Seq data
31 Gemini
Due to the lack of intuitiveness on the process of generating the configuration file it has been
created a more user friendly one through a web form This form asks for input of the main settings
to call a very simple experiment with a commonly used bacteria escherichia ecoli (e coli)
Another important feature is the possibility to fill the form asking what is the stage that the user
wants the pipeline to start with
Another issue was to find and easily download a reference genome for a certain species In
order to add completeness to Gemini and also to simplify the process of download it has been
implemented the functionality to download the reference genome (both fasta and annotation files)
It is used the Ensembl API to obtain the required results The jobs status feature lists the status of
jobs sent by the user for execution
Besides these features one more have been added even though not completed It is the job
results where it is presented the results collected for a determined task
32 Gemini Architecture
321 Physical Architecture
Gemini is divided into two different sets The first one is where the web application is hosted as
well as the database Since dealing with genomic data often requires great computer performance
processing experiments is accomplished in an independent server that later responds with results
Figure 31 Physical architecture of Gemini
Data scheme
MongoDB is NoSQL document based database The information is organized in collections
in which each element is stored as a JSON document NoSQL databases are simpler to use when it
20
The Gemini framework
comes to have different information fields in the same document and at the same time they have
better performance and scalability [SK11] Currently the information is arranjed in two collections
scheme as described on Table 31
Name DescriptionAccounts Stores the users dataJobs Stores the experiments dataTable 31 Collections used to store data
Accounts
An accountrsquos document stores an userrsquos email password and a unique identifier A role has
also been saved for future hierarchy creation in which some levels will grant more permissions
than others like changing accounts settings of other participants
1
2 _id ObjectId(54f5a9b234f76511a82ec3b2)
3 password e10adc3949ba59abbe56e057f20f883e
4 role user
5 email acgggomesgmailcom
6
Jobs
Jobs are related to an user and have the name and description of the experiment It also
stores the reference genomersquos location as well as the readsrsquo one Likewise the date of creation is
preserved When a job is completed the status is modified to finished
1
2 _id ObjectId(5544ecf134f7651d687bba94)
3 name ExpFinal
4 exp_dir data54f5a9b234f76511a82ec3b2ExpFinalreads
5 user 54f5a9b234f76511a82ec3b2
6 description Final test
7 genome_dir genomesEscherichia coli
8 status started
9 date ISODate(2015-05-02T152745249Z)
10
21
The Gemini framework
33 Data Management
In order to create a new job it is required two sets of data namely reference files and raw data
files The raw data is the actual data being analysed while the reference genome serves as basis to
the alignment or control
The typical workflow consists on the expert providing the experience and species names as
well as the raw data that was previously collected in the laboratory Afterwards through a step by
step system the user has the option to choose the reference genome to be used on the experiment
This last files are internally obtained from different FTP servers such as Ensembl and ENCODE
stored locally and reused in further usages
The provided information is then saved in the database and the files stored hierarchically We
use the following sequence of ltsection namegt ltuseridgt ltexperience namegt ltdata filesgt The
ltsection namegt can be conf for storing configuration files data for saving the reads or refer-
ence for keeping the reference genome and annotation files The ltuseridgt is the ID of Accounts
database document and the ltexperience namegt is the same as name in Jobs database document
A directory tree is represented in Figure 32
Figure 32 File system tree demonstrating the hierarchy of saved data files
This information is then passed to the server via a local FTP server that has been created
22
The Gemini framework
for this purpose We have followed an online tutorial 1 for the configuration From this we
created one administrator that has permissions for writing and reading files and we also authorized
anonymous login that may only retrieve files This way on the web application the admin user
creates the reads reference genomes annotation and configuration files On the computational
server an anonymous user authenticates for retrieving the files according to the filenames received
via API
The inside directory of FTP follows the hierarchy of ltuseridgt ltexperience namegt ltdata
filesgt where ltuseridgt is the ID on the Accounts document and ltexperience namegt is the name
on Jobs document When the server is prompted to run an experience it downloads the required
data from the FTP and runs iRAP with the necessary configuration options
34 Web Interface
For the implementation of Gemini python has been used for backend along with a simple fast and
lightweight WSGI micro web-framework called BottlePy 2 It has no dependencies and grants the
main functionalities such as routing templates some class utilities and a built-in server
The first screenshot (Figure 33) shows the home page of Gemini There is top menu bar with
two possible interactions login and register There is also a simple content box that describes the
main features and status of development of the platform Later on a new menu appears with the
possibility to logout on the Welcome tab (as in Figure 34)
Figure 33 Home page
Figure 34 Logout menu
1Tutorial available at httpswwwthomas-krenncomenwikiSetup_FTP_Server_under_Debian
2BottlePy httpbottlepyorgdocsdevindexhtml
23
The Gemini framework
The main feature of the system is the create job (Figure 35) option that is easily accessible on
top menu When the user clicks on it a form is displayed with the variables to introduce on the
configuration file that iRAP needs A description option has been added to provide the freedom to
the researcher to include some extra information that he finds useful
Figure 35 Create job form
The same type of form was used for the reference genomes section (Figure 36) The user is
prompted to choose orderly the species name release number and version Afterwards a table of
elements appears allowing the expert to download the files found
Figure 36 Reference genomes component
24
The Gemini framework
35 Use cases
Gemini was designed to have only one actor the user that will accomplish the experiments This
actor has the possibility to register login and logout of his account create a job and the hability
to download a reference genome of his choice Even though not fully implemented it has been
considered the jobs done functionality
Figure 37 Use cases diagram
36 Case studies
Some case studies with e coli in order to test iRAPrsquos installation and its capabilities For both
of the case studies it has been collected six samples of Escherichia coli reads from European
Nucleotide Archive 3 and the corresponding reference genome and annotation file from Ensembl
361 Full pipeline
In order to call the full pipeline iRAP has been tested with the directive irap conf=ecoli_exconf
Configuration file (ecoli_exconf ) content is as described in Appendix C In this task the system
received the reads and performed the quality control (QC) mapping quantification and differential
expression between the two groups of samples
3ENA httpwwwebiacukena
25
The Gemini framework
This test has been accomplished successfully
362 Stage pipeline
The stage pipeline is a powerful functionality since it allows the user to choose a specific stage of
the pipeline that he wants to execute for his samples
Besides the fact that it is not easy to collect data samples users often want to repeat or analyse
just one step of the pipeline and take some conclusions of it Furthermore this type of pipeline is
less time consuming
A concrete usage example is IPATIMUPrsquos data which contains the output information of the
mapper TopHat and will be further analysed in detail in Chapter 4 Concerning this setup it would
not be possible to call the full pipeline but instead it would require a command specific command
option
For validation purposes the same bacteria from the previous analysis has been used for the
stage pipeline case After calling the setup command to check input the directive irap conf=
ecoli_exconf quality_filtering_and_reporting has been used to perform the stage1
of iRAP The platform was able to perform with success this task
37 Chapter Summary
It has been used Python with BottlePy for the main implementation of the interface of Gemini
MongoDB has been chosen for dealing with information A FTP server was mounted for the
transitions of data between the client and the server The platform allows the expert to call a full or
stage pipeline analysis and provides the download of both fast and annotation files The essential
items are setup for the addition of further functionalities
26
Chapter 4
Case study
In this chapter it is going to be presented the Case Study with data from samples of thyroid carci-
noma along with their charactering and researching results
After the development of an interface to the iRAP tool the following step was to do a case
study with some realistic DNA samples of thyroid cancer patients regarding the partnership with
IPATIMUPrsquos researchers
The purpose of this case study was to do some research of potential differences between dis-
tinct types of the disease In order to accomplish this four samples were collected from Centro
Hospitalar de Satildeo Joatildeo (Porto) Cases 1 and 2 have been categorized as a widely invasive Fol-
licular Thyroid Carcinoma (wFTC) and cases 3 and 4 as a minimally invasive Follicular Thyroid
Carcinoma (mFTC)
41 Samples characterization
Patient from case 1 was female with 82 years old the tumour measuring 2 cm of size and presented
a predominant follicular growth pattern and oncocytic features Patient from case 2 was male with
55 years old the tumour measuring 5 cm of size and presented a predominant solidtrabecular
growth pattern For the group of mFTC patient from case 3 was female 56 years old the tumour
measuring 37 cm of size and with follicular growth pattern patient from case 4 was female 56
years old the tumour measuring 4 cm of size and with follicular growth pattern
42 Researching objectives
The aim of the study was to answer the following questions
bull Differentially expressed genes
bull Total isoforms found either in percentange and in absolute
27
Case study
bull Average of alternative isoforms for each gene spliced
bull Potentially novel isoforms and how do they behave between samplesgroups of samples
bull Compare results between versions of human genome assembly
bull Retrieve fusion genes
43 Protocol of analysis
Collected sample reads have been aligned against reference genome GRCh37 with TopHat version
141 Posterior analysis followed Tuxedo Protocol as described in Trapnell et al [TRG+12b] An
overview of the full protocol can be found in Figure 41
For the implementation of this procedure it were considered as two different groups the cases
1 and 2 (wFTC) against cases 3 and 4 (mFTC) The following step was to assemble transcripts for
each sample with Cufflinks 1 and afterwards create a single merged transcriptome annotation with
Cuffmerge 2 Cuffdiff 3 was then used to find significant changes in transcript expression
In order to find potential isoforms each sample was ran against the reference genome with
Cuffcompare 4
44 Genome version GRCh37 versus GRCh38
Even though IPATIMUPrsquos data have been assembled with reference genome version GRCh37
nowadays a more recent version (GRCh38) has been released in 2013 This new assembly is the
first major revision of the human genome in more than four years 5
The main differences between this two versions are
Alternate sequences several human chromosomal regions have sufficient variability to prevent
adequate representation by a single sequence This new version provides alternate sequence
for selected variant regions through the inclusion of alternate loci 6 scaffolds
Centromere 7 representation Previous method of representing centromeric regions have been
replaced by sequences from centromere models The models provide the approximate repeat
number and order for each centromere and are useful for read mapping and variation studies
Mitochondrial genome The new mitochondrial reference sequence is the Revised Cambridge
Reference Sequence with RefSeq accession number NC_0129201 The previous one was
RefSeq accession number NC_001907 which was not updated when GRCh37 assembly
later transitioned to the new version1Cufflinks httpcole-trapnell-labgithubiocufflinks2Cuffmerge httpcole-trapnell-labgithubiocufflinkscuffmergeindexhtml3Cuffdiff httpcole-trapnell-labgithubiocufflinkscuffdiffindexhtml4Cuffcompare httpcole-trapnell-labgithubiocufflinkscuffcompareindexhtml5As in UCSC mailing list at httpsgroupsgooglecomasoeucsceduforumtopic
genome-announce52Kv41YBXNY6Specific location of a gene on a chromosome
28
Case study
Figure 41 An overview of the Tuxedo Protocol with full steps TopHat for alignment Cufflinkspackage to find differential features between group samples and in the end CummeRbund to plotprevious results
Sequence updates Several erroneous bases and misassembled regions have been corrected and
more than 100 gaps have been filled or reduced
Analysis set The new assembly offers an analysis set that was created to accommodate next
generation sequencing read alignment pipelines Several GRCh38 regions have been elimi-
nated from this set to improve read mapping
29
Case study
45 Fusion genes
After we done some research on the technologies used for finding fusion genes in the reads we
have not been able to perform the analysis to answer the last question of our researching objectives
DeFuse required as input the original reads which were not provided This analysis would have
been interesting for relating the ocurrence of thyroid and the presence of fusion genes as well as if
there was any relevant difference between the samples of wFTC and mFTC
46 Results
461 Case study with reference genome GRCh37
The following table ( 41) demonstrates some genes that were differentially expressed with signif-
icance between mFTC and wFTC According to Celestino et al 8 CRABP1 C1QL1 and LCN2
are biomarkers of thyroid cancer and predictors of extrathyroidal extension It is commonly used
the value of 005 has threshold above which the differential expression is significant By inspect-
ing out the table we can find C1QL1 with a q-value of 0000555 and CRABP1 with a q-value
of 159E-11 which are in concordance with the previous article Furthermore it is verified the
increased gene expression in wFTC when compared to mFTC
Gene ID Gene Chr mFTC wFTC Fold change(log2) Q value
ENSG00000167748 KLK1 19 018672 111924 922742 0ENSG00000104725 NEFL 8 00196645 276961 104599 0ENSG00000174145 KIAA1239 4 00307388 144265 887444 0ENSG00000182379 NXPH4 12 008307 195786 788074 0ENSG00000131094 C1QL1 17 0121453 238957 429828 0000555ENSG00000142677 IL22RAI 1 150905 0384783 -529345 0ENSG00000138615 CILP 15 423569 0052726 -632793 241E-11ENSG00000141431 ASXL3 18 18938 001408 -707148 124E-09ENSG00000166426 CRABP1 15 748375 0367899 -766831 159E-11ENSG00000214145 LINC00887 3 19797 0119327 -737421 0000459
Table 41 Genes differentially expressed between minimally invasive follicular thryoid carcino-mas (mFTCs) and widely invasive follicular thyroid carcinomas (wFTCs)
In response to the previous researching objectives the Table 42 has the statistical results for
taks two and three From the data analysis we could conclude that less than 1 of genes have
isoforms but each one has an average of 389 alternatives
8Ricardo Celestino Torfin Nome Ana Pestana Andreas M Hoff Pedro A Gonccedilalves Catarina Eloy Eva SigstadRagnhild A Lothe Trine Bjoslashro Manuel Sobrinho-Simotildees Rofl I Skotheim Paula Soares CRAPBP1 C1QL1 andLCN2 are biomarkers of thyroid cancer and predictors of extrathyroidal extension subbmited for publication
30
Case study
Total genes 63896Total significant isoforms 689Total unique genes with isoforms 179Ratio of unique genes with isoformsgenes () 028Average of alternatives per gene with isoforms 389
Table 42 Statistical results for researching objectives number 2 and 3
462 Splicing analysis
Forward in the analysis Cuffcompare 9 has been used to search for novel isoforms when com-
pared to the reference genome The method was to compare each sample to the reference genome
and afterwards make an overlap of the results The main objective was then to infer about the
differences among wFTC and mFTC
Sample 1(wFTC)
Sample 2(wFTC)
Sample 3(mFTC)
Sample 4(mFTC)
Total genes 30440 36862 35539 37534Potential novel isoforms 7406 8450 8781 8830Table 43 Potential novel isoforms for each sample of IPATIMUPrsquos data
As demonstrated on Table 43 average there is a percentage of 24 of potentially novel iso-
forms found (at least one spliced junction is shared with a reference transcript) There is been
made an overlap of the results in order to encounter differences between wFTC and mFTC The
Table 44 presents the counting of differences between cases A brief analysis allows us to say
that we can not make any relationship between wFTC and mFTC On average there was a total of
3722 changes among this two sets The average within the sets are 3554 for wFTC and 3992 for
mFTC Given this results there was not a significant divergence to allow us to relate the splicing
and the occurrence of a more invasive Thyroid Carcinoma
Sets ChangesS1 S2 3554S1 S3 3609S1 S4 3612S2 S3 3847S2 S4 3820S3 S4 3929
Table 44 Number of differences between samples Syntax used S1 - Sample 1 S2 - Sample 2S3 - Sample 3 and S4 - Sample 4
9Cuffcompare httpcole-trapnell-labgithubiocufflinkscuffcompareindexhtml
31
Case study
463 Case study with reference genome GRCh38
In order to respond to the last research objective it has been applied the method of analysis has
before with a more recent human genome assembly After using the same protocol with Cufflinks
Cuffmerge and Cuffdiff sequentially we have come to some conclusions
The produced results of differential expression analysis for the same genes were very different
Genes that were highly significant before like C1QL1 and CRABP1 now had no relevance (q-
value gt 005) As mentioned before we had only access to TopHatrsquos output that used version
GRCh37 for the alignment and mapping process so we could not start from scratch the analysis
This outcome demonstrates two topics in particular
1 the introduction of novel annotations can make previous analysis outdated
2 there is the need to save the original reads in order to update earlier studies
The solution to this situation would have been to use the original reads to repeat the assembly
and then follow the Tuxedo protocol to collected correct and updated differential expression data
47 Chapter Summary
These section of development has been introduced in order to confer not only validation but also
to do some researching studies on the subject Four samples were collected and divided into two
distinct groups Tuxedo protocol was followed for responding to the research objectives The
case study for GRCh37 demonstrated the expression of C1QL1 and CRABP1 on wFTC when
compared to mFTC as indicated in the referred article On the other hand the same protocol when
applied with GRCh38 demonstrated the importance of saving the original reads and what is the
influence of newer releases in previous researching results Lastly the splicing analysis results did
not show any evidence of related isoforms count and the manifestation of the different stages of
the disease
32
Chapter 5
Conclusions and Future Work
The research of genomic-based cancers require highly complex data analysis Such analysis re-
quire most often the use of a large number of complex computational resources the gathering
of a lot of information over the Internet and the use of powerful computational resources Fur-
thermore the manipulation of the computational tools and resources require the assistance of an
informatics expert
The thesis work is a contribution towards the solution of the above mention problem We
propose and developed a framework that enables an expert biologist to perform genomic-based
complex analysis in a easy way and using the required powerful computational resources in a
transparent way
Using the developed framework we have used real data to address several research questions
provided by IPATIMUPrsquos researchers Firstly with the human genome GRCh37 we identified
two of the biomarkers of thyroid cancer by differential gene expression analysis Secondly we
found 689 significant isoforms 179 unique out of 63896 genes (ratio of 028) with an average
of 389 isoforms per gene Thirdly when trying to determine potential novel isoforms we came
at no conclusion of the differences of expression when comparing wFTC and mFTC The last
case was applying the Tuxedo protocol with the new GRCh38 on samples The outcome of the
experiment revealed the importance of saving the original reads and that newer releases become
previous analysis outdated
Future Work
This thesis work is just a starting point As stated before the framework was designed so it can be
extended with further modules to enable addressing other research questions
The case studies also showed us that RNA-seq analysis is very time consuming On the other
hand there are a lot of sub-tasks that can be run in parallel (like the task of aligning the reads)
33
Conclusions and Future Work
We will study and compare different techniques and opportunities to make RNA-seq in parallel as
much as possible
34
References
[bNE] Scitable by Nature Education Transcriptome available at httpwwwnaturecomscitabledefinitiontranscriptome-296 last accessJanuary 2015
[CAB+15] Fiona Cunningham M Ridwan Amode Daniel Barrell Kathryn Beal Konstanti-nos Billis Simon Brent Denise Carvalho-Silva Peter Clapham Guy CoatesStephen Fitzgerald Laurent Gil Carlos Garciacutea Giroacuten Leo Gordon ThibautHourlier Sarah E Hunt Sophie H Janacek Nathan Johnson Thomas Juette-mann Andreas K Kaumlhaumlri Stephen Keenan Fergal J Martin Thomas MaurelWilliam McLaren Daniel N Murphy Rishi Nag Bert Overduin Anne ParkerMateus Patricio Emily Perry Miguel Pignatelli Harpreet Singh Riat DanielSheppard Kieron Taylor Anja Thormann Alessandro Vullo Steven P WilderAmonida Zadissa Bronwen L Aken Ewan Birney Jennifer Harrow Rhoda Kin-sella Matthieu Muffato Magali Ruffier Stephen MJ Searle Giulietta SpudichStephen J Trevanion Andy Yates Daniel R Zerbino and Paul Flicek Ensembl2015 Nucleic Acids Research 43(D1)D662ndashD669 2015
[CFG+10] Peter J A Cock Christopher J Fields Naohisa Goto Michael L Heuer and Peter MRice The Sanger FASTQ file format for sequences with quality scores and theSolexaIllumina FASTQ variants Nucleic acids research 38(6)1767ndash71 April2010
[CH07] Geoffrey M Cooper and Robert E Hausman The Cell - A molecular approachAmerican Society for Microbiology 2007
[Cod70] E F Codd A relational model of data for large shared data banks Communica-tions of the ACM 13(6)377ndash387 June 1970
[Con11] The ENCODE Project Consortium A userrsquos guide to the encyclopedia of DNAelements (ENCODE) PLoS biology 9(4)e1001046 April 2011
[FMB14] N A Fonseca J A Marioni and A Brazma RNA-seq gene profiling - a system-atic empirical comparison Technical report May 2014
[FPMB14] Nuno A Fonseca Robert Petryszak John Marioni and Alvis Brazma irap - anintegrated rna-seq analysis pipeline bioRxiv 2014
[GCW+10] Qiang Gan Iouri Chepelev Gang Wei Lama Tarayrah Kairong Cui Keji Zhaoand Xin Chen Dynamic regulation of alternative splicing and chromatin structurein Drosophila gonads revealed by RNA-seq Cell research 20(7)763ndash83 July2010
35
REFERENCES
[GEN] GENIE Dna genes and chromossomes University of Leicesteravailable at httpwww2leacukdepartmentsgeneticsvgecschoolscollegestopicsdna-genes-chromosomes last access Jan-uary 2015
[Gri] Malachi Griffith Bioinformatics for Cancer Genomics (BiCG)available at httpbioinformaticscaworkshops2012bioinformatics-cancer-genomics-bicg last access January 2015
[GTBK11] Angela Goncalves Andrew Tikhonov Alvis Brazma and Misha Kapushesky Apipeline for RNA-seq data processing and quality assessment Bioinformatics (Ox-ford England) 27(6)867ndash9 March 2011
[HBB+02] T Hubbard D Barker E Birney G Cameron Y Chen L Clark T CoxJ Cuff V Curwen T Down R Durbin E Eyras J Gilbert M HammondL Huminiecki A Kasprzyk H Lehvaslaiho P Lijnzaad C Melsopp E Mon-gin R Pettett M Pocock S Potter A Rust E Schmidt S Searle G SlaterJ Smith W Spooner A Stabenau J Stalker E Stupka A Ureta-Vidal I Vastrikand M Clamp The ensembl genome database project Nucleic Acids Research30(1)38ndash41 2002
[HBD+13] R Hitzemann D Bottomly P Darakjian N Walter O Iancu R SearlesB Wilmot and S McWeeney Genes behavior and next-generation RNA se-quencing Genes Brain Behav 12(1)1ndash12 Feb 2013
[Ins] National Human Genome Research Institute Transcriptome available at httpwwwgenomegov13014330 last access January 2015
[Joh03] Jason M Johnson Genome-wide survey of human alternative pre-mrna splicingwith exon junction microarrays Science 3022141ndash2144 December 2003
[kn10] Gene set enrichment a problem of pathways Briefings in functional genomics9(5-6)385ndash90 December 2010
[kn11] Overview of available methods for diverse RNA-Seq data analyses Science ChinaLife sciences 54(12)1121ndash8 December 2011
[Lan10] Ben Langmead Aligning short sequencing reads with Bowtie Current proto-cols in bioinformatics editoral board Andreas D Baxevanis [et al] Chapter11Unit 117 December 2010
[LM10] Adam Lith and Jakob Mattsson Investigating storage solutions for large data - acomparison of well performing and scalable data storage solutions for real timeextraction and batch insertion of data Masterrsquos thesis 2010
[LTPS09] Ben Langmead Cole Trapnell Mihai Pop and Steven L Salzberg Ultrafastand memory-efficient alignment of short DNA sequences to the human genomeGenome biology 10(3)R25 January 2009
[ORY10] Alicia Oshlack Mark D Robinson and Matthew D Young From RNA-seq readsto differential expression results Genome biology 11(12)220 January 2010
[SG15] Marc W Schmid and Ueli Grossniklaus Rcount simple and flexible RNA-Seqread counting Bioinformatics 31(3)436ndash437 February 2015
36
REFERENCES
[SK11] Christof Strauch and Walter Kriha NoSQL databases Lecture Notes StuttgartMedia University February 2011
[SOdMVN12] Mikhail Shugay Intildeigo Ortiz de Mendiacutebil Joseacute L Vizmanos and Francisco JNovo Genomic hallmarks of genes involved in chromosomal translocations inhematological cancer PLoS Comput Biol 8(12)e1002797 12 2012
[The04] The ENCODE Project Consortium The ENCODE (ENCyclopedia Of DNA Ele-ments) Project Science (New York NY) 306(5696)636ndash40 October 2004
[TPS09] Cole Trapnell Lior Pachter and Steven L Salzberg TopHat discovering splicejunctions with RNA-Seq Bioinformatics (Oxford England) 25(9)1105ndash11 May2009
[TRG+12a] Cole Trapnell Adam Roberts Loyal Goff Geo Pertea Daehwan Kim David RKelley Harold Pimentel Steven L Salzberg John L Rinn and Lior Pachter Dif-ferential gene and transcript expression analysis of RNA-seq experiments withTopHat and Cufflinks Nature protocols 7(3)562ndash78 March 2012
[TRG+12b] Cole Trapnell Adam Roberts Loyal Goff Geo Pertea Daehwan Kim David RKelley Harold Pimentel Steven L Salzberg John L Rinn and Lior Pachter Dif-ferential gene and transcript expression analysis of RNA-seq experiments withTopHat and Cufflinks Nature protocols 7(3)562ndash78 March 2012
[WMM+11] Ying Wang Gaurang Mehta Rajiv Mayani Jingxi Lu Tade Souaiaia YanghoChen Andrew Clark Hee Jae Yoon Lin Wan Oleg V Evgrafov James AKnowles Ewa Deelman and Ting Chen RseqFlow workflows for RNA-Seq dataanalysis Bioinformatics (Oxford England) 27(18)2598ndash600 September 2011
[Wol13] Jochen B W Wolf Principles of transcriptome analysis and gene expressionquantification an rna-seq tutorial Molecular Ecology Resources 13(4)559ndash5722013
[ZW09] Mark Gerstein |amp Michael Snyder Zhong Wang Rna-seq a revolutionary tool fortranscriptomics Nature Reviews Genetics 1057ndash63 January 2009
37
REFERENCES
38
Appendix A
iRAP tools supported
A1 Mappers
Mapper Option name (mapper)TopHat 1 tophat1TopHat 2 tophat2SMALT smaltGSNAP gsnapSOAPsplice soapspliceBWA bwa1BWA bwa2Bowtie 1 bowtie1Bowtie2 bowtie2GEM gemSTAR starOSA osaMapSplice mapsplice
A2 Quantification
Quantifier Option name (quant_method)FluxCapacitor flux_capHT-Seq (union mode) htseq1HT-Seq (intersection non-empty mode) htseq2Cufflinks 1 (try to find novel transcripts-g) cufflinks1Cufflinks 2 (try to find novel transcripts-g) cufflinks2Cufflinks 1 (do not assemble novel transcripts-G) cufflinks1_ndCufflinks 2 (do not assemble novel transcripts-G) cufflinks2_ndNURD nurd
39
iRAP tools supported
A3 Differential expression [DE]
Method Option name (de_method)DESeq deseqDESeq2 deseq2EdgeR edgerCuffdiff 1 cuffdiff1Cuffdiff 2 cuffdiff2
A4 Gene set enrichment analysis [GSE]
Tool Option name (gse_tool)Piano piano
40
Appendix B
iRAP model of configuration file
1 This is a comment (lines that start with a are ignored by iRAP)
2 =============================================================================
3 name that you want to give to the experiment (no spaces)
4 All files produced by irap will be placed in a folder with the given name
5 name=myexp
6
7
8 =============================================================================
9 name of the species
10 species=homo_sapiens
11
12 =============================================================================
13 Fasta file with the reference genome
14 reference=Homo_sapiensGRCh3766dnafa
15
16 =============================================================================
17 GTF file with the annotations
18 gtf_file=Homo_sapiensGRCh3766gtf
19
20 =============================================================================
21 IRAP options (may be providedoverriden in the command line)
22
23
24 Mapper
25 mapper=
26
27
28 Quantification method
29 quant_method=
30
31
32 Dif expression method
33 Requires contrasts to be defined (see below)
41
iRAP model of configuration file
34 de_method=
35
36
37 Gene set enrichment (GSE) analysis
38 Requires de_method to be defined
39 Tool to use (none|piano)
40 gse_tool=piano
41
42 gse_method (mean|median|sum|fisher|fisher-exact|stouffer|tailStrength|wilcoxon|
reporter|page) see Piano vignete documentation for more details
43 gse_method=fisher
44 gse_pvalue=005
45 Minimum number of genes in a gene set
46 gse_minsize=3
47
48
49
50 TSV file with gene annotation
51 Format IDNamelocussourcelnameGOGOtermKEGG
52 Description
53 ID=gene_id (this is mandatory and should match the one given in the gtf file)
54 Name=gene name
55 locus=chrstart--end
56 source=biotype
57 lname=gene name
58 GO=go ids (multiple values can be separated by)
59 GO=GO terms (multiple values can be separated by)
60 KEGG=Kegg ids (multiple values can be separated by)
61 If auto is defined then iRAP will try to generate the file
62 - this may take a considerable amount of time and will only work
63 for a reduced number of species
64 off - default value
65 annot_tsv=
66
67
68 QC
69 Check data (reads) quality (on|off|none)
70 on - reads are filtered out based on their quality
71 off - the quality of the reads is assessed but no filtering is done
72 none- no quality control is performed
73 qual_filtering=on
74
75 Trim all reads to the minimum read size after quality trimming - Yes (y)| No (n)
76 only applicable if qual_filtering is on
77 trim_reads=y
78
79 Minimum base quality accepted (def 10)
80 min_read_quality=10
81
42
iRAP model of configuration file
82 Contamination check (cont_index parameter) Reads that likely
83 originate from organisms other than the one under study can be
84 discarded during pre-processment of the reads This is done by
85 aligning the reads to the genomes of organisms that might be a
86 source of contamination and discard those that map with a high
87 degree of fidelity By default iRAP will check if the data is
88 contaminated by e-coli An example to create a contamination
89 database is provided in the examplesex_add2contaminationDBsh
90 script The value of the parameter should be the file name prefix of
91 the bowtie index files
92
93 Disable contamination check
94 cont_index=no
95 Default value
96 cont_index=$(data_dir)contaminatione_coli
97
98
99 Misc options
100
101 Number of threads that may be used by IRAP
102 max_threads=1
103
104 Exon level quantification Yes (y)| No (n)
105 exon_quant=y
106
107 Transcript level quantification Yes (y)| No (n)
108 transcript_quant=y
109 =============================================================================
110 full or relative path to the directory where all the data can be found
111 data_dir=data
112
113 the directory should be organized as follows (see directory data in IRAP toplevel
directory)
114
115 $data_dir
116 $data_dir
117 contamination
118 e_coli1ebwt
119 e_coli2ebwt
120 e_coli3ebwt
121 e_coli4ebwt
122 e_coliREADME
123 e_colirev1ebwt
124 e_colirev2eb
125 raw_data
126 $species
127 fastq
128 fastq
129
43
iRAP model of configuration file
130 reference
131 $species
132 $gtf_file
133 $reference
134
135 Notes
136 1) $ denotes the value defined for the variable
137 2) Since version 050 the raw data (fastqbam) files may be
138 distributed across several sub-folders
139
140
141 =============================================================================
142 Only necessary if you intend to perform Differential Expression analysis
143
144 contrasts=contrast_def [contrast_def ]
145 contrasts=purpleVsPink purpleVsGrey
146
147 definition of each constrast
148 contrast= group group [ group ]
149 purlpleVsPink=Purple Pink
150 purlpleVsGrey=Purple Grey
151
152 groups
153 GroupName= Library_name [Library_name ]
154 Purlple=myLib1 myLib2
155 Pink=myLib3
156 Grey=myLib4
157
158 optional parameter used in the report (HTML) generation
159 groups=Purple Pink Grey
160
161 technical replicates
162 technicalreplicates=myLib1myLib2myLib3mylib4
163
164 Note names of groups contrasts and libraries should start with a letter and
contain only alphanumeric characters and the character _
165
166 =============================================================================
167 Data
168
169
170 Information for each library
171 LibName=Fastq file
172 Note
173 1 LibName should start with a letter and contain only alphanumeric characters
and the character _ LibName should not contain in _1 or _2
174 2 LibName should be different from the name of the fastq file for instance
175 f1=f1fastq
176 will produce an error
44
iRAP model of configuration file
177
178 Single-end
179 myLib1=f1fastq
180 read size
181 myLib1_rs=75
182 quality encoding (33 or 64)
183 myLib1_qual=33
184
185 strand specific protocol
186 mylib1_strand=first
187 mylib1_strand=second
188 Default value is both (strands)
189 mylib1_strand=both
190
191 Have the file in a different sub-folder
192 mylib1_dir=somesubfolder
193
194 See SAMBAM specification for more details about the following two parameters
195 read group id (to be included in the BAM file) - this is not supported by all
mappers
196 myLib1_rgid=
197 sambam header lines to include in the BAM file
198 myLib1_shl=COtThis is a commentnCOtand another line
199
200 LibName=Fastq file
201 myLib2=f2fastq
202 read size
203 myLib2_rs=75
204 quality encoding (33 or 64)
205 myLib2_qual=33
206
207
208 Paired-end
209 LibName=Fastq files
210 myLib3=f3_1fastq f3_2fastq
211 read size
212 myLib3_rs=50
213 quality encoding (33 or 64)
214 myLib3_qual=33
215 insert size
216 myLib3_ins=350
217 standard deviation
218 myLib3_sd=60
219
220 LibName=Fastq files
221 myLib4=f4_1fastq f4_2fastq
222 read size
223 myLib4_rs=50
224 quality encoding (33 or 64)
45
iRAP model of configuration file
225 myLib4_qual=33
226 insert size
227 myLib4_ins=350
228 standard deviation
229 myLib4_sd=60
230
231
232
233
234 list the names of your single-end (se) and paired (pe) libraries
235 se=myLib1 myLib2
236 pe=myLib3 myLib4
237 No SE data
238 se=
239 No PE data
240 pe=
241
242
243
244 Passingoverriding parameters
245
246 It is possible to pass parameters to the mappers and quantification
247 methods but that should be done carefully since it may break the
248 pipeline (if the location of the input andor output files is
249 changed)
250
251 Overridingchanging the mappersrsquo parameters
252 _map_options=options
253 Example
254 tophat2_map_options=--min-intron-length 5 --no-coverage-search
255
256 Overridingchanging the parameters of the quantification methods
257 _params=options
258 Example
259 htseq_params= -q
46
Appendix C
iRAP example configuration file
1 minimal configuration file for DE
2 experiment name
3 name=ecoli_ex
4 species
5 species=ecoli_k12
6 reference genome
7 reference=Escherichia_coli_str_k_12_substr_mg1655GCA_000005845119dnatoplevel
fagz
8 gtf file
9 gtf_file=Escherichia_coli_str_k_12_substr_mg1655GCA_000005845119gtfgz
10 Enable filtering based on quality
11 qual_filtering=on
12 Use a contamination data set to filter out reads
13 cont_index=no
14 Toplevel directory with the data
15 data_dir=
16
17 some contrasts
18 GA=Group A
19 contrasts=GAvsGB GBvsGA
20 GAvsGB=GA GB
21 GBvsGA=GB GA
22 GA=FA FB FC
23 GB=FD FE FF
24
25 se=FA FB FC FD FE FF
26
27 FA=SRR933983fastqgz
28 FA_rs=50
29 FA_qual=33
30
31 FB=SRR933984fastqgz
32 FB_rs=50
47
iRAP example configuration file
33 FB_qual=33
34
35 FC=SRR933985fastqgz
36 FC_rs=50
37 FC_qual=33
38
39 FD=SRR933989fastqgz
40 FD_rs=50
41 FD_qual=33
42
43 FE=SRR933990fastqgz
44 FE_rs=50
45 FE_qual=33
46
47 FF=SRR933990fastqgz
48 FF_rs=50
49 FF_qual=33
50 EOF
48
- Front Page
- Table of Contents
- List of Figures
- List of Tables
- 1 Introduction
-
- 11 Context
- 12 Motivation and Goals
- 13 Proposed Solution
- 14 Structure of the Dissertation
-
- 2 Basic Concepts and Bibliographic Review
-
- 21 Biological Basic Concepts
-
- 211 Genome
- 212 Transcriptome Assembly and Gene expression
-
- 22 RNA-Seq Analysis
-
- 221 RNA-Seq microarrays and DNA sequencing
- 222 RNA-Seq Pipeline
-
- 23 Standard File Formats used
-
- 231 FASTA
- 232 FASTQ
- 233 SAM and BAM
- 234 GFF and GTF
-
- 24 Relevant Data Repositories
- 25 Tools for RNA-seq and Differential Analysis
- 26 Relational and Non-relational Databases
- 27 Tecnologies
- 28 Related Work
- 29 Chapter Summary
-
- 3 The Gemini framework
-
- 31 Gemini
- 32 Gemini Architecture
-
- 321 Physical Architecture
-
- 33 Data Management
- 34 Web Interface
- 35 Use cases
- 36 Case studies
-
- 361 Full pipeline
- 362 Stage pipeline
-
- 37 Chapter Summary
-
- 4 Case study
-
- 41 Samples characterization
- 42 Researching objectives
- 43 Protocol of analysis
- 44 Genome version GRCh37 versus GRCh38
- 45 Fusion genes
- 46 Results
-
- 461 Case study with reference genome GRCh37
- 462 Splicing analysis
- 463 Case study with reference genome GRCh38
-
- 47 Chapter Summary
-
- 5 Conclusions and Future Work
- References
- A iRAP tools supported
-
- A1 Mappers
- A2 Quantification
- A3 Differential expression [DE]
- A4 Gene set enrichment analysis [GSE]
-
- B iRAP model of configuration file
- C iRAP example configuration file
-
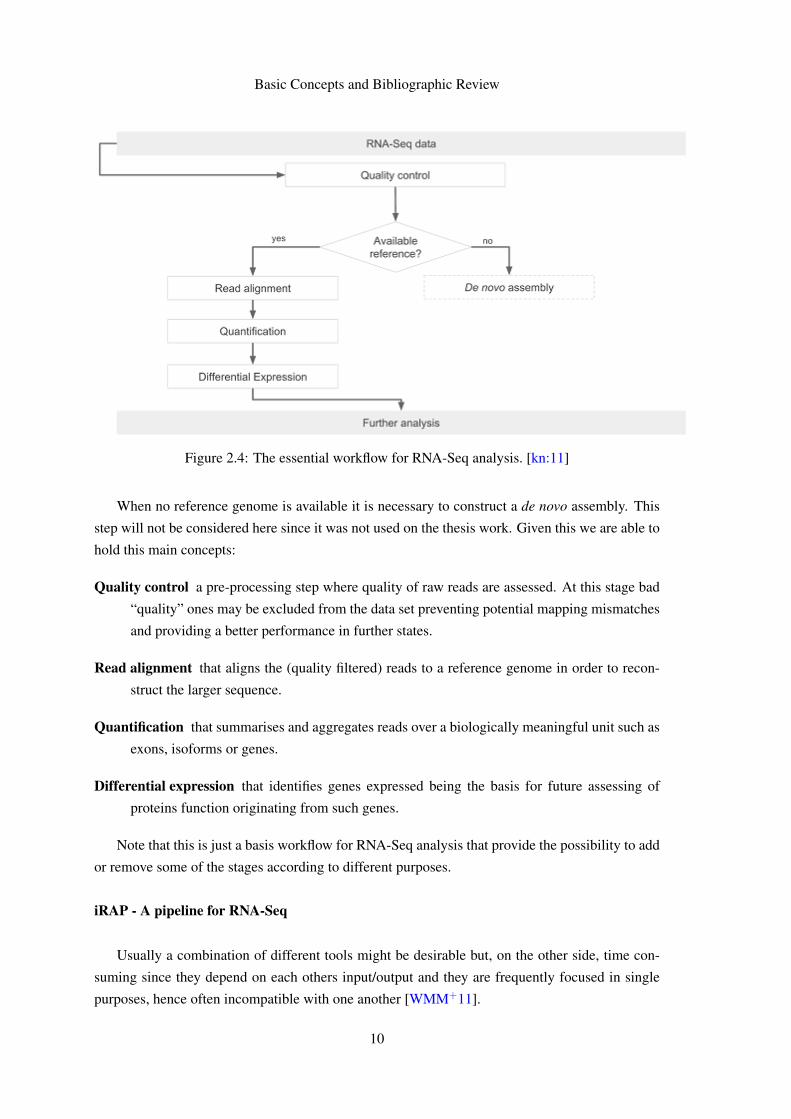
Basic Concepts and Bibliographic Review
expanded into a list of attributes Each attribute consists of a typevalue pair Attributes must end
in a semi-colon and be separated from any following attribute by exactly one space
24 Relevant Data Repositories
It is important to validate results and test along with the implementation of RNA-Seq pipeline As
such real data are needed so that the quality and efficiency of this study is assessed Some repos-
itories are available online such as Gene Expression Omnibus (GEO 12) Genomic Data Sharing
(GDS 13) ENSEMBL 14 UCSC Genome Browser 15 or the ENCODE Project 16 The three last
ones are highlighted in next section
ENSEMBL
The Ensembl project provides information about many vertebrate and other eucaryotic species
being started in 1999 some years before the draft human genome was completed Until today
many genomes have been added over the years as well as the inclusion of comparative genomics
variation and regulatory data [HBB+02]
Between the included working teams of Ensembl the Genebuild is the one who is responsible
to create the gene sets both as developing and mantaining the BioMart 17 data mining tool
It also supplies a REST server 18 as well as an FTP tool for browse and download data [CAB+15]
UCSC Genome Browser
The UCSC Genome Browser is a website that consists of an open-source tool to browse
analyze and query genomic data Currently it grants access to some reference genomes giving the
possibility to retrieve specific data due to the search tool integrated
Along with this tool it is also available an FTP server where data can be accessed and down-
loaded
ENCODE Project
While ENSEMBL has information about many vertebrate and other species ENCODE is a
project to identify all functional elements in the human genome sequence as well as being able
to create comprehensive high quality catalogs of functional elements in the human genome using
highndashthroughput technologies Their mission is to enable the scientific and medical communities
12GEO httpwwwncbinlmnihgovgeo13GDS httpgdsnihgov02dr2html14ENSEMBL httpwwwensemblorgindexhtml15UCSC Genome Browser httpgenomeucscedu16ENCODE project httpswwwencodeprojectorg17BioMart httpbiomartorg18REST server of Ensembl httprestensemblorg
13
Basic Concepts and Bibliographic Review
to interpret the human genome sequence and apply it to understand human biology and improve
health [The04]
Besides their motivation an online repository is being build up indexing gathered data and
allowing users to query different data types regardless of location [Con11] Some samples can
be found at httpswwwencodeprojectorgexperimentsENCSR274JRR for ex-
ample
25 Tools for RNA-seq and Differential Analysis
To perform the RNA-Seq pipeline some tools for each process are required It is now presented
some set of them on the following sections
Bowtie
Bowtie 19 is a tool to align short reads to the human genome To achieve speed and memory-
efficiency Bowtie aligns reads with the aid of an index of the reference genome [Lan10] and can
take advantage of the use of simultaneous multiple processor cores [LTPS09] For the human
genome Burrows-Wheeler is a commonly used indexing process that this tool extends with a
novel quality-aware backtracking algorithm that permits mismatches
TopHat
TopHat 20 is used as a junction mapping tool for RNA-Seq reads Before TopHat current
mapping strategies could only localize reads to known exons in the genome This tool is a read-
mapping algorithm design to align reads to a reference genome without relying on know splice
sites [TPS09]
Cufflinks
Cufflinks 21 assembles transcripts estimates their abundances and tests for differential ex-
pression and regulation in RNA-Seq samples Internally it is made of four different parts Cuf-
flinks that assembles the package Cuffcompare that compares transcript assemblies to annotation
Cuffmerge that merges two or more transcript assemblies and Cuffdiff that takes the aligned reads
and reports genes and transcripts that are differentially expressed [TRG+12a]
HTSeq
19Bowtie httpbowtie-biosourceforgenetindexshtml20TopHat httpccbjhuedusoftwaretophatindexshtml21Cufflinks httpcole-trapnell-labgithubiocufflinks
14
Basic Concepts and Bibliographic Review
HTSeq 22 is a python framework to facilitate the rapid development of scripts to processing
and analysis of high-throughtput sequencing data
FASTQC
FASTQC 23 is a quality control tool for high-throughput sequencing data It receives as input
BAM SAM or FASTQ files provides a quick overview on which areas there may be problems
summarizes graphs and tables for a fast assess of data and exports results to an HTML based report
Samtools
Samtools 24 is a set of utilities to manipulate alignments in the BAM format (output format of
TopHat eg) It does sorting merging and indexing and allows to retrieve in any regions The
files can be either provided via standard input (stdin) of from a remote FTP or HTTP server
deFuse
deFuse 25 is a software for gene fusion discovery from RNA-Seq data It uses clusters of dis-
cordant paired alignments to inform a split read alignment analysis for finding fusion boundaries
As an output it produces a fully annotated output for each predicted fusion
26 Relational and Non-relational Databases
Relational Databases had been introduced in 1970 by Edgar Codd at IBM Almaden Research
Center [Cod70] It has been used for decades and has brought in the concept of relations With
this a relational database is usually represented by a structured model a table in which each row is
a tuple (also considered as an object) and the columns are the attributes of the tuple The database
can be queried in order to retrieve useful data based on their attributes whether in common between
tuples or not To do so it is used a structured query language SQL [LM10] The main set of
operations is known as CRUD Create Read Update and Delete Relational databases are also
know for their fixed schemas that force every tuple to have the exact same attributes
A very common operation in SQL databases are joins Joins are a way to associated data that
share attributes or are somehow related One example is imagining a table of people that have
bank accounts associated and there is another table where the existing banks are described A way
to relate them is to combine these two tables in order to directly view which individual is using
which bank This is a very simple example that can scale very quickly and become a dangerous
operation for the consumed resources to be used to compute the needed relationships
22HTSeq httpwww-huberembldeHTSeqdocoverviewhtml23FASTQC httpwwwbioinformaticsbabrahamacukprojectsfastqc24Samtools httpsamtoolssourceforgenet25deFuse httpsbitbucketorgdranewdefuse
15
Basic Concepts and Bibliographic Review
In contrast with the previous set a Non-relational database commonly doesnrsquot have a fixed
schema and avoid the previous complex operation Within this class of databases there are different
approaches to the used models such as key-value stores big table clones document databases and
graph databases Each of them is used accordingly to the data set complexity
MongoDB 26 is a non-relational database schemaless and is scalable in cluster performance
and data This way it provides a way to store large data sets with the freedom of using different
schemas according to data 27
27 Tecnologies
When developing a web service there are some basic resources and programming languages used
HTML 28 is a standard markup language for describing web documents CSS 29 is used for
defining how the HTML elements are to be displayed Bootstrap 30 is a free front-end frame-
work for faster and easier web development and contains HTML and CSS based design patterns
Javascript 31 serves as a method for programming the behavior of web pages jQuery 32 is a library
of Javascript that greatly specifies Javascriptrsquos usage
Even though commonly used PHP 33 is not the best suitable language for our thesis work
When compared to Python it lacks security and is not used on the Bioinformatics field On the
other hand Perl has been greatly used on this field but it is currently being replaced by Python 34
Furthermore this last one has libraries like BioPython 35 for internal processing of samples and
also has support to web through frameworks like Django 36 or BottlePy 37
Even though Django is trending it has no support for NoSQL relational databases yet Bot-
tlePy for instance is a lightweight web framework simple to use and provides the ability to use
MongoDB
Concerning the situation the combination of Python and BottlePy is the most suitable since it
has
bull Starting to replace Perl in bioinformatics processing
bull Support for NoSQL databases (either the framework and the programming language)
bull Lightweight usage
26MongoDB httpwwwmongodborg27MongoDB scalability httpwwwmongodbcommongodb-scale28HTML httpwwww3schoolscomhtml29CSS httpwwww3schoolscomcssdefaultasp30Bootstrap httpgetbootstrapcom31Javascript httpwwww3schoolscomjs32jQuery httpsjquerycom33PHP httpphpnet34Python httpswwwpythonorg35BioPython httpbiopythonorgwikiMain_Page36Django framework httpswwwdjangoprojectcom37BottlePy httpbottlepyorgdocsdevindexhtml
16
Basic Concepts and Bibliographic Review
Figure 26 Print screen of Galaxy when trying to get data from UCSC
For the purpose of sending the information between devices the FTP server solution was
analysed It allows the creation of an administrator user that has the permissions for writing and
reading but also for anonymous users that can only download data
28 Related Work
Galaxy
Galaxy 38 is an open source web-based platform for data intensive biomedical research
It consists of an embedded website system that provides access to different databases such
as Ensembl or UCSC Genome Browser Although functional the platform has not a consistent
interface which requires the user to learn to use many systems within it An example of this
situation can be viewed in Figure 26 Furthermore it does not provide the ability to choose easily
a stage pipeline like iRAP or to run a full one with personalized tools
BioMart Central Portal
BioMart 39 is a community-driven project to provide unified access to distributed research data
to facilitate the scientific discovery process
38Galaxy httpgalaxyprojectorg39BioMart Central Portal httpcentralbiomartorgsequencegui=Sequence_retrievalamp
mart=metaseq_mart_63_config
17
Basic Concepts and Bibliographic Review
It currently has a sequence retrieval tools that provides searching by database and dataset
Nowadays this tool offers Ensembl as the only available database but it adds up three other fea-
tures like a sequences filters and header information panels where the users can improve their
search
29 Chapter Summary
In this chapter we presented and discussed the technologies suitable for the thesis work We have
surveyed alternative technologies for gene expression computation and alternative splicing tools
The technologies are relevant to solve the Biological domain problem We have also surveyed
the tools for the development of websites and databases to store the data used when solving the
biological problems In the next chapter we describe work in detail
18
Chapter 3
The Gemini framework
Despite the very large number of tools available for Molecular Biology problems they are most
often difficult to use and require sophisticated computational resources As part of the thesis
work we have developed a framework that allows expert users to make RNA-Seq and alternative
splicing analysis using a user friendly web interface and sophisticated computational resources
In this chapter we describe that framework that include the website database resources for storing
data and the computational settings for the analysis
iRAP has been chosen to accomplish the automation of RNA sequencing analysis due to the
simplicity of use and its wide number of tools available for its task Since it is an integrated
tool platform its installation requires not only powerful computer resources but also a long list of
basic equipment necessary to each of them Considering these issues it had not always been easy
to setup the wanted work environment
Despite the difficulties of this scenario we have been able to complete the setup of this tool
and make some control experiments with it
In order to accomplish an iRAP execution a configuration file must be provided (see Ap-
pendix B) Along with the experiment name the name of species being analysed the reference
genome and read data files need to be specified and made available Furthermore the specific
tools for each stage of the pipeline need also to be specified among other possible variables
It is not easy and usually very time consuming for a Biologist to create the configuration file or
to run the command-line interface that controls iRAP pipeline Since this system is a combination
of many different tools there are a long list of available options that may be fulfilled Some of
them are mandatory while other ones are optional After this setting is completed it must be saved
in a text file and made available to run iRAP
Even though the usage of iRAP does not require extensive bioinformatics expertise it does
assume familiarity with UNIX command-line interface which would narrow down the target audi-
ence In order to overcome this situation we designed and developed a framework called Gemini
19
The Gemini framework
that includes a Graphical User Interface and makes RNA-Seq studies much more easy to perform
We have also included extra features for doing more analysis to RNA-Seq data
31 Gemini
Due to the lack of intuitiveness on the process of generating the configuration file it has been
created a more user friendly one through a web form This form asks for input of the main settings
to call a very simple experiment with a commonly used bacteria escherichia ecoli (e coli)
Another important feature is the possibility to fill the form asking what is the stage that the user
wants the pipeline to start with
Another issue was to find and easily download a reference genome for a certain species In
order to add completeness to Gemini and also to simplify the process of download it has been
implemented the functionality to download the reference genome (both fasta and annotation files)
It is used the Ensembl API to obtain the required results The jobs status feature lists the status of
jobs sent by the user for execution
Besides these features one more have been added even though not completed It is the job
results where it is presented the results collected for a determined task
32 Gemini Architecture
321 Physical Architecture
Gemini is divided into two different sets The first one is where the web application is hosted as
well as the database Since dealing with genomic data often requires great computer performance
processing experiments is accomplished in an independent server that later responds with results
Figure 31 Physical architecture of Gemini
Data scheme
MongoDB is NoSQL document based database The information is organized in collections
in which each element is stored as a JSON document NoSQL databases are simpler to use when it
20
The Gemini framework
comes to have different information fields in the same document and at the same time they have
better performance and scalability [SK11] Currently the information is arranjed in two collections
scheme as described on Table 31
Name DescriptionAccounts Stores the users dataJobs Stores the experiments dataTable 31 Collections used to store data
Accounts
An accountrsquos document stores an userrsquos email password and a unique identifier A role has
also been saved for future hierarchy creation in which some levels will grant more permissions
than others like changing accounts settings of other participants
1
2 _id ObjectId(54f5a9b234f76511a82ec3b2)
3 password e10adc3949ba59abbe56e057f20f883e
4 role user
5 email acgggomesgmailcom
6
Jobs
Jobs are related to an user and have the name and description of the experiment It also
stores the reference genomersquos location as well as the readsrsquo one Likewise the date of creation is
preserved When a job is completed the status is modified to finished
1
2 _id ObjectId(5544ecf134f7651d687bba94)
3 name ExpFinal
4 exp_dir data54f5a9b234f76511a82ec3b2ExpFinalreads
5 user 54f5a9b234f76511a82ec3b2
6 description Final test
7 genome_dir genomesEscherichia coli
8 status started
9 date ISODate(2015-05-02T152745249Z)
10
21
The Gemini framework
33 Data Management
In order to create a new job it is required two sets of data namely reference files and raw data
files The raw data is the actual data being analysed while the reference genome serves as basis to
the alignment or control
The typical workflow consists on the expert providing the experience and species names as
well as the raw data that was previously collected in the laboratory Afterwards through a step by
step system the user has the option to choose the reference genome to be used on the experiment
This last files are internally obtained from different FTP servers such as Ensembl and ENCODE
stored locally and reused in further usages
The provided information is then saved in the database and the files stored hierarchically We
use the following sequence of ltsection namegt ltuseridgt ltexperience namegt ltdata filesgt The
ltsection namegt can be conf for storing configuration files data for saving the reads or refer-
ence for keeping the reference genome and annotation files The ltuseridgt is the ID of Accounts
database document and the ltexperience namegt is the same as name in Jobs database document
A directory tree is represented in Figure 32
Figure 32 File system tree demonstrating the hierarchy of saved data files
This information is then passed to the server via a local FTP server that has been created
22
The Gemini framework
for this purpose We have followed an online tutorial 1 for the configuration From this we
created one administrator that has permissions for writing and reading files and we also authorized
anonymous login that may only retrieve files This way on the web application the admin user
creates the reads reference genomes annotation and configuration files On the computational
server an anonymous user authenticates for retrieving the files according to the filenames received
via API
The inside directory of FTP follows the hierarchy of ltuseridgt ltexperience namegt ltdata
filesgt where ltuseridgt is the ID on the Accounts document and ltexperience namegt is the name
on Jobs document When the server is prompted to run an experience it downloads the required
data from the FTP and runs iRAP with the necessary configuration options
34 Web Interface
For the implementation of Gemini python has been used for backend along with a simple fast and
lightweight WSGI micro web-framework called BottlePy 2 It has no dependencies and grants the
main functionalities such as routing templates some class utilities and a built-in server
The first screenshot (Figure 33) shows the home page of Gemini There is top menu bar with
two possible interactions login and register There is also a simple content box that describes the
main features and status of development of the platform Later on a new menu appears with the
possibility to logout on the Welcome tab (as in Figure 34)
Figure 33 Home page
Figure 34 Logout menu
1Tutorial available at httpswwwthomas-krenncomenwikiSetup_FTP_Server_under_Debian
2BottlePy httpbottlepyorgdocsdevindexhtml
23
The Gemini framework
The main feature of the system is the create job (Figure 35) option that is easily accessible on
top menu When the user clicks on it a form is displayed with the variables to introduce on the
configuration file that iRAP needs A description option has been added to provide the freedom to
the researcher to include some extra information that he finds useful
Figure 35 Create job form
The same type of form was used for the reference genomes section (Figure 36) The user is
prompted to choose orderly the species name release number and version Afterwards a table of
elements appears allowing the expert to download the files found
Figure 36 Reference genomes component
24
The Gemini framework
35 Use cases
Gemini was designed to have only one actor the user that will accomplish the experiments This
actor has the possibility to register login and logout of his account create a job and the hability
to download a reference genome of his choice Even though not fully implemented it has been
considered the jobs done functionality
Figure 37 Use cases diagram
36 Case studies
Some case studies with e coli in order to test iRAPrsquos installation and its capabilities For both
of the case studies it has been collected six samples of Escherichia coli reads from European
Nucleotide Archive 3 and the corresponding reference genome and annotation file from Ensembl
361 Full pipeline
In order to call the full pipeline iRAP has been tested with the directive irap conf=ecoli_exconf
Configuration file (ecoli_exconf ) content is as described in Appendix C In this task the system
received the reads and performed the quality control (QC) mapping quantification and differential
expression between the two groups of samples
3ENA httpwwwebiacukena
25
The Gemini framework
This test has been accomplished successfully
362 Stage pipeline
The stage pipeline is a powerful functionality since it allows the user to choose a specific stage of
the pipeline that he wants to execute for his samples
Besides the fact that it is not easy to collect data samples users often want to repeat or analyse
just one step of the pipeline and take some conclusions of it Furthermore this type of pipeline is
less time consuming
A concrete usage example is IPATIMUPrsquos data which contains the output information of the
mapper TopHat and will be further analysed in detail in Chapter 4 Concerning this setup it would
not be possible to call the full pipeline but instead it would require a command specific command
option
For validation purposes the same bacteria from the previous analysis has been used for the
stage pipeline case After calling the setup command to check input the directive irap conf=
ecoli_exconf quality_filtering_and_reporting has been used to perform the stage1
of iRAP The platform was able to perform with success this task
37 Chapter Summary
It has been used Python with BottlePy for the main implementation of the interface of Gemini
MongoDB has been chosen for dealing with information A FTP server was mounted for the
transitions of data between the client and the server The platform allows the expert to call a full or
stage pipeline analysis and provides the download of both fast and annotation files The essential
items are setup for the addition of further functionalities
26
Chapter 4
Case study
In this chapter it is going to be presented the Case Study with data from samples of thyroid carci-
noma along with their charactering and researching results
After the development of an interface to the iRAP tool the following step was to do a case
study with some realistic DNA samples of thyroid cancer patients regarding the partnership with
IPATIMUPrsquos researchers
The purpose of this case study was to do some research of potential differences between dis-
tinct types of the disease In order to accomplish this four samples were collected from Centro
Hospitalar de Satildeo Joatildeo (Porto) Cases 1 and 2 have been categorized as a widely invasive Fol-
licular Thyroid Carcinoma (wFTC) and cases 3 and 4 as a minimally invasive Follicular Thyroid
Carcinoma (mFTC)
41 Samples characterization
Patient from case 1 was female with 82 years old the tumour measuring 2 cm of size and presented
a predominant follicular growth pattern and oncocytic features Patient from case 2 was male with
55 years old the tumour measuring 5 cm of size and presented a predominant solidtrabecular
growth pattern For the group of mFTC patient from case 3 was female 56 years old the tumour
measuring 37 cm of size and with follicular growth pattern patient from case 4 was female 56
years old the tumour measuring 4 cm of size and with follicular growth pattern
42 Researching objectives
The aim of the study was to answer the following questions
bull Differentially expressed genes
bull Total isoforms found either in percentange and in absolute
27
Case study
bull Average of alternative isoforms for each gene spliced
bull Potentially novel isoforms and how do they behave between samplesgroups of samples
bull Compare results between versions of human genome assembly
bull Retrieve fusion genes
43 Protocol of analysis
Collected sample reads have been aligned against reference genome GRCh37 with TopHat version
141 Posterior analysis followed Tuxedo Protocol as described in Trapnell et al [TRG+12b] An
overview of the full protocol can be found in Figure 41
For the implementation of this procedure it were considered as two different groups the cases
1 and 2 (wFTC) against cases 3 and 4 (mFTC) The following step was to assemble transcripts for
each sample with Cufflinks 1 and afterwards create a single merged transcriptome annotation with
Cuffmerge 2 Cuffdiff 3 was then used to find significant changes in transcript expression
In order to find potential isoforms each sample was ran against the reference genome with
Cuffcompare 4
44 Genome version GRCh37 versus GRCh38
Even though IPATIMUPrsquos data have been assembled with reference genome version GRCh37
nowadays a more recent version (GRCh38) has been released in 2013 This new assembly is the
first major revision of the human genome in more than four years 5
The main differences between this two versions are
Alternate sequences several human chromosomal regions have sufficient variability to prevent
adequate representation by a single sequence This new version provides alternate sequence
for selected variant regions through the inclusion of alternate loci 6 scaffolds
Centromere 7 representation Previous method of representing centromeric regions have been
replaced by sequences from centromere models The models provide the approximate repeat
number and order for each centromere and are useful for read mapping and variation studies
Mitochondrial genome The new mitochondrial reference sequence is the Revised Cambridge
Reference Sequence with RefSeq accession number NC_0129201 The previous one was
RefSeq accession number NC_001907 which was not updated when GRCh37 assembly
later transitioned to the new version1Cufflinks httpcole-trapnell-labgithubiocufflinks2Cuffmerge httpcole-trapnell-labgithubiocufflinkscuffmergeindexhtml3Cuffdiff httpcole-trapnell-labgithubiocufflinkscuffdiffindexhtml4Cuffcompare httpcole-trapnell-labgithubiocufflinkscuffcompareindexhtml5As in UCSC mailing list at httpsgroupsgooglecomasoeucsceduforumtopic
genome-announce52Kv41YBXNY6Specific location of a gene on a chromosome
28
Case study
Figure 41 An overview of the Tuxedo Protocol with full steps TopHat for alignment Cufflinkspackage to find differential features between group samples and in the end CummeRbund to plotprevious results
Sequence updates Several erroneous bases and misassembled regions have been corrected and
more than 100 gaps have been filled or reduced
Analysis set The new assembly offers an analysis set that was created to accommodate next
generation sequencing read alignment pipelines Several GRCh38 regions have been elimi-
nated from this set to improve read mapping
29
Case study
45 Fusion genes
After we done some research on the technologies used for finding fusion genes in the reads we
have not been able to perform the analysis to answer the last question of our researching objectives
DeFuse required as input the original reads which were not provided This analysis would have
been interesting for relating the ocurrence of thyroid and the presence of fusion genes as well as if
there was any relevant difference between the samples of wFTC and mFTC
46 Results
461 Case study with reference genome GRCh37
The following table ( 41) demonstrates some genes that were differentially expressed with signif-
icance between mFTC and wFTC According to Celestino et al 8 CRABP1 C1QL1 and LCN2
are biomarkers of thyroid cancer and predictors of extrathyroidal extension It is commonly used
the value of 005 has threshold above which the differential expression is significant By inspect-
ing out the table we can find C1QL1 with a q-value of 0000555 and CRABP1 with a q-value
of 159E-11 which are in concordance with the previous article Furthermore it is verified the
increased gene expression in wFTC when compared to mFTC
Gene ID Gene Chr mFTC wFTC Fold change(log2) Q value
ENSG00000167748 KLK1 19 018672 111924 922742 0ENSG00000104725 NEFL 8 00196645 276961 104599 0ENSG00000174145 KIAA1239 4 00307388 144265 887444 0ENSG00000182379 NXPH4 12 008307 195786 788074 0ENSG00000131094 C1QL1 17 0121453 238957 429828 0000555ENSG00000142677 IL22RAI 1 150905 0384783 -529345 0ENSG00000138615 CILP 15 423569 0052726 -632793 241E-11ENSG00000141431 ASXL3 18 18938 001408 -707148 124E-09ENSG00000166426 CRABP1 15 748375 0367899 -766831 159E-11ENSG00000214145 LINC00887 3 19797 0119327 -737421 0000459
Table 41 Genes differentially expressed between minimally invasive follicular thryoid carcino-mas (mFTCs) and widely invasive follicular thyroid carcinomas (wFTCs)
In response to the previous researching objectives the Table 42 has the statistical results for
taks two and three From the data analysis we could conclude that less than 1 of genes have
isoforms but each one has an average of 389 alternatives
8Ricardo Celestino Torfin Nome Ana Pestana Andreas M Hoff Pedro A Gonccedilalves Catarina Eloy Eva SigstadRagnhild A Lothe Trine Bjoslashro Manuel Sobrinho-Simotildees Rofl I Skotheim Paula Soares CRAPBP1 C1QL1 andLCN2 are biomarkers of thyroid cancer and predictors of extrathyroidal extension subbmited for publication
30
Case study
Total genes 63896Total significant isoforms 689Total unique genes with isoforms 179Ratio of unique genes with isoformsgenes () 028Average of alternatives per gene with isoforms 389
Table 42 Statistical results for researching objectives number 2 and 3
462 Splicing analysis
Forward in the analysis Cuffcompare 9 has been used to search for novel isoforms when com-
pared to the reference genome The method was to compare each sample to the reference genome
and afterwards make an overlap of the results The main objective was then to infer about the
differences among wFTC and mFTC
Sample 1(wFTC)
Sample 2(wFTC)
Sample 3(mFTC)
Sample 4(mFTC)
Total genes 30440 36862 35539 37534Potential novel isoforms 7406 8450 8781 8830Table 43 Potential novel isoforms for each sample of IPATIMUPrsquos data
As demonstrated on Table 43 average there is a percentage of 24 of potentially novel iso-
forms found (at least one spliced junction is shared with a reference transcript) There is been
made an overlap of the results in order to encounter differences between wFTC and mFTC The
Table 44 presents the counting of differences between cases A brief analysis allows us to say
that we can not make any relationship between wFTC and mFTC On average there was a total of
3722 changes among this two sets The average within the sets are 3554 for wFTC and 3992 for
mFTC Given this results there was not a significant divergence to allow us to relate the splicing
and the occurrence of a more invasive Thyroid Carcinoma
Sets ChangesS1 S2 3554S1 S3 3609S1 S4 3612S2 S3 3847S2 S4 3820S3 S4 3929
Table 44 Number of differences between samples Syntax used S1 - Sample 1 S2 - Sample 2S3 - Sample 3 and S4 - Sample 4
9Cuffcompare httpcole-trapnell-labgithubiocufflinkscuffcompareindexhtml
31
Case study
463 Case study with reference genome GRCh38
In order to respond to the last research objective it has been applied the method of analysis has
before with a more recent human genome assembly After using the same protocol with Cufflinks
Cuffmerge and Cuffdiff sequentially we have come to some conclusions
The produced results of differential expression analysis for the same genes were very different
Genes that were highly significant before like C1QL1 and CRABP1 now had no relevance (q-
value gt 005) As mentioned before we had only access to TopHatrsquos output that used version
GRCh37 for the alignment and mapping process so we could not start from scratch the analysis
This outcome demonstrates two topics in particular
1 the introduction of novel annotations can make previous analysis outdated
2 there is the need to save the original reads in order to update earlier studies
The solution to this situation would have been to use the original reads to repeat the assembly
and then follow the Tuxedo protocol to collected correct and updated differential expression data
47 Chapter Summary
These section of development has been introduced in order to confer not only validation but also
to do some researching studies on the subject Four samples were collected and divided into two
distinct groups Tuxedo protocol was followed for responding to the research objectives The
case study for GRCh37 demonstrated the expression of C1QL1 and CRABP1 on wFTC when
compared to mFTC as indicated in the referred article On the other hand the same protocol when
applied with GRCh38 demonstrated the importance of saving the original reads and what is the
influence of newer releases in previous researching results Lastly the splicing analysis results did
not show any evidence of related isoforms count and the manifestation of the different stages of
the disease
32
Chapter 5
Conclusions and Future Work
The research of genomic-based cancers require highly complex data analysis Such analysis re-
quire most often the use of a large number of complex computational resources the gathering
of a lot of information over the Internet and the use of powerful computational resources Fur-
thermore the manipulation of the computational tools and resources require the assistance of an
informatics expert
The thesis work is a contribution towards the solution of the above mention problem We
propose and developed a framework that enables an expert biologist to perform genomic-based
complex analysis in a easy way and using the required powerful computational resources in a
transparent way
Using the developed framework we have used real data to address several research questions
provided by IPATIMUPrsquos researchers Firstly with the human genome GRCh37 we identified
two of the biomarkers of thyroid cancer by differential gene expression analysis Secondly we
found 689 significant isoforms 179 unique out of 63896 genes (ratio of 028) with an average
of 389 isoforms per gene Thirdly when trying to determine potential novel isoforms we came
at no conclusion of the differences of expression when comparing wFTC and mFTC The last
case was applying the Tuxedo protocol with the new GRCh38 on samples The outcome of the
experiment revealed the importance of saving the original reads and that newer releases become
previous analysis outdated
Future Work
This thesis work is just a starting point As stated before the framework was designed so it can be
extended with further modules to enable addressing other research questions
The case studies also showed us that RNA-seq analysis is very time consuming On the other
hand there are a lot of sub-tasks that can be run in parallel (like the task of aligning the reads)
33
Conclusions and Future Work
We will study and compare different techniques and opportunities to make RNA-seq in parallel as
much as possible
34
References
[bNE] Scitable by Nature Education Transcriptome available at httpwwwnaturecomscitabledefinitiontranscriptome-296 last accessJanuary 2015
[CAB+15] Fiona Cunningham M Ridwan Amode Daniel Barrell Kathryn Beal Konstanti-nos Billis Simon Brent Denise Carvalho-Silva Peter Clapham Guy CoatesStephen Fitzgerald Laurent Gil Carlos Garciacutea Giroacuten Leo Gordon ThibautHourlier Sarah E Hunt Sophie H Janacek Nathan Johnson Thomas Juette-mann Andreas K Kaumlhaumlri Stephen Keenan Fergal J Martin Thomas MaurelWilliam McLaren Daniel N Murphy Rishi Nag Bert Overduin Anne ParkerMateus Patricio Emily Perry Miguel Pignatelli Harpreet Singh Riat DanielSheppard Kieron Taylor Anja Thormann Alessandro Vullo Steven P WilderAmonida Zadissa Bronwen L Aken Ewan Birney Jennifer Harrow Rhoda Kin-sella Matthieu Muffato Magali Ruffier Stephen MJ Searle Giulietta SpudichStephen J Trevanion Andy Yates Daniel R Zerbino and Paul Flicek Ensembl2015 Nucleic Acids Research 43(D1)D662ndashD669 2015
[CFG+10] Peter J A Cock Christopher J Fields Naohisa Goto Michael L Heuer and Peter MRice The Sanger FASTQ file format for sequences with quality scores and theSolexaIllumina FASTQ variants Nucleic acids research 38(6)1767ndash71 April2010
[CH07] Geoffrey M Cooper and Robert E Hausman The Cell - A molecular approachAmerican Society for Microbiology 2007
[Cod70] E F Codd A relational model of data for large shared data banks Communica-tions of the ACM 13(6)377ndash387 June 1970
[Con11] The ENCODE Project Consortium A userrsquos guide to the encyclopedia of DNAelements (ENCODE) PLoS biology 9(4)e1001046 April 2011
[FMB14] N A Fonseca J A Marioni and A Brazma RNA-seq gene profiling - a system-atic empirical comparison Technical report May 2014
[FPMB14] Nuno A Fonseca Robert Petryszak John Marioni and Alvis Brazma irap - anintegrated rna-seq analysis pipeline bioRxiv 2014
[GCW+10] Qiang Gan Iouri Chepelev Gang Wei Lama Tarayrah Kairong Cui Keji Zhaoand Xin Chen Dynamic regulation of alternative splicing and chromatin structurein Drosophila gonads revealed by RNA-seq Cell research 20(7)763ndash83 July2010
35
REFERENCES
[GEN] GENIE Dna genes and chromossomes University of Leicesteravailable at httpwww2leacukdepartmentsgeneticsvgecschoolscollegestopicsdna-genes-chromosomes last access Jan-uary 2015
[Gri] Malachi Griffith Bioinformatics for Cancer Genomics (BiCG)available at httpbioinformaticscaworkshops2012bioinformatics-cancer-genomics-bicg last access January 2015
[GTBK11] Angela Goncalves Andrew Tikhonov Alvis Brazma and Misha Kapushesky Apipeline for RNA-seq data processing and quality assessment Bioinformatics (Ox-ford England) 27(6)867ndash9 March 2011
[HBB+02] T Hubbard D Barker E Birney G Cameron Y Chen L Clark T CoxJ Cuff V Curwen T Down R Durbin E Eyras J Gilbert M HammondL Huminiecki A Kasprzyk H Lehvaslaiho P Lijnzaad C Melsopp E Mon-gin R Pettett M Pocock S Potter A Rust E Schmidt S Searle G SlaterJ Smith W Spooner A Stabenau J Stalker E Stupka A Ureta-Vidal I Vastrikand M Clamp The ensembl genome database project Nucleic Acids Research30(1)38ndash41 2002
[HBD+13] R Hitzemann D Bottomly P Darakjian N Walter O Iancu R SearlesB Wilmot and S McWeeney Genes behavior and next-generation RNA se-quencing Genes Brain Behav 12(1)1ndash12 Feb 2013
[Ins] National Human Genome Research Institute Transcriptome available at httpwwwgenomegov13014330 last access January 2015
[Joh03] Jason M Johnson Genome-wide survey of human alternative pre-mrna splicingwith exon junction microarrays Science 3022141ndash2144 December 2003
[kn10] Gene set enrichment a problem of pathways Briefings in functional genomics9(5-6)385ndash90 December 2010
[kn11] Overview of available methods for diverse RNA-Seq data analyses Science ChinaLife sciences 54(12)1121ndash8 December 2011
[Lan10] Ben Langmead Aligning short sequencing reads with Bowtie Current proto-cols in bioinformatics editoral board Andreas D Baxevanis [et al] Chapter11Unit 117 December 2010
[LM10] Adam Lith and Jakob Mattsson Investigating storage solutions for large data - acomparison of well performing and scalable data storage solutions for real timeextraction and batch insertion of data Masterrsquos thesis 2010
[LTPS09] Ben Langmead Cole Trapnell Mihai Pop and Steven L Salzberg Ultrafastand memory-efficient alignment of short DNA sequences to the human genomeGenome biology 10(3)R25 January 2009
[ORY10] Alicia Oshlack Mark D Robinson and Matthew D Young From RNA-seq readsto differential expression results Genome biology 11(12)220 January 2010
[SG15] Marc W Schmid and Ueli Grossniklaus Rcount simple and flexible RNA-Seqread counting Bioinformatics 31(3)436ndash437 February 2015
36
REFERENCES
[SK11] Christof Strauch and Walter Kriha NoSQL databases Lecture Notes StuttgartMedia University February 2011
[SOdMVN12] Mikhail Shugay Intildeigo Ortiz de Mendiacutebil Joseacute L Vizmanos and Francisco JNovo Genomic hallmarks of genes involved in chromosomal translocations inhematological cancer PLoS Comput Biol 8(12)e1002797 12 2012
[The04] The ENCODE Project Consortium The ENCODE (ENCyclopedia Of DNA Ele-ments) Project Science (New York NY) 306(5696)636ndash40 October 2004
[TPS09] Cole Trapnell Lior Pachter and Steven L Salzberg TopHat discovering splicejunctions with RNA-Seq Bioinformatics (Oxford England) 25(9)1105ndash11 May2009
[TRG+12a] Cole Trapnell Adam Roberts Loyal Goff Geo Pertea Daehwan Kim David RKelley Harold Pimentel Steven L Salzberg John L Rinn and Lior Pachter Dif-ferential gene and transcript expression analysis of RNA-seq experiments withTopHat and Cufflinks Nature protocols 7(3)562ndash78 March 2012
[TRG+12b] Cole Trapnell Adam Roberts Loyal Goff Geo Pertea Daehwan Kim David RKelley Harold Pimentel Steven L Salzberg John L Rinn and Lior Pachter Dif-ferential gene and transcript expression analysis of RNA-seq experiments withTopHat and Cufflinks Nature protocols 7(3)562ndash78 March 2012
[WMM+11] Ying Wang Gaurang Mehta Rajiv Mayani Jingxi Lu Tade Souaiaia YanghoChen Andrew Clark Hee Jae Yoon Lin Wan Oleg V Evgrafov James AKnowles Ewa Deelman and Ting Chen RseqFlow workflows for RNA-Seq dataanalysis Bioinformatics (Oxford England) 27(18)2598ndash600 September 2011
[Wol13] Jochen B W Wolf Principles of transcriptome analysis and gene expressionquantification an rna-seq tutorial Molecular Ecology Resources 13(4)559ndash5722013
[ZW09] Mark Gerstein |amp Michael Snyder Zhong Wang Rna-seq a revolutionary tool fortranscriptomics Nature Reviews Genetics 1057ndash63 January 2009
37
REFERENCES
38
Appendix A
iRAP tools supported
A1 Mappers
Mapper Option name (mapper)TopHat 1 tophat1TopHat 2 tophat2SMALT smaltGSNAP gsnapSOAPsplice soapspliceBWA bwa1BWA bwa2Bowtie 1 bowtie1Bowtie2 bowtie2GEM gemSTAR starOSA osaMapSplice mapsplice
A2 Quantification
Quantifier Option name (quant_method)FluxCapacitor flux_capHT-Seq (union mode) htseq1HT-Seq (intersection non-empty mode) htseq2Cufflinks 1 (try to find novel transcripts-g) cufflinks1Cufflinks 2 (try to find novel transcripts-g) cufflinks2Cufflinks 1 (do not assemble novel transcripts-G) cufflinks1_ndCufflinks 2 (do not assemble novel transcripts-G) cufflinks2_ndNURD nurd
39
iRAP tools supported
A3 Differential expression [DE]
Method Option name (de_method)DESeq deseqDESeq2 deseq2EdgeR edgerCuffdiff 1 cuffdiff1Cuffdiff 2 cuffdiff2
A4 Gene set enrichment analysis [GSE]
Tool Option name (gse_tool)Piano piano
40
Appendix B
iRAP model of configuration file
1 This is a comment (lines that start with a are ignored by iRAP)
2 =============================================================================
3 name that you want to give to the experiment (no spaces)
4 All files produced by irap will be placed in a folder with the given name
5 name=myexp
6
7
8 =============================================================================
9 name of the species
10 species=homo_sapiens
11
12 =============================================================================
13 Fasta file with the reference genome
14 reference=Homo_sapiensGRCh3766dnafa
15
16 =============================================================================
17 GTF file with the annotations
18 gtf_file=Homo_sapiensGRCh3766gtf
19
20 =============================================================================
21 IRAP options (may be providedoverriden in the command line)
22
23
24 Mapper
25 mapper=
26
27
28 Quantification method
29 quant_method=
30
31
32 Dif expression method
33 Requires contrasts to be defined (see below)
41
iRAP model of configuration file
34 de_method=
35
36
37 Gene set enrichment (GSE) analysis
38 Requires de_method to be defined
39 Tool to use (none|piano)
40 gse_tool=piano
41
42 gse_method (mean|median|sum|fisher|fisher-exact|stouffer|tailStrength|wilcoxon|
reporter|page) see Piano vignete documentation for more details
43 gse_method=fisher
44 gse_pvalue=005
45 Minimum number of genes in a gene set
46 gse_minsize=3
47
48
49
50 TSV file with gene annotation
51 Format IDNamelocussourcelnameGOGOtermKEGG
52 Description
53 ID=gene_id (this is mandatory and should match the one given in the gtf file)
54 Name=gene name
55 locus=chrstart--end
56 source=biotype
57 lname=gene name
58 GO=go ids (multiple values can be separated by)
59 GO=GO terms (multiple values can be separated by)
60 KEGG=Kegg ids (multiple values can be separated by)
61 If auto is defined then iRAP will try to generate the file
62 - this may take a considerable amount of time and will only work
63 for a reduced number of species
64 off - default value
65 annot_tsv=
66
67
68 QC
69 Check data (reads) quality (on|off|none)
70 on - reads are filtered out based on their quality
71 off - the quality of the reads is assessed but no filtering is done
72 none- no quality control is performed
73 qual_filtering=on
74
75 Trim all reads to the minimum read size after quality trimming - Yes (y)| No (n)
76 only applicable if qual_filtering is on
77 trim_reads=y
78
79 Minimum base quality accepted (def 10)
80 min_read_quality=10
81
42
iRAP model of configuration file
82 Contamination check (cont_index parameter) Reads that likely
83 originate from organisms other than the one under study can be
84 discarded during pre-processment of the reads This is done by
85 aligning the reads to the genomes of organisms that might be a
86 source of contamination and discard those that map with a high
87 degree of fidelity By default iRAP will check if the data is
88 contaminated by e-coli An example to create a contamination
89 database is provided in the examplesex_add2contaminationDBsh
90 script The value of the parameter should be the file name prefix of
91 the bowtie index files
92
93 Disable contamination check
94 cont_index=no
95 Default value
96 cont_index=$(data_dir)contaminatione_coli
97
98
99 Misc options
100
101 Number of threads that may be used by IRAP
102 max_threads=1
103
104 Exon level quantification Yes (y)| No (n)
105 exon_quant=y
106
107 Transcript level quantification Yes (y)| No (n)
108 transcript_quant=y
109 =============================================================================
110 full or relative path to the directory where all the data can be found
111 data_dir=data
112
113 the directory should be organized as follows (see directory data in IRAP toplevel
directory)
114
115 $data_dir
116 $data_dir
117 contamination
118 e_coli1ebwt
119 e_coli2ebwt
120 e_coli3ebwt
121 e_coli4ebwt
122 e_coliREADME
123 e_colirev1ebwt
124 e_colirev2eb
125 raw_data
126 $species
127 fastq
128 fastq
129
43
iRAP model of configuration file
130 reference
131 $species
132 $gtf_file
133 $reference
134
135 Notes
136 1) $ denotes the value defined for the variable
137 2) Since version 050 the raw data (fastqbam) files may be
138 distributed across several sub-folders
139
140
141 =============================================================================
142 Only necessary if you intend to perform Differential Expression analysis
143
144 contrasts=contrast_def [contrast_def ]
145 contrasts=purpleVsPink purpleVsGrey
146
147 definition of each constrast
148 contrast= group group [ group ]
149 purlpleVsPink=Purple Pink
150 purlpleVsGrey=Purple Grey
151
152 groups
153 GroupName= Library_name [Library_name ]
154 Purlple=myLib1 myLib2
155 Pink=myLib3
156 Grey=myLib4
157
158 optional parameter used in the report (HTML) generation
159 groups=Purple Pink Grey
160
161 technical replicates
162 technicalreplicates=myLib1myLib2myLib3mylib4
163
164 Note names of groups contrasts and libraries should start with a letter and
contain only alphanumeric characters and the character _
165
166 =============================================================================
167 Data
168
169
170 Information for each library
171 LibName=Fastq file
172 Note
173 1 LibName should start with a letter and contain only alphanumeric characters
and the character _ LibName should not contain in _1 or _2
174 2 LibName should be different from the name of the fastq file for instance
175 f1=f1fastq
176 will produce an error
44
iRAP model of configuration file
177
178 Single-end
179 myLib1=f1fastq
180 read size
181 myLib1_rs=75
182 quality encoding (33 or 64)
183 myLib1_qual=33
184
185 strand specific protocol
186 mylib1_strand=first
187 mylib1_strand=second
188 Default value is both (strands)
189 mylib1_strand=both
190
191 Have the file in a different sub-folder
192 mylib1_dir=somesubfolder
193
194 See SAMBAM specification for more details about the following two parameters
195 read group id (to be included in the BAM file) - this is not supported by all
mappers
196 myLib1_rgid=
197 sambam header lines to include in the BAM file
198 myLib1_shl=COtThis is a commentnCOtand another line
199
200 LibName=Fastq file
201 myLib2=f2fastq
202 read size
203 myLib2_rs=75
204 quality encoding (33 or 64)
205 myLib2_qual=33
206
207
208 Paired-end
209 LibName=Fastq files
210 myLib3=f3_1fastq f3_2fastq
211 read size
212 myLib3_rs=50
213 quality encoding (33 or 64)
214 myLib3_qual=33
215 insert size
216 myLib3_ins=350
217 standard deviation
218 myLib3_sd=60
219
220 LibName=Fastq files
221 myLib4=f4_1fastq f4_2fastq
222 read size
223 myLib4_rs=50
224 quality encoding (33 or 64)
45
iRAP model of configuration file
225 myLib4_qual=33
226 insert size
227 myLib4_ins=350
228 standard deviation
229 myLib4_sd=60
230
231
232
233
234 list the names of your single-end (se) and paired (pe) libraries
235 se=myLib1 myLib2
236 pe=myLib3 myLib4
237 No SE data
238 se=
239 No PE data
240 pe=
241
242
243
244 Passingoverriding parameters
245
246 It is possible to pass parameters to the mappers and quantification
247 methods but that should be done carefully since it may break the
248 pipeline (if the location of the input andor output files is
249 changed)
250
251 Overridingchanging the mappersrsquo parameters
252 _map_options=options
253 Example
254 tophat2_map_options=--min-intron-length 5 --no-coverage-search
255
256 Overridingchanging the parameters of the quantification methods
257 _params=options
258 Example
259 htseq_params= -q
46
Appendix C
iRAP example configuration file
1 minimal configuration file for DE
2 experiment name
3 name=ecoli_ex
4 species
5 species=ecoli_k12
6 reference genome
7 reference=Escherichia_coli_str_k_12_substr_mg1655GCA_000005845119dnatoplevel
fagz
8 gtf file
9 gtf_file=Escherichia_coli_str_k_12_substr_mg1655GCA_000005845119gtfgz
10 Enable filtering based on quality
11 qual_filtering=on
12 Use a contamination data set to filter out reads
13 cont_index=no
14 Toplevel directory with the data
15 data_dir=
16
17 some contrasts
18 GA=Group A
19 contrasts=GAvsGB GBvsGA
20 GAvsGB=GA GB
21 GBvsGA=GB GA
22 GA=FA FB FC
23 GB=FD FE FF
24
25 se=FA FB FC FD FE FF
26
27 FA=SRR933983fastqgz
28 FA_rs=50
29 FA_qual=33
30
31 FB=SRR933984fastqgz
32 FB_rs=50
47
iRAP example configuration file
33 FB_qual=33
34
35 FC=SRR933985fastqgz
36 FC_rs=50
37 FC_qual=33
38
39 FD=SRR933989fastqgz
40 FD_rs=50
41 FD_qual=33
42
43 FE=SRR933990fastqgz
44 FE_rs=50
45 FE_qual=33
46
47 FF=SRR933990fastqgz
48 FF_rs=50
49 FF_qual=33
50 EOF
48
- Front Page
- Table of Contents
- List of Figures
- List of Tables
- 1 Introduction
-
- 11 Context
- 12 Motivation and Goals
- 13 Proposed Solution
- 14 Structure of the Dissertation
-
- 2 Basic Concepts and Bibliographic Review
-
- 21 Biological Basic Concepts
-
- 211 Genome
- 212 Transcriptome Assembly and Gene expression
-
- 22 RNA-Seq Analysis
-
- 221 RNA-Seq microarrays and DNA sequencing
- 222 RNA-Seq Pipeline
-
- 23 Standard File Formats used
-
- 231 FASTA
- 232 FASTQ
- 233 SAM and BAM
- 234 GFF and GTF
-
- 24 Relevant Data Repositories
- 25 Tools for RNA-seq and Differential Analysis
- 26 Relational and Non-relational Databases
- 27 Tecnologies
- 28 Related Work
- 29 Chapter Summary
-
- 3 The Gemini framework
-
- 31 Gemini
- 32 Gemini Architecture
-
- 321 Physical Architecture
-
- 33 Data Management
- 34 Web Interface
- 35 Use cases
- 36 Case studies
-
- 361 Full pipeline
- 362 Stage pipeline
-
- 37 Chapter Summary
-
- 4 Case study
-
- 41 Samples characterization
- 42 Researching objectives
- 43 Protocol of analysis
- 44 Genome version GRCh37 versus GRCh38
- 45 Fusion genes
- 46 Results
-
- 461 Case study with reference genome GRCh37
- 462 Splicing analysis
- 463 Case study with reference genome GRCh38
-
- 47 Chapter Summary
-
- 5 Conclusions and Future Work
- References
- A iRAP tools supported
-
- A1 Mappers
- A2 Quantification
- A3 Differential expression [DE]
- A4 Gene set enrichment analysis [GSE]
-
- B iRAP model of configuration file
- C iRAP example configuration file
-
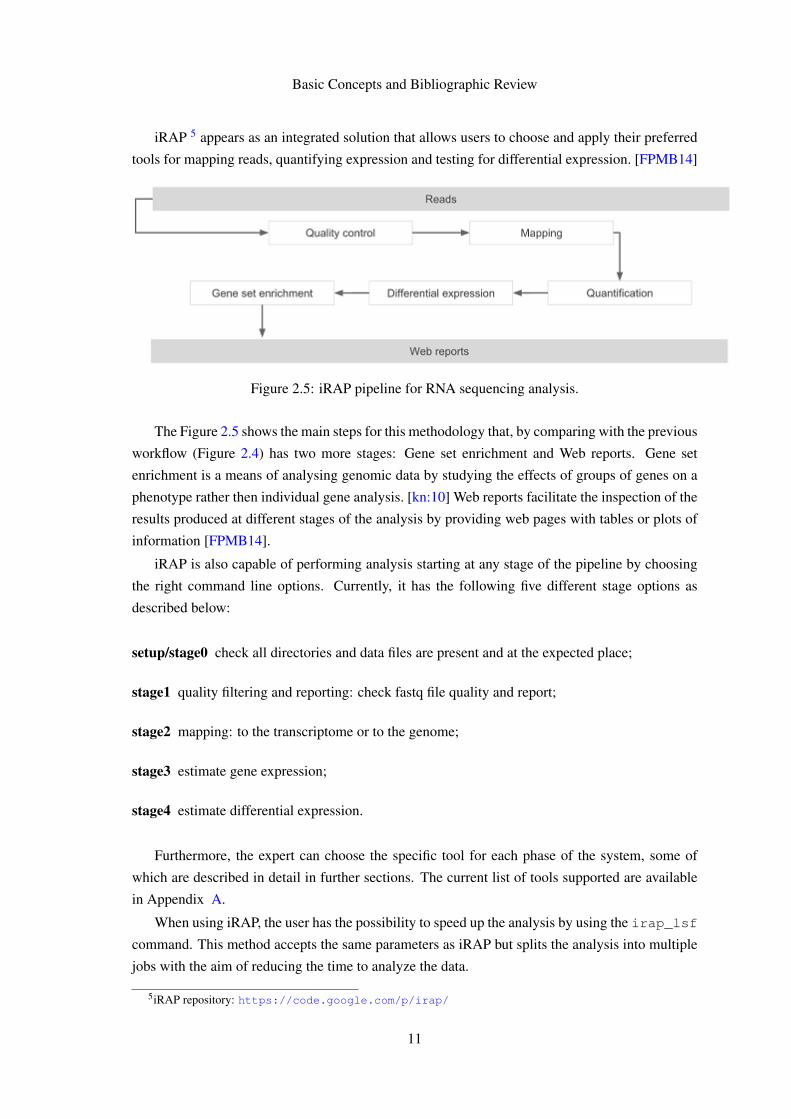
Basic Concepts and Bibliographic Review
to interpret the human genome sequence and apply it to understand human biology and improve
health [The04]
Besides their motivation an online repository is being build up indexing gathered data and
allowing users to query different data types regardless of location [Con11] Some samples can
be found at httpswwwencodeprojectorgexperimentsENCSR274JRR for ex-
ample
25 Tools for RNA-seq and Differential Analysis
To perform the RNA-Seq pipeline some tools for each process are required It is now presented
some set of them on the following sections
Bowtie
Bowtie 19 is a tool to align short reads to the human genome To achieve speed and memory-
efficiency Bowtie aligns reads with the aid of an index of the reference genome [Lan10] and can
take advantage of the use of simultaneous multiple processor cores [LTPS09] For the human
genome Burrows-Wheeler is a commonly used indexing process that this tool extends with a
novel quality-aware backtracking algorithm that permits mismatches
TopHat
TopHat 20 is used as a junction mapping tool for RNA-Seq reads Before TopHat current
mapping strategies could only localize reads to known exons in the genome This tool is a read-
mapping algorithm design to align reads to a reference genome without relying on know splice
sites [TPS09]
Cufflinks
Cufflinks 21 assembles transcripts estimates their abundances and tests for differential ex-
pression and regulation in RNA-Seq samples Internally it is made of four different parts Cuf-
flinks that assembles the package Cuffcompare that compares transcript assemblies to annotation
Cuffmerge that merges two or more transcript assemblies and Cuffdiff that takes the aligned reads
and reports genes and transcripts that are differentially expressed [TRG+12a]
HTSeq
19Bowtie httpbowtie-biosourceforgenetindexshtml20TopHat httpccbjhuedusoftwaretophatindexshtml21Cufflinks httpcole-trapnell-labgithubiocufflinks
14
Basic Concepts and Bibliographic Review
HTSeq 22 is a python framework to facilitate the rapid development of scripts to processing
and analysis of high-throughtput sequencing data
FASTQC
FASTQC 23 is a quality control tool for high-throughput sequencing data It receives as input
BAM SAM or FASTQ files provides a quick overview on which areas there may be problems
summarizes graphs and tables for a fast assess of data and exports results to an HTML based report
Samtools
Samtools 24 is a set of utilities to manipulate alignments in the BAM format (output format of
TopHat eg) It does sorting merging and indexing and allows to retrieve in any regions The
files can be either provided via standard input (stdin) of from a remote FTP or HTTP server
deFuse
deFuse 25 is a software for gene fusion discovery from RNA-Seq data It uses clusters of dis-
cordant paired alignments to inform a split read alignment analysis for finding fusion boundaries
As an output it produces a fully annotated output for each predicted fusion
26 Relational and Non-relational Databases
Relational Databases had been introduced in 1970 by Edgar Codd at IBM Almaden Research
Center [Cod70] It has been used for decades and has brought in the concept of relations With
this a relational database is usually represented by a structured model a table in which each row is
a tuple (also considered as an object) and the columns are the attributes of the tuple The database
can be queried in order to retrieve useful data based on their attributes whether in common between
tuples or not To do so it is used a structured query language SQL [LM10] The main set of
operations is known as CRUD Create Read Update and Delete Relational databases are also
know for their fixed schemas that force every tuple to have the exact same attributes
A very common operation in SQL databases are joins Joins are a way to associated data that
share attributes or are somehow related One example is imagining a table of people that have
bank accounts associated and there is another table where the existing banks are described A way
to relate them is to combine these two tables in order to directly view which individual is using
which bank This is a very simple example that can scale very quickly and become a dangerous
operation for the consumed resources to be used to compute the needed relationships
22HTSeq httpwww-huberembldeHTSeqdocoverviewhtml23FASTQC httpwwwbioinformaticsbabrahamacukprojectsfastqc24Samtools httpsamtoolssourceforgenet25deFuse httpsbitbucketorgdranewdefuse
15
Basic Concepts and Bibliographic Review
In contrast with the previous set a Non-relational database commonly doesnrsquot have a fixed
schema and avoid the previous complex operation Within this class of databases there are different
approaches to the used models such as key-value stores big table clones document databases and
graph databases Each of them is used accordingly to the data set complexity
MongoDB 26 is a non-relational database schemaless and is scalable in cluster performance
and data This way it provides a way to store large data sets with the freedom of using different
schemas according to data 27
27 Tecnologies
When developing a web service there are some basic resources and programming languages used
HTML 28 is a standard markup language for describing web documents CSS 29 is used for
defining how the HTML elements are to be displayed Bootstrap 30 is a free front-end frame-
work for faster and easier web development and contains HTML and CSS based design patterns
Javascript 31 serves as a method for programming the behavior of web pages jQuery 32 is a library
of Javascript that greatly specifies Javascriptrsquos usage
Even though commonly used PHP 33 is not the best suitable language for our thesis work
When compared to Python it lacks security and is not used on the Bioinformatics field On the
other hand Perl has been greatly used on this field but it is currently being replaced by Python 34
Furthermore this last one has libraries like BioPython 35 for internal processing of samples and
also has support to web through frameworks like Django 36 or BottlePy 37
Even though Django is trending it has no support for NoSQL relational databases yet Bot-
tlePy for instance is a lightweight web framework simple to use and provides the ability to use
MongoDB
Concerning the situation the combination of Python and BottlePy is the most suitable since it
has
bull Starting to replace Perl in bioinformatics processing
bull Support for NoSQL databases (either the framework and the programming language)
bull Lightweight usage
26MongoDB httpwwwmongodborg27MongoDB scalability httpwwwmongodbcommongodb-scale28HTML httpwwww3schoolscomhtml29CSS httpwwww3schoolscomcssdefaultasp30Bootstrap httpgetbootstrapcom31Javascript httpwwww3schoolscomjs32jQuery httpsjquerycom33PHP httpphpnet34Python httpswwwpythonorg35BioPython httpbiopythonorgwikiMain_Page36Django framework httpswwwdjangoprojectcom37BottlePy httpbottlepyorgdocsdevindexhtml
16
Basic Concepts and Bibliographic Review
Figure 26 Print screen of Galaxy when trying to get data from UCSC
For the purpose of sending the information between devices the FTP server solution was
analysed It allows the creation of an administrator user that has the permissions for writing and
reading but also for anonymous users that can only download data
28 Related Work
Galaxy
Galaxy 38 is an open source web-based platform for data intensive biomedical research
It consists of an embedded website system that provides access to different databases such
as Ensembl or UCSC Genome Browser Although functional the platform has not a consistent
interface which requires the user to learn to use many systems within it An example of this
situation can be viewed in Figure 26 Furthermore it does not provide the ability to choose easily
a stage pipeline like iRAP or to run a full one with personalized tools
BioMart Central Portal
BioMart 39 is a community-driven project to provide unified access to distributed research data
to facilitate the scientific discovery process
38Galaxy httpgalaxyprojectorg39BioMart Central Portal httpcentralbiomartorgsequencegui=Sequence_retrievalamp
mart=metaseq_mart_63_config
17
Basic Concepts and Bibliographic Review
It currently has a sequence retrieval tools that provides searching by database and dataset
Nowadays this tool offers Ensembl as the only available database but it adds up three other fea-
tures like a sequences filters and header information panels where the users can improve their
search
29 Chapter Summary
In this chapter we presented and discussed the technologies suitable for the thesis work We have
surveyed alternative technologies for gene expression computation and alternative splicing tools
The technologies are relevant to solve the Biological domain problem We have also surveyed
the tools for the development of websites and databases to store the data used when solving the
biological problems In the next chapter we describe work in detail
18
Chapter 3
The Gemini framework
Despite the very large number of tools available for Molecular Biology problems they are most
often difficult to use and require sophisticated computational resources As part of the thesis
work we have developed a framework that allows expert users to make RNA-Seq and alternative
splicing analysis using a user friendly web interface and sophisticated computational resources
In this chapter we describe that framework that include the website database resources for storing
data and the computational settings for the analysis
iRAP has been chosen to accomplish the automation of RNA sequencing analysis due to the
simplicity of use and its wide number of tools available for its task Since it is an integrated
tool platform its installation requires not only powerful computer resources but also a long list of
basic equipment necessary to each of them Considering these issues it had not always been easy
to setup the wanted work environment
Despite the difficulties of this scenario we have been able to complete the setup of this tool
and make some control experiments with it
In order to accomplish an iRAP execution a configuration file must be provided (see Ap-
pendix B) Along with the experiment name the name of species being analysed the reference
genome and read data files need to be specified and made available Furthermore the specific
tools for each stage of the pipeline need also to be specified among other possible variables
It is not easy and usually very time consuming for a Biologist to create the configuration file or
to run the command-line interface that controls iRAP pipeline Since this system is a combination
of many different tools there are a long list of available options that may be fulfilled Some of
them are mandatory while other ones are optional After this setting is completed it must be saved
in a text file and made available to run iRAP
Even though the usage of iRAP does not require extensive bioinformatics expertise it does
assume familiarity with UNIX command-line interface which would narrow down the target audi-
ence In order to overcome this situation we designed and developed a framework called Gemini
19
The Gemini framework
that includes a Graphical User Interface and makes RNA-Seq studies much more easy to perform
We have also included extra features for doing more analysis to RNA-Seq data
31 Gemini
Due to the lack of intuitiveness on the process of generating the configuration file it has been
created a more user friendly one through a web form This form asks for input of the main settings
to call a very simple experiment with a commonly used bacteria escherichia ecoli (e coli)
Another important feature is the possibility to fill the form asking what is the stage that the user
wants the pipeline to start with
Another issue was to find and easily download a reference genome for a certain species In
order to add completeness to Gemini and also to simplify the process of download it has been
implemented the functionality to download the reference genome (both fasta and annotation files)
It is used the Ensembl API to obtain the required results The jobs status feature lists the status of
jobs sent by the user for execution
Besides these features one more have been added even though not completed It is the job
results where it is presented the results collected for a determined task
32 Gemini Architecture
321 Physical Architecture
Gemini is divided into two different sets The first one is where the web application is hosted as
well as the database Since dealing with genomic data often requires great computer performance
processing experiments is accomplished in an independent server that later responds with results
Figure 31 Physical architecture of Gemini
Data scheme
MongoDB is NoSQL document based database The information is organized in collections
in which each element is stored as a JSON document NoSQL databases are simpler to use when it
20
The Gemini framework
comes to have different information fields in the same document and at the same time they have
better performance and scalability [SK11] Currently the information is arranjed in two collections
scheme as described on Table 31
Name DescriptionAccounts Stores the users dataJobs Stores the experiments dataTable 31 Collections used to store data
Accounts
An accountrsquos document stores an userrsquos email password and a unique identifier A role has
also been saved for future hierarchy creation in which some levels will grant more permissions
than others like changing accounts settings of other participants
1
2 _id ObjectId(54f5a9b234f76511a82ec3b2)
3 password e10adc3949ba59abbe56e057f20f883e
4 role user
5 email acgggomesgmailcom
6
Jobs
Jobs are related to an user and have the name and description of the experiment It also
stores the reference genomersquos location as well as the readsrsquo one Likewise the date of creation is
preserved When a job is completed the status is modified to finished
1
2 _id ObjectId(5544ecf134f7651d687bba94)
3 name ExpFinal
4 exp_dir data54f5a9b234f76511a82ec3b2ExpFinalreads
5 user 54f5a9b234f76511a82ec3b2
6 description Final test
7 genome_dir genomesEscherichia coli
8 status started
9 date ISODate(2015-05-02T152745249Z)
10
21
The Gemini framework
33 Data Management
In order to create a new job it is required two sets of data namely reference files and raw data
files The raw data is the actual data being analysed while the reference genome serves as basis to
the alignment or control
The typical workflow consists on the expert providing the experience and species names as
well as the raw data that was previously collected in the laboratory Afterwards through a step by
step system the user has the option to choose the reference genome to be used on the experiment
This last files are internally obtained from different FTP servers such as Ensembl and ENCODE
stored locally and reused in further usages
The provided information is then saved in the database and the files stored hierarchically We
use the following sequence of ltsection namegt ltuseridgt ltexperience namegt ltdata filesgt The
ltsection namegt can be conf for storing configuration files data for saving the reads or refer-
ence for keeping the reference genome and annotation files The ltuseridgt is the ID of Accounts
database document and the ltexperience namegt is the same as name in Jobs database document
A directory tree is represented in Figure 32
Figure 32 File system tree demonstrating the hierarchy of saved data files
This information is then passed to the server via a local FTP server that has been created
22
The Gemini framework
for this purpose We have followed an online tutorial 1 for the configuration From this we
created one administrator that has permissions for writing and reading files and we also authorized
anonymous login that may only retrieve files This way on the web application the admin user
creates the reads reference genomes annotation and configuration files On the computational
server an anonymous user authenticates for retrieving the files according to the filenames received
via API
The inside directory of FTP follows the hierarchy of ltuseridgt ltexperience namegt ltdata
filesgt where ltuseridgt is the ID on the Accounts document and ltexperience namegt is the name
on Jobs document When the server is prompted to run an experience it downloads the required
data from the FTP and runs iRAP with the necessary configuration options
34 Web Interface
For the implementation of Gemini python has been used for backend along with a simple fast and
lightweight WSGI micro web-framework called BottlePy 2 It has no dependencies and grants the
main functionalities such as routing templates some class utilities and a built-in server
The first screenshot (Figure 33) shows the home page of Gemini There is top menu bar with
two possible interactions login and register There is also a simple content box that describes the
main features and status of development of the platform Later on a new menu appears with the
possibility to logout on the Welcome tab (as in Figure 34)
Figure 33 Home page
Figure 34 Logout menu
1Tutorial available at httpswwwthomas-krenncomenwikiSetup_FTP_Server_under_Debian
2BottlePy httpbottlepyorgdocsdevindexhtml
23
The Gemini framework
The main feature of the system is the create job (Figure 35) option that is easily accessible on
top menu When the user clicks on it a form is displayed with the variables to introduce on the
configuration file that iRAP needs A description option has been added to provide the freedom to
the researcher to include some extra information that he finds useful
Figure 35 Create job form
The same type of form was used for the reference genomes section (Figure 36) The user is
prompted to choose orderly the species name release number and version Afterwards a table of
elements appears allowing the expert to download the files found
Figure 36 Reference genomes component
24
The Gemini framework
35 Use cases
Gemini was designed to have only one actor the user that will accomplish the experiments This
actor has the possibility to register login and logout of his account create a job and the hability
to download a reference genome of his choice Even though not fully implemented it has been
considered the jobs done functionality
Figure 37 Use cases diagram
36 Case studies
Some case studies with e coli in order to test iRAPrsquos installation and its capabilities For both
of the case studies it has been collected six samples of Escherichia coli reads from European
Nucleotide Archive 3 and the corresponding reference genome and annotation file from Ensembl
361 Full pipeline
In order to call the full pipeline iRAP has been tested with the directive irap conf=ecoli_exconf
Configuration file (ecoli_exconf ) content is as described in Appendix C In this task the system
received the reads and performed the quality control (QC) mapping quantification and differential
expression between the two groups of samples
3ENA httpwwwebiacukena
25
The Gemini framework
This test has been accomplished successfully
362 Stage pipeline
The stage pipeline is a powerful functionality since it allows the user to choose a specific stage of
the pipeline that he wants to execute for his samples
Besides the fact that it is not easy to collect data samples users often want to repeat or analyse
just one step of the pipeline and take some conclusions of it Furthermore this type of pipeline is
less time consuming
A concrete usage example is IPATIMUPrsquos data which contains the output information of the
mapper TopHat and will be further analysed in detail in Chapter 4 Concerning this setup it would
not be possible to call the full pipeline but instead it would require a command specific command
option
For validation purposes the same bacteria from the previous analysis has been used for the
stage pipeline case After calling the setup command to check input the directive irap conf=
ecoli_exconf quality_filtering_and_reporting has been used to perform the stage1
of iRAP The platform was able to perform with success this task
37 Chapter Summary
It has been used Python with BottlePy for the main implementation of the interface of Gemini
MongoDB has been chosen for dealing with information A FTP server was mounted for the
transitions of data between the client and the server The platform allows the expert to call a full or
stage pipeline analysis and provides the download of both fast and annotation files The essential
items are setup for the addition of further functionalities
26
Chapter 4
Case study
In this chapter it is going to be presented the Case Study with data from samples of thyroid carci-
noma along with their charactering and researching results
After the development of an interface to the iRAP tool the following step was to do a case
study with some realistic DNA samples of thyroid cancer patients regarding the partnership with
IPATIMUPrsquos researchers
The purpose of this case study was to do some research of potential differences between dis-
tinct types of the disease In order to accomplish this four samples were collected from Centro
Hospitalar de Satildeo Joatildeo (Porto) Cases 1 and 2 have been categorized as a widely invasive Fol-
licular Thyroid Carcinoma (wFTC) and cases 3 and 4 as a minimally invasive Follicular Thyroid
Carcinoma (mFTC)
41 Samples characterization
Patient from case 1 was female with 82 years old the tumour measuring 2 cm of size and presented
a predominant follicular growth pattern and oncocytic features Patient from case 2 was male with
55 years old the tumour measuring 5 cm of size and presented a predominant solidtrabecular
growth pattern For the group of mFTC patient from case 3 was female 56 years old the tumour
measuring 37 cm of size and with follicular growth pattern patient from case 4 was female 56
years old the tumour measuring 4 cm of size and with follicular growth pattern
42 Researching objectives
The aim of the study was to answer the following questions
bull Differentially expressed genes
bull Total isoforms found either in percentange and in absolute
27
Case study
bull Average of alternative isoforms for each gene spliced
bull Potentially novel isoforms and how do they behave between samplesgroups of samples
bull Compare results between versions of human genome assembly
bull Retrieve fusion genes
43 Protocol of analysis
Collected sample reads have been aligned against reference genome GRCh37 with TopHat version
141 Posterior analysis followed Tuxedo Protocol as described in Trapnell et al [TRG+12b] An
overview of the full protocol can be found in Figure 41
For the implementation of this procedure it were considered as two different groups the cases
1 and 2 (wFTC) against cases 3 and 4 (mFTC) The following step was to assemble transcripts for
each sample with Cufflinks 1 and afterwards create a single merged transcriptome annotation with
Cuffmerge 2 Cuffdiff 3 was then used to find significant changes in transcript expression
In order to find potential isoforms each sample was ran against the reference genome with
Cuffcompare 4
44 Genome version GRCh37 versus GRCh38
Even though IPATIMUPrsquos data have been assembled with reference genome version GRCh37
nowadays a more recent version (GRCh38) has been released in 2013 This new assembly is the
first major revision of the human genome in more than four years 5
The main differences between this two versions are
Alternate sequences several human chromosomal regions have sufficient variability to prevent
adequate representation by a single sequence This new version provides alternate sequence
for selected variant regions through the inclusion of alternate loci 6 scaffolds
Centromere 7 representation Previous method of representing centromeric regions have been
replaced by sequences from centromere models The models provide the approximate repeat
number and order for each centromere and are useful for read mapping and variation studies
Mitochondrial genome The new mitochondrial reference sequence is the Revised Cambridge
Reference Sequence with RefSeq accession number NC_0129201 The previous one was
RefSeq accession number NC_001907 which was not updated when GRCh37 assembly
later transitioned to the new version1Cufflinks httpcole-trapnell-labgithubiocufflinks2Cuffmerge httpcole-trapnell-labgithubiocufflinkscuffmergeindexhtml3Cuffdiff httpcole-trapnell-labgithubiocufflinkscuffdiffindexhtml4Cuffcompare httpcole-trapnell-labgithubiocufflinkscuffcompareindexhtml5As in UCSC mailing list at httpsgroupsgooglecomasoeucsceduforumtopic
genome-announce52Kv41YBXNY6Specific location of a gene on a chromosome
28
Case study
Figure 41 An overview of the Tuxedo Protocol with full steps TopHat for alignment Cufflinkspackage to find differential features between group samples and in the end CummeRbund to plotprevious results
Sequence updates Several erroneous bases and misassembled regions have been corrected and
more than 100 gaps have been filled or reduced
Analysis set The new assembly offers an analysis set that was created to accommodate next
generation sequencing read alignment pipelines Several GRCh38 regions have been elimi-
nated from this set to improve read mapping
29
Case study
45 Fusion genes
After we done some research on the technologies used for finding fusion genes in the reads we
have not been able to perform the analysis to answer the last question of our researching objectives
DeFuse required as input the original reads which were not provided This analysis would have
been interesting for relating the ocurrence of thyroid and the presence of fusion genes as well as if
there was any relevant difference between the samples of wFTC and mFTC
46 Results
461 Case study with reference genome GRCh37
The following table ( 41) demonstrates some genes that were differentially expressed with signif-
icance between mFTC and wFTC According to Celestino et al 8 CRABP1 C1QL1 and LCN2
are biomarkers of thyroid cancer and predictors of extrathyroidal extension It is commonly used
the value of 005 has threshold above which the differential expression is significant By inspect-
ing out the table we can find C1QL1 with a q-value of 0000555 and CRABP1 with a q-value
of 159E-11 which are in concordance with the previous article Furthermore it is verified the
increased gene expression in wFTC when compared to mFTC
Gene ID Gene Chr mFTC wFTC Fold change(log2) Q value
ENSG00000167748 KLK1 19 018672 111924 922742 0ENSG00000104725 NEFL 8 00196645 276961 104599 0ENSG00000174145 KIAA1239 4 00307388 144265 887444 0ENSG00000182379 NXPH4 12 008307 195786 788074 0ENSG00000131094 C1QL1 17 0121453 238957 429828 0000555ENSG00000142677 IL22RAI 1 150905 0384783 -529345 0ENSG00000138615 CILP 15 423569 0052726 -632793 241E-11ENSG00000141431 ASXL3 18 18938 001408 -707148 124E-09ENSG00000166426 CRABP1 15 748375 0367899 -766831 159E-11ENSG00000214145 LINC00887 3 19797 0119327 -737421 0000459
Table 41 Genes differentially expressed between minimally invasive follicular thryoid carcino-mas (mFTCs) and widely invasive follicular thyroid carcinomas (wFTCs)
In response to the previous researching objectives the Table 42 has the statistical results for
taks two and three From the data analysis we could conclude that less than 1 of genes have
isoforms but each one has an average of 389 alternatives
8Ricardo Celestino Torfin Nome Ana Pestana Andreas M Hoff Pedro A Gonccedilalves Catarina Eloy Eva SigstadRagnhild A Lothe Trine Bjoslashro Manuel Sobrinho-Simotildees Rofl I Skotheim Paula Soares CRAPBP1 C1QL1 andLCN2 are biomarkers of thyroid cancer and predictors of extrathyroidal extension subbmited for publication
30
Case study
Total genes 63896Total significant isoforms 689Total unique genes with isoforms 179Ratio of unique genes with isoformsgenes () 028Average of alternatives per gene with isoforms 389
Table 42 Statistical results for researching objectives number 2 and 3
462 Splicing analysis
Forward in the analysis Cuffcompare 9 has been used to search for novel isoforms when com-
pared to the reference genome The method was to compare each sample to the reference genome
and afterwards make an overlap of the results The main objective was then to infer about the
differences among wFTC and mFTC
Sample 1(wFTC)
Sample 2(wFTC)
Sample 3(mFTC)
Sample 4(mFTC)
Total genes 30440 36862 35539 37534Potential novel isoforms 7406 8450 8781 8830Table 43 Potential novel isoforms for each sample of IPATIMUPrsquos data
As demonstrated on Table 43 average there is a percentage of 24 of potentially novel iso-
forms found (at least one spliced junction is shared with a reference transcript) There is been
made an overlap of the results in order to encounter differences between wFTC and mFTC The
Table 44 presents the counting of differences between cases A brief analysis allows us to say
that we can not make any relationship between wFTC and mFTC On average there was a total of
3722 changes among this two sets The average within the sets are 3554 for wFTC and 3992 for
mFTC Given this results there was not a significant divergence to allow us to relate the splicing
and the occurrence of a more invasive Thyroid Carcinoma
Sets ChangesS1 S2 3554S1 S3 3609S1 S4 3612S2 S3 3847S2 S4 3820S3 S4 3929
Table 44 Number of differences between samples Syntax used S1 - Sample 1 S2 - Sample 2S3 - Sample 3 and S4 - Sample 4
9Cuffcompare httpcole-trapnell-labgithubiocufflinkscuffcompareindexhtml
31
Case study
463 Case study with reference genome GRCh38
In order to respond to the last research objective it has been applied the method of analysis has
before with a more recent human genome assembly After using the same protocol with Cufflinks
Cuffmerge and Cuffdiff sequentially we have come to some conclusions
The produced results of differential expression analysis for the same genes were very different
Genes that were highly significant before like C1QL1 and CRABP1 now had no relevance (q-
value gt 005) As mentioned before we had only access to TopHatrsquos output that used version
GRCh37 for the alignment and mapping process so we could not start from scratch the analysis
This outcome demonstrates two topics in particular
1 the introduction of novel annotations can make previous analysis outdated
2 there is the need to save the original reads in order to update earlier studies
The solution to this situation would have been to use the original reads to repeat the assembly
and then follow the Tuxedo protocol to collected correct and updated differential expression data
47 Chapter Summary
These section of development has been introduced in order to confer not only validation but also
to do some researching studies on the subject Four samples were collected and divided into two
distinct groups Tuxedo protocol was followed for responding to the research objectives The
case study for GRCh37 demonstrated the expression of C1QL1 and CRABP1 on wFTC when
compared to mFTC as indicated in the referred article On the other hand the same protocol when
applied with GRCh38 demonstrated the importance of saving the original reads and what is the
influence of newer releases in previous researching results Lastly the splicing analysis results did
not show any evidence of related isoforms count and the manifestation of the different stages of
the disease
32
Chapter 5
Conclusions and Future Work
The research of genomic-based cancers require highly complex data analysis Such analysis re-
quire most often the use of a large number of complex computational resources the gathering
of a lot of information over the Internet and the use of powerful computational resources Fur-
thermore the manipulation of the computational tools and resources require the assistance of an
informatics expert
The thesis work is a contribution towards the solution of the above mention problem We
propose and developed a framework that enables an expert biologist to perform genomic-based
complex analysis in a easy way and using the required powerful computational resources in a
transparent way
Using the developed framework we have used real data to address several research questions
provided by IPATIMUPrsquos researchers Firstly with the human genome GRCh37 we identified
two of the biomarkers of thyroid cancer by differential gene expression analysis Secondly we
found 689 significant isoforms 179 unique out of 63896 genes (ratio of 028) with an average
of 389 isoforms per gene Thirdly when trying to determine potential novel isoforms we came
at no conclusion of the differences of expression when comparing wFTC and mFTC The last
case was applying the Tuxedo protocol with the new GRCh38 on samples The outcome of the
experiment revealed the importance of saving the original reads and that newer releases become
previous analysis outdated
Future Work
This thesis work is just a starting point As stated before the framework was designed so it can be
extended with further modules to enable addressing other research questions
The case studies also showed us that RNA-seq analysis is very time consuming On the other
hand there are a lot of sub-tasks that can be run in parallel (like the task of aligning the reads)
33
Conclusions and Future Work
We will study and compare different techniques and opportunities to make RNA-seq in parallel as
much as possible
34
References
[bNE] Scitable by Nature Education Transcriptome available at httpwwwnaturecomscitabledefinitiontranscriptome-296 last accessJanuary 2015
[CAB+15] Fiona Cunningham M Ridwan Amode Daniel Barrell Kathryn Beal Konstanti-nos Billis Simon Brent Denise Carvalho-Silva Peter Clapham Guy CoatesStephen Fitzgerald Laurent Gil Carlos Garciacutea Giroacuten Leo Gordon ThibautHourlier Sarah E Hunt Sophie H Janacek Nathan Johnson Thomas Juette-mann Andreas K Kaumlhaumlri Stephen Keenan Fergal J Martin Thomas MaurelWilliam McLaren Daniel N Murphy Rishi Nag Bert Overduin Anne ParkerMateus Patricio Emily Perry Miguel Pignatelli Harpreet Singh Riat DanielSheppard Kieron Taylor Anja Thormann Alessandro Vullo Steven P WilderAmonida Zadissa Bronwen L Aken Ewan Birney Jennifer Harrow Rhoda Kin-sella Matthieu Muffato Magali Ruffier Stephen MJ Searle Giulietta SpudichStephen J Trevanion Andy Yates Daniel R Zerbino and Paul Flicek Ensembl2015 Nucleic Acids Research 43(D1)D662ndashD669 2015
[CFG+10] Peter J A Cock Christopher J Fields Naohisa Goto Michael L Heuer and Peter MRice The Sanger FASTQ file format for sequences with quality scores and theSolexaIllumina FASTQ variants Nucleic acids research 38(6)1767ndash71 April2010
[CH07] Geoffrey M Cooper and Robert E Hausman The Cell - A molecular approachAmerican Society for Microbiology 2007
[Cod70] E F Codd A relational model of data for large shared data banks Communica-tions of the ACM 13(6)377ndash387 June 1970
[Con11] The ENCODE Project Consortium A userrsquos guide to the encyclopedia of DNAelements (ENCODE) PLoS biology 9(4)e1001046 April 2011
[FMB14] N A Fonseca J A Marioni and A Brazma RNA-seq gene profiling - a system-atic empirical comparison Technical report May 2014
[FPMB14] Nuno A Fonseca Robert Petryszak John Marioni and Alvis Brazma irap - anintegrated rna-seq analysis pipeline bioRxiv 2014
[GCW+10] Qiang Gan Iouri Chepelev Gang Wei Lama Tarayrah Kairong Cui Keji Zhaoand Xin Chen Dynamic regulation of alternative splicing and chromatin structurein Drosophila gonads revealed by RNA-seq Cell research 20(7)763ndash83 July2010
35
REFERENCES
[GEN] GENIE Dna genes and chromossomes University of Leicesteravailable at httpwww2leacukdepartmentsgeneticsvgecschoolscollegestopicsdna-genes-chromosomes last access Jan-uary 2015
[Gri] Malachi Griffith Bioinformatics for Cancer Genomics (BiCG)available at httpbioinformaticscaworkshops2012bioinformatics-cancer-genomics-bicg last access January 2015
[GTBK11] Angela Goncalves Andrew Tikhonov Alvis Brazma and Misha Kapushesky Apipeline for RNA-seq data processing and quality assessment Bioinformatics (Ox-ford England) 27(6)867ndash9 March 2011
[HBB+02] T Hubbard D Barker E Birney G Cameron Y Chen L Clark T CoxJ Cuff V Curwen T Down R Durbin E Eyras J Gilbert M HammondL Huminiecki A Kasprzyk H Lehvaslaiho P Lijnzaad C Melsopp E Mon-gin R Pettett M Pocock S Potter A Rust E Schmidt S Searle G SlaterJ Smith W Spooner A Stabenau J Stalker E Stupka A Ureta-Vidal I Vastrikand M Clamp The ensembl genome database project Nucleic Acids Research30(1)38ndash41 2002
[HBD+13] R Hitzemann D Bottomly P Darakjian N Walter O Iancu R SearlesB Wilmot and S McWeeney Genes behavior and next-generation RNA se-quencing Genes Brain Behav 12(1)1ndash12 Feb 2013
[Ins] National Human Genome Research Institute Transcriptome available at httpwwwgenomegov13014330 last access January 2015
[Joh03] Jason M Johnson Genome-wide survey of human alternative pre-mrna splicingwith exon junction microarrays Science 3022141ndash2144 December 2003
[kn10] Gene set enrichment a problem of pathways Briefings in functional genomics9(5-6)385ndash90 December 2010
[kn11] Overview of available methods for diverse RNA-Seq data analyses Science ChinaLife sciences 54(12)1121ndash8 December 2011
[Lan10] Ben Langmead Aligning short sequencing reads with Bowtie Current proto-cols in bioinformatics editoral board Andreas D Baxevanis [et al] Chapter11Unit 117 December 2010
[LM10] Adam Lith and Jakob Mattsson Investigating storage solutions for large data - acomparison of well performing and scalable data storage solutions for real timeextraction and batch insertion of data Masterrsquos thesis 2010
[LTPS09] Ben Langmead Cole Trapnell Mihai Pop and Steven L Salzberg Ultrafastand memory-efficient alignment of short DNA sequences to the human genomeGenome biology 10(3)R25 January 2009
[ORY10] Alicia Oshlack Mark D Robinson and Matthew D Young From RNA-seq readsto differential expression results Genome biology 11(12)220 January 2010
[SG15] Marc W Schmid and Ueli Grossniklaus Rcount simple and flexible RNA-Seqread counting Bioinformatics 31(3)436ndash437 February 2015
36
REFERENCES
[SK11] Christof Strauch and Walter Kriha NoSQL databases Lecture Notes StuttgartMedia University February 2011
[SOdMVN12] Mikhail Shugay Intildeigo Ortiz de Mendiacutebil Joseacute L Vizmanos and Francisco JNovo Genomic hallmarks of genes involved in chromosomal translocations inhematological cancer PLoS Comput Biol 8(12)e1002797 12 2012
[The04] The ENCODE Project Consortium The ENCODE (ENCyclopedia Of DNA Ele-ments) Project Science (New York NY) 306(5696)636ndash40 October 2004
[TPS09] Cole Trapnell Lior Pachter and Steven L Salzberg TopHat discovering splicejunctions with RNA-Seq Bioinformatics (Oxford England) 25(9)1105ndash11 May2009
[TRG+12a] Cole Trapnell Adam Roberts Loyal Goff Geo Pertea Daehwan Kim David RKelley Harold Pimentel Steven L Salzberg John L Rinn and Lior Pachter Dif-ferential gene and transcript expression analysis of RNA-seq experiments withTopHat and Cufflinks Nature protocols 7(3)562ndash78 March 2012
[TRG+12b] Cole Trapnell Adam Roberts Loyal Goff Geo Pertea Daehwan Kim David RKelley Harold Pimentel Steven L Salzberg John L Rinn and Lior Pachter Dif-ferential gene and transcript expression analysis of RNA-seq experiments withTopHat and Cufflinks Nature protocols 7(3)562ndash78 March 2012
[WMM+11] Ying Wang Gaurang Mehta Rajiv Mayani Jingxi Lu Tade Souaiaia YanghoChen Andrew Clark Hee Jae Yoon Lin Wan Oleg V Evgrafov James AKnowles Ewa Deelman and Ting Chen RseqFlow workflows for RNA-Seq dataanalysis Bioinformatics (Oxford England) 27(18)2598ndash600 September 2011
[Wol13] Jochen B W Wolf Principles of transcriptome analysis and gene expressionquantification an rna-seq tutorial Molecular Ecology Resources 13(4)559ndash5722013
[ZW09] Mark Gerstein |amp Michael Snyder Zhong Wang Rna-seq a revolutionary tool fortranscriptomics Nature Reviews Genetics 1057ndash63 January 2009
37
REFERENCES
38
Appendix A
iRAP tools supported
A1 Mappers
Mapper Option name (mapper)TopHat 1 tophat1TopHat 2 tophat2SMALT smaltGSNAP gsnapSOAPsplice soapspliceBWA bwa1BWA bwa2Bowtie 1 bowtie1Bowtie2 bowtie2GEM gemSTAR starOSA osaMapSplice mapsplice
A2 Quantification
Quantifier Option name (quant_method)FluxCapacitor flux_capHT-Seq (union mode) htseq1HT-Seq (intersection non-empty mode) htseq2Cufflinks 1 (try to find novel transcripts-g) cufflinks1Cufflinks 2 (try to find novel transcripts-g) cufflinks2Cufflinks 1 (do not assemble novel transcripts-G) cufflinks1_ndCufflinks 2 (do not assemble novel transcripts-G) cufflinks2_ndNURD nurd
39
iRAP tools supported
A3 Differential expression [DE]
Method Option name (de_method)DESeq deseqDESeq2 deseq2EdgeR edgerCuffdiff 1 cuffdiff1Cuffdiff 2 cuffdiff2
A4 Gene set enrichment analysis [GSE]
Tool Option name (gse_tool)Piano piano
40
Appendix B
iRAP model of configuration file
1 This is a comment (lines that start with a are ignored by iRAP)
2 =============================================================================
3 name that you want to give to the experiment (no spaces)
4 All files produced by irap will be placed in a folder with the given name
5 name=myexp
6
7
8 =============================================================================
9 name of the species
10 species=homo_sapiens
11
12 =============================================================================
13 Fasta file with the reference genome
14 reference=Homo_sapiensGRCh3766dnafa
15
16 =============================================================================
17 GTF file with the annotations
18 gtf_file=Homo_sapiensGRCh3766gtf
19
20 =============================================================================
21 IRAP options (may be providedoverriden in the command line)
22
23
24 Mapper
25 mapper=
26
27
28 Quantification method
29 quant_method=
30
31
32 Dif expression method
33 Requires contrasts to be defined (see below)
41
iRAP model of configuration file
34 de_method=
35
36
37 Gene set enrichment (GSE) analysis
38 Requires de_method to be defined
39 Tool to use (none|piano)
40 gse_tool=piano
41
42 gse_method (mean|median|sum|fisher|fisher-exact|stouffer|tailStrength|wilcoxon|
reporter|page) see Piano vignete documentation for more details
43 gse_method=fisher
44 gse_pvalue=005
45 Minimum number of genes in a gene set
46 gse_minsize=3
47
48
49
50 TSV file with gene annotation
51 Format IDNamelocussourcelnameGOGOtermKEGG
52 Description
53 ID=gene_id (this is mandatory and should match the one given in the gtf file)
54 Name=gene name
55 locus=chrstart--end
56 source=biotype
57 lname=gene name
58 GO=go ids (multiple values can be separated by)
59 GO=GO terms (multiple values can be separated by)
60 KEGG=Kegg ids (multiple values can be separated by)
61 If auto is defined then iRAP will try to generate the file
62 - this may take a considerable amount of time and will only work
63 for a reduced number of species
64 off - default value
65 annot_tsv=
66
67
68 QC
69 Check data (reads) quality (on|off|none)
70 on - reads are filtered out based on their quality
71 off - the quality of the reads is assessed but no filtering is done
72 none- no quality control is performed
73 qual_filtering=on
74
75 Trim all reads to the minimum read size after quality trimming - Yes (y)| No (n)
76 only applicable if qual_filtering is on
77 trim_reads=y
78
79 Minimum base quality accepted (def 10)
80 min_read_quality=10
81
42
iRAP model of configuration file
82 Contamination check (cont_index parameter) Reads that likely
83 originate from organisms other than the one under study can be
84 discarded during pre-processment of the reads This is done by
85 aligning the reads to the genomes of organisms that might be a
86 source of contamination and discard those that map with a high
87 degree of fidelity By default iRAP will check if the data is
88 contaminated by e-coli An example to create a contamination
89 database is provided in the examplesex_add2contaminationDBsh
90 script The value of the parameter should be the file name prefix of
91 the bowtie index files
92
93 Disable contamination check
94 cont_index=no
95 Default value
96 cont_index=$(data_dir)contaminatione_coli
97
98
99 Misc options
100
101 Number of threads that may be used by IRAP
102 max_threads=1
103
104 Exon level quantification Yes (y)| No (n)
105 exon_quant=y
106
107 Transcript level quantification Yes (y)| No (n)
108 transcript_quant=y
109 =============================================================================
110 full or relative path to the directory where all the data can be found
111 data_dir=data
112
113 the directory should be organized as follows (see directory data in IRAP toplevel
directory)
114
115 $data_dir
116 $data_dir
117 contamination
118 e_coli1ebwt
119 e_coli2ebwt
120 e_coli3ebwt
121 e_coli4ebwt
122 e_coliREADME
123 e_colirev1ebwt
124 e_colirev2eb
125 raw_data
126 $species
127 fastq
128 fastq
129
43
iRAP model of configuration file
130 reference
131 $species
132 $gtf_file
133 $reference
134
135 Notes
136 1) $ denotes the value defined for the variable
137 2) Since version 050 the raw data (fastqbam) files may be
138 distributed across several sub-folders
139
140
141 =============================================================================
142 Only necessary if you intend to perform Differential Expression analysis
143
144 contrasts=contrast_def [contrast_def ]
145 contrasts=purpleVsPink purpleVsGrey
146
147 definition of each constrast
148 contrast= group group [ group ]
149 purlpleVsPink=Purple Pink
150 purlpleVsGrey=Purple Grey
151
152 groups
153 GroupName= Library_name [Library_name ]
154 Purlple=myLib1 myLib2
155 Pink=myLib3
156 Grey=myLib4
157
158 optional parameter used in the report (HTML) generation
159 groups=Purple Pink Grey
160
161 technical replicates
162 technicalreplicates=myLib1myLib2myLib3mylib4
163
164 Note names of groups contrasts and libraries should start with a letter and
contain only alphanumeric characters and the character _
165
166 =============================================================================
167 Data
168
169
170 Information for each library
171 LibName=Fastq file
172 Note
173 1 LibName should start with a letter and contain only alphanumeric characters
and the character _ LibName should not contain in _1 or _2
174 2 LibName should be different from the name of the fastq file for instance
175 f1=f1fastq
176 will produce an error
44
iRAP model of configuration file
177
178 Single-end
179 myLib1=f1fastq
180 read size
181 myLib1_rs=75
182 quality encoding (33 or 64)
183 myLib1_qual=33
184
185 strand specific protocol
186 mylib1_strand=first
187 mylib1_strand=second
188 Default value is both (strands)
189 mylib1_strand=both
190
191 Have the file in a different sub-folder
192 mylib1_dir=somesubfolder
193
194 See SAMBAM specification for more details about the following two parameters
195 read group id (to be included in the BAM file) - this is not supported by all
mappers
196 myLib1_rgid=
197 sambam header lines to include in the BAM file
198 myLib1_shl=COtThis is a commentnCOtand another line
199
200 LibName=Fastq file
201 myLib2=f2fastq
202 read size
203 myLib2_rs=75
204 quality encoding (33 or 64)
205 myLib2_qual=33
206
207
208 Paired-end
209 LibName=Fastq files
210 myLib3=f3_1fastq f3_2fastq
211 read size
212 myLib3_rs=50
213 quality encoding (33 or 64)
214 myLib3_qual=33
215 insert size
216 myLib3_ins=350
217 standard deviation
218 myLib3_sd=60
219
220 LibName=Fastq files
221 myLib4=f4_1fastq f4_2fastq
222 read size
223 myLib4_rs=50
224 quality encoding (33 or 64)
45
iRAP model of configuration file
225 myLib4_qual=33
226 insert size
227 myLib4_ins=350
228 standard deviation
229 myLib4_sd=60
230
231
232
233
234 list the names of your single-end (se) and paired (pe) libraries
235 se=myLib1 myLib2
236 pe=myLib3 myLib4
237 No SE data
238 se=
239 No PE data
240 pe=
241
242
243
244 Passingoverriding parameters
245
246 It is possible to pass parameters to the mappers and quantification
247 methods but that should be done carefully since it may break the
248 pipeline (if the location of the input andor output files is
249 changed)
250
251 Overridingchanging the mappersrsquo parameters
252 _map_options=options
253 Example
254 tophat2_map_options=--min-intron-length 5 --no-coverage-search
255
256 Overridingchanging the parameters of the quantification methods
257 _params=options
258 Example
259 htseq_params= -q
46
Appendix C
iRAP example configuration file
1 minimal configuration file for DE
2 experiment name
3 name=ecoli_ex
4 species
5 species=ecoli_k12
6 reference genome
7 reference=Escherichia_coli_str_k_12_substr_mg1655GCA_000005845119dnatoplevel
fagz
8 gtf file
9 gtf_file=Escherichia_coli_str_k_12_substr_mg1655GCA_000005845119gtfgz
10 Enable filtering based on quality
11 qual_filtering=on
12 Use a contamination data set to filter out reads
13 cont_index=no
14 Toplevel directory with the data
15 data_dir=
16
17 some contrasts
18 GA=Group A
19 contrasts=GAvsGB GBvsGA
20 GAvsGB=GA GB
21 GBvsGA=GB GA
22 GA=FA FB FC
23 GB=FD FE FF
24
25 se=FA FB FC FD FE FF
26
27 FA=SRR933983fastqgz
28 FA_rs=50
29 FA_qual=33
30
31 FB=SRR933984fastqgz
32 FB_rs=50
47
iRAP example configuration file
33 FB_qual=33
34
35 FC=SRR933985fastqgz
36 FC_rs=50
37 FC_qual=33
38
39 FD=SRR933989fastqgz
40 FD_rs=50
41 FD_qual=33
42
43 FE=SRR933990fastqgz
44 FE_rs=50
45 FE_qual=33
46
47 FF=SRR933990fastqgz
48 FF_rs=50
49 FF_qual=33
50 EOF
48
- Front Page
- Table of Contents
- List of Figures
- List of Tables
- 1 Introduction
-
- 11 Context
- 12 Motivation and Goals
- 13 Proposed Solution
- 14 Structure of the Dissertation
-
- 2 Basic Concepts and Bibliographic Review
-
- 21 Biological Basic Concepts
-
- 211 Genome
- 212 Transcriptome Assembly and Gene expression
-
- 22 RNA-Seq Analysis
-
- 221 RNA-Seq microarrays and DNA sequencing
- 222 RNA-Seq Pipeline
-
- 23 Standard File Formats used
-
- 231 FASTA
- 232 FASTQ
- 233 SAM and BAM
- 234 GFF and GTF
-
- 24 Relevant Data Repositories
- 25 Tools for RNA-seq and Differential Analysis
- 26 Relational and Non-relational Databases
- 27 Tecnologies
- 28 Related Work
- 29 Chapter Summary
-
- 3 The Gemini framework
-
- 31 Gemini
- 32 Gemini Architecture
-
- 321 Physical Architecture
-
- 33 Data Management
- 34 Web Interface
- 35 Use cases
- 36 Case studies
-
- 361 Full pipeline
- 362 Stage pipeline
-
- 37 Chapter Summary
-
- 4 Case study
-
- 41 Samples characterization
- 42 Researching objectives
- 43 Protocol of analysis
- 44 Genome version GRCh37 versus GRCh38
- 45 Fusion genes
- 46 Results
-
- 461 Case study with reference genome GRCh37
- 462 Splicing analysis
- 463 Case study with reference genome GRCh38
-
- 47 Chapter Summary
-
- 5 Conclusions and Future Work
- References
- A iRAP tools supported
-
- A1 Mappers
- A2 Quantification
- A3 Differential expression [DE]
- A4 Gene set enrichment analysis [GSE]
-
- B iRAP model of configuration file
- C iRAP example configuration file
-
Basic Concepts and Bibliographic Review
It currently has a sequence retrieval tools that provides searching by database and dataset
Nowadays this tool offers Ensembl as the only available database but it adds up three other fea-
tures like a sequences filters and header information panels where the users can improve their
search
29 Chapter Summary
In this chapter we presented and discussed the technologies suitable for the thesis work We have
surveyed alternative technologies for gene expression computation and alternative splicing tools
The technologies are relevant to solve the Biological domain problem We have also surveyed
the tools for the development of websites and databases to store the data used when solving the
biological problems In the next chapter we describe work in detail
18
Chapter 3
The Gemini framework
Despite the very large number of tools available for Molecular Biology problems they are most
often difficult to use and require sophisticated computational resources As part of the thesis
work we have developed a framework that allows expert users to make RNA-Seq and alternative
splicing analysis using a user friendly web interface and sophisticated computational resources
In this chapter we describe that framework that include the website database resources for storing
data and the computational settings for the analysis
iRAP has been chosen to accomplish the automation of RNA sequencing analysis due to the
simplicity of use and its wide number of tools available for its task Since it is an integrated
tool platform its installation requires not only powerful computer resources but also a long list of
basic equipment necessary to each of them Considering these issues it had not always been easy
to setup the wanted work environment
Despite the difficulties of this scenario we have been able to complete the setup of this tool
and make some control experiments with it
In order to accomplish an iRAP execution a configuration file must be provided (see Ap-
pendix B) Along with the experiment name the name of species being analysed the reference
genome and read data files need to be specified and made available Furthermore the specific
tools for each stage of the pipeline need also to be specified among other possible variables
It is not easy and usually very time consuming for a Biologist to create the configuration file or
to run the command-line interface that controls iRAP pipeline Since this system is a combination
of many different tools there are a long list of available options that may be fulfilled Some of
them are mandatory while other ones are optional After this setting is completed it must be saved
in a text file and made available to run iRAP
Even though the usage of iRAP does not require extensive bioinformatics expertise it does
assume familiarity with UNIX command-line interface which would narrow down the target audi-
ence In order to overcome this situation we designed and developed a framework called Gemini
19
The Gemini framework
that includes a Graphical User Interface and makes RNA-Seq studies much more easy to perform
We have also included extra features for doing more analysis to RNA-Seq data
31 Gemini
Due to the lack of intuitiveness on the process of generating the configuration file it has been
created a more user friendly one through a web form This form asks for input of the main settings
to call a very simple experiment with a commonly used bacteria escherichia ecoli (e coli)
Another important feature is the possibility to fill the form asking what is the stage that the user
wants the pipeline to start with
Another issue was to find and easily download a reference genome for a certain species In
order to add completeness to Gemini and also to simplify the process of download it has been
implemented the functionality to download the reference genome (both fasta and annotation files)
It is used the Ensembl API to obtain the required results The jobs status feature lists the status of
jobs sent by the user for execution
Besides these features one more have been added even though not completed It is the job
results where it is presented the results collected for a determined task
32 Gemini Architecture
321 Physical Architecture
Gemini is divided into two different sets The first one is where the web application is hosted as
well as the database Since dealing with genomic data often requires great computer performance
processing experiments is accomplished in an independent server that later responds with results
Figure 31 Physical architecture of Gemini
Data scheme
MongoDB is NoSQL document based database The information is organized in collections
in which each element is stored as a JSON document NoSQL databases are simpler to use when it
20
The Gemini framework
comes to have different information fields in the same document and at the same time they have
better performance and scalability [SK11] Currently the information is arranjed in two collections
scheme as described on Table 31
Name DescriptionAccounts Stores the users dataJobs Stores the experiments dataTable 31 Collections used to store data
Accounts
An accountrsquos document stores an userrsquos email password and a unique identifier A role has
also been saved for future hierarchy creation in which some levels will grant more permissions
than others like changing accounts settings of other participants
1
2 _id ObjectId(54f5a9b234f76511a82ec3b2)
3 password e10adc3949ba59abbe56e057f20f883e
4 role user
5 email acgggomesgmailcom
6
Jobs
Jobs are related to an user and have the name and description of the experiment It also
stores the reference genomersquos location as well as the readsrsquo one Likewise the date of creation is
preserved When a job is completed the status is modified to finished
1
2 _id ObjectId(5544ecf134f7651d687bba94)
3 name ExpFinal
4 exp_dir data54f5a9b234f76511a82ec3b2ExpFinalreads
5 user 54f5a9b234f76511a82ec3b2
6 description Final test
7 genome_dir genomesEscherichia coli
8 status started
9 date ISODate(2015-05-02T152745249Z)
10
21
The Gemini framework
33 Data Management
In order to create a new job it is required two sets of data namely reference files and raw data
files The raw data is the actual data being analysed while the reference genome serves as basis to
the alignment or control
The typical workflow consists on the expert providing the experience and species names as
well as the raw data that was previously collected in the laboratory Afterwards through a step by
step system the user has the option to choose the reference genome to be used on the experiment
This last files are internally obtained from different FTP servers such as Ensembl and ENCODE
stored locally and reused in further usages
The provided information is then saved in the database and the files stored hierarchically We
use the following sequence of ltsection namegt ltuseridgt ltexperience namegt ltdata filesgt The
ltsection namegt can be conf for storing configuration files data for saving the reads or refer-
ence for keeping the reference genome and annotation files The ltuseridgt is the ID of Accounts
database document and the ltexperience namegt is the same as name in Jobs database document
A directory tree is represented in Figure 32
Figure 32 File system tree demonstrating the hierarchy of saved data files
This information is then passed to the server via a local FTP server that has been created
22
The Gemini framework
for this purpose We have followed an online tutorial 1 for the configuration From this we
created one administrator that has permissions for writing and reading files and we also authorized
anonymous login that may only retrieve files This way on the web application the admin user
creates the reads reference genomes annotation and configuration files On the computational
server an anonymous user authenticates for retrieving the files according to the filenames received
via API
The inside directory of FTP follows the hierarchy of ltuseridgt ltexperience namegt ltdata
filesgt where ltuseridgt is the ID on the Accounts document and ltexperience namegt is the name
on Jobs document When the server is prompted to run an experience it downloads the required
data from the FTP and runs iRAP with the necessary configuration options
34 Web Interface
For the implementation of Gemini python has been used for backend along with a simple fast and
lightweight WSGI micro web-framework called BottlePy 2 It has no dependencies and grants the
main functionalities such as routing templates some class utilities and a built-in server
The first screenshot (Figure 33) shows the home page of Gemini There is top menu bar with
two possible interactions login and register There is also a simple content box that describes the
main features and status of development of the platform Later on a new menu appears with the
possibility to logout on the Welcome tab (as in Figure 34)
Figure 33 Home page
Figure 34 Logout menu
1Tutorial available at httpswwwthomas-krenncomenwikiSetup_FTP_Server_under_Debian
2BottlePy httpbottlepyorgdocsdevindexhtml
23
The Gemini framework
The main feature of the system is the create job (Figure 35) option that is easily accessible on
top menu When the user clicks on it a form is displayed with the variables to introduce on the
configuration file that iRAP needs A description option has been added to provide the freedom to
the researcher to include some extra information that he finds useful
Figure 35 Create job form
The same type of form was used for the reference genomes section (Figure 36) The user is
prompted to choose orderly the species name release number and version Afterwards a table of
elements appears allowing the expert to download the files found
Figure 36 Reference genomes component
24
The Gemini framework
35 Use cases
Gemini was designed to have only one actor the user that will accomplish the experiments This
actor has the possibility to register login and logout of his account create a job and the hability
to download a reference genome of his choice Even though not fully implemented it has been
considered the jobs done functionality
Figure 37 Use cases diagram
36 Case studies
Some case studies with e coli in order to test iRAPrsquos installation and its capabilities For both
of the case studies it has been collected six samples of Escherichia coli reads from European
Nucleotide Archive 3 and the corresponding reference genome and annotation file from Ensembl
361 Full pipeline
In order to call the full pipeline iRAP has been tested with the directive irap conf=ecoli_exconf
Configuration file (ecoli_exconf ) content is as described in Appendix C In this task the system
received the reads and performed the quality control (QC) mapping quantification and differential
expression between the two groups of samples
3ENA httpwwwebiacukena
25
The Gemini framework
This test has been accomplished successfully
362 Stage pipeline
The stage pipeline is a powerful functionality since it allows the user to choose a specific stage of
the pipeline that he wants to execute for his samples
Besides the fact that it is not easy to collect data samples users often want to repeat or analyse
just one step of the pipeline and take some conclusions of it Furthermore this type of pipeline is
less time consuming
A concrete usage example is IPATIMUPrsquos data which contains the output information of the
mapper TopHat and will be further analysed in detail in Chapter 4 Concerning this setup it would
not be possible to call the full pipeline but instead it would require a command specific command
option
For validation purposes the same bacteria from the previous analysis has been used for the
stage pipeline case After calling the setup command to check input the directive irap conf=
ecoli_exconf quality_filtering_and_reporting has been used to perform the stage1
of iRAP The platform was able to perform with success this task
37 Chapter Summary
It has been used Python with BottlePy for the main implementation of the interface of Gemini
MongoDB has been chosen for dealing with information A FTP server was mounted for the
transitions of data between the client and the server The platform allows the expert to call a full or
stage pipeline analysis and provides the download of both fast and annotation files The essential
items are setup for the addition of further functionalities
26
Chapter 4
Case study
In this chapter it is going to be presented the Case Study with data from samples of thyroid carci-
noma along with their charactering and researching results
After the development of an interface to the iRAP tool the following step was to do a case
study with some realistic DNA samples of thyroid cancer patients regarding the partnership with
IPATIMUPrsquos researchers
The purpose of this case study was to do some research of potential differences between dis-
tinct types of the disease In order to accomplish this four samples were collected from Centro
Hospitalar de Satildeo Joatildeo (Porto) Cases 1 and 2 have been categorized as a widely invasive Fol-
licular Thyroid Carcinoma (wFTC) and cases 3 and 4 as a minimally invasive Follicular Thyroid
Carcinoma (mFTC)
41 Samples characterization
Patient from case 1 was female with 82 years old the tumour measuring 2 cm of size and presented
a predominant follicular growth pattern and oncocytic features Patient from case 2 was male with
55 years old the tumour measuring 5 cm of size and presented a predominant solidtrabecular
growth pattern For the group of mFTC patient from case 3 was female 56 years old the tumour
measuring 37 cm of size and with follicular growth pattern patient from case 4 was female 56
years old the tumour measuring 4 cm of size and with follicular growth pattern
42 Researching objectives
The aim of the study was to answer the following questions
bull Differentially expressed genes
bull Total isoforms found either in percentange and in absolute
27
Case study
bull Average of alternative isoforms for each gene spliced
bull Potentially novel isoforms and how do they behave between samplesgroups of samples
bull Compare results between versions of human genome assembly
bull Retrieve fusion genes
43 Protocol of analysis
Collected sample reads have been aligned against reference genome GRCh37 with TopHat version
141 Posterior analysis followed Tuxedo Protocol as described in Trapnell et al [TRG+12b] An
overview of the full protocol can be found in Figure 41
For the implementation of this procedure it were considered as two different groups the cases
1 and 2 (wFTC) against cases 3 and 4 (mFTC) The following step was to assemble transcripts for
each sample with Cufflinks 1 and afterwards create a single merged transcriptome annotation with
Cuffmerge 2 Cuffdiff 3 was then used to find significant changes in transcript expression
In order to find potential isoforms each sample was ran against the reference genome with
Cuffcompare 4
44 Genome version GRCh37 versus GRCh38
Even though IPATIMUPrsquos data have been assembled with reference genome version GRCh37
nowadays a more recent version (GRCh38) has been released in 2013 This new assembly is the
first major revision of the human genome in more than four years 5
The main differences between this two versions are
Alternate sequences several human chromosomal regions have sufficient variability to prevent
adequate representation by a single sequence This new version provides alternate sequence
for selected variant regions through the inclusion of alternate loci 6 scaffolds
Centromere 7 representation Previous method of representing centromeric regions have been
replaced by sequences from centromere models The models provide the approximate repeat
number and order for each centromere and are useful for read mapping and variation studies
Mitochondrial genome The new mitochondrial reference sequence is the Revised Cambridge
Reference Sequence with RefSeq accession number NC_0129201 The previous one was
RefSeq accession number NC_001907 which was not updated when GRCh37 assembly
later transitioned to the new version1Cufflinks httpcole-trapnell-labgithubiocufflinks2Cuffmerge httpcole-trapnell-labgithubiocufflinkscuffmergeindexhtml3Cuffdiff httpcole-trapnell-labgithubiocufflinkscuffdiffindexhtml4Cuffcompare httpcole-trapnell-labgithubiocufflinkscuffcompareindexhtml5As in UCSC mailing list at httpsgroupsgooglecomasoeucsceduforumtopic
genome-announce52Kv41YBXNY6Specific location of a gene on a chromosome
28
Case study
Figure 41 An overview of the Tuxedo Protocol with full steps TopHat for alignment Cufflinkspackage to find differential features between group samples and in the end CummeRbund to plotprevious results
Sequence updates Several erroneous bases and misassembled regions have been corrected and
more than 100 gaps have been filled or reduced
Analysis set The new assembly offers an analysis set that was created to accommodate next
generation sequencing read alignment pipelines Several GRCh38 regions have been elimi-
nated from this set to improve read mapping
29
Case study
45 Fusion genes
After we done some research on the technologies used for finding fusion genes in the reads we
have not been able to perform the analysis to answer the last question of our researching objectives
DeFuse required as input the original reads which were not provided This analysis would have
been interesting for relating the ocurrence of thyroid and the presence of fusion genes as well as if
there was any relevant difference between the samples of wFTC and mFTC
46 Results
461 Case study with reference genome GRCh37
The following table ( 41) demonstrates some genes that were differentially expressed with signif-
icance between mFTC and wFTC According to Celestino et al 8 CRABP1 C1QL1 and LCN2
are biomarkers of thyroid cancer and predictors of extrathyroidal extension It is commonly used
the value of 005 has threshold above which the differential expression is significant By inspect-
ing out the table we can find C1QL1 with a q-value of 0000555 and CRABP1 with a q-value
of 159E-11 which are in concordance with the previous article Furthermore it is verified the
increased gene expression in wFTC when compared to mFTC
Gene ID Gene Chr mFTC wFTC Fold change(log2) Q value
ENSG00000167748 KLK1 19 018672 111924 922742 0ENSG00000104725 NEFL 8 00196645 276961 104599 0ENSG00000174145 KIAA1239 4 00307388 144265 887444 0ENSG00000182379 NXPH4 12 008307 195786 788074 0ENSG00000131094 C1QL1 17 0121453 238957 429828 0000555ENSG00000142677 IL22RAI 1 150905 0384783 -529345 0ENSG00000138615 CILP 15 423569 0052726 -632793 241E-11ENSG00000141431 ASXL3 18 18938 001408 -707148 124E-09ENSG00000166426 CRABP1 15 748375 0367899 -766831 159E-11ENSG00000214145 LINC00887 3 19797 0119327 -737421 0000459
Table 41 Genes differentially expressed between minimally invasive follicular thryoid carcino-mas (mFTCs) and widely invasive follicular thyroid carcinomas (wFTCs)
In response to the previous researching objectives the Table 42 has the statistical results for
taks two and three From the data analysis we could conclude that less than 1 of genes have
isoforms but each one has an average of 389 alternatives
8Ricardo Celestino Torfin Nome Ana Pestana Andreas M Hoff Pedro A Gonccedilalves Catarina Eloy Eva SigstadRagnhild A Lothe Trine Bjoslashro Manuel Sobrinho-Simotildees Rofl I Skotheim Paula Soares CRAPBP1 C1QL1 andLCN2 are biomarkers of thyroid cancer and predictors of extrathyroidal extension subbmited for publication
30
Case study
Total genes 63896Total significant isoforms 689Total unique genes with isoforms 179Ratio of unique genes with isoformsgenes () 028Average of alternatives per gene with isoforms 389
Table 42 Statistical results for researching objectives number 2 and 3
462 Splicing analysis
Forward in the analysis Cuffcompare 9 has been used to search for novel isoforms when com-
pared to the reference genome The method was to compare each sample to the reference genome
and afterwards make an overlap of the results The main objective was then to infer about the
differences among wFTC and mFTC
Sample 1(wFTC)
Sample 2(wFTC)
Sample 3(mFTC)
Sample 4(mFTC)
Total genes 30440 36862 35539 37534Potential novel isoforms 7406 8450 8781 8830Table 43 Potential novel isoforms for each sample of IPATIMUPrsquos data
As demonstrated on Table 43 average there is a percentage of 24 of potentially novel iso-
forms found (at least one spliced junction is shared with a reference transcript) There is been
made an overlap of the results in order to encounter differences between wFTC and mFTC The
Table 44 presents the counting of differences between cases A brief analysis allows us to say
that we can not make any relationship between wFTC and mFTC On average there was a total of
3722 changes among this two sets The average within the sets are 3554 for wFTC and 3992 for
mFTC Given this results there was not a significant divergence to allow us to relate the splicing
and the occurrence of a more invasive Thyroid Carcinoma
Sets ChangesS1 S2 3554S1 S3 3609S1 S4 3612S2 S3 3847S2 S4 3820S3 S4 3929
Table 44 Number of differences between samples Syntax used S1 - Sample 1 S2 - Sample 2S3 - Sample 3 and S4 - Sample 4
9Cuffcompare httpcole-trapnell-labgithubiocufflinkscuffcompareindexhtml
31
Case study
463 Case study with reference genome GRCh38
In order to respond to the last research objective it has been applied the method of analysis has
before with a more recent human genome assembly After using the same protocol with Cufflinks
Cuffmerge and Cuffdiff sequentially we have come to some conclusions
The produced results of differential expression analysis for the same genes were very different
Genes that were highly significant before like C1QL1 and CRABP1 now had no relevance (q-
value gt 005) As mentioned before we had only access to TopHatrsquos output that used version
GRCh37 for the alignment and mapping process so we could not start from scratch the analysis
This outcome demonstrates two topics in particular
1 the introduction of novel annotations can make previous analysis outdated
2 there is the need to save the original reads in order to update earlier studies
The solution to this situation would have been to use the original reads to repeat the assembly
and then follow the Tuxedo protocol to collected correct and updated differential expression data
47 Chapter Summary
These section of development has been introduced in order to confer not only validation but also
to do some researching studies on the subject Four samples were collected and divided into two
distinct groups Tuxedo protocol was followed for responding to the research objectives The
case study for GRCh37 demonstrated the expression of C1QL1 and CRABP1 on wFTC when
compared to mFTC as indicated in the referred article On the other hand the same protocol when
applied with GRCh38 demonstrated the importance of saving the original reads and what is the
influence of newer releases in previous researching results Lastly the splicing analysis results did
not show any evidence of related isoforms count and the manifestation of the different stages of
the disease
32
Chapter 5
Conclusions and Future Work
The research of genomic-based cancers require highly complex data analysis Such analysis re-
quire most often the use of a large number of complex computational resources the gathering
of a lot of information over the Internet and the use of powerful computational resources Fur-
thermore the manipulation of the computational tools and resources require the assistance of an
informatics expert
The thesis work is a contribution towards the solution of the above mention problem We
propose and developed a framework that enables an expert biologist to perform genomic-based
complex analysis in a easy way and using the required powerful computational resources in a
transparent way
Using the developed framework we have used real data to address several research questions
provided by IPATIMUPrsquos researchers Firstly with the human genome GRCh37 we identified
two of the biomarkers of thyroid cancer by differential gene expression analysis Secondly we
found 689 significant isoforms 179 unique out of 63896 genes (ratio of 028) with an average
of 389 isoforms per gene Thirdly when trying to determine potential novel isoforms we came
at no conclusion of the differences of expression when comparing wFTC and mFTC The last
case was applying the Tuxedo protocol with the new GRCh38 on samples The outcome of the
experiment revealed the importance of saving the original reads and that newer releases become
previous analysis outdated
Future Work
This thesis work is just a starting point As stated before the framework was designed so it can be
extended with further modules to enable addressing other research questions
The case studies also showed us that RNA-seq analysis is very time consuming On the other
hand there are a lot of sub-tasks that can be run in parallel (like the task of aligning the reads)
33
Conclusions and Future Work
We will study and compare different techniques and opportunities to make RNA-seq in parallel as
much as possible
34
References
[bNE] Scitable by Nature Education Transcriptome available at httpwwwnaturecomscitabledefinitiontranscriptome-296 last accessJanuary 2015
[CAB+15] Fiona Cunningham M Ridwan Amode Daniel Barrell Kathryn Beal Konstanti-nos Billis Simon Brent Denise Carvalho-Silva Peter Clapham Guy CoatesStephen Fitzgerald Laurent Gil Carlos Garciacutea Giroacuten Leo Gordon ThibautHourlier Sarah E Hunt Sophie H Janacek Nathan Johnson Thomas Juette-mann Andreas K Kaumlhaumlri Stephen Keenan Fergal J Martin Thomas MaurelWilliam McLaren Daniel N Murphy Rishi Nag Bert Overduin Anne ParkerMateus Patricio Emily Perry Miguel Pignatelli Harpreet Singh Riat DanielSheppard Kieron Taylor Anja Thormann Alessandro Vullo Steven P WilderAmonida Zadissa Bronwen L Aken Ewan Birney Jennifer Harrow Rhoda Kin-sella Matthieu Muffato Magali Ruffier Stephen MJ Searle Giulietta SpudichStephen J Trevanion Andy Yates Daniel R Zerbino and Paul Flicek Ensembl2015 Nucleic Acids Research 43(D1)D662ndashD669 2015
[CFG+10] Peter J A Cock Christopher J Fields Naohisa Goto Michael L Heuer and Peter MRice The Sanger FASTQ file format for sequences with quality scores and theSolexaIllumina FASTQ variants Nucleic acids research 38(6)1767ndash71 April2010
[CH07] Geoffrey M Cooper and Robert E Hausman The Cell - A molecular approachAmerican Society for Microbiology 2007
[Cod70] E F Codd A relational model of data for large shared data banks Communica-tions of the ACM 13(6)377ndash387 June 1970
[Con11] The ENCODE Project Consortium A userrsquos guide to the encyclopedia of DNAelements (ENCODE) PLoS biology 9(4)e1001046 April 2011
[FMB14] N A Fonseca J A Marioni and A Brazma RNA-seq gene profiling - a system-atic empirical comparison Technical report May 2014
[FPMB14] Nuno A Fonseca Robert Petryszak John Marioni and Alvis Brazma irap - anintegrated rna-seq analysis pipeline bioRxiv 2014
[GCW+10] Qiang Gan Iouri Chepelev Gang Wei Lama Tarayrah Kairong Cui Keji Zhaoand Xin Chen Dynamic regulation of alternative splicing and chromatin structurein Drosophila gonads revealed by RNA-seq Cell research 20(7)763ndash83 July2010
35
REFERENCES
[GEN] GENIE Dna genes and chromossomes University of Leicesteravailable at httpwww2leacukdepartmentsgeneticsvgecschoolscollegestopicsdna-genes-chromosomes last access Jan-uary 2015
[Gri] Malachi Griffith Bioinformatics for Cancer Genomics (BiCG)available at httpbioinformaticscaworkshops2012bioinformatics-cancer-genomics-bicg last access January 2015
[GTBK11] Angela Goncalves Andrew Tikhonov Alvis Brazma and Misha Kapushesky Apipeline for RNA-seq data processing and quality assessment Bioinformatics (Ox-ford England) 27(6)867ndash9 March 2011
[HBB+02] T Hubbard D Barker E Birney G Cameron Y Chen L Clark T CoxJ Cuff V Curwen T Down R Durbin E Eyras J Gilbert M HammondL Huminiecki A Kasprzyk H Lehvaslaiho P Lijnzaad C Melsopp E Mon-gin R Pettett M Pocock S Potter A Rust E Schmidt S Searle G SlaterJ Smith W Spooner A Stabenau J Stalker E Stupka A Ureta-Vidal I Vastrikand M Clamp The ensembl genome database project Nucleic Acids Research30(1)38ndash41 2002
[HBD+13] R Hitzemann D Bottomly P Darakjian N Walter O Iancu R SearlesB Wilmot and S McWeeney Genes behavior and next-generation RNA se-quencing Genes Brain Behav 12(1)1ndash12 Feb 2013
[Ins] National Human Genome Research Institute Transcriptome available at httpwwwgenomegov13014330 last access January 2015
[Joh03] Jason M Johnson Genome-wide survey of human alternative pre-mrna splicingwith exon junction microarrays Science 3022141ndash2144 December 2003
[kn10] Gene set enrichment a problem of pathways Briefings in functional genomics9(5-6)385ndash90 December 2010
[kn11] Overview of available methods for diverse RNA-Seq data analyses Science ChinaLife sciences 54(12)1121ndash8 December 2011
[Lan10] Ben Langmead Aligning short sequencing reads with Bowtie Current proto-cols in bioinformatics editoral board Andreas D Baxevanis [et al] Chapter11Unit 117 December 2010
[LM10] Adam Lith and Jakob Mattsson Investigating storage solutions for large data - acomparison of well performing and scalable data storage solutions for real timeextraction and batch insertion of data Masterrsquos thesis 2010
[LTPS09] Ben Langmead Cole Trapnell Mihai Pop and Steven L Salzberg Ultrafastand memory-efficient alignment of short DNA sequences to the human genomeGenome biology 10(3)R25 January 2009
[ORY10] Alicia Oshlack Mark D Robinson and Matthew D Young From RNA-seq readsto differential expression results Genome biology 11(12)220 January 2010
[SG15] Marc W Schmid and Ueli Grossniklaus Rcount simple and flexible RNA-Seqread counting Bioinformatics 31(3)436ndash437 February 2015
36
REFERENCES
[SK11] Christof Strauch and Walter Kriha NoSQL databases Lecture Notes StuttgartMedia University February 2011
[SOdMVN12] Mikhail Shugay Intildeigo Ortiz de Mendiacutebil Joseacute L Vizmanos and Francisco JNovo Genomic hallmarks of genes involved in chromosomal translocations inhematological cancer PLoS Comput Biol 8(12)e1002797 12 2012
[The04] The ENCODE Project Consortium The ENCODE (ENCyclopedia Of DNA Ele-ments) Project Science (New York NY) 306(5696)636ndash40 October 2004
[TPS09] Cole Trapnell Lior Pachter and Steven L Salzberg TopHat discovering splicejunctions with RNA-Seq Bioinformatics (Oxford England) 25(9)1105ndash11 May2009
[TRG+12a] Cole Trapnell Adam Roberts Loyal Goff Geo Pertea Daehwan Kim David RKelley Harold Pimentel Steven L Salzberg John L Rinn and Lior Pachter Dif-ferential gene and transcript expression analysis of RNA-seq experiments withTopHat and Cufflinks Nature protocols 7(3)562ndash78 March 2012
[TRG+12b] Cole Trapnell Adam Roberts Loyal Goff Geo Pertea Daehwan Kim David RKelley Harold Pimentel Steven L Salzberg John L Rinn and Lior Pachter Dif-ferential gene and transcript expression analysis of RNA-seq experiments withTopHat and Cufflinks Nature protocols 7(3)562ndash78 March 2012
[WMM+11] Ying Wang Gaurang Mehta Rajiv Mayani Jingxi Lu Tade Souaiaia YanghoChen Andrew Clark Hee Jae Yoon Lin Wan Oleg V Evgrafov James AKnowles Ewa Deelman and Ting Chen RseqFlow workflows for RNA-Seq dataanalysis Bioinformatics (Oxford England) 27(18)2598ndash600 September 2011
[Wol13] Jochen B W Wolf Principles of transcriptome analysis and gene expressionquantification an rna-seq tutorial Molecular Ecology Resources 13(4)559ndash5722013
[ZW09] Mark Gerstein |amp Michael Snyder Zhong Wang Rna-seq a revolutionary tool fortranscriptomics Nature Reviews Genetics 1057ndash63 January 2009
37
REFERENCES
38
Appendix A
iRAP tools supported
A1 Mappers
Mapper Option name (mapper)TopHat 1 tophat1TopHat 2 tophat2SMALT smaltGSNAP gsnapSOAPsplice soapspliceBWA bwa1BWA bwa2Bowtie 1 bowtie1Bowtie2 bowtie2GEM gemSTAR starOSA osaMapSplice mapsplice
A2 Quantification
Quantifier Option name (quant_method)FluxCapacitor flux_capHT-Seq (union mode) htseq1HT-Seq (intersection non-empty mode) htseq2Cufflinks 1 (try to find novel transcripts-g) cufflinks1Cufflinks 2 (try to find novel transcripts-g) cufflinks2Cufflinks 1 (do not assemble novel transcripts-G) cufflinks1_ndCufflinks 2 (do not assemble novel transcripts-G) cufflinks2_ndNURD nurd
39
iRAP tools supported
A3 Differential expression [DE]
Method Option name (de_method)DESeq deseqDESeq2 deseq2EdgeR edgerCuffdiff 1 cuffdiff1Cuffdiff 2 cuffdiff2
A4 Gene set enrichment analysis [GSE]
Tool Option name (gse_tool)Piano piano
40
Appendix B
iRAP model of configuration file
1 This is a comment (lines that start with a are ignored by iRAP)
2 =============================================================================
3 name that you want to give to the experiment (no spaces)
4 All files produced by irap will be placed in a folder with the given name
5 name=myexp
6
7
8 =============================================================================
9 name of the species
10 species=homo_sapiens
11
12 =============================================================================
13 Fasta file with the reference genome
14 reference=Homo_sapiensGRCh3766dnafa
15
16 =============================================================================
17 GTF file with the annotations
18 gtf_file=Homo_sapiensGRCh3766gtf
19
20 =============================================================================
21 IRAP options (may be providedoverriden in the command line)
22
23
24 Mapper
25 mapper=
26
27
28 Quantification method
29 quant_method=
30
31
32 Dif expression method
33 Requires contrasts to be defined (see below)
41
iRAP model of configuration file
34 de_method=
35
36
37 Gene set enrichment (GSE) analysis
38 Requires de_method to be defined
39 Tool to use (none|piano)
40 gse_tool=piano
41
42 gse_method (mean|median|sum|fisher|fisher-exact|stouffer|tailStrength|wilcoxon|
reporter|page) see Piano vignete documentation for more details
43 gse_method=fisher
44 gse_pvalue=005
45 Minimum number of genes in a gene set
46 gse_minsize=3
47
48
49
50 TSV file with gene annotation
51 Format IDNamelocussourcelnameGOGOtermKEGG
52 Description
53 ID=gene_id (this is mandatory and should match the one given in the gtf file)
54 Name=gene name
55 locus=chrstart--end
56 source=biotype
57 lname=gene name
58 GO=go ids (multiple values can be separated by)
59 GO=GO terms (multiple values can be separated by)
60 KEGG=Kegg ids (multiple values can be separated by)
61 If auto is defined then iRAP will try to generate the file
62 - this may take a considerable amount of time and will only work
63 for a reduced number of species
64 off - default value
65 annot_tsv=
66
67
68 QC
69 Check data (reads) quality (on|off|none)
70 on - reads are filtered out based on their quality
71 off - the quality of the reads is assessed but no filtering is done
72 none- no quality control is performed
73 qual_filtering=on
74
75 Trim all reads to the minimum read size after quality trimming - Yes (y)| No (n)
76 only applicable if qual_filtering is on
77 trim_reads=y
78
79 Minimum base quality accepted (def 10)
80 min_read_quality=10
81
42
iRAP model of configuration file
82 Contamination check (cont_index parameter) Reads that likely
83 originate from organisms other than the one under study can be
84 discarded during pre-processment of the reads This is done by
85 aligning the reads to the genomes of organisms that might be a
86 source of contamination and discard those that map with a high
87 degree of fidelity By default iRAP will check if the data is
88 contaminated by e-coli An example to create a contamination
89 database is provided in the examplesex_add2contaminationDBsh
90 script The value of the parameter should be the file name prefix of
91 the bowtie index files
92
93 Disable contamination check
94 cont_index=no
95 Default value
96 cont_index=$(data_dir)contaminatione_coli
97
98
99 Misc options
100
101 Number of threads that may be used by IRAP
102 max_threads=1
103
104 Exon level quantification Yes (y)| No (n)
105 exon_quant=y
106
107 Transcript level quantification Yes (y)| No (n)
108 transcript_quant=y
109 =============================================================================
110 full or relative path to the directory where all the data can be found
111 data_dir=data
112
113 the directory should be organized as follows (see directory data in IRAP toplevel
directory)
114
115 $data_dir
116 $data_dir
117 contamination
118 e_coli1ebwt
119 e_coli2ebwt
120 e_coli3ebwt
121 e_coli4ebwt
122 e_coliREADME
123 e_colirev1ebwt
124 e_colirev2eb
125 raw_data
126 $species
127 fastq
128 fastq
129
43
iRAP model of configuration file
130 reference
131 $species
132 $gtf_file
133 $reference
134
135 Notes
136 1) $ denotes the value defined for the variable
137 2) Since version 050 the raw data (fastqbam) files may be
138 distributed across several sub-folders
139
140
141 =============================================================================
142 Only necessary if you intend to perform Differential Expression analysis
143
144 contrasts=contrast_def [contrast_def ]
145 contrasts=purpleVsPink purpleVsGrey
146
147 definition of each constrast
148 contrast= group group [ group ]
149 purlpleVsPink=Purple Pink
150 purlpleVsGrey=Purple Grey
151
152 groups
153 GroupName= Library_name [Library_name ]
154 Purlple=myLib1 myLib2
155 Pink=myLib3
156 Grey=myLib4
157
158 optional parameter used in the report (HTML) generation
159 groups=Purple Pink Grey
160
161 technical replicates
162 technicalreplicates=myLib1myLib2myLib3mylib4
163
164 Note names of groups contrasts and libraries should start with a letter and
contain only alphanumeric characters and the character _
165
166 =============================================================================
167 Data
168
169
170 Information for each library
171 LibName=Fastq file
172 Note
173 1 LibName should start with a letter and contain only alphanumeric characters
and the character _ LibName should not contain in _1 or _2
174 2 LibName should be different from the name of the fastq file for instance
175 f1=f1fastq
176 will produce an error
44
iRAP model of configuration file
177
178 Single-end
179 myLib1=f1fastq
180 read size
181 myLib1_rs=75
182 quality encoding (33 or 64)
183 myLib1_qual=33
184
185 strand specific protocol
186 mylib1_strand=first
187 mylib1_strand=second
188 Default value is both (strands)
189 mylib1_strand=both
190
191 Have the file in a different sub-folder
192 mylib1_dir=somesubfolder
193
194 See SAMBAM specification for more details about the following two parameters
195 read group id (to be included in the BAM file) - this is not supported by all
mappers
196 myLib1_rgid=
197 sambam header lines to include in the BAM file
198 myLib1_shl=COtThis is a commentnCOtand another line
199
200 LibName=Fastq file
201 myLib2=f2fastq
202 read size
203 myLib2_rs=75
204 quality encoding (33 or 64)
205 myLib2_qual=33
206
207
208 Paired-end
209 LibName=Fastq files
210 myLib3=f3_1fastq f3_2fastq
211 read size
212 myLib3_rs=50
213 quality encoding (33 or 64)
214 myLib3_qual=33
215 insert size
216 myLib3_ins=350
217 standard deviation
218 myLib3_sd=60
219
220 LibName=Fastq files
221 myLib4=f4_1fastq f4_2fastq
222 read size
223 myLib4_rs=50
224 quality encoding (33 or 64)
45
iRAP model of configuration file
225 myLib4_qual=33
226 insert size
227 myLib4_ins=350
228 standard deviation
229 myLib4_sd=60
230
231
232
233
234 list the names of your single-end (se) and paired (pe) libraries
235 se=myLib1 myLib2
236 pe=myLib3 myLib4
237 No SE data
238 se=
239 No PE data
240 pe=
241
242
243
244 Passingoverriding parameters
245
246 It is possible to pass parameters to the mappers and quantification
247 methods but that should be done carefully since it may break the
248 pipeline (if the location of the input andor output files is
249 changed)
250
251 Overridingchanging the mappersrsquo parameters
252 _map_options=options
253 Example
254 tophat2_map_options=--min-intron-length 5 --no-coverage-search
255
256 Overridingchanging the parameters of the quantification methods
257 _params=options
258 Example
259 htseq_params= -q
46
Appendix C
iRAP example configuration file
1 minimal configuration file for DE
2 experiment name
3 name=ecoli_ex
4 species
5 species=ecoli_k12
6 reference genome
7 reference=Escherichia_coli_str_k_12_substr_mg1655GCA_000005845119dnatoplevel
fagz
8 gtf file
9 gtf_file=Escherichia_coli_str_k_12_substr_mg1655GCA_000005845119gtfgz
10 Enable filtering based on quality
11 qual_filtering=on
12 Use a contamination data set to filter out reads
13 cont_index=no
14 Toplevel directory with the data
15 data_dir=
16
17 some contrasts
18 GA=Group A
19 contrasts=GAvsGB GBvsGA
20 GAvsGB=GA GB
21 GBvsGA=GB GA
22 GA=FA FB FC
23 GB=FD FE FF
24
25 se=FA FB FC FD FE FF
26
27 FA=SRR933983fastqgz
28 FA_rs=50
29 FA_qual=33
30
31 FB=SRR933984fastqgz
32 FB_rs=50
47
iRAP example configuration file
33 FB_qual=33
34
35 FC=SRR933985fastqgz
36 FC_rs=50
37 FC_qual=33
38
39 FD=SRR933989fastqgz
40 FD_rs=50
41 FD_qual=33
42
43 FE=SRR933990fastqgz
44 FE_rs=50
45 FE_qual=33
46
47 FF=SRR933990fastqgz
48 FF_rs=50
49 FF_qual=33
50 EOF
48
- Front Page
- Table of Contents
- List of Figures
- List of Tables
- 1 Introduction
-
- 11 Context
- 12 Motivation and Goals
- 13 Proposed Solution
- 14 Structure of the Dissertation
-
- 2 Basic Concepts and Bibliographic Review
-
- 21 Biological Basic Concepts
-
- 211 Genome
- 212 Transcriptome Assembly and Gene expression
-
- 22 RNA-Seq Analysis
-
- 221 RNA-Seq microarrays and DNA sequencing
- 222 RNA-Seq Pipeline
-
- 23 Standard File Formats used
-
- 231 FASTA
- 232 FASTQ
- 233 SAM and BAM
- 234 GFF and GTF
-
- 24 Relevant Data Repositories
- 25 Tools for RNA-seq and Differential Analysis
- 26 Relational and Non-relational Databases
- 27 Tecnologies
- 28 Related Work
- 29 Chapter Summary
-
- 3 The Gemini framework
-
- 31 Gemini
- 32 Gemini Architecture
-
- 321 Physical Architecture
-
- 33 Data Management
- 34 Web Interface
- 35 Use cases
- 36 Case studies
-
- 361 Full pipeline
- 362 Stage pipeline
-
- 37 Chapter Summary
-
- 4 Case study
-
- 41 Samples characterization
- 42 Researching objectives
- 43 Protocol of analysis
- 44 Genome version GRCh37 versus GRCh38
- 45 Fusion genes
- 46 Results
-
- 461 Case study with reference genome GRCh37
- 462 Splicing analysis
- 463 Case study with reference genome GRCh38
-
- 47 Chapter Summary
-
- 5 Conclusions and Future Work
- References
- A iRAP tools supported
-
- A1 Mappers
- A2 Quantification
- A3 Differential expression [DE]
- A4 Gene set enrichment analysis [GSE]
-
- B iRAP model of configuration file
- C iRAP example configuration file
-
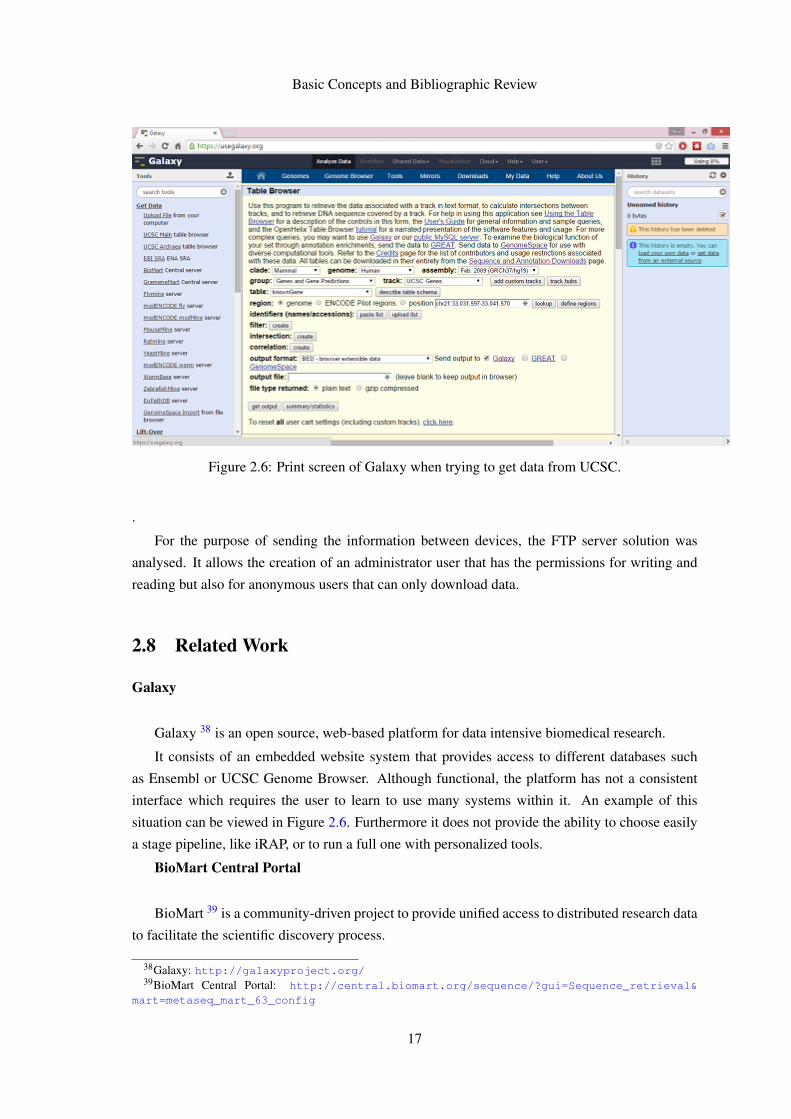
The Gemini framework
that includes a Graphical User Interface and makes RNA-Seq studies much more easy to perform
We have also included extra features for doing more analysis to RNA-Seq data
31 Gemini
Due to the lack of intuitiveness on the process of generating the configuration file it has been
created a more user friendly one through a web form This form asks for input of the main settings
to call a very simple experiment with a commonly used bacteria escherichia ecoli (e coli)
Another important feature is the possibility to fill the form asking what is the stage that the user
wants the pipeline to start with
Another issue was to find and easily download a reference genome for a certain species In
order to add completeness to Gemini and also to simplify the process of download it has been
implemented the functionality to download the reference genome (both fasta and annotation files)
It is used the Ensembl API to obtain the required results The jobs status feature lists the status of
jobs sent by the user for execution
Besides these features one more have been added even though not completed It is the job
results where it is presented the results collected for a determined task
32 Gemini Architecture
321 Physical Architecture
Gemini is divided into two different sets The first one is where the web application is hosted as
well as the database Since dealing with genomic data often requires great computer performance
processing experiments is accomplished in an independent server that later responds with results
Figure 31 Physical architecture of Gemini
Data scheme
MongoDB is NoSQL document based database The information is organized in collections
in which each element is stored as a JSON document NoSQL databases are simpler to use when it
20
The Gemini framework
comes to have different information fields in the same document and at the same time they have
better performance and scalability [SK11] Currently the information is arranjed in two collections
scheme as described on Table 31
Name DescriptionAccounts Stores the users dataJobs Stores the experiments dataTable 31 Collections used to store data
Accounts
An accountrsquos document stores an userrsquos email password and a unique identifier A role has
also been saved for future hierarchy creation in which some levels will grant more permissions
than others like changing accounts settings of other participants
1
2 _id ObjectId(54f5a9b234f76511a82ec3b2)
3 password e10adc3949ba59abbe56e057f20f883e
4 role user
5 email acgggomesgmailcom
6
Jobs
Jobs are related to an user and have the name and description of the experiment It also
stores the reference genomersquos location as well as the readsrsquo one Likewise the date of creation is
preserved When a job is completed the status is modified to finished
1
2 _id ObjectId(5544ecf134f7651d687bba94)
3 name ExpFinal
4 exp_dir data54f5a9b234f76511a82ec3b2ExpFinalreads
5 user 54f5a9b234f76511a82ec3b2
6 description Final test
7 genome_dir genomesEscherichia coli
8 status started
9 date ISODate(2015-05-02T152745249Z)
10
21
The Gemini framework
33 Data Management
In order to create a new job it is required two sets of data namely reference files and raw data
files The raw data is the actual data being analysed while the reference genome serves as basis to
the alignment or control
The typical workflow consists on the expert providing the experience and species names as
well as the raw data that was previously collected in the laboratory Afterwards through a step by
step system the user has the option to choose the reference genome to be used on the experiment
This last files are internally obtained from different FTP servers such as Ensembl and ENCODE
stored locally and reused in further usages
The provided information is then saved in the database and the files stored hierarchically We
use the following sequence of ltsection namegt ltuseridgt ltexperience namegt ltdata filesgt The
ltsection namegt can be conf for storing configuration files data for saving the reads or refer-
ence for keeping the reference genome and annotation files The ltuseridgt is the ID of Accounts
database document and the ltexperience namegt is the same as name in Jobs database document
A directory tree is represented in Figure 32
Figure 32 File system tree demonstrating the hierarchy of saved data files
This information is then passed to the server via a local FTP server that has been created
22
The Gemini framework
for this purpose We have followed an online tutorial 1 for the configuration From this we
created one administrator that has permissions for writing and reading files and we also authorized
anonymous login that may only retrieve files This way on the web application the admin user
creates the reads reference genomes annotation and configuration files On the computational
server an anonymous user authenticates for retrieving the files according to the filenames received
via API
The inside directory of FTP follows the hierarchy of ltuseridgt ltexperience namegt ltdata
filesgt where ltuseridgt is the ID on the Accounts document and ltexperience namegt is the name
on Jobs document When the server is prompted to run an experience it downloads the required
data from the FTP and runs iRAP with the necessary configuration options
34 Web Interface
For the implementation of Gemini python has been used for backend along with a simple fast and
lightweight WSGI micro web-framework called BottlePy 2 It has no dependencies and grants the
main functionalities such as routing templates some class utilities and a built-in server
The first screenshot (Figure 33) shows the home page of Gemini There is top menu bar with
two possible interactions login and register There is also a simple content box that describes the
main features and status of development of the platform Later on a new menu appears with the
possibility to logout on the Welcome tab (as in Figure 34)
Figure 33 Home page
Figure 34 Logout menu
1Tutorial available at httpswwwthomas-krenncomenwikiSetup_FTP_Server_under_Debian
2BottlePy httpbottlepyorgdocsdevindexhtml
23
The Gemini framework
The main feature of the system is the create job (Figure 35) option that is easily accessible on
top menu When the user clicks on it a form is displayed with the variables to introduce on the
configuration file that iRAP needs A description option has been added to provide the freedom to
the researcher to include some extra information that he finds useful
Figure 35 Create job form
The same type of form was used for the reference genomes section (Figure 36) The user is
prompted to choose orderly the species name release number and version Afterwards a table of
elements appears allowing the expert to download the files found
Figure 36 Reference genomes component
24
The Gemini framework
35 Use cases
Gemini was designed to have only one actor the user that will accomplish the experiments This
actor has the possibility to register login and logout of his account create a job and the hability
to download a reference genome of his choice Even though not fully implemented it has been
considered the jobs done functionality
Figure 37 Use cases diagram
36 Case studies
Some case studies with e coli in order to test iRAPrsquos installation and its capabilities For both
of the case studies it has been collected six samples of Escherichia coli reads from European
Nucleotide Archive 3 and the corresponding reference genome and annotation file from Ensembl
361 Full pipeline
In order to call the full pipeline iRAP has been tested with the directive irap conf=ecoli_exconf
Configuration file (ecoli_exconf ) content is as described in Appendix C In this task the system
received the reads and performed the quality control (QC) mapping quantification and differential
expression between the two groups of samples
3ENA httpwwwebiacukena
25
The Gemini framework
This test has been accomplished successfully
362 Stage pipeline
The stage pipeline is a powerful functionality since it allows the user to choose a specific stage of
the pipeline that he wants to execute for his samples
Besides the fact that it is not easy to collect data samples users often want to repeat or analyse
just one step of the pipeline and take some conclusions of it Furthermore this type of pipeline is
less time consuming
A concrete usage example is IPATIMUPrsquos data which contains the output information of the
mapper TopHat and will be further analysed in detail in Chapter 4 Concerning this setup it would
not be possible to call the full pipeline but instead it would require a command specific command
option
For validation purposes the same bacteria from the previous analysis has been used for the
stage pipeline case After calling the setup command to check input the directive irap conf=
ecoli_exconf quality_filtering_and_reporting has been used to perform the stage1
of iRAP The platform was able to perform with success this task
37 Chapter Summary
It has been used Python with BottlePy for the main implementation of the interface of Gemini
MongoDB has been chosen for dealing with information A FTP server was mounted for the
transitions of data between the client and the server The platform allows the expert to call a full or
stage pipeline analysis and provides the download of both fast and annotation files The essential
items are setup for the addition of further functionalities
26
Chapter 4
Case study
In this chapter it is going to be presented the Case Study with data from samples of thyroid carci-
noma along with their charactering and researching results
After the development of an interface to the iRAP tool the following step was to do a case
study with some realistic DNA samples of thyroid cancer patients regarding the partnership with
IPATIMUPrsquos researchers
The purpose of this case study was to do some research of potential differences between dis-
tinct types of the disease In order to accomplish this four samples were collected from Centro
Hospitalar de Satildeo Joatildeo (Porto) Cases 1 and 2 have been categorized as a widely invasive Fol-
licular Thyroid Carcinoma (wFTC) and cases 3 and 4 as a minimally invasive Follicular Thyroid
Carcinoma (mFTC)
41 Samples characterization
Patient from case 1 was female with 82 years old the tumour measuring 2 cm of size and presented
a predominant follicular growth pattern and oncocytic features Patient from case 2 was male with
55 years old the tumour measuring 5 cm of size and presented a predominant solidtrabecular
growth pattern For the group of mFTC patient from case 3 was female 56 years old the tumour
measuring 37 cm of size and with follicular growth pattern patient from case 4 was female 56
years old the tumour measuring 4 cm of size and with follicular growth pattern
42 Researching objectives
The aim of the study was to answer the following questions
bull Differentially expressed genes
bull Total isoforms found either in percentange and in absolute
27
Case study
bull Average of alternative isoforms for each gene spliced
bull Potentially novel isoforms and how do they behave between samplesgroups of samples
bull Compare results between versions of human genome assembly
bull Retrieve fusion genes
43 Protocol of analysis
Collected sample reads have been aligned against reference genome GRCh37 with TopHat version
141 Posterior analysis followed Tuxedo Protocol as described in Trapnell et al [TRG+12b] An
overview of the full protocol can be found in Figure 41
For the implementation of this procedure it were considered as two different groups the cases
1 and 2 (wFTC) against cases 3 and 4 (mFTC) The following step was to assemble transcripts for
each sample with Cufflinks 1 and afterwards create a single merged transcriptome annotation with
Cuffmerge 2 Cuffdiff 3 was then used to find significant changes in transcript expression
In order to find potential isoforms each sample was ran against the reference genome with
Cuffcompare 4
44 Genome version GRCh37 versus GRCh38
Even though IPATIMUPrsquos data have been assembled with reference genome version GRCh37
nowadays a more recent version (GRCh38) has been released in 2013 This new assembly is the
first major revision of the human genome in more than four years 5
The main differences between this two versions are
Alternate sequences several human chromosomal regions have sufficient variability to prevent
adequate representation by a single sequence This new version provides alternate sequence
for selected variant regions through the inclusion of alternate loci 6 scaffolds
Centromere 7 representation Previous method of representing centromeric regions have been
replaced by sequences from centromere models The models provide the approximate repeat
number and order for each centromere and are useful for read mapping and variation studies
Mitochondrial genome The new mitochondrial reference sequence is the Revised Cambridge
Reference Sequence with RefSeq accession number NC_0129201 The previous one was
RefSeq accession number NC_001907 which was not updated when GRCh37 assembly
later transitioned to the new version1Cufflinks httpcole-trapnell-labgithubiocufflinks2Cuffmerge httpcole-trapnell-labgithubiocufflinkscuffmergeindexhtml3Cuffdiff httpcole-trapnell-labgithubiocufflinkscuffdiffindexhtml4Cuffcompare httpcole-trapnell-labgithubiocufflinkscuffcompareindexhtml5As in UCSC mailing list at httpsgroupsgooglecomasoeucsceduforumtopic
genome-announce52Kv41YBXNY6Specific location of a gene on a chromosome
28
Case study
Figure 41 An overview of the Tuxedo Protocol with full steps TopHat for alignment Cufflinkspackage to find differential features between group samples and in the end CummeRbund to plotprevious results
Sequence updates Several erroneous bases and misassembled regions have been corrected and
more than 100 gaps have been filled or reduced
Analysis set The new assembly offers an analysis set that was created to accommodate next
generation sequencing read alignment pipelines Several GRCh38 regions have been elimi-
nated from this set to improve read mapping
29
Case study
45 Fusion genes
After we done some research on the technologies used for finding fusion genes in the reads we
have not been able to perform the analysis to answer the last question of our researching objectives
DeFuse required as input the original reads which were not provided This analysis would have
been interesting for relating the ocurrence of thyroid and the presence of fusion genes as well as if
there was any relevant difference between the samples of wFTC and mFTC
46 Results
461 Case study with reference genome GRCh37
The following table ( 41) demonstrates some genes that were differentially expressed with signif-
icance between mFTC and wFTC According to Celestino et al 8 CRABP1 C1QL1 and LCN2
are biomarkers of thyroid cancer and predictors of extrathyroidal extension It is commonly used
the value of 005 has threshold above which the differential expression is significant By inspect-
ing out the table we can find C1QL1 with a q-value of 0000555 and CRABP1 with a q-value
of 159E-11 which are in concordance with the previous article Furthermore it is verified the
increased gene expression in wFTC when compared to mFTC
Gene ID Gene Chr mFTC wFTC Fold change(log2) Q value
ENSG00000167748 KLK1 19 018672 111924 922742 0ENSG00000104725 NEFL 8 00196645 276961 104599 0ENSG00000174145 KIAA1239 4 00307388 144265 887444 0ENSG00000182379 NXPH4 12 008307 195786 788074 0ENSG00000131094 C1QL1 17 0121453 238957 429828 0000555ENSG00000142677 IL22RAI 1 150905 0384783 -529345 0ENSG00000138615 CILP 15 423569 0052726 -632793 241E-11ENSG00000141431 ASXL3 18 18938 001408 -707148 124E-09ENSG00000166426 CRABP1 15 748375 0367899 -766831 159E-11ENSG00000214145 LINC00887 3 19797 0119327 -737421 0000459
Table 41 Genes differentially expressed between minimally invasive follicular thryoid carcino-mas (mFTCs) and widely invasive follicular thyroid carcinomas (wFTCs)
In response to the previous researching objectives the Table 42 has the statistical results for
taks two and three From the data analysis we could conclude that less than 1 of genes have
isoforms but each one has an average of 389 alternatives
8Ricardo Celestino Torfin Nome Ana Pestana Andreas M Hoff Pedro A Gonccedilalves Catarina Eloy Eva SigstadRagnhild A Lothe Trine Bjoslashro Manuel Sobrinho-Simotildees Rofl I Skotheim Paula Soares CRAPBP1 C1QL1 andLCN2 are biomarkers of thyroid cancer and predictors of extrathyroidal extension subbmited for publication
30
Case study
Total genes 63896Total significant isoforms 689Total unique genes with isoforms 179Ratio of unique genes with isoformsgenes () 028Average of alternatives per gene with isoforms 389
Table 42 Statistical results for researching objectives number 2 and 3
462 Splicing analysis
Forward in the analysis Cuffcompare 9 has been used to search for novel isoforms when com-
pared to the reference genome The method was to compare each sample to the reference genome
and afterwards make an overlap of the results The main objective was then to infer about the
differences among wFTC and mFTC
Sample 1(wFTC)
Sample 2(wFTC)
Sample 3(mFTC)
Sample 4(mFTC)
Total genes 30440 36862 35539 37534Potential novel isoforms 7406 8450 8781 8830Table 43 Potential novel isoforms for each sample of IPATIMUPrsquos data
As demonstrated on Table 43 average there is a percentage of 24 of potentially novel iso-
forms found (at least one spliced junction is shared with a reference transcript) There is been
made an overlap of the results in order to encounter differences between wFTC and mFTC The
Table 44 presents the counting of differences between cases A brief analysis allows us to say
that we can not make any relationship between wFTC and mFTC On average there was a total of
3722 changes among this two sets The average within the sets are 3554 for wFTC and 3992 for
mFTC Given this results there was not a significant divergence to allow us to relate the splicing
and the occurrence of a more invasive Thyroid Carcinoma
Sets ChangesS1 S2 3554S1 S3 3609S1 S4 3612S2 S3 3847S2 S4 3820S3 S4 3929
Table 44 Number of differences between samples Syntax used S1 - Sample 1 S2 - Sample 2S3 - Sample 3 and S4 - Sample 4
9Cuffcompare httpcole-trapnell-labgithubiocufflinkscuffcompareindexhtml
31
Case study
463 Case study with reference genome GRCh38
In order to respond to the last research objective it has been applied the method of analysis has
before with a more recent human genome assembly After using the same protocol with Cufflinks
Cuffmerge and Cuffdiff sequentially we have come to some conclusions
The produced results of differential expression analysis for the same genes were very different
Genes that were highly significant before like C1QL1 and CRABP1 now had no relevance (q-
value gt 005) As mentioned before we had only access to TopHatrsquos output that used version
GRCh37 for the alignment and mapping process so we could not start from scratch the analysis
This outcome demonstrates two topics in particular
1 the introduction of novel annotations can make previous analysis outdated
2 there is the need to save the original reads in order to update earlier studies
The solution to this situation would have been to use the original reads to repeat the assembly
and then follow the Tuxedo protocol to collected correct and updated differential expression data
47 Chapter Summary
These section of development has been introduced in order to confer not only validation but also
to do some researching studies on the subject Four samples were collected and divided into two
distinct groups Tuxedo protocol was followed for responding to the research objectives The
case study for GRCh37 demonstrated the expression of C1QL1 and CRABP1 on wFTC when
compared to mFTC as indicated in the referred article On the other hand the same protocol when
applied with GRCh38 demonstrated the importance of saving the original reads and what is the
influence of newer releases in previous researching results Lastly the splicing analysis results did
not show any evidence of related isoforms count and the manifestation of the different stages of
the disease
32
Chapter 5
Conclusions and Future Work
The research of genomic-based cancers require highly complex data analysis Such analysis re-
quire most often the use of a large number of complex computational resources the gathering
of a lot of information over the Internet and the use of powerful computational resources Fur-
thermore the manipulation of the computational tools and resources require the assistance of an
informatics expert
The thesis work is a contribution towards the solution of the above mention problem We
propose and developed a framework that enables an expert biologist to perform genomic-based
complex analysis in a easy way and using the required powerful computational resources in a
transparent way
Using the developed framework we have used real data to address several research questions
provided by IPATIMUPrsquos researchers Firstly with the human genome GRCh37 we identified
two of the biomarkers of thyroid cancer by differential gene expression analysis Secondly we
found 689 significant isoforms 179 unique out of 63896 genes (ratio of 028) with an average
of 389 isoforms per gene Thirdly when trying to determine potential novel isoforms we came
at no conclusion of the differences of expression when comparing wFTC and mFTC The last
case was applying the Tuxedo protocol with the new GRCh38 on samples The outcome of the
experiment revealed the importance of saving the original reads and that newer releases become
previous analysis outdated
Future Work
This thesis work is just a starting point As stated before the framework was designed so it can be
extended with further modules to enable addressing other research questions
The case studies also showed us that RNA-seq analysis is very time consuming On the other
hand there are a lot of sub-tasks that can be run in parallel (like the task of aligning the reads)
33
Conclusions and Future Work
We will study and compare different techniques and opportunities to make RNA-seq in parallel as
much as possible
34
References
[bNE] Scitable by Nature Education Transcriptome available at httpwwwnaturecomscitabledefinitiontranscriptome-296 last accessJanuary 2015
[CAB+15] Fiona Cunningham M Ridwan Amode Daniel Barrell Kathryn Beal Konstanti-nos Billis Simon Brent Denise Carvalho-Silva Peter Clapham Guy CoatesStephen Fitzgerald Laurent Gil Carlos Garciacutea Giroacuten Leo Gordon ThibautHourlier Sarah E Hunt Sophie H Janacek Nathan Johnson Thomas Juette-mann Andreas K Kaumlhaumlri Stephen Keenan Fergal J Martin Thomas MaurelWilliam McLaren Daniel N Murphy Rishi Nag Bert Overduin Anne ParkerMateus Patricio Emily Perry Miguel Pignatelli Harpreet Singh Riat DanielSheppard Kieron Taylor Anja Thormann Alessandro Vullo Steven P WilderAmonida Zadissa Bronwen L Aken Ewan Birney Jennifer Harrow Rhoda Kin-sella Matthieu Muffato Magali Ruffier Stephen MJ Searle Giulietta SpudichStephen J Trevanion Andy Yates Daniel R Zerbino and Paul Flicek Ensembl2015 Nucleic Acids Research 43(D1)D662ndashD669 2015
[CFG+10] Peter J A Cock Christopher J Fields Naohisa Goto Michael L Heuer and Peter MRice The Sanger FASTQ file format for sequences with quality scores and theSolexaIllumina FASTQ variants Nucleic acids research 38(6)1767ndash71 April2010
[CH07] Geoffrey M Cooper and Robert E Hausman The Cell - A molecular approachAmerican Society for Microbiology 2007
[Cod70] E F Codd A relational model of data for large shared data banks Communica-tions of the ACM 13(6)377ndash387 June 1970
[Con11] The ENCODE Project Consortium A userrsquos guide to the encyclopedia of DNAelements (ENCODE) PLoS biology 9(4)e1001046 April 2011
[FMB14] N A Fonseca J A Marioni and A Brazma RNA-seq gene profiling - a system-atic empirical comparison Technical report May 2014
[FPMB14] Nuno A Fonseca Robert Petryszak John Marioni and Alvis Brazma irap - anintegrated rna-seq analysis pipeline bioRxiv 2014
[GCW+10] Qiang Gan Iouri Chepelev Gang Wei Lama Tarayrah Kairong Cui Keji Zhaoand Xin Chen Dynamic regulation of alternative splicing and chromatin structurein Drosophila gonads revealed by RNA-seq Cell research 20(7)763ndash83 July2010
35
REFERENCES
[GEN] GENIE Dna genes and chromossomes University of Leicesteravailable at httpwww2leacukdepartmentsgeneticsvgecschoolscollegestopicsdna-genes-chromosomes last access Jan-uary 2015
[Gri] Malachi Griffith Bioinformatics for Cancer Genomics (BiCG)available at httpbioinformaticscaworkshops2012bioinformatics-cancer-genomics-bicg last access January 2015
[GTBK11] Angela Goncalves Andrew Tikhonov Alvis Brazma and Misha Kapushesky Apipeline for RNA-seq data processing and quality assessment Bioinformatics (Ox-ford England) 27(6)867ndash9 March 2011
[HBB+02] T Hubbard D Barker E Birney G Cameron Y Chen L Clark T CoxJ Cuff V Curwen T Down R Durbin E Eyras J Gilbert M HammondL Huminiecki A Kasprzyk H Lehvaslaiho P Lijnzaad C Melsopp E Mon-gin R Pettett M Pocock S Potter A Rust E Schmidt S Searle G SlaterJ Smith W Spooner A Stabenau J Stalker E Stupka A Ureta-Vidal I Vastrikand M Clamp The ensembl genome database project Nucleic Acids Research30(1)38ndash41 2002
[HBD+13] R Hitzemann D Bottomly P Darakjian N Walter O Iancu R SearlesB Wilmot and S McWeeney Genes behavior and next-generation RNA se-quencing Genes Brain Behav 12(1)1ndash12 Feb 2013
[Ins] National Human Genome Research Institute Transcriptome available at httpwwwgenomegov13014330 last access January 2015
[Joh03] Jason M Johnson Genome-wide survey of human alternative pre-mrna splicingwith exon junction microarrays Science 3022141ndash2144 December 2003
[kn10] Gene set enrichment a problem of pathways Briefings in functional genomics9(5-6)385ndash90 December 2010
[kn11] Overview of available methods for diverse RNA-Seq data analyses Science ChinaLife sciences 54(12)1121ndash8 December 2011
[Lan10] Ben Langmead Aligning short sequencing reads with Bowtie Current proto-cols in bioinformatics editoral board Andreas D Baxevanis [et al] Chapter11Unit 117 December 2010
[LM10] Adam Lith and Jakob Mattsson Investigating storage solutions for large data - acomparison of well performing and scalable data storage solutions for real timeextraction and batch insertion of data Masterrsquos thesis 2010
[LTPS09] Ben Langmead Cole Trapnell Mihai Pop and Steven L Salzberg Ultrafastand memory-efficient alignment of short DNA sequences to the human genomeGenome biology 10(3)R25 January 2009
[ORY10] Alicia Oshlack Mark D Robinson and Matthew D Young From RNA-seq readsto differential expression results Genome biology 11(12)220 January 2010
[SG15] Marc W Schmid and Ueli Grossniklaus Rcount simple and flexible RNA-Seqread counting Bioinformatics 31(3)436ndash437 February 2015
36
REFERENCES
[SK11] Christof Strauch and Walter Kriha NoSQL databases Lecture Notes StuttgartMedia University February 2011
[SOdMVN12] Mikhail Shugay Intildeigo Ortiz de Mendiacutebil Joseacute L Vizmanos and Francisco JNovo Genomic hallmarks of genes involved in chromosomal translocations inhematological cancer PLoS Comput Biol 8(12)e1002797 12 2012
[The04] The ENCODE Project Consortium The ENCODE (ENCyclopedia Of DNA Ele-ments) Project Science (New York NY) 306(5696)636ndash40 October 2004
[TPS09] Cole Trapnell Lior Pachter and Steven L Salzberg TopHat discovering splicejunctions with RNA-Seq Bioinformatics (Oxford England) 25(9)1105ndash11 May2009
[TRG+12a] Cole Trapnell Adam Roberts Loyal Goff Geo Pertea Daehwan Kim David RKelley Harold Pimentel Steven L Salzberg John L Rinn and Lior Pachter Dif-ferential gene and transcript expression analysis of RNA-seq experiments withTopHat and Cufflinks Nature protocols 7(3)562ndash78 March 2012
[TRG+12b] Cole Trapnell Adam Roberts Loyal Goff Geo Pertea Daehwan Kim David RKelley Harold Pimentel Steven L Salzberg John L Rinn and Lior Pachter Dif-ferential gene and transcript expression analysis of RNA-seq experiments withTopHat and Cufflinks Nature protocols 7(3)562ndash78 March 2012
[WMM+11] Ying Wang Gaurang Mehta Rajiv Mayani Jingxi Lu Tade Souaiaia YanghoChen Andrew Clark Hee Jae Yoon Lin Wan Oleg V Evgrafov James AKnowles Ewa Deelman and Ting Chen RseqFlow workflows for RNA-Seq dataanalysis Bioinformatics (Oxford England) 27(18)2598ndash600 September 2011
[Wol13] Jochen B W Wolf Principles of transcriptome analysis and gene expressionquantification an rna-seq tutorial Molecular Ecology Resources 13(4)559ndash5722013
[ZW09] Mark Gerstein |amp Michael Snyder Zhong Wang Rna-seq a revolutionary tool fortranscriptomics Nature Reviews Genetics 1057ndash63 January 2009
37
REFERENCES
38
Appendix A
iRAP tools supported
A1 Mappers
Mapper Option name (mapper)TopHat 1 tophat1TopHat 2 tophat2SMALT smaltGSNAP gsnapSOAPsplice soapspliceBWA bwa1BWA bwa2Bowtie 1 bowtie1Bowtie2 bowtie2GEM gemSTAR starOSA osaMapSplice mapsplice
A2 Quantification
Quantifier Option name (quant_method)FluxCapacitor flux_capHT-Seq (union mode) htseq1HT-Seq (intersection non-empty mode) htseq2Cufflinks 1 (try to find novel transcripts-g) cufflinks1Cufflinks 2 (try to find novel transcripts-g) cufflinks2Cufflinks 1 (do not assemble novel transcripts-G) cufflinks1_ndCufflinks 2 (do not assemble novel transcripts-G) cufflinks2_ndNURD nurd
39
iRAP tools supported
A3 Differential expression [DE]
Method Option name (de_method)DESeq deseqDESeq2 deseq2EdgeR edgerCuffdiff 1 cuffdiff1Cuffdiff 2 cuffdiff2
A4 Gene set enrichment analysis [GSE]
Tool Option name (gse_tool)Piano piano
40
Appendix B
iRAP model of configuration file
1 This is a comment (lines that start with a are ignored by iRAP)
2 =============================================================================
3 name that you want to give to the experiment (no spaces)
4 All files produced by irap will be placed in a folder with the given name
5 name=myexp
6
7
8 =============================================================================
9 name of the species
10 species=homo_sapiens
11
12 =============================================================================
13 Fasta file with the reference genome
14 reference=Homo_sapiensGRCh3766dnafa
15
16 =============================================================================
17 GTF file with the annotations
18 gtf_file=Homo_sapiensGRCh3766gtf
19
20 =============================================================================
21 IRAP options (may be providedoverriden in the command line)
22
23
24 Mapper
25 mapper=
26
27
28 Quantification method
29 quant_method=
30
31
32 Dif expression method
33 Requires contrasts to be defined (see below)
41
iRAP model of configuration file
34 de_method=
35
36
37 Gene set enrichment (GSE) analysis
38 Requires de_method to be defined
39 Tool to use (none|piano)
40 gse_tool=piano
41
42 gse_method (mean|median|sum|fisher|fisher-exact|stouffer|tailStrength|wilcoxon|
reporter|page) see Piano vignete documentation for more details
43 gse_method=fisher
44 gse_pvalue=005
45 Minimum number of genes in a gene set
46 gse_minsize=3
47
48
49
50 TSV file with gene annotation
51 Format IDNamelocussourcelnameGOGOtermKEGG
52 Description
53 ID=gene_id (this is mandatory and should match the one given in the gtf file)
54 Name=gene name
55 locus=chrstart--end
56 source=biotype
57 lname=gene name
58 GO=go ids (multiple values can be separated by)
59 GO=GO terms (multiple values can be separated by)
60 KEGG=Kegg ids (multiple values can be separated by)
61 If auto is defined then iRAP will try to generate the file
62 - this may take a considerable amount of time and will only work
63 for a reduced number of species
64 off - default value
65 annot_tsv=
66
67
68 QC
69 Check data (reads) quality (on|off|none)
70 on - reads are filtered out based on their quality
71 off - the quality of the reads is assessed but no filtering is done
72 none- no quality control is performed
73 qual_filtering=on
74
75 Trim all reads to the minimum read size after quality trimming - Yes (y)| No (n)
76 only applicable if qual_filtering is on
77 trim_reads=y
78
79 Minimum base quality accepted (def 10)
80 min_read_quality=10
81
42
iRAP model of configuration file
82 Contamination check (cont_index parameter) Reads that likely
83 originate from organisms other than the one under study can be
84 discarded during pre-processment of the reads This is done by
85 aligning the reads to the genomes of organisms that might be a
86 source of contamination and discard those that map with a high
87 degree of fidelity By default iRAP will check if the data is
88 contaminated by e-coli An example to create a contamination
89 database is provided in the examplesex_add2contaminationDBsh
90 script The value of the parameter should be the file name prefix of
91 the bowtie index files
92
93 Disable contamination check
94 cont_index=no
95 Default value
96 cont_index=$(data_dir)contaminatione_coli
97
98
99 Misc options
100
101 Number of threads that may be used by IRAP
102 max_threads=1
103
104 Exon level quantification Yes (y)| No (n)
105 exon_quant=y
106
107 Transcript level quantification Yes (y)| No (n)
108 transcript_quant=y
109 =============================================================================
110 full or relative path to the directory where all the data can be found
111 data_dir=data
112
113 the directory should be organized as follows (see directory data in IRAP toplevel
directory)
114
115 $data_dir
116 $data_dir
117 contamination
118 e_coli1ebwt
119 e_coli2ebwt
120 e_coli3ebwt
121 e_coli4ebwt
122 e_coliREADME
123 e_colirev1ebwt
124 e_colirev2eb
125 raw_data
126 $species
127 fastq
128 fastq
129
43
iRAP model of configuration file
130 reference
131 $species
132 $gtf_file
133 $reference
134
135 Notes
136 1) $ denotes the value defined for the variable
137 2) Since version 050 the raw data (fastqbam) files may be
138 distributed across several sub-folders
139
140
141 =============================================================================
142 Only necessary if you intend to perform Differential Expression analysis
143
144 contrasts=contrast_def [contrast_def ]
145 contrasts=purpleVsPink purpleVsGrey
146
147 definition of each constrast
148 contrast= group group [ group ]
149 purlpleVsPink=Purple Pink
150 purlpleVsGrey=Purple Grey
151
152 groups
153 GroupName= Library_name [Library_name ]
154 Purlple=myLib1 myLib2
155 Pink=myLib3
156 Grey=myLib4
157
158 optional parameter used in the report (HTML) generation
159 groups=Purple Pink Grey
160
161 technical replicates
162 technicalreplicates=myLib1myLib2myLib3mylib4
163
164 Note names of groups contrasts and libraries should start with a letter and
contain only alphanumeric characters and the character _
165
166 =============================================================================
167 Data
168
169
170 Information for each library
171 LibName=Fastq file
172 Note
173 1 LibName should start with a letter and contain only alphanumeric characters
and the character _ LibName should not contain in _1 or _2
174 2 LibName should be different from the name of the fastq file for instance
175 f1=f1fastq
176 will produce an error
44
iRAP model of configuration file
177
178 Single-end
179 myLib1=f1fastq
180 read size
181 myLib1_rs=75
182 quality encoding (33 or 64)
183 myLib1_qual=33
184
185 strand specific protocol
186 mylib1_strand=first
187 mylib1_strand=second
188 Default value is both (strands)
189 mylib1_strand=both
190
191 Have the file in a different sub-folder
192 mylib1_dir=somesubfolder
193
194 See SAMBAM specification for more details about the following two parameters
195 read group id (to be included in the BAM file) - this is not supported by all
mappers
196 myLib1_rgid=
197 sambam header lines to include in the BAM file
198 myLib1_shl=COtThis is a commentnCOtand another line
199
200 LibName=Fastq file
201 myLib2=f2fastq
202 read size
203 myLib2_rs=75
204 quality encoding (33 or 64)
205 myLib2_qual=33
206
207
208 Paired-end
209 LibName=Fastq files
210 myLib3=f3_1fastq f3_2fastq
211 read size
212 myLib3_rs=50
213 quality encoding (33 or 64)
214 myLib3_qual=33
215 insert size
216 myLib3_ins=350
217 standard deviation
218 myLib3_sd=60
219
220 LibName=Fastq files
221 myLib4=f4_1fastq f4_2fastq
222 read size
223 myLib4_rs=50
224 quality encoding (33 or 64)
45
iRAP model of configuration file
225 myLib4_qual=33
226 insert size
227 myLib4_ins=350
228 standard deviation
229 myLib4_sd=60
230
231
232
233
234 list the names of your single-end (se) and paired (pe) libraries
235 se=myLib1 myLib2
236 pe=myLib3 myLib4
237 No SE data
238 se=
239 No PE data
240 pe=
241
242
243
244 Passingoverriding parameters
245
246 It is possible to pass parameters to the mappers and quantification
247 methods but that should be done carefully since it may break the
248 pipeline (if the location of the input andor output files is
249 changed)
250
251 Overridingchanging the mappersrsquo parameters
252 _map_options=options
253 Example
254 tophat2_map_options=--min-intron-length 5 --no-coverage-search
255
256 Overridingchanging the parameters of the quantification methods
257 _params=options
258 Example
259 htseq_params= -q
46
Appendix C
iRAP example configuration file
1 minimal configuration file for DE
2 experiment name
3 name=ecoli_ex
4 species
5 species=ecoli_k12
6 reference genome
7 reference=Escherichia_coli_str_k_12_substr_mg1655GCA_000005845119dnatoplevel
fagz
8 gtf file
9 gtf_file=Escherichia_coli_str_k_12_substr_mg1655GCA_000005845119gtfgz
10 Enable filtering based on quality
11 qual_filtering=on
12 Use a contamination data set to filter out reads
13 cont_index=no
14 Toplevel directory with the data
15 data_dir=
16
17 some contrasts
18 GA=Group A
19 contrasts=GAvsGB GBvsGA
20 GAvsGB=GA GB
21 GBvsGA=GB GA
22 GA=FA FB FC
23 GB=FD FE FF
24
25 se=FA FB FC FD FE FF
26
27 FA=SRR933983fastqgz
28 FA_rs=50
29 FA_qual=33
30
31 FB=SRR933984fastqgz
32 FB_rs=50
47
iRAP example configuration file
33 FB_qual=33
34
35 FC=SRR933985fastqgz
36 FC_rs=50
37 FC_qual=33
38
39 FD=SRR933989fastqgz
40 FD_rs=50
41 FD_qual=33
42
43 FE=SRR933990fastqgz
44 FE_rs=50
45 FE_qual=33
46
47 FF=SRR933990fastqgz
48 FF_rs=50
49 FF_qual=33
50 EOF
48
- Front Page
- Table of Contents
- List of Figures
- List of Tables
- 1 Introduction
-
- 11 Context
- 12 Motivation and Goals
- 13 Proposed Solution
- 14 Structure of the Dissertation
-
- 2 Basic Concepts and Bibliographic Review
-
- 21 Biological Basic Concepts
-
- 211 Genome
- 212 Transcriptome Assembly and Gene expression
-
- 22 RNA-Seq Analysis
-
- 221 RNA-Seq microarrays and DNA sequencing
- 222 RNA-Seq Pipeline
-
- 23 Standard File Formats used
-
- 231 FASTA
- 232 FASTQ
- 233 SAM and BAM
- 234 GFF and GTF
-
- 24 Relevant Data Repositories
- 25 Tools for RNA-seq and Differential Analysis
- 26 Relational and Non-relational Databases
- 27 Tecnologies
- 28 Related Work
- 29 Chapter Summary
-
- 3 The Gemini framework
-
- 31 Gemini
- 32 Gemini Architecture
-
- 321 Physical Architecture
-
- 33 Data Management
- 34 Web Interface
- 35 Use cases
- 36 Case studies
-
- 361 Full pipeline
- 362 Stage pipeline
-
- 37 Chapter Summary
-
- 4 Case study
-
- 41 Samples characterization
- 42 Researching objectives
- 43 Protocol of analysis
- 44 Genome version GRCh37 versus GRCh38
- 45 Fusion genes
- 46 Results
-
- 461 Case study with reference genome GRCh37
- 462 Splicing analysis
- 463 Case study with reference genome GRCh38
-
- 47 Chapter Summary
-
- 5 Conclusions and Future Work
- References
- A iRAP tools supported
-
- A1 Mappers
- A2 Quantification
- A3 Differential expression [DE]
- A4 Gene set enrichment analysis [GSE]
-
- B iRAP model of configuration file
- C iRAP example configuration file
-
The Gemini framework
33 Data Management
In order to create a new job it is required two sets of data namely reference files and raw data
files The raw data is the actual data being analysed while the reference genome serves as basis to
the alignment or control
The typical workflow consists on the expert providing the experience and species names as
well as the raw data that was previously collected in the laboratory Afterwards through a step by
step system the user has the option to choose the reference genome to be used on the experiment
This last files are internally obtained from different FTP servers such as Ensembl and ENCODE
stored locally and reused in further usages
The provided information is then saved in the database and the files stored hierarchically We
use the following sequence of ltsection namegt ltuseridgt ltexperience namegt ltdata filesgt The
ltsection namegt can be conf for storing configuration files data for saving the reads or refer-
ence for keeping the reference genome and annotation files The ltuseridgt is the ID of Accounts
database document and the ltexperience namegt is the same as name in Jobs database document
A directory tree is represented in Figure 32
Figure 32 File system tree demonstrating the hierarchy of saved data files
This information is then passed to the server via a local FTP server that has been created
22
The Gemini framework
for this purpose We have followed an online tutorial 1 for the configuration From this we
created one administrator that has permissions for writing and reading files and we also authorized
anonymous login that may only retrieve files This way on the web application the admin user
creates the reads reference genomes annotation and configuration files On the computational
server an anonymous user authenticates for retrieving the files according to the filenames received
via API
The inside directory of FTP follows the hierarchy of ltuseridgt ltexperience namegt ltdata
filesgt where ltuseridgt is the ID on the Accounts document and ltexperience namegt is the name
on Jobs document When the server is prompted to run an experience it downloads the required
data from the FTP and runs iRAP with the necessary configuration options
34 Web Interface
For the implementation of Gemini python has been used for backend along with a simple fast and
lightweight WSGI micro web-framework called BottlePy 2 It has no dependencies and grants the
main functionalities such as routing templates some class utilities and a built-in server
The first screenshot (Figure 33) shows the home page of Gemini There is top menu bar with
two possible interactions login and register There is also a simple content box that describes the
main features and status of development of the platform Later on a new menu appears with the
possibility to logout on the Welcome tab (as in Figure 34)
Figure 33 Home page
Figure 34 Logout menu
1Tutorial available at httpswwwthomas-krenncomenwikiSetup_FTP_Server_under_Debian
2BottlePy httpbottlepyorgdocsdevindexhtml
23
The Gemini framework
The main feature of the system is the create job (Figure 35) option that is easily accessible on
top menu When the user clicks on it a form is displayed with the variables to introduce on the
configuration file that iRAP needs A description option has been added to provide the freedom to
the researcher to include some extra information that he finds useful
Figure 35 Create job form
The same type of form was used for the reference genomes section (Figure 36) The user is
prompted to choose orderly the species name release number and version Afterwards a table of
elements appears allowing the expert to download the files found
Figure 36 Reference genomes component
24
The Gemini framework
35 Use cases
Gemini was designed to have only one actor the user that will accomplish the experiments This
actor has the possibility to register login and logout of his account create a job and the hability
to download a reference genome of his choice Even though not fully implemented it has been
considered the jobs done functionality
Figure 37 Use cases diagram
36 Case studies
Some case studies with e coli in order to test iRAPrsquos installation and its capabilities For both
of the case studies it has been collected six samples of Escherichia coli reads from European
Nucleotide Archive 3 and the corresponding reference genome and annotation file from Ensembl
361 Full pipeline
In order to call the full pipeline iRAP has been tested with the directive irap conf=ecoli_exconf
Configuration file (ecoli_exconf ) content is as described in Appendix C In this task the system
received the reads and performed the quality control (QC) mapping quantification and differential
expression between the two groups of samples
3ENA httpwwwebiacukena
25
The Gemini framework
This test has been accomplished successfully
362 Stage pipeline
The stage pipeline is a powerful functionality since it allows the user to choose a specific stage of
the pipeline that he wants to execute for his samples
Besides the fact that it is not easy to collect data samples users often want to repeat or analyse
just one step of the pipeline and take some conclusions of it Furthermore this type of pipeline is
less time consuming
A concrete usage example is IPATIMUPrsquos data which contains the output information of the
mapper TopHat and will be further analysed in detail in Chapter 4 Concerning this setup it would
not be possible to call the full pipeline but instead it would require a command specific command
option
For validation purposes the same bacteria from the previous analysis has been used for the
stage pipeline case After calling the setup command to check input the directive irap conf=
ecoli_exconf quality_filtering_and_reporting has been used to perform the stage1
of iRAP The platform was able to perform with success this task
37 Chapter Summary
It has been used Python with BottlePy for the main implementation of the interface of Gemini
MongoDB has been chosen for dealing with information A FTP server was mounted for the
transitions of data between the client and the server The platform allows the expert to call a full or
stage pipeline analysis and provides the download of both fast and annotation files The essential
items are setup for the addition of further functionalities
26
Chapter 4
Case study
In this chapter it is going to be presented the Case Study with data from samples of thyroid carci-
noma along with their charactering and researching results
After the development of an interface to the iRAP tool the following step was to do a case
study with some realistic DNA samples of thyroid cancer patients regarding the partnership with
IPATIMUPrsquos researchers
The purpose of this case study was to do some research of potential differences between dis-
tinct types of the disease In order to accomplish this four samples were collected from Centro
Hospitalar de Satildeo Joatildeo (Porto) Cases 1 and 2 have been categorized as a widely invasive Fol-
licular Thyroid Carcinoma (wFTC) and cases 3 and 4 as a minimally invasive Follicular Thyroid
Carcinoma (mFTC)
41 Samples characterization
Patient from case 1 was female with 82 years old the tumour measuring 2 cm of size and presented
a predominant follicular growth pattern and oncocytic features Patient from case 2 was male with
55 years old the tumour measuring 5 cm of size and presented a predominant solidtrabecular
growth pattern For the group of mFTC patient from case 3 was female 56 years old the tumour
measuring 37 cm of size and with follicular growth pattern patient from case 4 was female 56
years old the tumour measuring 4 cm of size and with follicular growth pattern
42 Researching objectives
The aim of the study was to answer the following questions
bull Differentially expressed genes
bull Total isoforms found either in percentange and in absolute
27
Case study
bull Average of alternative isoforms for each gene spliced
bull Potentially novel isoforms and how do they behave between samplesgroups of samples
bull Compare results between versions of human genome assembly
bull Retrieve fusion genes
43 Protocol of analysis
Collected sample reads have been aligned against reference genome GRCh37 with TopHat version
141 Posterior analysis followed Tuxedo Protocol as described in Trapnell et al [TRG+12b] An
overview of the full protocol can be found in Figure 41
For the implementation of this procedure it were considered as two different groups the cases
1 and 2 (wFTC) against cases 3 and 4 (mFTC) The following step was to assemble transcripts for
each sample with Cufflinks 1 and afterwards create a single merged transcriptome annotation with
Cuffmerge 2 Cuffdiff 3 was then used to find significant changes in transcript expression
In order to find potential isoforms each sample was ran against the reference genome with
Cuffcompare 4
44 Genome version GRCh37 versus GRCh38
Even though IPATIMUPrsquos data have been assembled with reference genome version GRCh37
nowadays a more recent version (GRCh38) has been released in 2013 This new assembly is the
first major revision of the human genome in more than four years 5
The main differences between this two versions are
Alternate sequences several human chromosomal regions have sufficient variability to prevent
adequate representation by a single sequence This new version provides alternate sequence
for selected variant regions through the inclusion of alternate loci 6 scaffolds
Centromere 7 representation Previous method of representing centromeric regions have been
replaced by sequences from centromere models The models provide the approximate repeat
number and order for each centromere and are useful for read mapping and variation studies
Mitochondrial genome The new mitochondrial reference sequence is the Revised Cambridge
Reference Sequence with RefSeq accession number NC_0129201 The previous one was
RefSeq accession number NC_001907 which was not updated when GRCh37 assembly
later transitioned to the new version1Cufflinks httpcole-trapnell-labgithubiocufflinks2Cuffmerge httpcole-trapnell-labgithubiocufflinkscuffmergeindexhtml3Cuffdiff httpcole-trapnell-labgithubiocufflinkscuffdiffindexhtml4Cuffcompare httpcole-trapnell-labgithubiocufflinkscuffcompareindexhtml5As in UCSC mailing list at httpsgroupsgooglecomasoeucsceduforumtopic
genome-announce52Kv41YBXNY6Specific location of a gene on a chromosome
28
Case study
Figure 41 An overview of the Tuxedo Protocol with full steps TopHat for alignment Cufflinkspackage to find differential features between group samples and in the end CummeRbund to plotprevious results
Sequence updates Several erroneous bases and misassembled regions have been corrected and
more than 100 gaps have been filled or reduced
Analysis set The new assembly offers an analysis set that was created to accommodate next
generation sequencing read alignment pipelines Several GRCh38 regions have been elimi-
nated from this set to improve read mapping
29
Case study
45 Fusion genes
After we done some research on the technologies used for finding fusion genes in the reads we
have not been able to perform the analysis to answer the last question of our researching objectives
DeFuse required as input the original reads which were not provided This analysis would have
been interesting for relating the ocurrence of thyroid and the presence of fusion genes as well as if
there was any relevant difference between the samples of wFTC and mFTC
46 Results
461 Case study with reference genome GRCh37
The following table ( 41) demonstrates some genes that were differentially expressed with signif-
icance between mFTC and wFTC According to Celestino et al 8 CRABP1 C1QL1 and LCN2
are biomarkers of thyroid cancer and predictors of extrathyroidal extension It is commonly used
the value of 005 has threshold above which the differential expression is significant By inspect-
ing out the table we can find C1QL1 with a q-value of 0000555 and CRABP1 with a q-value
of 159E-11 which are in concordance with the previous article Furthermore it is verified the
increased gene expression in wFTC when compared to mFTC
Gene ID Gene Chr mFTC wFTC Fold change(log2) Q value
ENSG00000167748 KLK1 19 018672 111924 922742 0ENSG00000104725 NEFL 8 00196645 276961 104599 0ENSG00000174145 KIAA1239 4 00307388 144265 887444 0ENSG00000182379 NXPH4 12 008307 195786 788074 0ENSG00000131094 C1QL1 17 0121453 238957 429828 0000555ENSG00000142677 IL22RAI 1 150905 0384783 -529345 0ENSG00000138615 CILP 15 423569 0052726 -632793 241E-11ENSG00000141431 ASXL3 18 18938 001408 -707148 124E-09ENSG00000166426 CRABP1 15 748375 0367899 -766831 159E-11ENSG00000214145 LINC00887 3 19797 0119327 -737421 0000459
Table 41 Genes differentially expressed between minimally invasive follicular thryoid carcino-mas (mFTCs) and widely invasive follicular thyroid carcinomas (wFTCs)
In response to the previous researching objectives the Table 42 has the statistical results for
taks two and three From the data analysis we could conclude that less than 1 of genes have
isoforms but each one has an average of 389 alternatives
8Ricardo Celestino Torfin Nome Ana Pestana Andreas M Hoff Pedro A Gonccedilalves Catarina Eloy Eva SigstadRagnhild A Lothe Trine Bjoslashro Manuel Sobrinho-Simotildees Rofl I Skotheim Paula Soares CRAPBP1 C1QL1 andLCN2 are biomarkers of thyroid cancer and predictors of extrathyroidal extension subbmited for publication
30
Case study
Total genes 63896Total significant isoforms 689Total unique genes with isoforms 179Ratio of unique genes with isoformsgenes () 028Average of alternatives per gene with isoforms 389
Table 42 Statistical results for researching objectives number 2 and 3
462 Splicing analysis
Forward in the analysis Cuffcompare 9 has been used to search for novel isoforms when com-
pared to the reference genome The method was to compare each sample to the reference genome
and afterwards make an overlap of the results The main objective was then to infer about the
differences among wFTC and mFTC
Sample 1(wFTC)
Sample 2(wFTC)
Sample 3(mFTC)
Sample 4(mFTC)
Total genes 30440 36862 35539 37534Potential novel isoforms 7406 8450 8781 8830Table 43 Potential novel isoforms for each sample of IPATIMUPrsquos data
As demonstrated on Table 43 average there is a percentage of 24 of potentially novel iso-
forms found (at least one spliced junction is shared with a reference transcript) There is been
made an overlap of the results in order to encounter differences between wFTC and mFTC The
Table 44 presents the counting of differences between cases A brief analysis allows us to say
that we can not make any relationship between wFTC and mFTC On average there was a total of
3722 changes among this two sets The average within the sets are 3554 for wFTC and 3992 for
mFTC Given this results there was not a significant divergence to allow us to relate the splicing
and the occurrence of a more invasive Thyroid Carcinoma
Sets ChangesS1 S2 3554S1 S3 3609S1 S4 3612S2 S3 3847S2 S4 3820S3 S4 3929
Table 44 Number of differences between samples Syntax used S1 - Sample 1 S2 - Sample 2S3 - Sample 3 and S4 - Sample 4
9Cuffcompare httpcole-trapnell-labgithubiocufflinkscuffcompareindexhtml
31
Case study
463 Case study with reference genome GRCh38
In order to respond to the last research objective it has been applied the method of analysis has
before with a more recent human genome assembly After using the same protocol with Cufflinks
Cuffmerge and Cuffdiff sequentially we have come to some conclusions
The produced results of differential expression analysis for the same genes were very different
Genes that were highly significant before like C1QL1 and CRABP1 now had no relevance (q-
value gt 005) As mentioned before we had only access to TopHatrsquos output that used version
GRCh37 for the alignment and mapping process so we could not start from scratch the analysis
This outcome demonstrates two topics in particular
1 the introduction of novel annotations can make previous analysis outdated
2 there is the need to save the original reads in order to update earlier studies
The solution to this situation would have been to use the original reads to repeat the assembly
and then follow the Tuxedo protocol to collected correct and updated differential expression data
47 Chapter Summary
These section of development has been introduced in order to confer not only validation but also
to do some researching studies on the subject Four samples were collected and divided into two
distinct groups Tuxedo protocol was followed for responding to the research objectives The
case study for GRCh37 demonstrated the expression of C1QL1 and CRABP1 on wFTC when
compared to mFTC as indicated in the referred article On the other hand the same protocol when
applied with GRCh38 demonstrated the importance of saving the original reads and what is the
influence of newer releases in previous researching results Lastly the splicing analysis results did
not show any evidence of related isoforms count and the manifestation of the different stages of
the disease
32
Chapter 5
Conclusions and Future Work
The research of genomic-based cancers require highly complex data analysis Such analysis re-
quire most often the use of a large number of complex computational resources the gathering
of a lot of information over the Internet and the use of powerful computational resources Fur-
thermore the manipulation of the computational tools and resources require the assistance of an
informatics expert
The thesis work is a contribution towards the solution of the above mention problem We
propose and developed a framework that enables an expert biologist to perform genomic-based
complex analysis in a easy way and using the required powerful computational resources in a
transparent way
Using the developed framework we have used real data to address several research questions
provided by IPATIMUPrsquos researchers Firstly with the human genome GRCh37 we identified
two of the biomarkers of thyroid cancer by differential gene expression analysis Secondly we
found 689 significant isoforms 179 unique out of 63896 genes (ratio of 028) with an average
of 389 isoforms per gene Thirdly when trying to determine potential novel isoforms we came
at no conclusion of the differences of expression when comparing wFTC and mFTC The last
case was applying the Tuxedo protocol with the new GRCh38 on samples The outcome of the
experiment revealed the importance of saving the original reads and that newer releases become
previous analysis outdated
Future Work
This thesis work is just a starting point As stated before the framework was designed so it can be
extended with further modules to enable addressing other research questions
The case studies also showed us that RNA-seq analysis is very time consuming On the other
hand there are a lot of sub-tasks that can be run in parallel (like the task of aligning the reads)
33
Conclusions and Future Work
We will study and compare different techniques and opportunities to make RNA-seq in parallel as
much as possible
34
References
[bNE] Scitable by Nature Education Transcriptome available at httpwwwnaturecomscitabledefinitiontranscriptome-296 last accessJanuary 2015
[CAB+15] Fiona Cunningham M Ridwan Amode Daniel Barrell Kathryn Beal Konstanti-nos Billis Simon Brent Denise Carvalho-Silva Peter Clapham Guy CoatesStephen Fitzgerald Laurent Gil Carlos Garciacutea Giroacuten Leo Gordon ThibautHourlier Sarah E Hunt Sophie H Janacek Nathan Johnson Thomas Juette-mann Andreas K Kaumlhaumlri Stephen Keenan Fergal J Martin Thomas MaurelWilliam McLaren Daniel N Murphy Rishi Nag Bert Overduin Anne ParkerMateus Patricio Emily Perry Miguel Pignatelli Harpreet Singh Riat DanielSheppard Kieron Taylor Anja Thormann Alessandro Vullo Steven P WilderAmonida Zadissa Bronwen L Aken Ewan Birney Jennifer Harrow Rhoda Kin-sella Matthieu Muffato Magali Ruffier Stephen MJ Searle Giulietta SpudichStephen J Trevanion Andy Yates Daniel R Zerbino and Paul Flicek Ensembl2015 Nucleic Acids Research 43(D1)D662ndashD669 2015
[CFG+10] Peter J A Cock Christopher J Fields Naohisa Goto Michael L Heuer and Peter MRice The Sanger FASTQ file format for sequences with quality scores and theSolexaIllumina FASTQ variants Nucleic acids research 38(6)1767ndash71 April2010
[CH07] Geoffrey M Cooper and Robert E Hausman The Cell - A molecular approachAmerican Society for Microbiology 2007
[Cod70] E F Codd A relational model of data for large shared data banks Communica-tions of the ACM 13(6)377ndash387 June 1970
[Con11] The ENCODE Project Consortium A userrsquos guide to the encyclopedia of DNAelements (ENCODE) PLoS biology 9(4)e1001046 April 2011
[FMB14] N A Fonseca J A Marioni and A Brazma RNA-seq gene profiling - a system-atic empirical comparison Technical report May 2014
[FPMB14] Nuno A Fonseca Robert Petryszak John Marioni and Alvis Brazma irap - anintegrated rna-seq analysis pipeline bioRxiv 2014
[GCW+10] Qiang Gan Iouri Chepelev Gang Wei Lama Tarayrah Kairong Cui Keji Zhaoand Xin Chen Dynamic regulation of alternative splicing and chromatin structurein Drosophila gonads revealed by RNA-seq Cell research 20(7)763ndash83 July2010
35
REFERENCES
[GEN] GENIE Dna genes and chromossomes University of Leicesteravailable at httpwww2leacukdepartmentsgeneticsvgecschoolscollegestopicsdna-genes-chromosomes last access Jan-uary 2015
[Gri] Malachi Griffith Bioinformatics for Cancer Genomics (BiCG)available at httpbioinformaticscaworkshops2012bioinformatics-cancer-genomics-bicg last access January 2015
[GTBK11] Angela Goncalves Andrew Tikhonov Alvis Brazma and Misha Kapushesky Apipeline for RNA-seq data processing and quality assessment Bioinformatics (Ox-ford England) 27(6)867ndash9 March 2011
[HBB+02] T Hubbard D Barker E Birney G Cameron Y Chen L Clark T CoxJ Cuff V Curwen T Down R Durbin E Eyras J Gilbert M HammondL Huminiecki A Kasprzyk H Lehvaslaiho P Lijnzaad C Melsopp E Mon-gin R Pettett M Pocock S Potter A Rust E Schmidt S Searle G SlaterJ Smith W Spooner A Stabenau J Stalker E Stupka A Ureta-Vidal I Vastrikand M Clamp The ensembl genome database project Nucleic Acids Research30(1)38ndash41 2002
[HBD+13] R Hitzemann D Bottomly P Darakjian N Walter O Iancu R SearlesB Wilmot and S McWeeney Genes behavior and next-generation RNA se-quencing Genes Brain Behav 12(1)1ndash12 Feb 2013
[Ins] National Human Genome Research Institute Transcriptome available at httpwwwgenomegov13014330 last access January 2015
[Joh03] Jason M Johnson Genome-wide survey of human alternative pre-mrna splicingwith exon junction microarrays Science 3022141ndash2144 December 2003
[kn10] Gene set enrichment a problem of pathways Briefings in functional genomics9(5-6)385ndash90 December 2010
[kn11] Overview of available methods for diverse RNA-Seq data analyses Science ChinaLife sciences 54(12)1121ndash8 December 2011
[Lan10] Ben Langmead Aligning short sequencing reads with Bowtie Current proto-cols in bioinformatics editoral board Andreas D Baxevanis [et al] Chapter11Unit 117 December 2010
[LM10] Adam Lith and Jakob Mattsson Investigating storage solutions for large data - acomparison of well performing and scalable data storage solutions for real timeextraction and batch insertion of data Masterrsquos thesis 2010
[LTPS09] Ben Langmead Cole Trapnell Mihai Pop and Steven L Salzberg Ultrafastand memory-efficient alignment of short DNA sequences to the human genomeGenome biology 10(3)R25 January 2009
[ORY10] Alicia Oshlack Mark D Robinson and Matthew D Young From RNA-seq readsto differential expression results Genome biology 11(12)220 January 2010
[SG15] Marc W Schmid and Ueli Grossniklaus Rcount simple and flexible RNA-Seqread counting Bioinformatics 31(3)436ndash437 February 2015
36
REFERENCES
[SK11] Christof Strauch and Walter Kriha NoSQL databases Lecture Notes StuttgartMedia University February 2011
[SOdMVN12] Mikhail Shugay Intildeigo Ortiz de Mendiacutebil Joseacute L Vizmanos and Francisco JNovo Genomic hallmarks of genes involved in chromosomal translocations inhematological cancer PLoS Comput Biol 8(12)e1002797 12 2012
[The04] The ENCODE Project Consortium The ENCODE (ENCyclopedia Of DNA Ele-ments) Project Science (New York NY) 306(5696)636ndash40 October 2004
[TPS09] Cole Trapnell Lior Pachter and Steven L Salzberg TopHat discovering splicejunctions with RNA-Seq Bioinformatics (Oxford England) 25(9)1105ndash11 May2009
[TRG+12a] Cole Trapnell Adam Roberts Loyal Goff Geo Pertea Daehwan Kim David RKelley Harold Pimentel Steven L Salzberg John L Rinn and Lior Pachter Dif-ferential gene and transcript expression analysis of RNA-seq experiments withTopHat and Cufflinks Nature protocols 7(3)562ndash78 March 2012
[TRG+12b] Cole Trapnell Adam Roberts Loyal Goff Geo Pertea Daehwan Kim David RKelley Harold Pimentel Steven L Salzberg John L Rinn and Lior Pachter Dif-ferential gene and transcript expression analysis of RNA-seq experiments withTopHat and Cufflinks Nature protocols 7(3)562ndash78 March 2012
[WMM+11] Ying Wang Gaurang Mehta Rajiv Mayani Jingxi Lu Tade Souaiaia YanghoChen Andrew Clark Hee Jae Yoon Lin Wan Oleg V Evgrafov James AKnowles Ewa Deelman and Ting Chen RseqFlow workflows for RNA-Seq dataanalysis Bioinformatics (Oxford England) 27(18)2598ndash600 September 2011
[Wol13] Jochen B W Wolf Principles of transcriptome analysis and gene expressionquantification an rna-seq tutorial Molecular Ecology Resources 13(4)559ndash5722013
[ZW09] Mark Gerstein |amp Michael Snyder Zhong Wang Rna-seq a revolutionary tool fortranscriptomics Nature Reviews Genetics 1057ndash63 January 2009
37
REFERENCES
38
Appendix A
iRAP tools supported
A1 Mappers
Mapper Option name (mapper)TopHat 1 tophat1TopHat 2 tophat2SMALT smaltGSNAP gsnapSOAPsplice soapspliceBWA bwa1BWA bwa2Bowtie 1 bowtie1Bowtie2 bowtie2GEM gemSTAR starOSA osaMapSplice mapsplice
A2 Quantification
Quantifier Option name (quant_method)FluxCapacitor flux_capHT-Seq (union mode) htseq1HT-Seq (intersection non-empty mode) htseq2Cufflinks 1 (try to find novel transcripts-g) cufflinks1Cufflinks 2 (try to find novel transcripts-g) cufflinks2Cufflinks 1 (do not assemble novel transcripts-G) cufflinks1_ndCufflinks 2 (do not assemble novel transcripts-G) cufflinks2_ndNURD nurd
39
iRAP tools supported
A3 Differential expression [DE]
Method Option name (de_method)DESeq deseqDESeq2 deseq2EdgeR edgerCuffdiff 1 cuffdiff1Cuffdiff 2 cuffdiff2
A4 Gene set enrichment analysis [GSE]
Tool Option name (gse_tool)Piano piano
40
Appendix B
iRAP model of configuration file
1 This is a comment (lines that start with a are ignored by iRAP)
2 =============================================================================
3 name that you want to give to the experiment (no spaces)
4 All files produced by irap will be placed in a folder with the given name
5 name=myexp
6
7
8 =============================================================================
9 name of the species
10 species=homo_sapiens
11
12 =============================================================================
13 Fasta file with the reference genome
14 reference=Homo_sapiensGRCh3766dnafa
15
16 =============================================================================
17 GTF file with the annotations
18 gtf_file=Homo_sapiensGRCh3766gtf
19
20 =============================================================================
21 IRAP options (may be providedoverriden in the command line)
22
23
24 Mapper
25 mapper=
26
27
28 Quantification method
29 quant_method=
30
31
32 Dif expression method
33 Requires contrasts to be defined (see below)
41
iRAP model of configuration file
34 de_method=
35
36
37 Gene set enrichment (GSE) analysis
38 Requires de_method to be defined
39 Tool to use (none|piano)
40 gse_tool=piano
41
42 gse_method (mean|median|sum|fisher|fisher-exact|stouffer|tailStrength|wilcoxon|
reporter|page) see Piano vignete documentation for more details
43 gse_method=fisher
44 gse_pvalue=005
45 Minimum number of genes in a gene set
46 gse_minsize=3
47
48
49
50 TSV file with gene annotation
51 Format IDNamelocussourcelnameGOGOtermKEGG
52 Description
53 ID=gene_id (this is mandatory and should match the one given in the gtf file)
54 Name=gene name
55 locus=chrstart--end
56 source=biotype
57 lname=gene name
58 GO=go ids (multiple values can be separated by)
59 GO=GO terms (multiple values can be separated by)
60 KEGG=Kegg ids (multiple values can be separated by)
61 If auto is defined then iRAP will try to generate the file
62 - this may take a considerable amount of time and will only work
63 for a reduced number of species
64 off - default value
65 annot_tsv=
66
67
68 QC
69 Check data (reads) quality (on|off|none)
70 on - reads are filtered out based on their quality
71 off - the quality of the reads is assessed but no filtering is done
72 none- no quality control is performed
73 qual_filtering=on
74
75 Trim all reads to the minimum read size after quality trimming - Yes (y)| No (n)
76 only applicable if qual_filtering is on
77 trim_reads=y
78
79 Minimum base quality accepted (def 10)
80 min_read_quality=10
81
42
iRAP model of configuration file
82 Contamination check (cont_index parameter) Reads that likely
83 originate from organisms other than the one under study can be
84 discarded during pre-processment of the reads This is done by
85 aligning the reads to the genomes of organisms that might be a
86 source of contamination and discard those that map with a high
87 degree of fidelity By default iRAP will check if the data is
88 contaminated by e-coli An example to create a contamination
89 database is provided in the examplesex_add2contaminationDBsh
90 script The value of the parameter should be the file name prefix of
91 the bowtie index files
92
93 Disable contamination check
94 cont_index=no
95 Default value
96 cont_index=$(data_dir)contaminatione_coli
97
98
99 Misc options
100
101 Number of threads that may be used by IRAP
102 max_threads=1
103
104 Exon level quantification Yes (y)| No (n)
105 exon_quant=y
106
107 Transcript level quantification Yes (y)| No (n)
108 transcript_quant=y
109 =============================================================================
110 full or relative path to the directory where all the data can be found
111 data_dir=data
112
113 the directory should be organized as follows (see directory data in IRAP toplevel
directory)
114
115 $data_dir
116 $data_dir
117 contamination
118 e_coli1ebwt
119 e_coli2ebwt
120 e_coli3ebwt
121 e_coli4ebwt
122 e_coliREADME
123 e_colirev1ebwt
124 e_colirev2eb
125 raw_data
126 $species
127 fastq
128 fastq
129
43
iRAP model of configuration file
130 reference
131 $species
132 $gtf_file
133 $reference
134
135 Notes
136 1) $ denotes the value defined for the variable
137 2) Since version 050 the raw data (fastqbam) files may be
138 distributed across several sub-folders
139
140
141 =============================================================================
142 Only necessary if you intend to perform Differential Expression analysis
143
144 contrasts=contrast_def [contrast_def ]
145 contrasts=purpleVsPink purpleVsGrey
146
147 definition of each constrast
148 contrast= group group [ group ]
149 purlpleVsPink=Purple Pink
150 purlpleVsGrey=Purple Grey
151
152 groups
153 GroupName= Library_name [Library_name ]
154 Purlple=myLib1 myLib2
155 Pink=myLib3
156 Grey=myLib4
157
158 optional parameter used in the report (HTML) generation
159 groups=Purple Pink Grey
160
161 technical replicates
162 technicalreplicates=myLib1myLib2myLib3mylib4
163
164 Note names of groups contrasts and libraries should start with a letter and
contain only alphanumeric characters and the character _
165
166 =============================================================================
167 Data
168
169
170 Information for each library
171 LibName=Fastq file
172 Note
173 1 LibName should start with a letter and contain only alphanumeric characters
and the character _ LibName should not contain in _1 or _2
174 2 LibName should be different from the name of the fastq file for instance
175 f1=f1fastq
176 will produce an error
44
iRAP model of configuration file
177
178 Single-end
179 myLib1=f1fastq
180 read size
181 myLib1_rs=75
182 quality encoding (33 or 64)
183 myLib1_qual=33
184
185 strand specific protocol
186 mylib1_strand=first
187 mylib1_strand=second
188 Default value is both (strands)
189 mylib1_strand=both
190
191 Have the file in a different sub-folder
192 mylib1_dir=somesubfolder
193
194 See SAMBAM specification for more details about the following two parameters
195 read group id (to be included in the BAM file) - this is not supported by all
mappers
196 myLib1_rgid=
197 sambam header lines to include in the BAM file
198 myLib1_shl=COtThis is a commentnCOtand another line
199
200 LibName=Fastq file
201 myLib2=f2fastq
202 read size
203 myLib2_rs=75
204 quality encoding (33 or 64)
205 myLib2_qual=33
206
207
208 Paired-end
209 LibName=Fastq files
210 myLib3=f3_1fastq f3_2fastq
211 read size
212 myLib3_rs=50
213 quality encoding (33 or 64)
214 myLib3_qual=33
215 insert size
216 myLib3_ins=350
217 standard deviation
218 myLib3_sd=60
219
220 LibName=Fastq files
221 myLib4=f4_1fastq f4_2fastq
222 read size
223 myLib4_rs=50
224 quality encoding (33 or 64)
45
iRAP model of configuration file
225 myLib4_qual=33
226 insert size
227 myLib4_ins=350
228 standard deviation
229 myLib4_sd=60
230
231
232
233
234 list the names of your single-end (se) and paired (pe) libraries
235 se=myLib1 myLib2
236 pe=myLib3 myLib4
237 No SE data
238 se=
239 No PE data
240 pe=
241
242
243
244 Passingoverriding parameters
245
246 It is possible to pass parameters to the mappers and quantification
247 methods but that should be done carefully since it may break the
248 pipeline (if the location of the input andor output files is
249 changed)
250
251 Overridingchanging the mappersrsquo parameters
252 _map_options=options
253 Example
254 tophat2_map_options=--min-intron-length 5 --no-coverage-search
255
256 Overridingchanging the parameters of the quantification methods
257 _params=options
258 Example
259 htseq_params= -q
46
Appendix C
iRAP example configuration file
1 minimal configuration file for DE
2 experiment name
3 name=ecoli_ex
4 species
5 species=ecoli_k12
6 reference genome
7 reference=Escherichia_coli_str_k_12_substr_mg1655GCA_000005845119dnatoplevel
fagz
8 gtf file
9 gtf_file=Escherichia_coli_str_k_12_substr_mg1655GCA_000005845119gtfgz
10 Enable filtering based on quality
11 qual_filtering=on
12 Use a contamination data set to filter out reads
13 cont_index=no
14 Toplevel directory with the data
15 data_dir=
16
17 some contrasts
18 GA=Group A
19 contrasts=GAvsGB GBvsGA
20 GAvsGB=GA GB
21 GBvsGA=GB GA
22 GA=FA FB FC
23 GB=FD FE FF
24
25 se=FA FB FC FD FE FF
26
27 FA=SRR933983fastqgz
28 FA_rs=50
29 FA_qual=33
30
31 FB=SRR933984fastqgz
32 FB_rs=50
47
iRAP example configuration file
33 FB_qual=33
34
35 FC=SRR933985fastqgz
36 FC_rs=50
37 FC_qual=33
38
39 FD=SRR933989fastqgz
40 FD_rs=50
41 FD_qual=33
42
43 FE=SRR933990fastqgz
44 FE_rs=50
45 FE_qual=33
46
47 FF=SRR933990fastqgz
48 FF_rs=50
49 FF_qual=33
50 EOF
48
- Front Page
- Table of Contents
- List of Figures
- List of Tables
- 1 Introduction
-
- 11 Context
- 12 Motivation and Goals
- 13 Proposed Solution
- 14 Structure of the Dissertation
-
- 2 Basic Concepts and Bibliographic Review
-
- 21 Biological Basic Concepts
-
- 211 Genome
- 212 Transcriptome Assembly and Gene expression
-
- 22 RNA-Seq Analysis
-
- 221 RNA-Seq microarrays and DNA sequencing
- 222 RNA-Seq Pipeline
-
- 23 Standard File Formats used
-
- 231 FASTA
- 232 FASTQ
- 233 SAM and BAM
- 234 GFF and GTF
-
- 24 Relevant Data Repositories
- 25 Tools for RNA-seq and Differential Analysis
- 26 Relational and Non-relational Databases
- 27 Tecnologies
- 28 Related Work
- 29 Chapter Summary
-
- 3 The Gemini framework
-
- 31 Gemini
- 32 Gemini Architecture
-
- 321 Physical Architecture
-
- 33 Data Management
- 34 Web Interface
- 35 Use cases
- 36 Case studies
-
- 361 Full pipeline
- 362 Stage pipeline
-
- 37 Chapter Summary
-
- 4 Case study
-
- 41 Samples characterization
- 42 Researching objectives
- 43 Protocol of analysis
- 44 Genome version GRCh37 versus GRCh38
- 45 Fusion genes
- 46 Results
-
- 461 Case study with reference genome GRCh37
- 462 Splicing analysis
- 463 Case study with reference genome GRCh38
-
- 47 Chapter Summary
-
- 5 Conclusions and Future Work
- References
- A iRAP tools supported
-
- A1 Mappers
- A2 Quantification
- A3 Differential expression [DE]
- A4 Gene set enrichment analysis [GSE]
-
- B iRAP model of configuration file
- C iRAP example configuration file
-
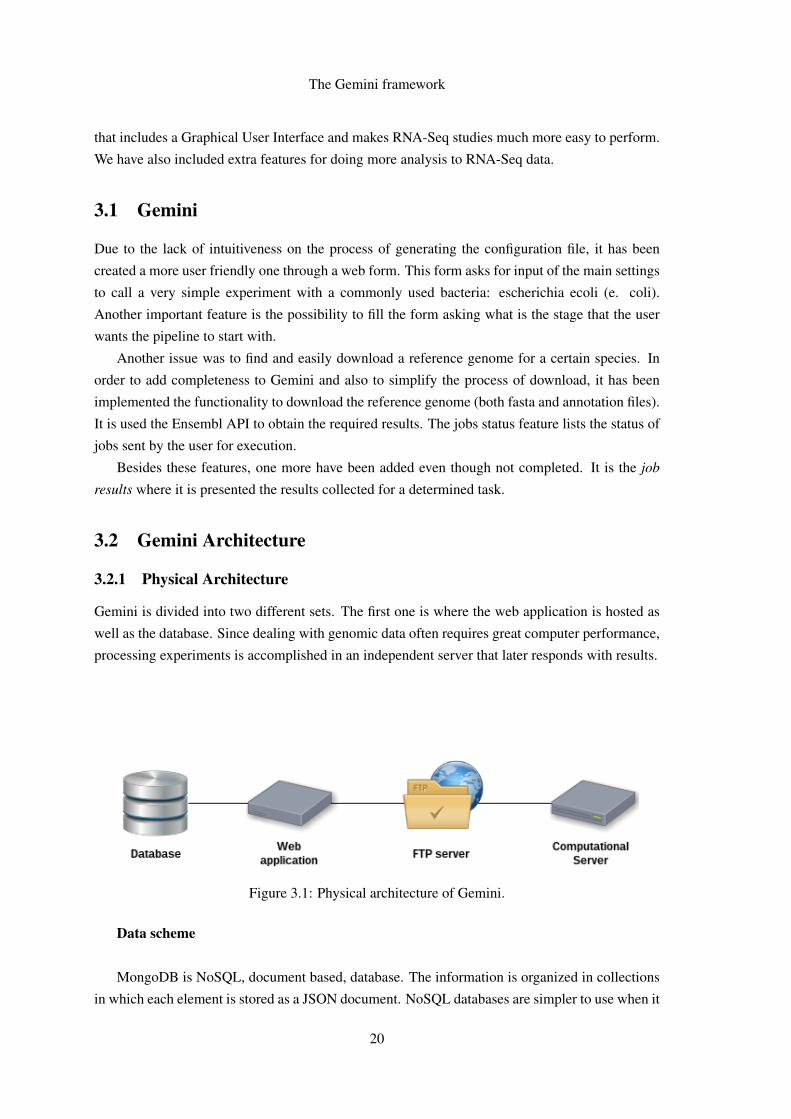
The Gemini framework
for this purpose We have followed an online tutorial 1 for the configuration From this we
created one administrator that has permissions for writing and reading files and we also authorized
anonymous login that may only retrieve files This way on the web application the admin user
creates the reads reference genomes annotation and configuration files On the computational
server an anonymous user authenticates for retrieving the files according to the filenames received
via API
The inside directory of FTP follows the hierarchy of ltuseridgt ltexperience namegt ltdata
filesgt where ltuseridgt is the ID on the Accounts document and ltexperience namegt is the name
on Jobs document When the server is prompted to run an experience it downloads the required
data from the FTP and runs iRAP with the necessary configuration options
34 Web Interface
For the implementation of Gemini python has been used for backend along with a simple fast and
lightweight WSGI micro web-framework called BottlePy 2 It has no dependencies and grants the
main functionalities such as routing templates some class utilities and a built-in server
The first screenshot (Figure 33) shows the home page of Gemini There is top menu bar with
two possible interactions login and register There is also a simple content box that describes the
main features and status of development of the platform Later on a new menu appears with the
possibility to logout on the Welcome tab (as in Figure 34)
Figure 33 Home page
Figure 34 Logout menu
1Tutorial available at httpswwwthomas-krenncomenwikiSetup_FTP_Server_under_Debian
2BottlePy httpbottlepyorgdocsdevindexhtml
23
The Gemini framework
The main feature of the system is the create job (Figure 35) option that is easily accessible on
top menu When the user clicks on it a form is displayed with the variables to introduce on the
configuration file that iRAP needs A description option has been added to provide the freedom to
the researcher to include some extra information that he finds useful
Figure 35 Create job form
The same type of form was used for the reference genomes section (Figure 36) The user is
prompted to choose orderly the species name release number and version Afterwards a table of
elements appears allowing the expert to download the files found
Figure 36 Reference genomes component
24
The Gemini framework
35 Use cases
Gemini was designed to have only one actor the user that will accomplish the experiments This
actor has the possibility to register login and logout of his account create a job and the hability
to download a reference genome of his choice Even though not fully implemented it has been
considered the jobs done functionality
Figure 37 Use cases diagram
36 Case studies
Some case studies with e coli in order to test iRAPrsquos installation and its capabilities For both
of the case studies it has been collected six samples of Escherichia coli reads from European
Nucleotide Archive 3 and the corresponding reference genome and annotation file from Ensembl
361 Full pipeline
In order to call the full pipeline iRAP has been tested with the directive irap conf=ecoli_exconf
Configuration file (ecoli_exconf ) content is as described in Appendix C In this task the system
received the reads and performed the quality control (QC) mapping quantification and differential
expression between the two groups of samples
3ENA httpwwwebiacukena
25
The Gemini framework
This test has been accomplished successfully
362 Stage pipeline
The stage pipeline is a powerful functionality since it allows the user to choose a specific stage of
the pipeline that he wants to execute for his samples
Besides the fact that it is not easy to collect data samples users often want to repeat or analyse
just one step of the pipeline and take some conclusions of it Furthermore this type of pipeline is
less time consuming
A concrete usage example is IPATIMUPrsquos data which contains the output information of the
mapper TopHat and will be further analysed in detail in Chapter 4 Concerning this setup it would
not be possible to call the full pipeline but instead it would require a command specific command
option
For validation purposes the same bacteria from the previous analysis has been used for the
stage pipeline case After calling the setup command to check input the directive irap conf=
ecoli_exconf quality_filtering_and_reporting has been used to perform the stage1
of iRAP The platform was able to perform with success this task
37 Chapter Summary
It has been used Python with BottlePy for the main implementation of the interface of Gemini
MongoDB has been chosen for dealing with information A FTP server was mounted for the
transitions of data between the client and the server The platform allows the expert to call a full or
stage pipeline analysis and provides the download of both fast and annotation files The essential
items are setup for the addition of further functionalities
26
Chapter 4
Case study
In this chapter it is going to be presented the Case Study with data from samples of thyroid carci-
noma along with their charactering and researching results
After the development of an interface to the iRAP tool the following step was to do a case
study with some realistic DNA samples of thyroid cancer patients regarding the partnership with
IPATIMUPrsquos researchers
The purpose of this case study was to do some research of potential differences between dis-
tinct types of the disease In order to accomplish this four samples were collected from Centro
Hospitalar de Satildeo Joatildeo (Porto) Cases 1 and 2 have been categorized as a widely invasive Fol-
licular Thyroid Carcinoma (wFTC) and cases 3 and 4 as a minimally invasive Follicular Thyroid
Carcinoma (mFTC)
41 Samples characterization
Patient from case 1 was female with 82 years old the tumour measuring 2 cm of size and presented
a predominant follicular growth pattern and oncocytic features Patient from case 2 was male with
55 years old the tumour measuring 5 cm of size and presented a predominant solidtrabecular
growth pattern For the group of mFTC patient from case 3 was female 56 years old the tumour
measuring 37 cm of size and with follicular growth pattern patient from case 4 was female 56
years old the tumour measuring 4 cm of size and with follicular growth pattern
42 Researching objectives
The aim of the study was to answer the following questions
bull Differentially expressed genes
bull Total isoforms found either in percentange and in absolute
27
Case study
bull Average of alternative isoforms for each gene spliced
bull Potentially novel isoforms and how do they behave between samplesgroups of samples
bull Compare results between versions of human genome assembly
bull Retrieve fusion genes
43 Protocol of analysis
Collected sample reads have been aligned against reference genome GRCh37 with TopHat version
141 Posterior analysis followed Tuxedo Protocol as described in Trapnell et al [TRG+12b] An
overview of the full protocol can be found in Figure 41
For the implementation of this procedure it were considered as two different groups the cases
1 and 2 (wFTC) against cases 3 and 4 (mFTC) The following step was to assemble transcripts for
each sample with Cufflinks 1 and afterwards create a single merged transcriptome annotation with
Cuffmerge 2 Cuffdiff 3 was then used to find significant changes in transcript expression
In order to find potential isoforms each sample was ran against the reference genome with
Cuffcompare 4
44 Genome version GRCh37 versus GRCh38
Even though IPATIMUPrsquos data have been assembled with reference genome version GRCh37
nowadays a more recent version (GRCh38) has been released in 2013 This new assembly is the
first major revision of the human genome in more than four years 5
The main differences between this two versions are
Alternate sequences several human chromosomal regions have sufficient variability to prevent
adequate representation by a single sequence This new version provides alternate sequence
for selected variant regions through the inclusion of alternate loci 6 scaffolds
Centromere 7 representation Previous method of representing centromeric regions have been
replaced by sequences from centromere models The models provide the approximate repeat
number and order for each centromere and are useful for read mapping and variation studies
Mitochondrial genome The new mitochondrial reference sequence is the Revised Cambridge
Reference Sequence with RefSeq accession number NC_0129201 The previous one was
RefSeq accession number NC_001907 which was not updated when GRCh37 assembly
later transitioned to the new version1Cufflinks httpcole-trapnell-labgithubiocufflinks2Cuffmerge httpcole-trapnell-labgithubiocufflinkscuffmergeindexhtml3Cuffdiff httpcole-trapnell-labgithubiocufflinkscuffdiffindexhtml4Cuffcompare httpcole-trapnell-labgithubiocufflinkscuffcompareindexhtml5As in UCSC mailing list at httpsgroupsgooglecomasoeucsceduforumtopic
genome-announce52Kv41YBXNY6Specific location of a gene on a chromosome
28
Case study
Figure 41 An overview of the Tuxedo Protocol with full steps TopHat for alignment Cufflinkspackage to find differential features between group samples and in the end CummeRbund to plotprevious results
Sequence updates Several erroneous bases and misassembled regions have been corrected and
more than 100 gaps have been filled or reduced
Analysis set The new assembly offers an analysis set that was created to accommodate next
generation sequencing read alignment pipelines Several GRCh38 regions have been elimi-
nated from this set to improve read mapping
29
Case study
45 Fusion genes
After we done some research on the technologies used for finding fusion genes in the reads we
have not been able to perform the analysis to answer the last question of our researching objectives
DeFuse required as input the original reads which were not provided This analysis would have
been interesting for relating the ocurrence of thyroid and the presence of fusion genes as well as if
there was any relevant difference between the samples of wFTC and mFTC
46 Results
461 Case study with reference genome GRCh37
The following table ( 41) demonstrates some genes that were differentially expressed with signif-
icance between mFTC and wFTC According to Celestino et al 8 CRABP1 C1QL1 and LCN2
are biomarkers of thyroid cancer and predictors of extrathyroidal extension It is commonly used
the value of 005 has threshold above which the differential expression is significant By inspect-
ing out the table we can find C1QL1 with a q-value of 0000555 and CRABP1 with a q-value
of 159E-11 which are in concordance with the previous article Furthermore it is verified the
increased gene expression in wFTC when compared to mFTC
Gene ID Gene Chr mFTC wFTC Fold change(log2) Q value
ENSG00000167748 KLK1 19 018672 111924 922742 0ENSG00000104725 NEFL 8 00196645 276961 104599 0ENSG00000174145 KIAA1239 4 00307388 144265 887444 0ENSG00000182379 NXPH4 12 008307 195786 788074 0ENSG00000131094 C1QL1 17 0121453 238957 429828 0000555ENSG00000142677 IL22RAI 1 150905 0384783 -529345 0ENSG00000138615 CILP 15 423569 0052726 -632793 241E-11ENSG00000141431 ASXL3 18 18938 001408 -707148 124E-09ENSG00000166426 CRABP1 15 748375 0367899 -766831 159E-11ENSG00000214145 LINC00887 3 19797 0119327 -737421 0000459
Table 41 Genes differentially expressed between minimally invasive follicular thryoid carcino-mas (mFTCs) and widely invasive follicular thyroid carcinomas (wFTCs)
In response to the previous researching objectives the Table 42 has the statistical results for
taks two and three From the data analysis we could conclude that less than 1 of genes have
isoforms but each one has an average of 389 alternatives
8Ricardo Celestino Torfin Nome Ana Pestana Andreas M Hoff Pedro A Gonccedilalves Catarina Eloy Eva SigstadRagnhild A Lothe Trine Bjoslashro Manuel Sobrinho-Simotildees Rofl I Skotheim Paula Soares CRAPBP1 C1QL1 andLCN2 are biomarkers of thyroid cancer and predictors of extrathyroidal extension subbmited for publication
30
Case study
Total genes 63896Total significant isoforms 689Total unique genes with isoforms 179Ratio of unique genes with isoformsgenes () 028Average of alternatives per gene with isoforms 389
Table 42 Statistical results for researching objectives number 2 and 3
462 Splicing analysis
Forward in the analysis Cuffcompare 9 has been used to search for novel isoforms when com-
pared to the reference genome The method was to compare each sample to the reference genome
and afterwards make an overlap of the results The main objective was then to infer about the
differences among wFTC and mFTC
Sample 1(wFTC)
Sample 2(wFTC)
Sample 3(mFTC)
Sample 4(mFTC)
Total genes 30440 36862 35539 37534Potential novel isoforms 7406 8450 8781 8830Table 43 Potential novel isoforms for each sample of IPATIMUPrsquos data
As demonstrated on Table 43 average there is a percentage of 24 of potentially novel iso-
forms found (at least one spliced junction is shared with a reference transcript) There is been
made an overlap of the results in order to encounter differences between wFTC and mFTC The
Table 44 presents the counting of differences between cases A brief analysis allows us to say
that we can not make any relationship between wFTC and mFTC On average there was a total of
3722 changes among this two sets The average within the sets are 3554 for wFTC and 3992 for
mFTC Given this results there was not a significant divergence to allow us to relate the splicing
and the occurrence of a more invasive Thyroid Carcinoma
Sets ChangesS1 S2 3554S1 S3 3609S1 S4 3612S2 S3 3847S2 S4 3820S3 S4 3929
Table 44 Number of differences between samples Syntax used S1 - Sample 1 S2 - Sample 2S3 - Sample 3 and S4 - Sample 4
9Cuffcompare httpcole-trapnell-labgithubiocufflinkscuffcompareindexhtml
31
Case study
463 Case study with reference genome GRCh38
In order to respond to the last research objective it has been applied the method of analysis has
before with a more recent human genome assembly After using the same protocol with Cufflinks
Cuffmerge and Cuffdiff sequentially we have come to some conclusions
The produced results of differential expression analysis for the same genes were very different
Genes that were highly significant before like C1QL1 and CRABP1 now had no relevance (q-
value gt 005) As mentioned before we had only access to TopHatrsquos output that used version
GRCh37 for the alignment and mapping process so we could not start from scratch the analysis
This outcome demonstrates two topics in particular
1 the introduction of novel annotations can make previous analysis outdated
2 there is the need to save the original reads in order to update earlier studies
The solution to this situation would have been to use the original reads to repeat the assembly
and then follow the Tuxedo protocol to collected correct and updated differential expression data
47 Chapter Summary
These section of development has been introduced in order to confer not only validation but also
to do some researching studies on the subject Four samples were collected and divided into two
distinct groups Tuxedo protocol was followed for responding to the research objectives The
case study for GRCh37 demonstrated the expression of C1QL1 and CRABP1 on wFTC when
compared to mFTC as indicated in the referred article On the other hand the same protocol when
applied with GRCh38 demonstrated the importance of saving the original reads and what is the
influence of newer releases in previous researching results Lastly the splicing analysis results did
not show any evidence of related isoforms count and the manifestation of the different stages of
the disease
32
Chapter 5
Conclusions and Future Work
The research of genomic-based cancers require highly complex data analysis Such analysis re-
quire most often the use of a large number of complex computational resources the gathering
of a lot of information over the Internet and the use of powerful computational resources Fur-
thermore the manipulation of the computational tools and resources require the assistance of an
informatics expert
The thesis work is a contribution towards the solution of the above mention problem We
propose and developed a framework that enables an expert biologist to perform genomic-based
complex analysis in a easy way and using the required powerful computational resources in a
transparent way
Using the developed framework we have used real data to address several research questions
provided by IPATIMUPrsquos researchers Firstly with the human genome GRCh37 we identified
two of the biomarkers of thyroid cancer by differential gene expression analysis Secondly we
found 689 significant isoforms 179 unique out of 63896 genes (ratio of 028) with an average
of 389 isoforms per gene Thirdly when trying to determine potential novel isoforms we came
at no conclusion of the differences of expression when comparing wFTC and mFTC The last
case was applying the Tuxedo protocol with the new GRCh38 on samples The outcome of the
experiment revealed the importance of saving the original reads and that newer releases become
previous analysis outdated
Future Work
This thesis work is just a starting point As stated before the framework was designed so it can be
extended with further modules to enable addressing other research questions
The case studies also showed us that RNA-seq analysis is very time consuming On the other
hand there are a lot of sub-tasks that can be run in parallel (like the task of aligning the reads)
33
Conclusions and Future Work
We will study and compare different techniques and opportunities to make RNA-seq in parallel as
much as possible
34
References
[bNE] Scitable by Nature Education Transcriptome available at httpwwwnaturecomscitabledefinitiontranscriptome-296 last accessJanuary 2015
[CAB+15] Fiona Cunningham M Ridwan Amode Daniel Barrell Kathryn Beal Konstanti-nos Billis Simon Brent Denise Carvalho-Silva Peter Clapham Guy CoatesStephen Fitzgerald Laurent Gil Carlos Garciacutea Giroacuten Leo Gordon ThibautHourlier Sarah E Hunt Sophie H Janacek Nathan Johnson Thomas Juette-mann Andreas K Kaumlhaumlri Stephen Keenan Fergal J Martin Thomas MaurelWilliam McLaren Daniel N Murphy Rishi Nag Bert Overduin Anne ParkerMateus Patricio Emily Perry Miguel Pignatelli Harpreet Singh Riat DanielSheppard Kieron Taylor Anja Thormann Alessandro Vullo Steven P WilderAmonida Zadissa Bronwen L Aken Ewan Birney Jennifer Harrow Rhoda Kin-sella Matthieu Muffato Magali Ruffier Stephen MJ Searle Giulietta SpudichStephen J Trevanion Andy Yates Daniel R Zerbino and Paul Flicek Ensembl2015 Nucleic Acids Research 43(D1)D662ndashD669 2015
[CFG+10] Peter J A Cock Christopher J Fields Naohisa Goto Michael L Heuer and Peter MRice The Sanger FASTQ file format for sequences with quality scores and theSolexaIllumina FASTQ variants Nucleic acids research 38(6)1767ndash71 April2010
[CH07] Geoffrey M Cooper and Robert E Hausman The Cell - A molecular approachAmerican Society for Microbiology 2007
[Cod70] E F Codd A relational model of data for large shared data banks Communica-tions of the ACM 13(6)377ndash387 June 1970
[Con11] The ENCODE Project Consortium A userrsquos guide to the encyclopedia of DNAelements (ENCODE) PLoS biology 9(4)e1001046 April 2011
[FMB14] N A Fonseca J A Marioni and A Brazma RNA-seq gene profiling - a system-atic empirical comparison Technical report May 2014
[FPMB14] Nuno A Fonseca Robert Petryszak John Marioni and Alvis Brazma irap - anintegrated rna-seq analysis pipeline bioRxiv 2014
[GCW+10] Qiang Gan Iouri Chepelev Gang Wei Lama Tarayrah Kairong Cui Keji Zhaoand Xin Chen Dynamic regulation of alternative splicing and chromatin structurein Drosophila gonads revealed by RNA-seq Cell research 20(7)763ndash83 July2010
35
REFERENCES
[GEN] GENIE Dna genes and chromossomes University of Leicesteravailable at httpwww2leacukdepartmentsgeneticsvgecschoolscollegestopicsdna-genes-chromosomes last access Jan-uary 2015
[Gri] Malachi Griffith Bioinformatics for Cancer Genomics (BiCG)available at httpbioinformaticscaworkshops2012bioinformatics-cancer-genomics-bicg last access January 2015
[GTBK11] Angela Goncalves Andrew Tikhonov Alvis Brazma and Misha Kapushesky Apipeline for RNA-seq data processing and quality assessment Bioinformatics (Ox-ford England) 27(6)867ndash9 March 2011
[HBB+02] T Hubbard D Barker E Birney G Cameron Y Chen L Clark T CoxJ Cuff V Curwen T Down R Durbin E Eyras J Gilbert M HammondL Huminiecki A Kasprzyk H Lehvaslaiho P Lijnzaad C Melsopp E Mon-gin R Pettett M Pocock S Potter A Rust E Schmidt S Searle G SlaterJ Smith W Spooner A Stabenau J Stalker E Stupka A Ureta-Vidal I Vastrikand M Clamp The ensembl genome database project Nucleic Acids Research30(1)38ndash41 2002
[HBD+13] R Hitzemann D Bottomly P Darakjian N Walter O Iancu R SearlesB Wilmot and S McWeeney Genes behavior and next-generation RNA se-quencing Genes Brain Behav 12(1)1ndash12 Feb 2013
[Ins] National Human Genome Research Institute Transcriptome available at httpwwwgenomegov13014330 last access January 2015
[Joh03] Jason M Johnson Genome-wide survey of human alternative pre-mrna splicingwith exon junction microarrays Science 3022141ndash2144 December 2003
[kn10] Gene set enrichment a problem of pathways Briefings in functional genomics9(5-6)385ndash90 December 2010
[kn11] Overview of available methods for diverse RNA-Seq data analyses Science ChinaLife sciences 54(12)1121ndash8 December 2011
[Lan10] Ben Langmead Aligning short sequencing reads with Bowtie Current proto-cols in bioinformatics editoral board Andreas D Baxevanis [et al] Chapter11Unit 117 December 2010
[LM10] Adam Lith and Jakob Mattsson Investigating storage solutions for large data - acomparison of well performing and scalable data storage solutions for real timeextraction and batch insertion of data Masterrsquos thesis 2010
[LTPS09] Ben Langmead Cole Trapnell Mihai Pop and Steven L Salzberg Ultrafastand memory-efficient alignment of short DNA sequences to the human genomeGenome biology 10(3)R25 January 2009
[ORY10] Alicia Oshlack Mark D Robinson and Matthew D Young From RNA-seq readsto differential expression results Genome biology 11(12)220 January 2010
[SG15] Marc W Schmid and Ueli Grossniklaus Rcount simple and flexible RNA-Seqread counting Bioinformatics 31(3)436ndash437 February 2015
36
REFERENCES
[SK11] Christof Strauch and Walter Kriha NoSQL databases Lecture Notes StuttgartMedia University February 2011
[SOdMVN12] Mikhail Shugay Intildeigo Ortiz de Mendiacutebil Joseacute L Vizmanos and Francisco JNovo Genomic hallmarks of genes involved in chromosomal translocations inhematological cancer PLoS Comput Biol 8(12)e1002797 12 2012
[The04] The ENCODE Project Consortium The ENCODE (ENCyclopedia Of DNA Ele-ments) Project Science (New York NY) 306(5696)636ndash40 October 2004
[TPS09] Cole Trapnell Lior Pachter and Steven L Salzberg TopHat discovering splicejunctions with RNA-Seq Bioinformatics (Oxford England) 25(9)1105ndash11 May2009
[TRG+12a] Cole Trapnell Adam Roberts Loyal Goff Geo Pertea Daehwan Kim David RKelley Harold Pimentel Steven L Salzberg John L Rinn and Lior Pachter Dif-ferential gene and transcript expression analysis of RNA-seq experiments withTopHat and Cufflinks Nature protocols 7(3)562ndash78 March 2012
[TRG+12b] Cole Trapnell Adam Roberts Loyal Goff Geo Pertea Daehwan Kim David RKelley Harold Pimentel Steven L Salzberg John L Rinn and Lior Pachter Dif-ferential gene and transcript expression analysis of RNA-seq experiments withTopHat and Cufflinks Nature protocols 7(3)562ndash78 March 2012
[WMM+11] Ying Wang Gaurang Mehta Rajiv Mayani Jingxi Lu Tade Souaiaia YanghoChen Andrew Clark Hee Jae Yoon Lin Wan Oleg V Evgrafov James AKnowles Ewa Deelman and Ting Chen RseqFlow workflows for RNA-Seq dataanalysis Bioinformatics (Oxford England) 27(18)2598ndash600 September 2011
[Wol13] Jochen B W Wolf Principles of transcriptome analysis and gene expressionquantification an rna-seq tutorial Molecular Ecology Resources 13(4)559ndash5722013
[ZW09] Mark Gerstein |amp Michael Snyder Zhong Wang Rna-seq a revolutionary tool fortranscriptomics Nature Reviews Genetics 1057ndash63 January 2009
37
REFERENCES
38
Appendix A
iRAP tools supported
A1 Mappers
Mapper Option name (mapper)TopHat 1 tophat1TopHat 2 tophat2SMALT smaltGSNAP gsnapSOAPsplice soapspliceBWA bwa1BWA bwa2Bowtie 1 bowtie1Bowtie2 bowtie2GEM gemSTAR starOSA osaMapSplice mapsplice
A2 Quantification
Quantifier Option name (quant_method)FluxCapacitor flux_capHT-Seq (union mode) htseq1HT-Seq (intersection non-empty mode) htseq2Cufflinks 1 (try to find novel transcripts-g) cufflinks1Cufflinks 2 (try to find novel transcripts-g) cufflinks2Cufflinks 1 (do not assemble novel transcripts-G) cufflinks1_ndCufflinks 2 (do not assemble novel transcripts-G) cufflinks2_ndNURD nurd
39
iRAP tools supported
A3 Differential expression [DE]
Method Option name (de_method)DESeq deseqDESeq2 deseq2EdgeR edgerCuffdiff 1 cuffdiff1Cuffdiff 2 cuffdiff2
A4 Gene set enrichment analysis [GSE]
Tool Option name (gse_tool)Piano piano
40
Appendix B
iRAP model of configuration file
1 This is a comment (lines that start with a are ignored by iRAP)
2 =============================================================================
3 name that you want to give to the experiment (no spaces)
4 All files produced by irap will be placed in a folder with the given name
5 name=myexp
6
7
8 =============================================================================
9 name of the species
10 species=homo_sapiens
11
12 =============================================================================
13 Fasta file with the reference genome
14 reference=Homo_sapiensGRCh3766dnafa
15
16 =============================================================================
17 GTF file with the annotations
18 gtf_file=Homo_sapiensGRCh3766gtf
19
20 =============================================================================
21 IRAP options (may be providedoverriden in the command line)
22
23
24 Mapper
25 mapper=
26
27
28 Quantification method
29 quant_method=
30
31
32 Dif expression method
33 Requires contrasts to be defined (see below)
41
iRAP model of configuration file
34 de_method=
35
36
37 Gene set enrichment (GSE) analysis
38 Requires de_method to be defined
39 Tool to use (none|piano)
40 gse_tool=piano
41
42 gse_method (mean|median|sum|fisher|fisher-exact|stouffer|tailStrength|wilcoxon|
reporter|page) see Piano vignete documentation for more details
43 gse_method=fisher
44 gse_pvalue=005
45 Minimum number of genes in a gene set
46 gse_minsize=3
47
48
49
50 TSV file with gene annotation
51 Format IDNamelocussourcelnameGOGOtermKEGG
52 Description
53 ID=gene_id (this is mandatory and should match the one given in the gtf file)
54 Name=gene name
55 locus=chrstart--end
56 source=biotype
57 lname=gene name
58 GO=go ids (multiple values can be separated by)
59 GO=GO terms (multiple values can be separated by)
60 KEGG=Kegg ids (multiple values can be separated by)
61 If auto is defined then iRAP will try to generate the file
62 - this may take a considerable amount of time and will only work
63 for a reduced number of species
64 off - default value
65 annot_tsv=
66
67
68 QC
69 Check data (reads) quality (on|off|none)
70 on - reads are filtered out based on their quality
71 off - the quality of the reads is assessed but no filtering is done
72 none- no quality control is performed
73 qual_filtering=on
74
75 Trim all reads to the minimum read size after quality trimming - Yes (y)| No (n)
76 only applicable if qual_filtering is on
77 trim_reads=y
78
79 Minimum base quality accepted (def 10)
80 min_read_quality=10
81
42
iRAP model of configuration file
82 Contamination check (cont_index parameter) Reads that likely
83 originate from organisms other than the one under study can be
84 discarded during pre-processment of the reads This is done by
85 aligning the reads to the genomes of organisms that might be a
86 source of contamination and discard those that map with a high
87 degree of fidelity By default iRAP will check if the data is
88 contaminated by e-coli An example to create a contamination
89 database is provided in the examplesex_add2contaminationDBsh
90 script The value of the parameter should be the file name prefix of
91 the bowtie index files
92
93 Disable contamination check
94 cont_index=no
95 Default value
96 cont_index=$(data_dir)contaminatione_coli
97
98
99 Misc options
100
101 Number of threads that may be used by IRAP
102 max_threads=1
103
104 Exon level quantification Yes (y)| No (n)
105 exon_quant=y
106
107 Transcript level quantification Yes (y)| No (n)
108 transcript_quant=y
109 =============================================================================
110 full or relative path to the directory where all the data can be found
111 data_dir=data
112
113 the directory should be organized as follows (see directory data in IRAP toplevel
directory)
114
115 $data_dir
116 $data_dir
117 contamination
118 e_coli1ebwt
119 e_coli2ebwt
120 e_coli3ebwt
121 e_coli4ebwt
122 e_coliREADME
123 e_colirev1ebwt
124 e_colirev2eb
125 raw_data
126 $species
127 fastq
128 fastq
129
43
iRAP model of configuration file
130 reference
131 $species
132 $gtf_file
133 $reference
134
135 Notes
136 1) $ denotes the value defined for the variable
137 2) Since version 050 the raw data (fastqbam) files may be
138 distributed across several sub-folders
139
140
141 =============================================================================
142 Only necessary if you intend to perform Differential Expression analysis
143
144 contrasts=contrast_def [contrast_def ]
145 contrasts=purpleVsPink purpleVsGrey
146
147 definition of each constrast
148 contrast= group group [ group ]
149 purlpleVsPink=Purple Pink
150 purlpleVsGrey=Purple Grey
151
152 groups
153 GroupName= Library_name [Library_name ]
154 Purlple=myLib1 myLib2
155 Pink=myLib3
156 Grey=myLib4
157
158 optional parameter used in the report (HTML) generation
159 groups=Purple Pink Grey
160
161 technical replicates
162 technicalreplicates=myLib1myLib2myLib3mylib4
163
164 Note names of groups contrasts and libraries should start with a letter and
contain only alphanumeric characters and the character _
165
166 =============================================================================
167 Data
168
169
170 Information for each library
171 LibName=Fastq file
172 Note
173 1 LibName should start with a letter and contain only alphanumeric characters
and the character _ LibName should not contain in _1 or _2
174 2 LibName should be different from the name of the fastq file for instance
175 f1=f1fastq
176 will produce an error
44
iRAP model of configuration file
177
178 Single-end
179 myLib1=f1fastq
180 read size
181 myLib1_rs=75
182 quality encoding (33 or 64)
183 myLib1_qual=33
184
185 strand specific protocol
186 mylib1_strand=first
187 mylib1_strand=second
188 Default value is both (strands)
189 mylib1_strand=both
190
191 Have the file in a different sub-folder
192 mylib1_dir=somesubfolder
193
194 See SAMBAM specification for more details about the following two parameters
195 read group id (to be included in the BAM file) - this is not supported by all
mappers
196 myLib1_rgid=
197 sambam header lines to include in the BAM file
198 myLib1_shl=COtThis is a commentnCOtand another line
199
200 LibName=Fastq file
201 myLib2=f2fastq
202 read size
203 myLib2_rs=75
204 quality encoding (33 or 64)
205 myLib2_qual=33
206
207
208 Paired-end
209 LibName=Fastq files
210 myLib3=f3_1fastq f3_2fastq
211 read size
212 myLib3_rs=50
213 quality encoding (33 or 64)
214 myLib3_qual=33
215 insert size
216 myLib3_ins=350
217 standard deviation
218 myLib3_sd=60
219
220 LibName=Fastq files
221 myLib4=f4_1fastq f4_2fastq
222 read size
223 myLib4_rs=50
224 quality encoding (33 or 64)
45
iRAP model of configuration file
225 myLib4_qual=33
226 insert size
227 myLib4_ins=350
228 standard deviation
229 myLib4_sd=60
230
231
232
233
234 list the names of your single-end (se) and paired (pe) libraries
235 se=myLib1 myLib2
236 pe=myLib3 myLib4
237 No SE data
238 se=
239 No PE data
240 pe=
241
242
243
244 Passingoverriding parameters
245
246 It is possible to pass parameters to the mappers and quantification
247 methods but that should be done carefully since it may break the
248 pipeline (if the location of the input andor output files is
249 changed)
250
251 Overridingchanging the mappersrsquo parameters
252 _map_options=options
253 Example
254 tophat2_map_options=--min-intron-length 5 --no-coverage-search
255
256 Overridingchanging the parameters of the quantification methods
257 _params=options
258 Example
259 htseq_params= -q
46
Appendix C
iRAP example configuration file
1 minimal configuration file for DE
2 experiment name
3 name=ecoli_ex
4 species
5 species=ecoli_k12
6 reference genome
7 reference=Escherichia_coli_str_k_12_substr_mg1655GCA_000005845119dnatoplevel
fagz
8 gtf file
9 gtf_file=Escherichia_coli_str_k_12_substr_mg1655GCA_000005845119gtfgz
10 Enable filtering based on quality
11 qual_filtering=on
12 Use a contamination data set to filter out reads
13 cont_index=no
14 Toplevel directory with the data
15 data_dir=
16
17 some contrasts
18 GA=Group A
19 contrasts=GAvsGB GBvsGA
20 GAvsGB=GA GB
21 GBvsGA=GB GA
22 GA=FA FB FC
23 GB=FD FE FF
24
25 se=FA FB FC FD FE FF
26
27 FA=SRR933983fastqgz
28 FA_rs=50
29 FA_qual=33
30
31 FB=SRR933984fastqgz
32 FB_rs=50
47
iRAP example configuration file
33 FB_qual=33
34
35 FC=SRR933985fastqgz
36 FC_rs=50
37 FC_qual=33
38
39 FD=SRR933989fastqgz
40 FD_rs=50
41 FD_qual=33
42
43 FE=SRR933990fastqgz
44 FE_rs=50
45 FE_qual=33
46
47 FF=SRR933990fastqgz
48 FF_rs=50
49 FF_qual=33
50 EOF
48
- Front Page
- Table of Contents
- List of Figures
- List of Tables
- 1 Introduction
-
- 11 Context
- 12 Motivation and Goals
- 13 Proposed Solution
- 14 Structure of the Dissertation
-
- 2 Basic Concepts and Bibliographic Review
-
- 21 Biological Basic Concepts
-
- 211 Genome
- 212 Transcriptome Assembly and Gene expression
-
- 22 RNA-Seq Analysis
-
- 221 RNA-Seq microarrays and DNA sequencing
- 222 RNA-Seq Pipeline
-
- 23 Standard File Formats used
-
- 231 FASTA
- 232 FASTQ
- 233 SAM and BAM
- 234 GFF and GTF
-
- 24 Relevant Data Repositories
- 25 Tools for RNA-seq and Differential Analysis
- 26 Relational and Non-relational Databases
- 27 Tecnologies
- 28 Related Work
- 29 Chapter Summary
-
- 3 The Gemini framework
-
- 31 Gemini
- 32 Gemini Architecture
-
- 321 Physical Architecture
-
- 33 Data Management
- 34 Web Interface
- 35 Use cases
- 36 Case studies
-
- 361 Full pipeline
- 362 Stage pipeline
-
- 37 Chapter Summary
-
- 4 Case study
-
- 41 Samples characterization
- 42 Researching objectives
- 43 Protocol of analysis
- 44 Genome version GRCh37 versus GRCh38
- 45 Fusion genes
- 46 Results
-
- 461 Case study with reference genome GRCh37
- 462 Splicing analysis
- 463 Case study with reference genome GRCh38
-
- 47 Chapter Summary
-
- 5 Conclusions and Future Work
- References
- A iRAP tools supported
-
- A1 Mappers
- A2 Quantification
- A3 Differential expression [DE]
- A4 Gene set enrichment analysis [GSE]
-
- B iRAP model of configuration file
- C iRAP example configuration file
-
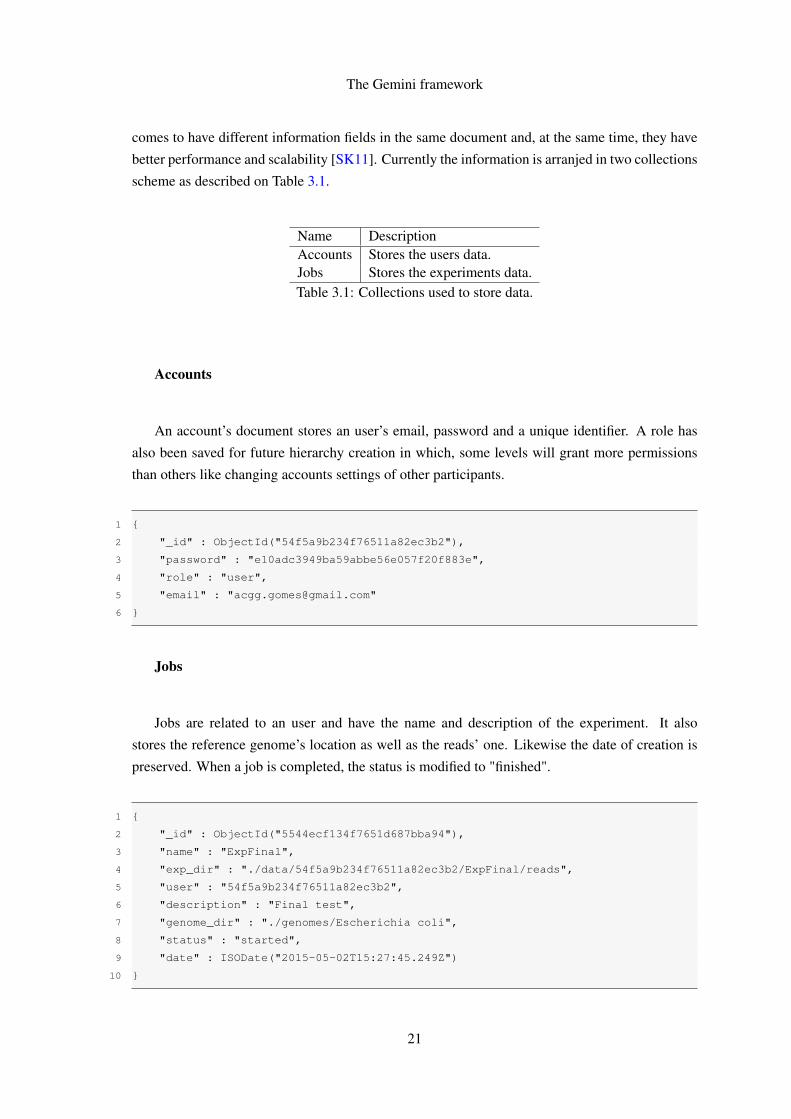
The Gemini framework
The main feature of the system is the create job (Figure 35) option that is easily accessible on
top menu When the user clicks on it a form is displayed with the variables to introduce on the
configuration file that iRAP needs A description option has been added to provide the freedom to
the researcher to include some extra information that he finds useful
Figure 35 Create job form
The same type of form was used for the reference genomes section (Figure 36) The user is
prompted to choose orderly the species name release number and version Afterwards a table of
elements appears allowing the expert to download the files found
Figure 36 Reference genomes component
24
The Gemini framework
35 Use cases
Gemini was designed to have only one actor the user that will accomplish the experiments This
actor has the possibility to register login and logout of his account create a job and the hability
to download a reference genome of his choice Even though not fully implemented it has been
considered the jobs done functionality
Figure 37 Use cases diagram
36 Case studies
Some case studies with e coli in order to test iRAPrsquos installation and its capabilities For both
of the case studies it has been collected six samples of Escherichia coli reads from European
Nucleotide Archive 3 and the corresponding reference genome and annotation file from Ensembl
361 Full pipeline
In order to call the full pipeline iRAP has been tested with the directive irap conf=ecoli_exconf
Configuration file (ecoli_exconf ) content is as described in Appendix C In this task the system
received the reads and performed the quality control (QC) mapping quantification and differential
expression between the two groups of samples
3ENA httpwwwebiacukena
25
The Gemini framework
This test has been accomplished successfully
362 Stage pipeline
The stage pipeline is a powerful functionality since it allows the user to choose a specific stage of
the pipeline that he wants to execute for his samples
Besides the fact that it is not easy to collect data samples users often want to repeat or analyse
just one step of the pipeline and take some conclusions of it Furthermore this type of pipeline is
less time consuming
A concrete usage example is IPATIMUPrsquos data which contains the output information of the
mapper TopHat and will be further analysed in detail in Chapter 4 Concerning this setup it would
not be possible to call the full pipeline but instead it would require a command specific command
option
For validation purposes the same bacteria from the previous analysis has been used for the
stage pipeline case After calling the setup command to check input the directive irap conf=
ecoli_exconf quality_filtering_and_reporting has been used to perform the stage1
of iRAP The platform was able to perform with success this task
37 Chapter Summary
It has been used Python with BottlePy for the main implementation of the interface of Gemini
MongoDB has been chosen for dealing with information A FTP server was mounted for the
transitions of data between the client and the server The platform allows the expert to call a full or
stage pipeline analysis and provides the download of both fast and annotation files The essential
items are setup for the addition of further functionalities
26
Chapter 4
Case study
In this chapter it is going to be presented the Case Study with data from samples of thyroid carci-
noma along with their charactering and researching results
After the development of an interface to the iRAP tool the following step was to do a case
study with some realistic DNA samples of thyroid cancer patients regarding the partnership with
IPATIMUPrsquos researchers
The purpose of this case study was to do some research of potential differences between dis-
tinct types of the disease In order to accomplish this four samples were collected from Centro
Hospitalar de Satildeo Joatildeo (Porto) Cases 1 and 2 have been categorized as a widely invasive Fol-
licular Thyroid Carcinoma (wFTC) and cases 3 and 4 as a minimally invasive Follicular Thyroid
Carcinoma (mFTC)
41 Samples characterization
Patient from case 1 was female with 82 years old the tumour measuring 2 cm of size and presented
a predominant follicular growth pattern and oncocytic features Patient from case 2 was male with
55 years old the tumour measuring 5 cm of size and presented a predominant solidtrabecular
growth pattern For the group of mFTC patient from case 3 was female 56 years old the tumour
measuring 37 cm of size and with follicular growth pattern patient from case 4 was female 56
years old the tumour measuring 4 cm of size and with follicular growth pattern
42 Researching objectives
The aim of the study was to answer the following questions
bull Differentially expressed genes
bull Total isoforms found either in percentange and in absolute
27
Case study
bull Average of alternative isoforms for each gene spliced
bull Potentially novel isoforms and how do they behave between samplesgroups of samples
bull Compare results between versions of human genome assembly
bull Retrieve fusion genes
43 Protocol of analysis
Collected sample reads have been aligned against reference genome GRCh37 with TopHat version
141 Posterior analysis followed Tuxedo Protocol as described in Trapnell et al [TRG+12b] An
overview of the full protocol can be found in Figure 41
For the implementation of this procedure it were considered as two different groups the cases
1 and 2 (wFTC) against cases 3 and 4 (mFTC) The following step was to assemble transcripts for
each sample with Cufflinks 1 and afterwards create a single merged transcriptome annotation with
Cuffmerge 2 Cuffdiff 3 was then used to find significant changes in transcript expression
In order to find potential isoforms each sample was ran against the reference genome with
Cuffcompare 4
44 Genome version GRCh37 versus GRCh38
Even though IPATIMUPrsquos data have been assembled with reference genome version GRCh37
nowadays a more recent version (GRCh38) has been released in 2013 This new assembly is the
first major revision of the human genome in more than four years 5
The main differences between this two versions are
Alternate sequences several human chromosomal regions have sufficient variability to prevent
adequate representation by a single sequence This new version provides alternate sequence
for selected variant regions through the inclusion of alternate loci 6 scaffolds
Centromere 7 representation Previous method of representing centromeric regions have been
replaced by sequences from centromere models The models provide the approximate repeat
number and order for each centromere and are useful for read mapping and variation studies
Mitochondrial genome The new mitochondrial reference sequence is the Revised Cambridge
Reference Sequence with RefSeq accession number NC_0129201 The previous one was
RefSeq accession number NC_001907 which was not updated when GRCh37 assembly
later transitioned to the new version1Cufflinks httpcole-trapnell-labgithubiocufflinks2Cuffmerge httpcole-trapnell-labgithubiocufflinkscuffmergeindexhtml3Cuffdiff httpcole-trapnell-labgithubiocufflinkscuffdiffindexhtml4Cuffcompare httpcole-trapnell-labgithubiocufflinkscuffcompareindexhtml5As in UCSC mailing list at httpsgroupsgooglecomasoeucsceduforumtopic
genome-announce52Kv41YBXNY6Specific location of a gene on a chromosome
28
Case study
Figure 41 An overview of the Tuxedo Protocol with full steps TopHat for alignment Cufflinkspackage to find differential features between group samples and in the end CummeRbund to plotprevious results
Sequence updates Several erroneous bases and misassembled regions have been corrected and
more than 100 gaps have been filled or reduced
Analysis set The new assembly offers an analysis set that was created to accommodate next
generation sequencing read alignment pipelines Several GRCh38 regions have been elimi-
nated from this set to improve read mapping
29
Case study
45 Fusion genes
After we done some research on the technologies used for finding fusion genes in the reads we
have not been able to perform the analysis to answer the last question of our researching objectives
DeFuse required as input the original reads which were not provided This analysis would have
been interesting for relating the ocurrence of thyroid and the presence of fusion genes as well as if
there was any relevant difference between the samples of wFTC and mFTC
46 Results
461 Case study with reference genome GRCh37
The following table ( 41) demonstrates some genes that were differentially expressed with signif-
icance between mFTC and wFTC According to Celestino et al 8 CRABP1 C1QL1 and LCN2
are biomarkers of thyroid cancer and predictors of extrathyroidal extension It is commonly used
the value of 005 has threshold above which the differential expression is significant By inspect-
ing out the table we can find C1QL1 with a q-value of 0000555 and CRABP1 with a q-value
of 159E-11 which are in concordance with the previous article Furthermore it is verified the
increased gene expression in wFTC when compared to mFTC
Gene ID Gene Chr mFTC wFTC Fold change(log2) Q value
ENSG00000167748 KLK1 19 018672 111924 922742 0ENSG00000104725 NEFL 8 00196645 276961 104599 0ENSG00000174145 KIAA1239 4 00307388 144265 887444 0ENSG00000182379 NXPH4 12 008307 195786 788074 0ENSG00000131094 C1QL1 17 0121453 238957 429828 0000555ENSG00000142677 IL22RAI 1 150905 0384783 -529345 0ENSG00000138615 CILP 15 423569 0052726 -632793 241E-11ENSG00000141431 ASXL3 18 18938 001408 -707148 124E-09ENSG00000166426 CRABP1 15 748375 0367899 -766831 159E-11ENSG00000214145 LINC00887 3 19797 0119327 -737421 0000459
Table 41 Genes differentially expressed between minimally invasive follicular thryoid carcino-mas (mFTCs) and widely invasive follicular thyroid carcinomas (wFTCs)
In response to the previous researching objectives the Table 42 has the statistical results for
taks two and three From the data analysis we could conclude that less than 1 of genes have
isoforms but each one has an average of 389 alternatives
8Ricardo Celestino Torfin Nome Ana Pestana Andreas M Hoff Pedro A Gonccedilalves Catarina Eloy Eva SigstadRagnhild A Lothe Trine Bjoslashro Manuel Sobrinho-Simotildees Rofl I Skotheim Paula Soares CRAPBP1 C1QL1 andLCN2 are biomarkers of thyroid cancer and predictors of extrathyroidal extension subbmited for publication
30
Case study
Total genes 63896Total significant isoforms 689Total unique genes with isoforms 179Ratio of unique genes with isoformsgenes () 028Average of alternatives per gene with isoforms 389
Table 42 Statistical results for researching objectives number 2 and 3
462 Splicing analysis
Forward in the analysis Cuffcompare 9 has been used to search for novel isoforms when com-
pared to the reference genome The method was to compare each sample to the reference genome
and afterwards make an overlap of the results The main objective was then to infer about the
differences among wFTC and mFTC
Sample 1(wFTC)
Sample 2(wFTC)
Sample 3(mFTC)
Sample 4(mFTC)
Total genes 30440 36862 35539 37534Potential novel isoforms 7406 8450 8781 8830Table 43 Potential novel isoforms for each sample of IPATIMUPrsquos data
As demonstrated on Table 43 average there is a percentage of 24 of potentially novel iso-
forms found (at least one spliced junction is shared with a reference transcript) There is been
made an overlap of the results in order to encounter differences between wFTC and mFTC The
Table 44 presents the counting of differences between cases A brief analysis allows us to say
that we can not make any relationship between wFTC and mFTC On average there was a total of
3722 changes among this two sets The average within the sets are 3554 for wFTC and 3992 for
mFTC Given this results there was not a significant divergence to allow us to relate the splicing
and the occurrence of a more invasive Thyroid Carcinoma
Sets ChangesS1 S2 3554S1 S3 3609S1 S4 3612S2 S3 3847S2 S4 3820S3 S4 3929
Table 44 Number of differences between samples Syntax used S1 - Sample 1 S2 - Sample 2S3 - Sample 3 and S4 - Sample 4
9Cuffcompare httpcole-trapnell-labgithubiocufflinkscuffcompareindexhtml
31
Case study
463 Case study with reference genome GRCh38
In order to respond to the last research objective it has been applied the method of analysis has
before with a more recent human genome assembly After using the same protocol with Cufflinks
Cuffmerge and Cuffdiff sequentially we have come to some conclusions
The produced results of differential expression analysis for the same genes were very different
Genes that were highly significant before like C1QL1 and CRABP1 now had no relevance (q-
value gt 005) As mentioned before we had only access to TopHatrsquos output that used version
GRCh37 for the alignment and mapping process so we could not start from scratch the analysis
This outcome demonstrates two topics in particular
1 the introduction of novel annotations can make previous analysis outdated
2 there is the need to save the original reads in order to update earlier studies
The solution to this situation would have been to use the original reads to repeat the assembly
and then follow the Tuxedo protocol to collected correct and updated differential expression data
47 Chapter Summary
These section of development has been introduced in order to confer not only validation but also
to do some researching studies on the subject Four samples were collected and divided into two
distinct groups Tuxedo protocol was followed for responding to the research objectives The
case study for GRCh37 demonstrated the expression of C1QL1 and CRABP1 on wFTC when
compared to mFTC as indicated in the referred article On the other hand the same protocol when
applied with GRCh38 demonstrated the importance of saving the original reads and what is the
influence of newer releases in previous researching results Lastly the splicing analysis results did
not show any evidence of related isoforms count and the manifestation of the different stages of
the disease
32
Chapter 5
Conclusions and Future Work
The research of genomic-based cancers require highly complex data analysis Such analysis re-
quire most often the use of a large number of complex computational resources the gathering
of a lot of information over the Internet and the use of powerful computational resources Fur-
thermore the manipulation of the computational tools and resources require the assistance of an
informatics expert
The thesis work is a contribution towards the solution of the above mention problem We
propose and developed a framework that enables an expert biologist to perform genomic-based
complex analysis in a easy way and using the required powerful computational resources in a
transparent way
Using the developed framework we have used real data to address several research questions
provided by IPATIMUPrsquos researchers Firstly with the human genome GRCh37 we identified
two of the biomarkers of thyroid cancer by differential gene expression analysis Secondly we
found 689 significant isoforms 179 unique out of 63896 genes (ratio of 028) with an average
of 389 isoforms per gene Thirdly when trying to determine potential novel isoforms we came
at no conclusion of the differences of expression when comparing wFTC and mFTC The last
case was applying the Tuxedo protocol with the new GRCh38 on samples The outcome of the
experiment revealed the importance of saving the original reads and that newer releases become
previous analysis outdated
Future Work
This thesis work is just a starting point As stated before the framework was designed so it can be
extended with further modules to enable addressing other research questions
The case studies also showed us that RNA-seq analysis is very time consuming On the other
hand there are a lot of sub-tasks that can be run in parallel (like the task of aligning the reads)
33
Conclusions and Future Work
We will study and compare different techniques and opportunities to make RNA-seq in parallel as
much as possible
34
References
[bNE] Scitable by Nature Education Transcriptome available at httpwwwnaturecomscitabledefinitiontranscriptome-296 last accessJanuary 2015
[CAB+15] Fiona Cunningham M Ridwan Amode Daniel Barrell Kathryn Beal Konstanti-nos Billis Simon Brent Denise Carvalho-Silva Peter Clapham Guy CoatesStephen Fitzgerald Laurent Gil Carlos Garciacutea Giroacuten Leo Gordon ThibautHourlier Sarah E Hunt Sophie H Janacek Nathan Johnson Thomas Juette-mann Andreas K Kaumlhaumlri Stephen Keenan Fergal J Martin Thomas MaurelWilliam McLaren Daniel N Murphy Rishi Nag Bert Overduin Anne ParkerMateus Patricio Emily Perry Miguel Pignatelli Harpreet Singh Riat DanielSheppard Kieron Taylor Anja Thormann Alessandro Vullo Steven P WilderAmonida Zadissa Bronwen L Aken Ewan Birney Jennifer Harrow Rhoda Kin-sella Matthieu Muffato Magali Ruffier Stephen MJ Searle Giulietta SpudichStephen J Trevanion Andy Yates Daniel R Zerbino and Paul Flicek Ensembl2015 Nucleic Acids Research 43(D1)D662ndashD669 2015
[CFG+10] Peter J A Cock Christopher J Fields Naohisa Goto Michael L Heuer and Peter MRice The Sanger FASTQ file format for sequences with quality scores and theSolexaIllumina FASTQ variants Nucleic acids research 38(6)1767ndash71 April2010
[CH07] Geoffrey M Cooper and Robert E Hausman The Cell - A molecular approachAmerican Society for Microbiology 2007
[Cod70] E F Codd A relational model of data for large shared data banks Communica-tions of the ACM 13(6)377ndash387 June 1970
[Con11] The ENCODE Project Consortium A userrsquos guide to the encyclopedia of DNAelements (ENCODE) PLoS biology 9(4)e1001046 April 2011
[FMB14] N A Fonseca J A Marioni and A Brazma RNA-seq gene profiling - a system-atic empirical comparison Technical report May 2014
[FPMB14] Nuno A Fonseca Robert Petryszak John Marioni and Alvis Brazma irap - anintegrated rna-seq analysis pipeline bioRxiv 2014
[GCW+10] Qiang Gan Iouri Chepelev Gang Wei Lama Tarayrah Kairong Cui Keji Zhaoand Xin Chen Dynamic regulation of alternative splicing and chromatin structurein Drosophila gonads revealed by RNA-seq Cell research 20(7)763ndash83 July2010
35
REFERENCES
[GEN] GENIE Dna genes and chromossomes University of Leicesteravailable at httpwww2leacukdepartmentsgeneticsvgecschoolscollegestopicsdna-genes-chromosomes last access Jan-uary 2015
[Gri] Malachi Griffith Bioinformatics for Cancer Genomics (BiCG)available at httpbioinformaticscaworkshops2012bioinformatics-cancer-genomics-bicg last access January 2015
[GTBK11] Angela Goncalves Andrew Tikhonov Alvis Brazma and Misha Kapushesky Apipeline for RNA-seq data processing and quality assessment Bioinformatics (Ox-ford England) 27(6)867ndash9 March 2011
[HBB+02] T Hubbard D Barker E Birney G Cameron Y Chen L Clark T CoxJ Cuff V Curwen T Down R Durbin E Eyras J Gilbert M HammondL Huminiecki A Kasprzyk H Lehvaslaiho P Lijnzaad C Melsopp E Mon-gin R Pettett M Pocock S Potter A Rust E Schmidt S Searle G SlaterJ Smith W Spooner A Stabenau J Stalker E Stupka A Ureta-Vidal I Vastrikand M Clamp The ensembl genome database project Nucleic Acids Research30(1)38ndash41 2002
[HBD+13] R Hitzemann D Bottomly P Darakjian N Walter O Iancu R SearlesB Wilmot and S McWeeney Genes behavior and next-generation RNA se-quencing Genes Brain Behav 12(1)1ndash12 Feb 2013
[Ins] National Human Genome Research Institute Transcriptome available at httpwwwgenomegov13014330 last access January 2015
[Joh03] Jason M Johnson Genome-wide survey of human alternative pre-mrna splicingwith exon junction microarrays Science 3022141ndash2144 December 2003
[kn10] Gene set enrichment a problem of pathways Briefings in functional genomics9(5-6)385ndash90 December 2010
[kn11] Overview of available methods for diverse RNA-Seq data analyses Science ChinaLife sciences 54(12)1121ndash8 December 2011
[Lan10] Ben Langmead Aligning short sequencing reads with Bowtie Current proto-cols in bioinformatics editoral board Andreas D Baxevanis [et al] Chapter11Unit 117 December 2010
[LM10] Adam Lith and Jakob Mattsson Investigating storage solutions for large data - acomparison of well performing and scalable data storage solutions for real timeextraction and batch insertion of data Masterrsquos thesis 2010
[LTPS09] Ben Langmead Cole Trapnell Mihai Pop and Steven L Salzberg Ultrafastand memory-efficient alignment of short DNA sequences to the human genomeGenome biology 10(3)R25 January 2009
[ORY10] Alicia Oshlack Mark D Robinson and Matthew D Young From RNA-seq readsto differential expression results Genome biology 11(12)220 January 2010
[SG15] Marc W Schmid and Ueli Grossniklaus Rcount simple and flexible RNA-Seqread counting Bioinformatics 31(3)436ndash437 February 2015
36
REFERENCES
[SK11] Christof Strauch and Walter Kriha NoSQL databases Lecture Notes StuttgartMedia University February 2011
[SOdMVN12] Mikhail Shugay Intildeigo Ortiz de Mendiacutebil Joseacute L Vizmanos and Francisco JNovo Genomic hallmarks of genes involved in chromosomal translocations inhematological cancer PLoS Comput Biol 8(12)e1002797 12 2012
[The04] The ENCODE Project Consortium The ENCODE (ENCyclopedia Of DNA Ele-ments) Project Science (New York NY) 306(5696)636ndash40 October 2004
[TPS09] Cole Trapnell Lior Pachter and Steven L Salzberg TopHat discovering splicejunctions with RNA-Seq Bioinformatics (Oxford England) 25(9)1105ndash11 May2009
[TRG+12a] Cole Trapnell Adam Roberts Loyal Goff Geo Pertea Daehwan Kim David RKelley Harold Pimentel Steven L Salzberg John L Rinn and Lior Pachter Dif-ferential gene and transcript expression analysis of RNA-seq experiments withTopHat and Cufflinks Nature protocols 7(3)562ndash78 March 2012
[TRG+12b] Cole Trapnell Adam Roberts Loyal Goff Geo Pertea Daehwan Kim David RKelley Harold Pimentel Steven L Salzberg John L Rinn and Lior Pachter Dif-ferential gene and transcript expression analysis of RNA-seq experiments withTopHat and Cufflinks Nature protocols 7(3)562ndash78 March 2012
[WMM+11] Ying Wang Gaurang Mehta Rajiv Mayani Jingxi Lu Tade Souaiaia YanghoChen Andrew Clark Hee Jae Yoon Lin Wan Oleg V Evgrafov James AKnowles Ewa Deelman and Ting Chen RseqFlow workflows for RNA-Seq dataanalysis Bioinformatics (Oxford England) 27(18)2598ndash600 September 2011
[Wol13] Jochen B W Wolf Principles of transcriptome analysis and gene expressionquantification an rna-seq tutorial Molecular Ecology Resources 13(4)559ndash5722013
[ZW09] Mark Gerstein |amp Michael Snyder Zhong Wang Rna-seq a revolutionary tool fortranscriptomics Nature Reviews Genetics 1057ndash63 January 2009
37
REFERENCES
38
Appendix A
iRAP tools supported
A1 Mappers
Mapper Option name (mapper)TopHat 1 tophat1TopHat 2 tophat2SMALT smaltGSNAP gsnapSOAPsplice soapspliceBWA bwa1BWA bwa2Bowtie 1 bowtie1Bowtie2 bowtie2GEM gemSTAR starOSA osaMapSplice mapsplice
A2 Quantification
Quantifier Option name (quant_method)FluxCapacitor flux_capHT-Seq (union mode) htseq1HT-Seq (intersection non-empty mode) htseq2Cufflinks 1 (try to find novel transcripts-g) cufflinks1Cufflinks 2 (try to find novel transcripts-g) cufflinks2Cufflinks 1 (do not assemble novel transcripts-G) cufflinks1_ndCufflinks 2 (do not assemble novel transcripts-G) cufflinks2_ndNURD nurd
39
iRAP tools supported
A3 Differential expression [DE]
Method Option name (de_method)DESeq deseqDESeq2 deseq2EdgeR edgerCuffdiff 1 cuffdiff1Cuffdiff 2 cuffdiff2
A4 Gene set enrichment analysis [GSE]
Tool Option name (gse_tool)Piano piano
40
Appendix B
iRAP model of configuration file
1 This is a comment (lines that start with a are ignored by iRAP)
2 =============================================================================
3 name that you want to give to the experiment (no spaces)
4 All files produced by irap will be placed in a folder with the given name
5 name=myexp
6
7
8 =============================================================================
9 name of the species
10 species=homo_sapiens
11
12 =============================================================================
13 Fasta file with the reference genome
14 reference=Homo_sapiensGRCh3766dnafa
15
16 =============================================================================
17 GTF file with the annotations
18 gtf_file=Homo_sapiensGRCh3766gtf
19
20 =============================================================================
21 IRAP options (may be providedoverriden in the command line)
22
23
24 Mapper
25 mapper=
26
27
28 Quantification method
29 quant_method=
30
31
32 Dif expression method
33 Requires contrasts to be defined (see below)
41
iRAP model of configuration file
34 de_method=
35
36
37 Gene set enrichment (GSE) analysis
38 Requires de_method to be defined
39 Tool to use (none|piano)
40 gse_tool=piano
41
42 gse_method (mean|median|sum|fisher|fisher-exact|stouffer|tailStrength|wilcoxon|
reporter|page) see Piano vignete documentation for more details
43 gse_method=fisher
44 gse_pvalue=005
45 Minimum number of genes in a gene set
46 gse_minsize=3
47
48
49
50 TSV file with gene annotation
51 Format IDNamelocussourcelnameGOGOtermKEGG
52 Description
53 ID=gene_id (this is mandatory and should match the one given in the gtf file)
54 Name=gene name
55 locus=chrstart--end
56 source=biotype
57 lname=gene name
58 GO=go ids (multiple values can be separated by)
59 GO=GO terms (multiple values can be separated by)
60 KEGG=Kegg ids (multiple values can be separated by)
61 If auto is defined then iRAP will try to generate the file
62 - this may take a considerable amount of time and will only work
63 for a reduced number of species
64 off - default value
65 annot_tsv=
66
67
68 QC
69 Check data (reads) quality (on|off|none)
70 on - reads are filtered out based on their quality
71 off - the quality of the reads is assessed but no filtering is done
72 none- no quality control is performed
73 qual_filtering=on
74
75 Trim all reads to the minimum read size after quality trimming - Yes (y)| No (n)
76 only applicable if qual_filtering is on
77 trim_reads=y
78
79 Minimum base quality accepted (def 10)
80 min_read_quality=10
81
42
iRAP model of configuration file
82 Contamination check (cont_index parameter) Reads that likely
83 originate from organisms other than the one under study can be
84 discarded during pre-processment of the reads This is done by
85 aligning the reads to the genomes of organisms that might be a
86 source of contamination and discard those that map with a high
87 degree of fidelity By default iRAP will check if the data is
88 contaminated by e-coli An example to create a contamination
89 database is provided in the examplesex_add2contaminationDBsh
90 script The value of the parameter should be the file name prefix of
91 the bowtie index files
92
93 Disable contamination check
94 cont_index=no
95 Default value
96 cont_index=$(data_dir)contaminatione_coli
97
98
99 Misc options
100
101 Number of threads that may be used by IRAP
102 max_threads=1
103
104 Exon level quantification Yes (y)| No (n)
105 exon_quant=y
106
107 Transcript level quantification Yes (y)| No (n)
108 transcript_quant=y
109 =============================================================================
110 full or relative path to the directory where all the data can be found
111 data_dir=data
112
113 the directory should be organized as follows (see directory data in IRAP toplevel
directory)
114
115 $data_dir
116 $data_dir
117 contamination
118 e_coli1ebwt
119 e_coli2ebwt
120 e_coli3ebwt
121 e_coli4ebwt
122 e_coliREADME
123 e_colirev1ebwt
124 e_colirev2eb
125 raw_data
126 $species
127 fastq
128 fastq
129
43
iRAP model of configuration file
130 reference
131 $species
132 $gtf_file
133 $reference
134
135 Notes
136 1) $ denotes the value defined for the variable
137 2) Since version 050 the raw data (fastqbam) files may be
138 distributed across several sub-folders
139
140
141 =============================================================================
142 Only necessary if you intend to perform Differential Expression analysis
143
144 contrasts=contrast_def [contrast_def ]
145 contrasts=purpleVsPink purpleVsGrey
146
147 definition of each constrast
148 contrast= group group [ group ]
149 purlpleVsPink=Purple Pink
150 purlpleVsGrey=Purple Grey
151
152 groups
153 GroupName= Library_name [Library_name ]
154 Purlple=myLib1 myLib2
155 Pink=myLib3
156 Grey=myLib4
157
158 optional parameter used in the report (HTML) generation
159 groups=Purple Pink Grey
160
161 technical replicates
162 technicalreplicates=myLib1myLib2myLib3mylib4
163
164 Note names of groups contrasts and libraries should start with a letter and
contain only alphanumeric characters and the character _
165
166 =============================================================================
167 Data
168
169
170 Information for each library
171 LibName=Fastq file
172 Note
173 1 LibName should start with a letter and contain only alphanumeric characters
and the character _ LibName should not contain in _1 or _2
174 2 LibName should be different from the name of the fastq file for instance
175 f1=f1fastq
176 will produce an error
44
iRAP model of configuration file
177
178 Single-end
179 myLib1=f1fastq
180 read size
181 myLib1_rs=75
182 quality encoding (33 or 64)
183 myLib1_qual=33
184
185 strand specific protocol
186 mylib1_strand=first
187 mylib1_strand=second
188 Default value is both (strands)
189 mylib1_strand=both
190
191 Have the file in a different sub-folder
192 mylib1_dir=somesubfolder
193
194 See SAMBAM specification for more details about the following two parameters
195 read group id (to be included in the BAM file) - this is not supported by all
mappers
196 myLib1_rgid=
197 sambam header lines to include in the BAM file
198 myLib1_shl=COtThis is a commentnCOtand another line
199
200 LibName=Fastq file
201 myLib2=f2fastq
202 read size
203 myLib2_rs=75
204 quality encoding (33 or 64)
205 myLib2_qual=33
206
207
208 Paired-end
209 LibName=Fastq files
210 myLib3=f3_1fastq f3_2fastq
211 read size
212 myLib3_rs=50
213 quality encoding (33 or 64)
214 myLib3_qual=33
215 insert size
216 myLib3_ins=350
217 standard deviation
218 myLib3_sd=60
219
220 LibName=Fastq files
221 myLib4=f4_1fastq f4_2fastq
222 read size
223 myLib4_rs=50
224 quality encoding (33 or 64)
45
iRAP model of configuration file
225 myLib4_qual=33
226 insert size
227 myLib4_ins=350
228 standard deviation
229 myLib4_sd=60
230
231
232
233
234 list the names of your single-end (se) and paired (pe) libraries
235 se=myLib1 myLib2
236 pe=myLib3 myLib4
237 No SE data
238 se=
239 No PE data
240 pe=
241
242
243
244 Passingoverriding parameters
245
246 It is possible to pass parameters to the mappers and quantification
247 methods but that should be done carefully since it may break the
248 pipeline (if the location of the input andor output files is
249 changed)
250
251 Overridingchanging the mappersrsquo parameters
252 _map_options=options
253 Example
254 tophat2_map_options=--min-intron-length 5 --no-coverage-search
255
256 Overridingchanging the parameters of the quantification methods
257 _params=options
258 Example
259 htseq_params= -q
46
Appendix C
iRAP example configuration file
1 minimal configuration file for DE
2 experiment name
3 name=ecoli_ex
4 species
5 species=ecoli_k12
6 reference genome
7 reference=Escherichia_coli_str_k_12_substr_mg1655GCA_000005845119dnatoplevel
fagz
8 gtf file
9 gtf_file=Escherichia_coli_str_k_12_substr_mg1655GCA_000005845119gtfgz
10 Enable filtering based on quality
11 qual_filtering=on
12 Use a contamination data set to filter out reads
13 cont_index=no
14 Toplevel directory with the data
15 data_dir=
16
17 some contrasts
18 GA=Group A
19 contrasts=GAvsGB GBvsGA
20 GAvsGB=GA GB
21 GBvsGA=GB GA
22 GA=FA FB FC
23 GB=FD FE FF
24
25 se=FA FB FC FD FE FF
26
27 FA=SRR933983fastqgz
28 FA_rs=50
29 FA_qual=33
30
31 FB=SRR933984fastqgz
32 FB_rs=50
47
iRAP example configuration file
33 FB_qual=33
34
35 FC=SRR933985fastqgz
36 FC_rs=50
37 FC_qual=33
38
39 FD=SRR933989fastqgz
40 FD_rs=50
41 FD_qual=33
42
43 FE=SRR933990fastqgz
44 FE_rs=50
45 FE_qual=33
46
47 FF=SRR933990fastqgz
48 FF_rs=50
49 FF_qual=33
50 EOF
48
- Front Page
- Table of Contents
- List of Figures
- List of Tables
- 1 Introduction
-
- 11 Context
- 12 Motivation and Goals
- 13 Proposed Solution
- 14 Structure of the Dissertation
-
- 2 Basic Concepts and Bibliographic Review
-
- 21 Biological Basic Concepts
-
- 211 Genome
- 212 Transcriptome Assembly and Gene expression
-
- 22 RNA-Seq Analysis
-
- 221 RNA-Seq microarrays and DNA sequencing
- 222 RNA-Seq Pipeline
-
- 23 Standard File Formats used
-
- 231 FASTA
- 232 FASTQ
- 233 SAM and BAM
- 234 GFF and GTF
-
- 24 Relevant Data Repositories
- 25 Tools for RNA-seq and Differential Analysis
- 26 Relational and Non-relational Databases
- 27 Tecnologies
- 28 Related Work
- 29 Chapter Summary
-
- 3 The Gemini framework
-
- 31 Gemini
- 32 Gemini Architecture
-
- 321 Physical Architecture
-
- 33 Data Management
- 34 Web Interface
- 35 Use cases
- 36 Case studies
-
- 361 Full pipeline
- 362 Stage pipeline
-
- 37 Chapter Summary
-
- 4 Case study
-
- 41 Samples characterization
- 42 Researching objectives
- 43 Protocol of analysis
- 44 Genome version GRCh37 versus GRCh38
- 45 Fusion genes
- 46 Results
-
- 461 Case study with reference genome GRCh37
- 462 Splicing analysis
- 463 Case study with reference genome GRCh38
-
- 47 Chapter Summary
-
- 5 Conclusions and Future Work
- References
- A iRAP tools supported
-
- A1 Mappers
- A2 Quantification
- A3 Differential expression [DE]
- A4 Gene set enrichment analysis [GSE]
-
- B iRAP model of configuration file
- C iRAP example configuration file
-
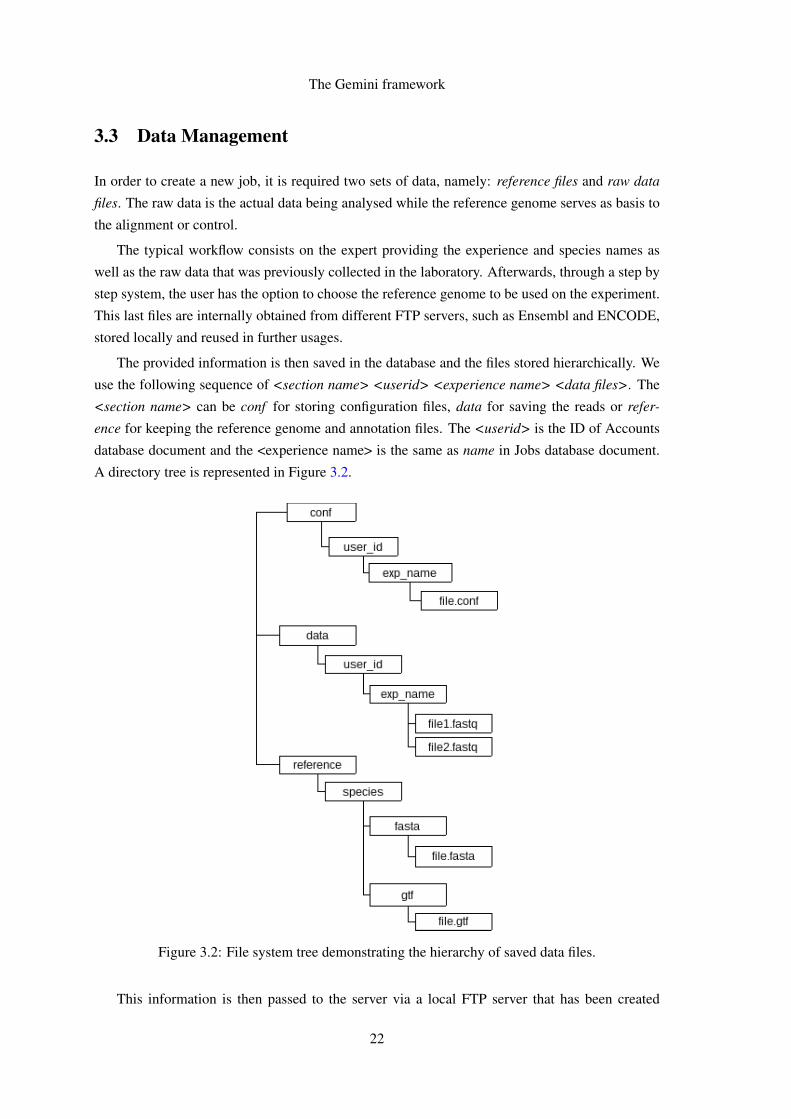
The Gemini framework
35 Use cases
Gemini was designed to have only one actor the user that will accomplish the experiments This
actor has the possibility to register login and logout of his account create a job and the hability
to download a reference genome of his choice Even though not fully implemented it has been
considered the jobs done functionality
Figure 37 Use cases diagram
36 Case studies
Some case studies with e coli in order to test iRAPrsquos installation and its capabilities For both
of the case studies it has been collected six samples of Escherichia coli reads from European
Nucleotide Archive 3 and the corresponding reference genome and annotation file from Ensembl
361 Full pipeline
In order to call the full pipeline iRAP has been tested with the directive irap conf=ecoli_exconf
Configuration file (ecoli_exconf ) content is as described in Appendix C In this task the system
received the reads and performed the quality control (QC) mapping quantification and differential
expression between the two groups of samples
3ENA httpwwwebiacukena
25
The Gemini framework
This test has been accomplished successfully
362 Stage pipeline
The stage pipeline is a powerful functionality since it allows the user to choose a specific stage of
the pipeline that he wants to execute for his samples
Besides the fact that it is not easy to collect data samples users often want to repeat or analyse
just one step of the pipeline and take some conclusions of it Furthermore this type of pipeline is
less time consuming
A concrete usage example is IPATIMUPrsquos data which contains the output information of the
mapper TopHat and will be further analysed in detail in Chapter 4 Concerning this setup it would
not be possible to call the full pipeline but instead it would require a command specific command
option
For validation purposes the same bacteria from the previous analysis has been used for the
stage pipeline case After calling the setup command to check input the directive irap conf=
ecoli_exconf quality_filtering_and_reporting has been used to perform the stage1
of iRAP The platform was able to perform with success this task
37 Chapter Summary
It has been used Python with BottlePy for the main implementation of the interface of Gemini
MongoDB has been chosen for dealing with information A FTP server was mounted for the
transitions of data between the client and the server The platform allows the expert to call a full or
stage pipeline analysis and provides the download of both fast and annotation files The essential
items are setup for the addition of further functionalities
26
Chapter 4
Case study
In this chapter it is going to be presented the Case Study with data from samples of thyroid carci-
noma along with their charactering and researching results
After the development of an interface to the iRAP tool the following step was to do a case
study with some realistic DNA samples of thyroid cancer patients regarding the partnership with
IPATIMUPrsquos researchers
The purpose of this case study was to do some research of potential differences between dis-
tinct types of the disease In order to accomplish this four samples were collected from Centro
Hospitalar de Satildeo Joatildeo (Porto) Cases 1 and 2 have been categorized as a widely invasive Fol-
licular Thyroid Carcinoma (wFTC) and cases 3 and 4 as a minimally invasive Follicular Thyroid
Carcinoma (mFTC)
41 Samples characterization
Patient from case 1 was female with 82 years old the tumour measuring 2 cm of size and presented
a predominant follicular growth pattern and oncocytic features Patient from case 2 was male with
55 years old the tumour measuring 5 cm of size and presented a predominant solidtrabecular
growth pattern For the group of mFTC patient from case 3 was female 56 years old the tumour
measuring 37 cm of size and with follicular growth pattern patient from case 4 was female 56
years old the tumour measuring 4 cm of size and with follicular growth pattern
42 Researching objectives
The aim of the study was to answer the following questions
bull Differentially expressed genes
bull Total isoforms found either in percentange and in absolute
27
Case study
bull Average of alternative isoforms for each gene spliced
bull Potentially novel isoforms and how do they behave between samplesgroups of samples
bull Compare results between versions of human genome assembly
bull Retrieve fusion genes
43 Protocol of analysis
Collected sample reads have been aligned against reference genome GRCh37 with TopHat version
141 Posterior analysis followed Tuxedo Protocol as described in Trapnell et al [TRG+12b] An
overview of the full protocol can be found in Figure 41
For the implementation of this procedure it were considered as two different groups the cases
1 and 2 (wFTC) against cases 3 and 4 (mFTC) The following step was to assemble transcripts for
each sample with Cufflinks 1 and afterwards create a single merged transcriptome annotation with
Cuffmerge 2 Cuffdiff 3 was then used to find significant changes in transcript expression
In order to find potential isoforms each sample was ran against the reference genome with
Cuffcompare 4
44 Genome version GRCh37 versus GRCh38
Even though IPATIMUPrsquos data have been assembled with reference genome version GRCh37
nowadays a more recent version (GRCh38) has been released in 2013 This new assembly is the
first major revision of the human genome in more than four years 5
The main differences between this two versions are
Alternate sequences several human chromosomal regions have sufficient variability to prevent
adequate representation by a single sequence This new version provides alternate sequence
for selected variant regions through the inclusion of alternate loci 6 scaffolds
Centromere 7 representation Previous method of representing centromeric regions have been
replaced by sequences from centromere models The models provide the approximate repeat
number and order for each centromere and are useful for read mapping and variation studies
Mitochondrial genome The new mitochondrial reference sequence is the Revised Cambridge
Reference Sequence with RefSeq accession number NC_0129201 The previous one was
RefSeq accession number NC_001907 which was not updated when GRCh37 assembly
later transitioned to the new version1Cufflinks httpcole-trapnell-labgithubiocufflinks2Cuffmerge httpcole-trapnell-labgithubiocufflinkscuffmergeindexhtml3Cuffdiff httpcole-trapnell-labgithubiocufflinkscuffdiffindexhtml4Cuffcompare httpcole-trapnell-labgithubiocufflinkscuffcompareindexhtml5As in UCSC mailing list at httpsgroupsgooglecomasoeucsceduforumtopic
genome-announce52Kv41YBXNY6Specific location of a gene on a chromosome
28
Case study
Figure 41 An overview of the Tuxedo Protocol with full steps TopHat for alignment Cufflinkspackage to find differential features between group samples and in the end CummeRbund to plotprevious results
Sequence updates Several erroneous bases and misassembled regions have been corrected and
more than 100 gaps have been filled or reduced
Analysis set The new assembly offers an analysis set that was created to accommodate next
generation sequencing read alignment pipelines Several GRCh38 regions have been elimi-
nated from this set to improve read mapping
29
Case study
45 Fusion genes
After we done some research on the technologies used for finding fusion genes in the reads we
have not been able to perform the analysis to answer the last question of our researching objectives
DeFuse required as input the original reads which were not provided This analysis would have
been interesting for relating the ocurrence of thyroid and the presence of fusion genes as well as if
there was any relevant difference between the samples of wFTC and mFTC
46 Results
461 Case study with reference genome GRCh37
The following table ( 41) demonstrates some genes that were differentially expressed with signif-
icance between mFTC and wFTC According to Celestino et al 8 CRABP1 C1QL1 and LCN2
are biomarkers of thyroid cancer and predictors of extrathyroidal extension It is commonly used
the value of 005 has threshold above which the differential expression is significant By inspect-
ing out the table we can find C1QL1 with a q-value of 0000555 and CRABP1 with a q-value
of 159E-11 which are in concordance with the previous article Furthermore it is verified the
increased gene expression in wFTC when compared to mFTC
Gene ID Gene Chr mFTC wFTC Fold change(log2) Q value
ENSG00000167748 KLK1 19 018672 111924 922742 0ENSG00000104725 NEFL 8 00196645 276961 104599 0ENSG00000174145 KIAA1239 4 00307388 144265 887444 0ENSG00000182379 NXPH4 12 008307 195786 788074 0ENSG00000131094 C1QL1 17 0121453 238957 429828 0000555ENSG00000142677 IL22RAI 1 150905 0384783 -529345 0ENSG00000138615 CILP 15 423569 0052726 -632793 241E-11ENSG00000141431 ASXL3 18 18938 001408 -707148 124E-09ENSG00000166426 CRABP1 15 748375 0367899 -766831 159E-11ENSG00000214145 LINC00887 3 19797 0119327 -737421 0000459
Table 41 Genes differentially expressed between minimally invasive follicular thryoid carcino-mas (mFTCs) and widely invasive follicular thyroid carcinomas (wFTCs)
In response to the previous researching objectives the Table 42 has the statistical results for
taks two and three From the data analysis we could conclude that less than 1 of genes have
isoforms but each one has an average of 389 alternatives
8Ricardo Celestino Torfin Nome Ana Pestana Andreas M Hoff Pedro A Gonccedilalves Catarina Eloy Eva SigstadRagnhild A Lothe Trine Bjoslashro Manuel Sobrinho-Simotildees Rofl I Skotheim Paula Soares CRAPBP1 C1QL1 andLCN2 are biomarkers of thyroid cancer and predictors of extrathyroidal extension subbmited for publication
30
Case study
Total genes 63896Total significant isoforms 689Total unique genes with isoforms 179Ratio of unique genes with isoformsgenes () 028Average of alternatives per gene with isoforms 389
Table 42 Statistical results for researching objectives number 2 and 3
462 Splicing analysis
Forward in the analysis Cuffcompare 9 has been used to search for novel isoforms when com-
pared to the reference genome The method was to compare each sample to the reference genome
and afterwards make an overlap of the results The main objective was then to infer about the
differences among wFTC and mFTC
Sample 1(wFTC)
Sample 2(wFTC)
Sample 3(mFTC)
Sample 4(mFTC)
Total genes 30440 36862 35539 37534Potential novel isoforms 7406 8450 8781 8830Table 43 Potential novel isoforms for each sample of IPATIMUPrsquos data
As demonstrated on Table 43 average there is a percentage of 24 of potentially novel iso-
forms found (at least one spliced junction is shared with a reference transcript) There is been
made an overlap of the results in order to encounter differences between wFTC and mFTC The
Table 44 presents the counting of differences between cases A brief analysis allows us to say
that we can not make any relationship between wFTC and mFTC On average there was a total of
3722 changes among this two sets The average within the sets are 3554 for wFTC and 3992 for
mFTC Given this results there was not a significant divergence to allow us to relate the splicing
and the occurrence of a more invasive Thyroid Carcinoma
Sets ChangesS1 S2 3554S1 S3 3609S1 S4 3612S2 S3 3847S2 S4 3820S3 S4 3929
Table 44 Number of differences between samples Syntax used S1 - Sample 1 S2 - Sample 2S3 - Sample 3 and S4 - Sample 4
9Cuffcompare httpcole-trapnell-labgithubiocufflinkscuffcompareindexhtml
31
Case study
463 Case study with reference genome GRCh38
In order to respond to the last research objective it has been applied the method of analysis has
before with a more recent human genome assembly After using the same protocol with Cufflinks
Cuffmerge and Cuffdiff sequentially we have come to some conclusions
The produced results of differential expression analysis for the same genes were very different
Genes that were highly significant before like C1QL1 and CRABP1 now had no relevance (q-
value gt 005) As mentioned before we had only access to TopHatrsquos output that used version
GRCh37 for the alignment and mapping process so we could not start from scratch the analysis
This outcome demonstrates two topics in particular
1 the introduction of novel annotations can make previous analysis outdated
2 there is the need to save the original reads in order to update earlier studies
The solution to this situation would have been to use the original reads to repeat the assembly
and then follow the Tuxedo protocol to collected correct and updated differential expression data
47 Chapter Summary
These section of development has been introduced in order to confer not only validation but also
to do some researching studies on the subject Four samples were collected and divided into two
distinct groups Tuxedo protocol was followed for responding to the research objectives The
case study for GRCh37 demonstrated the expression of C1QL1 and CRABP1 on wFTC when
compared to mFTC as indicated in the referred article On the other hand the same protocol when
applied with GRCh38 demonstrated the importance of saving the original reads and what is the
influence of newer releases in previous researching results Lastly the splicing analysis results did
not show any evidence of related isoforms count and the manifestation of the different stages of
the disease
32
Chapter 5
Conclusions and Future Work
The research of genomic-based cancers require highly complex data analysis Such analysis re-
quire most often the use of a large number of complex computational resources the gathering
of a lot of information over the Internet and the use of powerful computational resources Fur-
thermore the manipulation of the computational tools and resources require the assistance of an
informatics expert
The thesis work is a contribution towards the solution of the above mention problem We
propose and developed a framework that enables an expert biologist to perform genomic-based
complex analysis in a easy way and using the required powerful computational resources in a
transparent way
Using the developed framework we have used real data to address several research questions
provided by IPATIMUPrsquos researchers Firstly with the human genome GRCh37 we identified
two of the biomarkers of thyroid cancer by differential gene expression analysis Secondly we
found 689 significant isoforms 179 unique out of 63896 genes (ratio of 028) with an average
of 389 isoforms per gene Thirdly when trying to determine potential novel isoforms we came
at no conclusion of the differences of expression when comparing wFTC and mFTC The last
case was applying the Tuxedo protocol with the new GRCh38 on samples The outcome of the
experiment revealed the importance of saving the original reads and that newer releases become
previous analysis outdated
Future Work
This thesis work is just a starting point As stated before the framework was designed so it can be
extended with further modules to enable addressing other research questions
The case studies also showed us that RNA-seq analysis is very time consuming On the other
hand there are a lot of sub-tasks that can be run in parallel (like the task of aligning the reads)
33
Conclusions and Future Work
We will study and compare different techniques and opportunities to make RNA-seq in parallel as
much as possible
34
References
[bNE] Scitable by Nature Education Transcriptome available at httpwwwnaturecomscitabledefinitiontranscriptome-296 last accessJanuary 2015
[CAB+15] Fiona Cunningham M Ridwan Amode Daniel Barrell Kathryn Beal Konstanti-nos Billis Simon Brent Denise Carvalho-Silva Peter Clapham Guy CoatesStephen Fitzgerald Laurent Gil Carlos Garciacutea Giroacuten Leo Gordon ThibautHourlier Sarah E Hunt Sophie H Janacek Nathan Johnson Thomas Juette-mann Andreas K Kaumlhaumlri Stephen Keenan Fergal J Martin Thomas MaurelWilliam McLaren Daniel N Murphy Rishi Nag Bert Overduin Anne ParkerMateus Patricio Emily Perry Miguel Pignatelli Harpreet Singh Riat DanielSheppard Kieron Taylor Anja Thormann Alessandro Vullo Steven P WilderAmonida Zadissa Bronwen L Aken Ewan Birney Jennifer Harrow Rhoda Kin-sella Matthieu Muffato Magali Ruffier Stephen MJ Searle Giulietta SpudichStephen J Trevanion Andy Yates Daniel R Zerbino and Paul Flicek Ensembl2015 Nucleic Acids Research 43(D1)D662ndashD669 2015
[CFG+10] Peter J A Cock Christopher J Fields Naohisa Goto Michael L Heuer and Peter MRice The Sanger FASTQ file format for sequences with quality scores and theSolexaIllumina FASTQ variants Nucleic acids research 38(6)1767ndash71 April2010
[CH07] Geoffrey M Cooper and Robert E Hausman The Cell - A molecular approachAmerican Society for Microbiology 2007
[Cod70] E F Codd A relational model of data for large shared data banks Communica-tions of the ACM 13(6)377ndash387 June 1970
[Con11] The ENCODE Project Consortium A userrsquos guide to the encyclopedia of DNAelements (ENCODE) PLoS biology 9(4)e1001046 April 2011
[FMB14] N A Fonseca J A Marioni and A Brazma RNA-seq gene profiling - a system-atic empirical comparison Technical report May 2014
[FPMB14] Nuno A Fonseca Robert Petryszak John Marioni and Alvis Brazma irap - anintegrated rna-seq analysis pipeline bioRxiv 2014
[GCW+10] Qiang Gan Iouri Chepelev Gang Wei Lama Tarayrah Kairong Cui Keji Zhaoand Xin Chen Dynamic regulation of alternative splicing and chromatin structurein Drosophila gonads revealed by RNA-seq Cell research 20(7)763ndash83 July2010
35
REFERENCES
[GEN] GENIE Dna genes and chromossomes University of Leicesteravailable at httpwww2leacukdepartmentsgeneticsvgecschoolscollegestopicsdna-genes-chromosomes last access Jan-uary 2015
[Gri] Malachi Griffith Bioinformatics for Cancer Genomics (BiCG)available at httpbioinformaticscaworkshops2012bioinformatics-cancer-genomics-bicg last access January 2015
[GTBK11] Angela Goncalves Andrew Tikhonov Alvis Brazma and Misha Kapushesky Apipeline for RNA-seq data processing and quality assessment Bioinformatics (Ox-ford England) 27(6)867ndash9 March 2011
[HBB+02] T Hubbard D Barker E Birney G Cameron Y Chen L Clark T CoxJ Cuff V Curwen T Down R Durbin E Eyras J Gilbert M HammondL Huminiecki A Kasprzyk H Lehvaslaiho P Lijnzaad C Melsopp E Mon-gin R Pettett M Pocock S Potter A Rust E Schmidt S Searle G SlaterJ Smith W Spooner A Stabenau J Stalker E Stupka A Ureta-Vidal I Vastrikand M Clamp The ensembl genome database project Nucleic Acids Research30(1)38ndash41 2002
[HBD+13] R Hitzemann D Bottomly P Darakjian N Walter O Iancu R SearlesB Wilmot and S McWeeney Genes behavior and next-generation RNA se-quencing Genes Brain Behav 12(1)1ndash12 Feb 2013
[Ins] National Human Genome Research Institute Transcriptome available at httpwwwgenomegov13014330 last access January 2015
[Joh03] Jason M Johnson Genome-wide survey of human alternative pre-mrna splicingwith exon junction microarrays Science 3022141ndash2144 December 2003
[kn10] Gene set enrichment a problem of pathways Briefings in functional genomics9(5-6)385ndash90 December 2010
[kn11] Overview of available methods for diverse RNA-Seq data analyses Science ChinaLife sciences 54(12)1121ndash8 December 2011
[Lan10] Ben Langmead Aligning short sequencing reads with Bowtie Current proto-cols in bioinformatics editoral board Andreas D Baxevanis [et al] Chapter11Unit 117 December 2010
[LM10] Adam Lith and Jakob Mattsson Investigating storage solutions for large data - acomparison of well performing and scalable data storage solutions for real timeextraction and batch insertion of data Masterrsquos thesis 2010
[LTPS09] Ben Langmead Cole Trapnell Mihai Pop and Steven L Salzberg Ultrafastand memory-efficient alignment of short DNA sequences to the human genomeGenome biology 10(3)R25 January 2009
[ORY10] Alicia Oshlack Mark D Robinson and Matthew D Young From RNA-seq readsto differential expression results Genome biology 11(12)220 January 2010
[SG15] Marc W Schmid and Ueli Grossniklaus Rcount simple and flexible RNA-Seqread counting Bioinformatics 31(3)436ndash437 February 2015
36
REFERENCES
[SK11] Christof Strauch and Walter Kriha NoSQL databases Lecture Notes StuttgartMedia University February 2011
[SOdMVN12] Mikhail Shugay Intildeigo Ortiz de Mendiacutebil Joseacute L Vizmanos and Francisco JNovo Genomic hallmarks of genes involved in chromosomal translocations inhematological cancer PLoS Comput Biol 8(12)e1002797 12 2012
[The04] The ENCODE Project Consortium The ENCODE (ENCyclopedia Of DNA Ele-ments) Project Science (New York NY) 306(5696)636ndash40 October 2004
[TPS09] Cole Trapnell Lior Pachter and Steven L Salzberg TopHat discovering splicejunctions with RNA-Seq Bioinformatics (Oxford England) 25(9)1105ndash11 May2009
[TRG+12a] Cole Trapnell Adam Roberts Loyal Goff Geo Pertea Daehwan Kim David RKelley Harold Pimentel Steven L Salzberg John L Rinn and Lior Pachter Dif-ferential gene and transcript expression analysis of RNA-seq experiments withTopHat and Cufflinks Nature protocols 7(3)562ndash78 March 2012
[TRG+12b] Cole Trapnell Adam Roberts Loyal Goff Geo Pertea Daehwan Kim David RKelley Harold Pimentel Steven L Salzberg John L Rinn and Lior Pachter Dif-ferential gene and transcript expression analysis of RNA-seq experiments withTopHat and Cufflinks Nature protocols 7(3)562ndash78 March 2012
[WMM+11] Ying Wang Gaurang Mehta Rajiv Mayani Jingxi Lu Tade Souaiaia YanghoChen Andrew Clark Hee Jae Yoon Lin Wan Oleg V Evgrafov James AKnowles Ewa Deelman and Ting Chen RseqFlow workflows for RNA-Seq dataanalysis Bioinformatics (Oxford England) 27(18)2598ndash600 September 2011
[Wol13] Jochen B W Wolf Principles of transcriptome analysis and gene expressionquantification an rna-seq tutorial Molecular Ecology Resources 13(4)559ndash5722013
[ZW09] Mark Gerstein |amp Michael Snyder Zhong Wang Rna-seq a revolutionary tool fortranscriptomics Nature Reviews Genetics 1057ndash63 January 2009
37
REFERENCES
38
Appendix A
iRAP tools supported
A1 Mappers
Mapper Option name (mapper)TopHat 1 tophat1TopHat 2 tophat2SMALT smaltGSNAP gsnapSOAPsplice soapspliceBWA bwa1BWA bwa2Bowtie 1 bowtie1Bowtie2 bowtie2GEM gemSTAR starOSA osaMapSplice mapsplice
A2 Quantification
Quantifier Option name (quant_method)FluxCapacitor flux_capHT-Seq (union mode) htseq1HT-Seq (intersection non-empty mode) htseq2Cufflinks 1 (try to find novel transcripts-g) cufflinks1Cufflinks 2 (try to find novel transcripts-g) cufflinks2Cufflinks 1 (do not assemble novel transcripts-G) cufflinks1_ndCufflinks 2 (do not assemble novel transcripts-G) cufflinks2_ndNURD nurd
39
iRAP tools supported
A3 Differential expression [DE]
Method Option name (de_method)DESeq deseqDESeq2 deseq2EdgeR edgerCuffdiff 1 cuffdiff1Cuffdiff 2 cuffdiff2
A4 Gene set enrichment analysis [GSE]
Tool Option name (gse_tool)Piano piano
40
Appendix B
iRAP model of configuration file
1 This is a comment (lines that start with a are ignored by iRAP)
2 =============================================================================
3 name that you want to give to the experiment (no spaces)
4 All files produced by irap will be placed in a folder with the given name
5 name=myexp
6
7
8 =============================================================================
9 name of the species
10 species=homo_sapiens
11
12 =============================================================================
13 Fasta file with the reference genome
14 reference=Homo_sapiensGRCh3766dnafa
15
16 =============================================================================
17 GTF file with the annotations
18 gtf_file=Homo_sapiensGRCh3766gtf
19
20 =============================================================================
21 IRAP options (may be providedoverriden in the command line)
22
23
24 Mapper
25 mapper=
26
27
28 Quantification method
29 quant_method=
30
31
32 Dif expression method
33 Requires contrasts to be defined (see below)
41
iRAP model of configuration file
34 de_method=
35
36
37 Gene set enrichment (GSE) analysis
38 Requires de_method to be defined
39 Tool to use (none|piano)
40 gse_tool=piano
41
42 gse_method (mean|median|sum|fisher|fisher-exact|stouffer|tailStrength|wilcoxon|
reporter|page) see Piano vignete documentation for more details
43 gse_method=fisher
44 gse_pvalue=005
45 Minimum number of genes in a gene set
46 gse_minsize=3
47
48
49
50 TSV file with gene annotation
51 Format IDNamelocussourcelnameGOGOtermKEGG
52 Description
53 ID=gene_id (this is mandatory and should match the one given in the gtf file)
54 Name=gene name
55 locus=chrstart--end
56 source=biotype
57 lname=gene name
58 GO=go ids (multiple values can be separated by)
59 GO=GO terms (multiple values can be separated by)
60 KEGG=Kegg ids (multiple values can be separated by)
61 If auto is defined then iRAP will try to generate the file
62 - this may take a considerable amount of time and will only work
63 for a reduced number of species
64 off - default value
65 annot_tsv=
66
67
68 QC
69 Check data (reads) quality (on|off|none)
70 on - reads are filtered out based on their quality
71 off - the quality of the reads is assessed but no filtering is done
72 none- no quality control is performed
73 qual_filtering=on
74
75 Trim all reads to the minimum read size after quality trimming - Yes (y)| No (n)
76 only applicable if qual_filtering is on
77 trim_reads=y
78
79 Minimum base quality accepted (def 10)
80 min_read_quality=10
81
42
iRAP model of configuration file
82 Contamination check (cont_index parameter) Reads that likely
83 originate from organisms other than the one under study can be
84 discarded during pre-processment of the reads This is done by
85 aligning the reads to the genomes of organisms that might be a
86 source of contamination and discard those that map with a high
87 degree of fidelity By default iRAP will check if the data is
88 contaminated by e-coli An example to create a contamination
89 database is provided in the examplesex_add2contaminationDBsh
90 script The value of the parameter should be the file name prefix of
91 the bowtie index files
92
93 Disable contamination check
94 cont_index=no
95 Default value
96 cont_index=$(data_dir)contaminatione_coli
97
98
99 Misc options
100
101 Number of threads that may be used by IRAP
102 max_threads=1
103
104 Exon level quantification Yes (y)| No (n)
105 exon_quant=y
106
107 Transcript level quantification Yes (y)| No (n)
108 transcript_quant=y
109 =============================================================================
110 full or relative path to the directory where all the data can be found
111 data_dir=data
112
113 the directory should be organized as follows (see directory data in IRAP toplevel
directory)
114
115 $data_dir
116 $data_dir
117 contamination
118 e_coli1ebwt
119 e_coli2ebwt
120 e_coli3ebwt
121 e_coli4ebwt
122 e_coliREADME
123 e_colirev1ebwt
124 e_colirev2eb
125 raw_data
126 $species
127 fastq
128 fastq
129
43
iRAP model of configuration file
130 reference
131 $species
132 $gtf_file
133 $reference
134
135 Notes
136 1) $ denotes the value defined for the variable
137 2) Since version 050 the raw data (fastqbam) files may be
138 distributed across several sub-folders
139
140
141 =============================================================================
142 Only necessary if you intend to perform Differential Expression analysis
143
144 contrasts=contrast_def [contrast_def ]
145 contrasts=purpleVsPink purpleVsGrey
146
147 definition of each constrast
148 contrast= group group [ group ]
149 purlpleVsPink=Purple Pink
150 purlpleVsGrey=Purple Grey
151
152 groups
153 GroupName= Library_name [Library_name ]
154 Purlple=myLib1 myLib2
155 Pink=myLib3
156 Grey=myLib4
157
158 optional parameter used in the report (HTML) generation
159 groups=Purple Pink Grey
160
161 technical replicates
162 technicalreplicates=myLib1myLib2myLib3mylib4
163
164 Note names of groups contrasts and libraries should start with a letter and
contain only alphanumeric characters and the character _
165
166 =============================================================================
167 Data
168
169
170 Information for each library
171 LibName=Fastq file
172 Note
173 1 LibName should start with a letter and contain only alphanumeric characters
and the character _ LibName should not contain in _1 or _2
174 2 LibName should be different from the name of the fastq file for instance
175 f1=f1fastq
176 will produce an error
44
iRAP model of configuration file
177
178 Single-end
179 myLib1=f1fastq
180 read size
181 myLib1_rs=75
182 quality encoding (33 or 64)
183 myLib1_qual=33
184
185 strand specific protocol
186 mylib1_strand=first
187 mylib1_strand=second
188 Default value is both (strands)
189 mylib1_strand=both
190
191 Have the file in a different sub-folder
192 mylib1_dir=somesubfolder
193
194 See SAMBAM specification for more details about the following two parameters
195 read group id (to be included in the BAM file) - this is not supported by all
mappers
196 myLib1_rgid=
197 sambam header lines to include in the BAM file
198 myLib1_shl=COtThis is a commentnCOtand another line
199
200 LibName=Fastq file
201 myLib2=f2fastq
202 read size
203 myLib2_rs=75
204 quality encoding (33 or 64)
205 myLib2_qual=33
206
207
208 Paired-end
209 LibName=Fastq files
210 myLib3=f3_1fastq f3_2fastq
211 read size
212 myLib3_rs=50
213 quality encoding (33 or 64)
214 myLib3_qual=33
215 insert size
216 myLib3_ins=350
217 standard deviation
218 myLib3_sd=60
219
220 LibName=Fastq files
221 myLib4=f4_1fastq f4_2fastq
222 read size
223 myLib4_rs=50
224 quality encoding (33 or 64)
45
iRAP model of configuration file
225 myLib4_qual=33
226 insert size
227 myLib4_ins=350
228 standard deviation
229 myLib4_sd=60
230
231
232
233
234 list the names of your single-end (se) and paired (pe) libraries
235 se=myLib1 myLib2
236 pe=myLib3 myLib4
237 No SE data
238 se=
239 No PE data
240 pe=
241
242
243
244 Passingoverriding parameters
245
246 It is possible to pass parameters to the mappers and quantification
247 methods but that should be done carefully since it may break the
248 pipeline (if the location of the input andor output files is
249 changed)
250
251 Overridingchanging the mappersrsquo parameters
252 _map_options=options
253 Example
254 tophat2_map_options=--min-intron-length 5 --no-coverage-search
255
256 Overridingchanging the parameters of the quantification methods
257 _params=options
258 Example
259 htseq_params= -q
46
Appendix C
iRAP example configuration file
1 minimal configuration file for DE
2 experiment name
3 name=ecoli_ex
4 species
5 species=ecoli_k12
6 reference genome
7 reference=Escherichia_coli_str_k_12_substr_mg1655GCA_000005845119dnatoplevel
fagz
8 gtf file
9 gtf_file=Escherichia_coli_str_k_12_substr_mg1655GCA_000005845119gtfgz
10 Enable filtering based on quality
11 qual_filtering=on
12 Use a contamination data set to filter out reads
13 cont_index=no
14 Toplevel directory with the data
15 data_dir=
16
17 some contrasts
18 GA=Group A
19 contrasts=GAvsGB GBvsGA
20 GAvsGB=GA GB
21 GBvsGA=GB GA
22 GA=FA FB FC
23 GB=FD FE FF
24
25 se=FA FB FC FD FE FF
26
27 FA=SRR933983fastqgz
28 FA_rs=50
29 FA_qual=33
30
31 FB=SRR933984fastqgz
32 FB_rs=50
47
iRAP example configuration file
33 FB_qual=33
34
35 FC=SRR933985fastqgz
36 FC_rs=50
37 FC_qual=33
38
39 FD=SRR933989fastqgz
40 FD_rs=50
41 FD_qual=33
42
43 FE=SRR933990fastqgz
44 FE_rs=50
45 FE_qual=33
46
47 FF=SRR933990fastqgz
48 FF_rs=50
49 FF_qual=33
50 EOF
48
- Front Page
- Table of Contents
- List of Figures
- List of Tables
- 1 Introduction
-
- 11 Context
- 12 Motivation and Goals
- 13 Proposed Solution
- 14 Structure of the Dissertation
-
- 2 Basic Concepts and Bibliographic Review
-
- 21 Biological Basic Concepts
-
- 211 Genome
- 212 Transcriptome Assembly and Gene expression
-
- 22 RNA-Seq Analysis
-
- 221 RNA-Seq microarrays and DNA sequencing
- 222 RNA-Seq Pipeline
-
- 23 Standard File Formats used
-
- 231 FASTA
- 232 FASTQ
- 233 SAM and BAM
- 234 GFF and GTF
-
- 24 Relevant Data Repositories
- 25 Tools for RNA-seq and Differential Analysis
- 26 Relational and Non-relational Databases
- 27 Tecnologies
- 28 Related Work
- 29 Chapter Summary
-
- 3 The Gemini framework
-
- 31 Gemini
- 32 Gemini Architecture
-
- 321 Physical Architecture
-
- 33 Data Management
- 34 Web Interface
- 35 Use cases
- 36 Case studies
-
- 361 Full pipeline
- 362 Stage pipeline
-
- 37 Chapter Summary
-
- 4 Case study
-
- 41 Samples characterization
- 42 Researching objectives
- 43 Protocol of analysis
- 44 Genome version GRCh37 versus GRCh38
- 45 Fusion genes
- 46 Results
-
- 461 Case study with reference genome GRCh37
- 462 Splicing analysis
- 463 Case study with reference genome GRCh38
-
- 47 Chapter Summary
-
- 5 Conclusions and Future Work
- References
- A iRAP tools supported
-
- A1 Mappers
- A2 Quantification
- A3 Differential expression [DE]
- A4 Gene set enrichment analysis [GSE]
-
- B iRAP model of configuration file
- C iRAP example configuration file
-
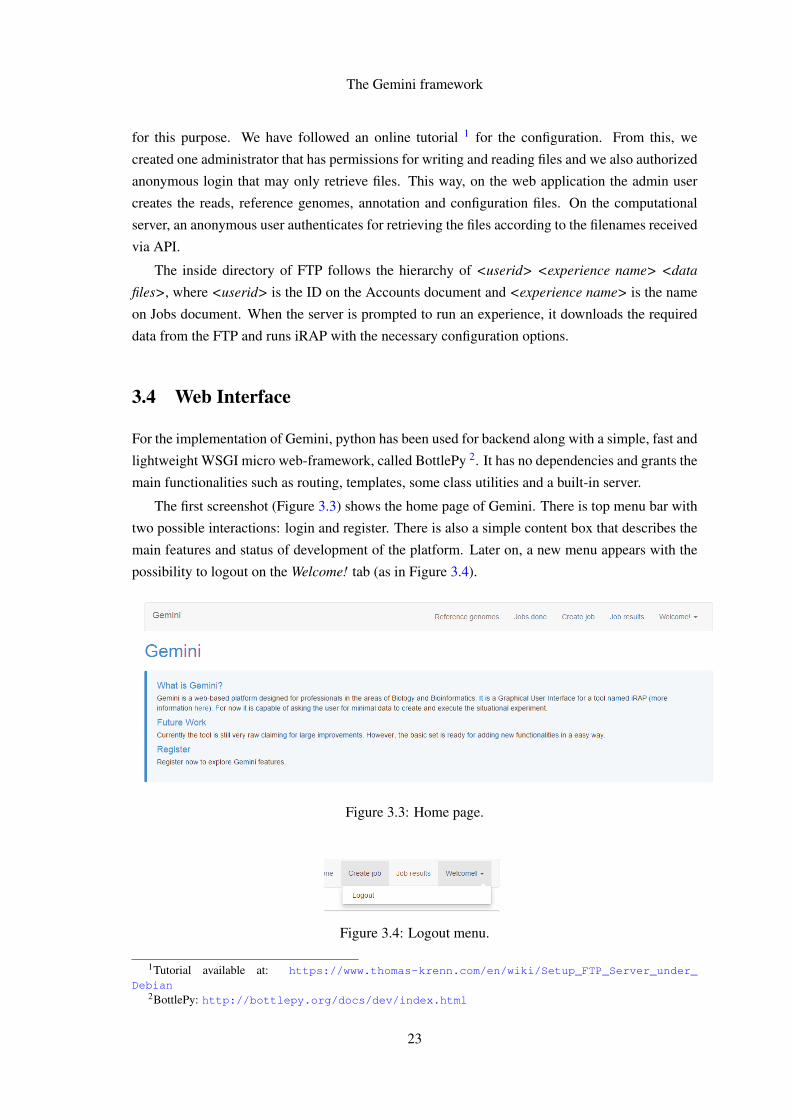
The Gemini framework
This test has been accomplished successfully
362 Stage pipeline
The stage pipeline is a powerful functionality since it allows the user to choose a specific stage of
the pipeline that he wants to execute for his samples
Besides the fact that it is not easy to collect data samples users often want to repeat or analyse
just one step of the pipeline and take some conclusions of it Furthermore this type of pipeline is
less time consuming
A concrete usage example is IPATIMUPrsquos data which contains the output information of the
mapper TopHat and will be further analysed in detail in Chapter 4 Concerning this setup it would
not be possible to call the full pipeline but instead it would require a command specific command
option
For validation purposes the same bacteria from the previous analysis has been used for the
stage pipeline case After calling the setup command to check input the directive irap conf=
ecoli_exconf quality_filtering_and_reporting has been used to perform the stage1
of iRAP The platform was able to perform with success this task
37 Chapter Summary
It has been used Python with BottlePy for the main implementation of the interface of Gemini
MongoDB has been chosen for dealing with information A FTP server was mounted for the
transitions of data between the client and the server The platform allows the expert to call a full or
stage pipeline analysis and provides the download of both fast and annotation files The essential
items are setup for the addition of further functionalities
26
Chapter 4
Case study
In this chapter it is going to be presented the Case Study with data from samples of thyroid carci-
noma along with their charactering and researching results
After the development of an interface to the iRAP tool the following step was to do a case
study with some realistic DNA samples of thyroid cancer patients regarding the partnership with
IPATIMUPrsquos researchers
The purpose of this case study was to do some research of potential differences between dis-
tinct types of the disease In order to accomplish this four samples were collected from Centro
Hospitalar de Satildeo Joatildeo (Porto) Cases 1 and 2 have been categorized as a widely invasive Fol-
licular Thyroid Carcinoma (wFTC) and cases 3 and 4 as a minimally invasive Follicular Thyroid
Carcinoma (mFTC)
41 Samples characterization
Patient from case 1 was female with 82 years old the tumour measuring 2 cm of size and presented
a predominant follicular growth pattern and oncocytic features Patient from case 2 was male with
55 years old the tumour measuring 5 cm of size and presented a predominant solidtrabecular
growth pattern For the group of mFTC patient from case 3 was female 56 years old the tumour
measuring 37 cm of size and with follicular growth pattern patient from case 4 was female 56
years old the tumour measuring 4 cm of size and with follicular growth pattern
42 Researching objectives
The aim of the study was to answer the following questions
bull Differentially expressed genes
bull Total isoforms found either in percentange and in absolute
27
Case study
bull Average of alternative isoforms for each gene spliced
bull Potentially novel isoforms and how do they behave between samplesgroups of samples
bull Compare results between versions of human genome assembly
bull Retrieve fusion genes
43 Protocol of analysis
Collected sample reads have been aligned against reference genome GRCh37 with TopHat version
141 Posterior analysis followed Tuxedo Protocol as described in Trapnell et al [TRG+12b] An
overview of the full protocol can be found in Figure 41
For the implementation of this procedure it were considered as two different groups the cases
1 and 2 (wFTC) against cases 3 and 4 (mFTC) The following step was to assemble transcripts for
each sample with Cufflinks 1 and afterwards create a single merged transcriptome annotation with
Cuffmerge 2 Cuffdiff 3 was then used to find significant changes in transcript expression
In order to find potential isoforms each sample was ran against the reference genome with
Cuffcompare 4
44 Genome version GRCh37 versus GRCh38
Even though IPATIMUPrsquos data have been assembled with reference genome version GRCh37
nowadays a more recent version (GRCh38) has been released in 2013 This new assembly is the
first major revision of the human genome in more than four years 5
The main differences between this two versions are
Alternate sequences several human chromosomal regions have sufficient variability to prevent
adequate representation by a single sequence This new version provides alternate sequence
for selected variant regions through the inclusion of alternate loci 6 scaffolds
Centromere 7 representation Previous method of representing centromeric regions have been
replaced by sequences from centromere models The models provide the approximate repeat
number and order for each centromere and are useful for read mapping and variation studies
Mitochondrial genome The new mitochondrial reference sequence is the Revised Cambridge
Reference Sequence with RefSeq accession number NC_0129201 The previous one was
RefSeq accession number NC_001907 which was not updated when GRCh37 assembly
later transitioned to the new version1Cufflinks httpcole-trapnell-labgithubiocufflinks2Cuffmerge httpcole-trapnell-labgithubiocufflinkscuffmergeindexhtml3Cuffdiff httpcole-trapnell-labgithubiocufflinkscuffdiffindexhtml4Cuffcompare httpcole-trapnell-labgithubiocufflinkscuffcompareindexhtml5As in UCSC mailing list at httpsgroupsgooglecomasoeucsceduforumtopic
genome-announce52Kv41YBXNY6Specific location of a gene on a chromosome
28
Case study
Figure 41 An overview of the Tuxedo Protocol with full steps TopHat for alignment Cufflinkspackage to find differential features between group samples and in the end CummeRbund to plotprevious results
Sequence updates Several erroneous bases and misassembled regions have been corrected and
more than 100 gaps have been filled or reduced
Analysis set The new assembly offers an analysis set that was created to accommodate next
generation sequencing read alignment pipelines Several GRCh38 regions have been elimi-
nated from this set to improve read mapping
29
Case study
45 Fusion genes
After we done some research on the technologies used for finding fusion genes in the reads we
have not been able to perform the analysis to answer the last question of our researching objectives
DeFuse required as input the original reads which were not provided This analysis would have
been interesting for relating the ocurrence of thyroid and the presence of fusion genes as well as if
there was any relevant difference between the samples of wFTC and mFTC
46 Results
461 Case study with reference genome GRCh37
The following table ( 41) demonstrates some genes that were differentially expressed with signif-
icance between mFTC and wFTC According to Celestino et al 8 CRABP1 C1QL1 and LCN2
are biomarkers of thyroid cancer and predictors of extrathyroidal extension It is commonly used
the value of 005 has threshold above which the differential expression is significant By inspect-
ing out the table we can find C1QL1 with a q-value of 0000555 and CRABP1 with a q-value
of 159E-11 which are in concordance with the previous article Furthermore it is verified the
increased gene expression in wFTC when compared to mFTC
Gene ID Gene Chr mFTC wFTC Fold change(log2) Q value
ENSG00000167748 KLK1 19 018672 111924 922742 0ENSG00000104725 NEFL 8 00196645 276961 104599 0ENSG00000174145 KIAA1239 4 00307388 144265 887444 0ENSG00000182379 NXPH4 12 008307 195786 788074 0ENSG00000131094 C1QL1 17 0121453 238957 429828 0000555ENSG00000142677 IL22RAI 1 150905 0384783 -529345 0ENSG00000138615 CILP 15 423569 0052726 -632793 241E-11ENSG00000141431 ASXL3 18 18938 001408 -707148 124E-09ENSG00000166426 CRABP1 15 748375 0367899 -766831 159E-11ENSG00000214145 LINC00887 3 19797 0119327 -737421 0000459
Table 41 Genes differentially expressed between minimally invasive follicular thryoid carcino-mas (mFTCs) and widely invasive follicular thyroid carcinomas (wFTCs)
In response to the previous researching objectives the Table 42 has the statistical results for
taks two and three From the data analysis we could conclude that less than 1 of genes have
isoforms but each one has an average of 389 alternatives
8Ricardo Celestino Torfin Nome Ana Pestana Andreas M Hoff Pedro A Gonccedilalves Catarina Eloy Eva SigstadRagnhild A Lothe Trine Bjoslashro Manuel Sobrinho-Simotildees Rofl I Skotheim Paula Soares CRAPBP1 C1QL1 andLCN2 are biomarkers of thyroid cancer and predictors of extrathyroidal extension subbmited for publication
30
Case study
Total genes 63896Total significant isoforms 689Total unique genes with isoforms 179Ratio of unique genes with isoformsgenes () 028Average of alternatives per gene with isoforms 389
Table 42 Statistical results for researching objectives number 2 and 3
462 Splicing analysis
Forward in the analysis Cuffcompare 9 has been used to search for novel isoforms when com-
pared to the reference genome The method was to compare each sample to the reference genome
and afterwards make an overlap of the results The main objective was then to infer about the
differences among wFTC and mFTC
Sample 1(wFTC)
Sample 2(wFTC)
Sample 3(mFTC)
Sample 4(mFTC)
Total genes 30440 36862 35539 37534Potential novel isoforms 7406 8450 8781 8830Table 43 Potential novel isoforms for each sample of IPATIMUPrsquos data
As demonstrated on Table 43 average there is a percentage of 24 of potentially novel iso-
forms found (at least one spliced junction is shared with a reference transcript) There is been
made an overlap of the results in order to encounter differences between wFTC and mFTC The
Table 44 presents the counting of differences between cases A brief analysis allows us to say
that we can not make any relationship between wFTC and mFTC On average there was a total of
3722 changes among this two sets The average within the sets are 3554 for wFTC and 3992 for
mFTC Given this results there was not a significant divergence to allow us to relate the splicing
and the occurrence of a more invasive Thyroid Carcinoma
Sets ChangesS1 S2 3554S1 S3 3609S1 S4 3612S2 S3 3847S2 S4 3820S3 S4 3929
Table 44 Number of differences between samples Syntax used S1 - Sample 1 S2 - Sample 2S3 - Sample 3 and S4 - Sample 4
9Cuffcompare httpcole-trapnell-labgithubiocufflinkscuffcompareindexhtml
31
Case study
463 Case study with reference genome GRCh38
In order to respond to the last research objective it has been applied the method of analysis has
before with a more recent human genome assembly After using the same protocol with Cufflinks
Cuffmerge and Cuffdiff sequentially we have come to some conclusions
The produced results of differential expression analysis for the same genes were very different
Genes that were highly significant before like C1QL1 and CRABP1 now had no relevance (q-
value gt 005) As mentioned before we had only access to TopHatrsquos output that used version
GRCh37 for the alignment and mapping process so we could not start from scratch the analysis
This outcome demonstrates two topics in particular
1 the introduction of novel annotations can make previous analysis outdated
2 there is the need to save the original reads in order to update earlier studies
The solution to this situation would have been to use the original reads to repeat the assembly
and then follow the Tuxedo protocol to collected correct and updated differential expression data
47 Chapter Summary
These section of development has been introduced in order to confer not only validation but also
to do some researching studies on the subject Four samples were collected and divided into two
distinct groups Tuxedo protocol was followed for responding to the research objectives The
case study for GRCh37 demonstrated the expression of C1QL1 and CRABP1 on wFTC when
compared to mFTC as indicated in the referred article On the other hand the same protocol when
applied with GRCh38 demonstrated the importance of saving the original reads and what is the
influence of newer releases in previous researching results Lastly the splicing analysis results did
not show any evidence of related isoforms count and the manifestation of the different stages of
the disease
32
Chapter 5
Conclusions and Future Work
The research of genomic-based cancers require highly complex data analysis Such analysis re-
quire most often the use of a large number of complex computational resources the gathering
of a lot of information over the Internet and the use of powerful computational resources Fur-
thermore the manipulation of the computational tools and resources require the assistance of an
informatics expert
The thesis work is a contribution towards the solution of the above mention problem We
propose and developed a framework that enables an expert biologist to perform genomic-based
complex analysis in a easy way and using the required powerful computational resources in a
transparent way
Using the developed framework we have used real data to address several research questions
provided by IPATIMUPrsquos researchers Firstly with the human genome GRCh37 we identified
two of the biomarkers of thyroid cancer by differential gene expression analysis Secondly we
found 689 significant isoforms 179 unique out of 63896 genes (ratio of 028) with an average
of 389 isoforms per gene Thirdly when trying to determine potential novel isoforms we came
at no conclusion of the differences of expression when comparing wFTC and mFTC The last
case was applying the Tuxedo protocol with the new GRCh38 on samples The outcome of the
experiment revealed the importance of saving the original reads and that newer releases become
previous analysis outdated
Future Work
This thesis work is just a starting point As stated before the framework was designed so it can be
extended with further modules to enable addressing other research questions
The case studies also showed us that RNA-seq analysis is very time consuming On the other
hand there are a lot of sub-tasks that can be run in parallel (like the task of aligning the reads)
33
Conclusions and Future Work
We will study and compare different techniques and opportunities to make RNA-seq in parallel as
much as possible
34
References
[bNE] Scitable by Nature Education Transcriptome available at httpwwwnaturecomscitabledefinitiontranscriptome-296 last accessJanuary 2015
[CAB+15] Fiona Cunningham M Ridwan Amode Daniel Barrell Kathryn Beal Konstanti-nos Billis Simon Brent Denise Carvalho-Silva Peter Clapham Guy CoatesStephen Fitzgerald Laurent Gil Carlos Garciacutea Giroacuten Leo Gordon ThibautHourlier Sarah E Hunt Sophie H Janacek Nathan Johnson Thomas Juette-mann Andreas K Kaumlhaumlri Stephen Keenan Fergal J Martin Thomas MaurelWilliam McLaren Daniel N Murphy Rishi Nag Bert Overduin Anne ParkerMateus Patricio Emily Perry Miguel Pignatelli Harpreet Singh Riat DanielSheppard Kieron Taylor Anja Thormann Alessandro Vullo Steven P WilderAmonida Zadissa Bronwen L Aken Ewan Birney Jennifer Harrow Rhoda Kin-sella Matthieu Muffato Magali Ruffier Stephen MJ Searle Giulietta SpudichStephen J Trevanion Andy Yates Daniel R Zerbino and Paul Flicek Ensembl2015 Nucleic Acids Research 43(D1)D662ndashD669 2015
[CFG+10] Peter J A Cock Christopher J Fields Naohisa Goto Michael L Heuer and Peter MRice The Sanger FASTQ file format for sequences with quality scores and theSolexaIllumina FASTQ variants Nucleic acids research 38(6)1767ndash71 April2010
[CH07] Geoffrey M Cooper and Robert E Hausman The Cell - A molecular approachAmerican Society for Microbiology 2007
[Cod70] E F Codd A relational model of data for large shared data banks Communica-tions of the ACM 13(6)377ndash387 June 1970
[Con11] The ENCODE Project Consortium A userrsquos guide to the encyclopedia of DNAelements (ENCODE) PLoS biology 9(4)e1001046 April 2011
[FMB14] N A Fonseca J A Marioni and A Brazma RNA-seq gene profiling - a system-atic empirical comparison Technical report May 2014
[FPMB14] Nuno A Fonseca Robert Petryszak John Marioni and Alvis Brazma irap - anintegrated rna-seq analysis pipeline bioRxiv 2014
[GCW+10] Qiang Gan Iouri Chepelev Gang Wei Lama Tarayrah Kairong Cui Keji Zhaoand Xin Chen Dynamic regulation of alternative splicing and chromatin structurein Drosophila gonads revealed by RNA-seq Cell research 20(7)763ndash83 July2010
35
REFERENCES
[GEN] GENIE Dna genes and chromossomes University of Leicesteravailable at httpwww2leacukdepartmentsgeneticsvgecschoolscollegestopicsdna-genes-chromosomes last access Jan-uary 2015
[Gri] Malachi Griffith Bioinformatics for Cancer Genomics (BiCG)available at httpbioinformaticscaworkshops2012bioinformatics-cancer-genomics-bicg last access January 2015
[GTBK11] Angela Goncalves Andrew Tikhonov Alvis Brazma and Misha Kapushesky Apipeline for RNA-seq data processing and quality assessment Bioinformatics (Ox-ford England) 27(6)867ndash9 March 2011
[HBB+02] T Hubbard D Barker E Birney G Cameron Y Chen L Clark T CoxJ Cuff V Curwen T Down R Durbin E Eyras J Gilbert M HammondL Huminiecki A Kasprzyk H Lehvaslaiho P Lijnzaad C Melsopp E Mon-gin R Pettett M Pocock S Potter A Rust E Schmidt S Searle G SlaterJ Smith W Spooner A Stabenau J Stalker E Stupka A Ureta-Vidal I Vastrikand M Clamp The ensembl genome database project Nucleic Acids Research30(1)38ndash41 2002
[HBD+13] R Hitzemann D Bottomly P Darakjian N Walter O Iancu R SearlesB Wilmot and S McWeeney Genes behavior and next-generation RNA se-quencing Genes Brain Behav 12(1)1ndash12 Feb 2013
[Ins] National Human Genome Research Institute Transcriptome available at httpwwwgenomegov13014330 last access January 2015
[Joh03] Jason M Johnson Genome-wide survey of human alternative pre-mrna splicingwith exon junction microarrays Science 3022141ndash2144 December 2003
[kn10] Gene set enrichment a problem of pathways Briefings in functional genomics9(5-6)385ndash90 December 2010
[kn11] Overview of available methods for diverse RNA-Seq data analyses Science ChinaLife sciences 54(12)1121ndash8 December 2011
[Lan10] Ben Langmead Aligning short sequencing reads with Bowtie Current proto-cols in bioinformatics editoral board Andreas D Baxevanis [et al] Chapter11Unit 117 December 2010
[LM10] Adam Lith and Jakob Mattsson Investigating storage solutions for large data - acomparison of well performing and scalable data storage solutions for real timeextraction and batch insertion of data Masterrsquos thesis 2010
[LTPS09] Ben Langmead Cole Trapnell Mihai Pop and Steven L Salzberg Ultrafastand memory-efficient alignment of short DNA sequences to the human genomeGenome biology 10(3)R25 January 2009
[ORY10] Alicia Oshlack Mark D Robinson and Matthew D Young From RNA-seq readsto differential expression results Genome biology 11(12)220 January 2010
[SG15] Marc W Schmid and Ueli Grossniklaus Rcount simple and flexible RNA-Seqread counting Bioinformatics 31(3)436ndash437 February 2015
36
REFERENCES
[SK11] Christof Strauch and Walter Kriha NoSQL databases Lecture Notes StuttgartMedia University February 2011
[SOdMVN12] Mikhail Shugay Intildeigo Ortiz de Mendiacutebil Joseacute L Vizmanos and Francisco JNovo Genomic hallmarks of genes involved in chromosomal translocations inhematological cancer PLoS Comput Biol 8(12)e1002797 12 2012
[The04] The ENCODE Project Consortium The ENCODE (ENCyclopedia Of DNA Ele-ments) Project Science (New York NY) 306(5696)636ndash40 October 2004
[TPS09] Cole Trapnell Lior Pachter and Steven L Salzberg TopHat discovering splicejunctions with RNA-Seq Bioinformatics (Oxford England) 25(9)1105ndash11 May2009
[TRG+12a] Cole Trapnell Adam Roberts Loyal Goff Geo Pertea Daehwan Kim David RKelley Harold Pimentel Steven L Salzberg John L Rinn and Lior Pachter Dif-ferential gene and transcript expression analysis of RNA-seq experiments withTopHat and Cufflinks Nature protocols 7(3)562ndash78 March 2012
[TRG+12b] Cole Trapnell Adam Roberts Loyal Goff Geo Pertea Daehwan Kim David RKelley Harold Pimentel Steven L Salzberg John L Rinn and Lior Pachter Dif-ferential gene and transcript expression analysis of RNA-seq experiments withTopHat and Cufflinks Nature protocols 7(3)562ndash78 March 2012
[WMM+11] Ying Wang Gaurang Mehta Rajiv Mayani Jingxi Lu Tade Souaiaia YanghoChen Andrew Clark Hee Jae Yoon Lin Wan Oleg V Evgrafov James AKnowles Ewa Deelman and Ting Chen RseqFlow workflows for RNA-Seq dataanalysis Bioinformatics (Oxford England) 27(18)2598ndash600 September 2011
[Wol13] Jochen B W Wolf Principles of transcriptome analysis and gene expressionquantification an rna-seq tutorial Molecular Ecology Resources 13(4)559ndash5722013
[ZW09] Mark Gerstein |amp Michael Snyder Zhong Wang Rna-seq a revolutionary tool fortranscriptomics Nature Reviews Genetics 1057ndash63 January 2009
37
REFERENCES
38
Appendix A
iRAP tools supported
A1 Mappers
Mapper Option name (mapper)TopHat 1 tophat1TopHat 2 tophat2SMALT smaltGSNAP gsnapSOAPsplice soapspliceBWA bwa1BWA bwa2Bowtie 1 bowtie1Bowtie2 bowtie2GEM gemSTAR starOSA osaMapSplice mapsplice
A2 Quantification
Quantifier Option name (quant_method)FluxCapacitor flux_capHT-Seq (union mode) htseq1HT-Seq (intersection non-empty mode) htseq2Cufflinks 1 (try to find novel transcripts-g) cufflinks1Cufflinks 2 (try to find novel transcripts-g) cufflinks2Cufflinks 1 (do not assemble novel transcripts-G) cufflinks1_ndCufflinks 2 (do not assemble novel transcripts-G) cufflinks2_ndNURD nurd
39
iRAP tools supported
A3 Differential expression [DE]
Method Option name (de_method)DESeq deseqDESeq2 deseq2EdgeR edgerCuffdiff 1 cuffdiff1Cuffdiff 2 cuffdiff2
A4 Gene set enrichment analysis [GSE]
Tool Option name (gse_tool)Piano piano
40
Appendix B
iRAP model of configuration file
1 This is a comment (lines that start with a are ignored by iRAP)
2 =============================================================================
3 name that you want to give to the experiment (no spaces)
4 All files produced by irap will be placed in a folder with the given name
5 name=myexp
6
7
8 =============================================================================
9 name of the species
10 species=homo_sapiens
11
12 =============================================================================
13 Fasta file with the reference genome
14 reference=Homo_sapiensGRCh3766dnafa
15
16 =============================================================================
17 GTF file with the annotations
18 gtf_file=Homo_sapiensGRCh3766gtf
19
20 =============================================================================
21 IRAP options (may be providedoverriden in the command line)
22
23
24 Mapper
25 mapper=
26
27
28 Quantification method
29 quant_method=
30
31
32 Dif expression method
33 Requires contrasts to be defined (see below)
41
iRAP model of configuration file
34 de_method=
35
36
37 Gene set enrichment (GSE) analysis
38 Requires de_method to be defined
39 Tool to use (none|piano)
40 gse_tool=piano
41
42 gse_method (mean|median|sum|fisher|fisher-exact|stouffer|tailStrength|wilcoxon|
reporter|page) see Piano vignete documentation for more details
43 gse_method=fisher
44 gse_pvalue=005
45 Minimum number of genes in a gene set
46 gse_minsize=3
47
48
49
50 TSV file with gene annotation
51 Format IDNamelocussourcelnameGOGOtermKEGG
52 Description
53 ID=gene_id (this is mandatory and should match the one given in the gtf file)
54 Name=gene name
55 locus=chrstart--end
56 source=biotype
57 lname=gene name
58 GO=go ids (multiple values can be separated by)
59 GO=GO terms (multiple values can be separated by)
60 KEGG=Kegg ids (multiple values can be separated by)
61 If auto is defined then iRAP will try to generate the file
62 - this may take a considerable amount of time and will only work
63 for a reduced number of species
64 off - default value
65 annot_tsv=
66
67
68 QC
69 Check data (reads) quality (on|off|none)
70 on - reads are filtered out based on their quality
71 off - the quality of the reads is assessed but no filtering is done
72 none- no quality control is performed
73 qual_filtering=on
74
75 Trim all reads to the minimum read size after quality trimming - Yes (y)| No (n)
76 only applicable if qual_filtering is on
77 trim_reads=y
78
79 Minimum base quality accepted (def 10)
80 min_read_quality=10
81
42
iRAP model of configuration file
82 Contamination check (cont_index parameter) Reads that likely
83 originate from organisms other than the one under study can be
84 discarded during pre-processment of the reads This is done by
85 aligning the reads to the genomes of organisms that might be a
86 source of contamination and discard those that map with a high
87 degree of fidelity By default iRAP will check if the data is
88 contaminated by e-coli An example to create a contamination
89 database is provided in the examplesex_add2contaminationDBsh
90 script The value of the parameter should be the file name prefix of
91 the bowtie index files
92
93 Disable contamination check
94 cont_index=no
95 Default value
96 cont_index=$(data_dir)contaminatione_coli
97
98
99 Misc options
100
101 Number of threads that may be used by IRAP
102 max_threads=1
103
104 Exon level quantification Yes (y)| No (n)
105 exon_quant=y
106
107 Transcript level quantification Yes (y)| No (n)
108 transcript_quant=y
109 =============================================================================
110 full or relative path to the directory where all the data can be found
111 data_dir=data
112
113 the directory should be organized as follows (see directory data in IRAP toplevel
directory)
114
115 $data_dir
116 $data_dir
117 contamination
118 e_coli1ebwt
119 e_coli2ebwt
120 e_coli3ebwt
121 e_coli4ebwt
122 e_coliREADME
123 e_colirev1ebwt
124 e_colirev2eb
125 raw_data
126 $species
127 fastq
128 fastq
129
43
iRAP model of configuration file
130 reference
131 $species
132 $gtf_file
133 $reference
134
135 Notes
136 1) $ denotes the value defined for the variable
137 2) Since version 050 the raw data (fastqbam) files may be
138 distributed across several sub-folders
139
140
141 =============================================================================
142 Only necessary if you intend to perform Differential Expression analysis
143
144 contrasts=contrast_def [contrast_def ]
145 contrasts=purpleVsPink purpleVsGrey
146
147 definition of each constrast
148 contrast= group group [ group ]
149 purlpleVsPink=Purple Pink
150 purlpleVsGrey=Purple Grey
151
152 groups
153 GroupName= Library_name [Library_name ]
154 Purlple=myLib1 myLib2
155 Pink=myLib3
156 Grey=myLib4
157
158 optional parameter used in the report (HTML) generation
159 groups=Purple Pink Grey
160
161 technical replicates
162 technicalreplicates=myLib1myLib2myLib3mylib4
163
164 Note names of groups contrasts and libraries should start with a letter and
contain only alphanumeric characters and the character _
165
166 =============================================================================
167 Data
168
169
170 Information for each library
171 LibName=Fastq file
172 Note
173 1 LibName should start with a letter and contain only alphanumeric characters
and the character _ LibName should not contain in _1 or _2
174 2 LibName should be different from the name of the fastq file for instance
175 f1=f1fastq
176 will produce an error
44
iRAP model of configuration file
177
178 Single-end
179 myLib1=f1fastq
180 read size
181 myLib1_rs=75
182 quality encoding (33 or 64)
183 myLib1_qual=33
184
185 strand specific protocol
186 mylib1_strand=first
187 mylib1_strand=second
188 Default value is both (strands)
189 mylib1_strand=both
190
191 Have the file in a different sub-folder
192 mylib1_dir=somesubfolder
193
194 See SAMBAM specification for more details about the following two parameters
195 read group id (to be included in the BAM file) - this is not supported by all
mappers
196 myLib1_rgid=
197 sambam header lines to include in the BAM file
198 myLib1_shl=COtThis is a commentnCOtand another line
199
200 LibName=Fastq file
201 myLib2=f2fastq
202 read size
203 myLib2_rs=75
204 quality encoding (33 or 64)
205 myLib2_qual=33
206
207
208 Paired-end
209 LibName=Fastq files
210 myLib3=f3_1fastq f3_2fastq
211 read size
212 myLib3_rs=50
213 quality encoding (33 or 64)
214 myLib3_qual=33
215 insert size
216 myLib3_ins=350
217 standard deviation
218 myLib3_sd=60
219
220 LibName=Fastq files
221 myLib4=f4_1fastq f4_2fastq
222 read size
223 myLib4_rs=50
224 quality encoding (33 or 64)
45
iRAP model of configuration file
225 myLib4_qual=33
226 insert size
227 myLib4_ins=350
228 standard deviation
229 myLib4_sd=60
230
231
232
233
234 list the names of your single-end (se) and paired (pe) libraries
235 se=myLib1 myLib2
236 pe=myLib3 myLib4
237 No SE data
238 se=
239 No PE data
240 pe=
241
242
243
244 Passingoverriding parameters
245
246 It is possible to pass parameters to the mappers and quantification
247 methods but that should be done carefully since it may break the
248 pipeline (if the location of the input andor output files is
249 changed)
250
251 Overridingchanging the mappersrsquo parameters
252 _map_options=options
253 Example
254 tophat2_map_options=--min-intron-length 5 --no-coverage-search
255
256 Overridingchanging the parameters of the quantification methods
257 _params=options
258 Example
259 htseq_params= -q
46
Appendix C
iRAP example configuration file
1 minimal configuration file for DE
2 experiment name
3 name=ecoli_ex
4 species
5 species=ecoli_k12
6 reference genome
7 reference=Escherichia_coli_str_k_12_substr_mg1655GCA_000005845119dnatoplevel
fagz
8 gtf file
9 gtf_file=Escherichia_coli_str_k_12_substr_mg1655GCA_000005845119gtfgz
10 Enable filtering based on quality
11 qual_filtering=on
12 Use a contamination data set to filter out reads
13 cont_index=no
14 Toplevel directory with the data
15 data_dir=
16
17 some contrasts
18 GA=Group A
19 contrasts=GAvsGB GBvsGA
20 GAvsGB=GA GB
21 GBvsGA=GB GA
22 GA=FA FB FC
23 GB=FD FE FF
24
25 se=FA FB FC FD FE FF
26
27 FA=SRR933983fastqgz
28 FA_rs=50
29 FA_qual=33
30
31 FB=SRR933984fastqgz
32 FB_rs=50
47
iRAP example configuration file
33 FB_qual=33
34
35 FC=SRR933985fastqgz
36 FC_rs=50
37 FC_qual=33
38
39 FD=SRR933989fastqgz
40 FD_rs=50
41 FD_qual=33
42
43 FE=SRR933990fastqgz
44 FE_rs=50
45 FE_qual=33
46
47 FF=SRR933990fastqgz
48 FF_rs=50
49 FF_qual=33
50 EOF
48
- Front Page
- Table of Contents
- List of Figures
- List of Tables
- 1 Introduction
-
- 11 Context
- 12 Motivation and Goals
- 13 Proposed Solution
- 14 Structure of the Dissertation
-
- 2 Basic Concepts and Bibliographic Review
-
- 21 Biological Basic Concepts
-
- 211 Genome
- 212 Transcriptome Assembly and Gene expression
-
- 22 RNA-Seq Analysis
-
- 221 RNA-Seq microarrays and DNA sequencing
- 222 RNA-Seq Pipeline
-
- 23 Standard File Formats used
-
- 231 FASTA
- 232 FASTQ
- 233 SAM and BAM
- 234 GFF and GTF
-
- 24 Relevant Data Repositories
- 25 Tools for RNA-seq and Differential Analysis
- 26 Relational and Non-relational Databases
- 27 Tecnologies
- 28 Related Work
- 29 Chapter Summary
-
- 3 The Gemini framework
-
- 31 Gemini
- 32 Gemini Architecture
-
- 321 Physical Architecture
-
- 33 Data Management
- 34 Web Interface
- 35 Use cases
- 36 Case studies
-
- 361 Full pipeline
- 362 Stage pipeline
-
- 37 Chapter Summary
-
- 4 Case study
-
- 41 Samples characterization
- 42 Researching objectives
- 43 Protocol of analysis
- 44 Genome version GRCh37 versus GRCh38
- 45 Fusion genes
- 46 Results
-
- 461 Case study with reference genome GRCh37
- 462 Splicing analysis
- 463 Case study with reference genome GRCh38
-
- 47 Chapter Summary
-
- 5 Conclusions and Future Work
- References
- A iRAP tools supported
-
- A1 Mappers
- A2 Quantification
- A3 Differential expression [DE]
- A4 Gene set enrichment analysis [GSE]
-
- B iRAP model of configuration file
- C iRAP example configuration file
-
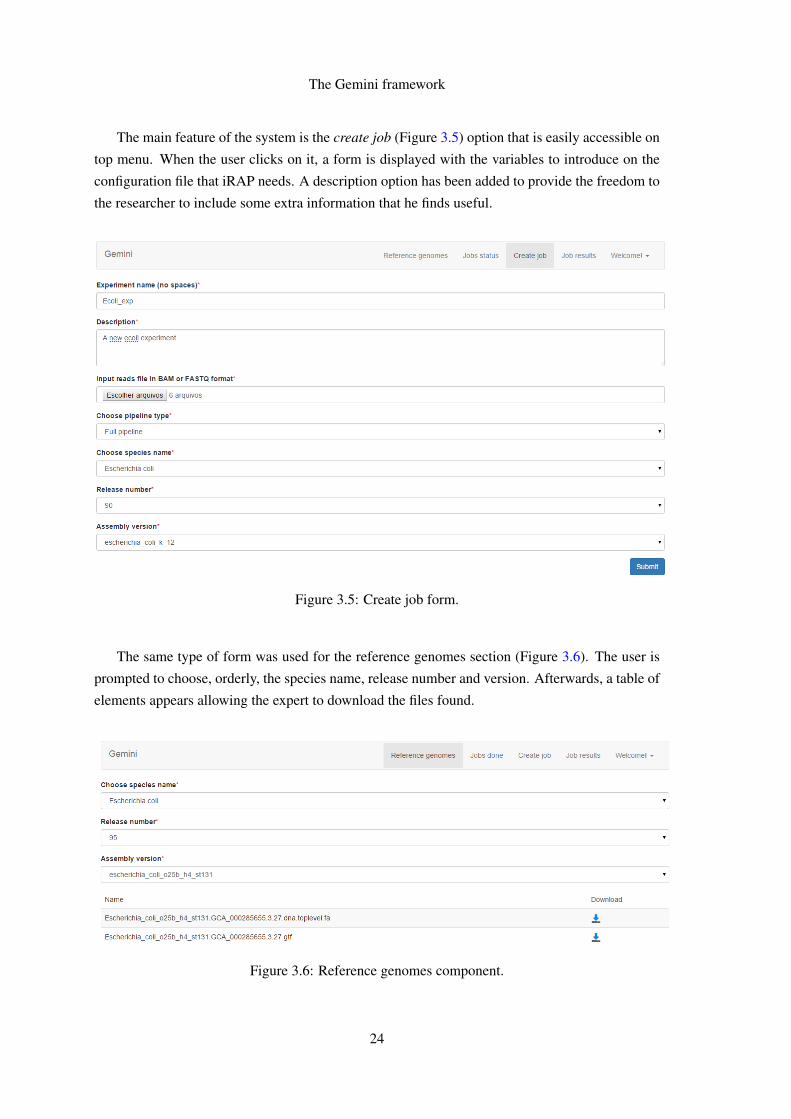
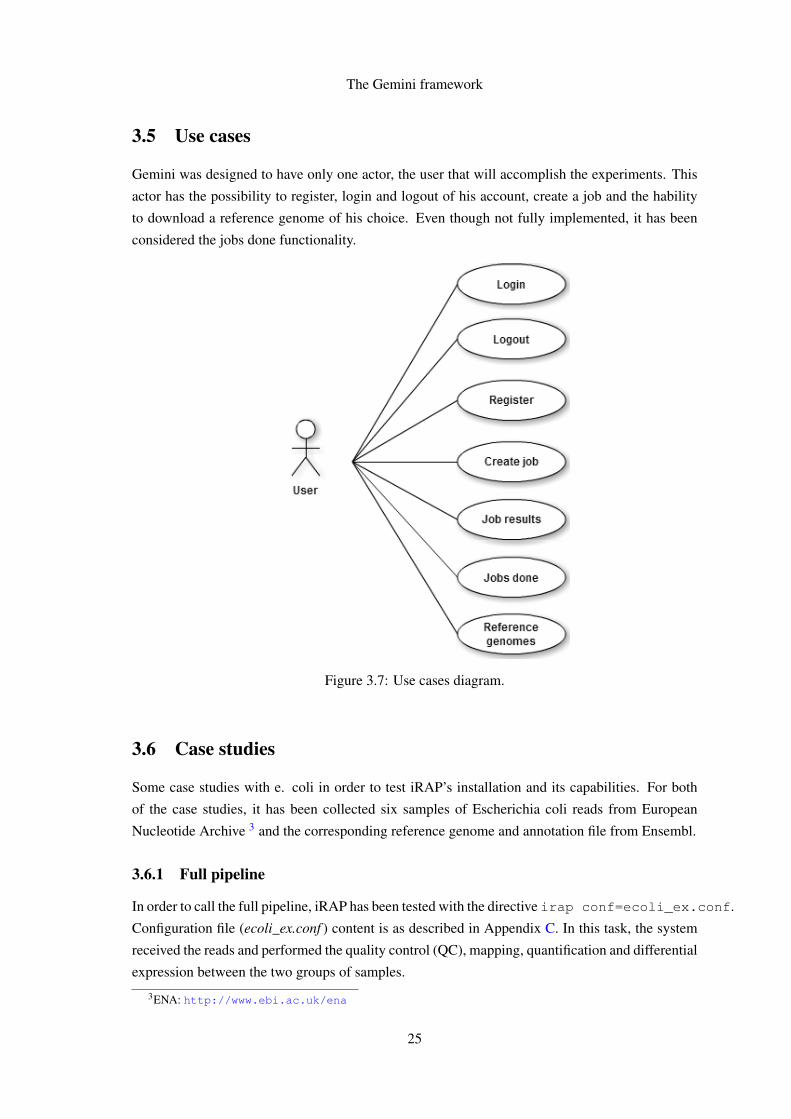
Case study
bull Average of alternative isoforms for each gene spliced
bull Potentially novel isoforms and how do they behave between samplesgroups of samples
bull Compare results between versions of human genome assembly
bull Retrieve fusion genes
43 Protocol of analysis
Collected sample reads have been aligned against reference genome GRCh37 with TopHat version
141 Posterior analysis followed Tuxedo Protocol as described in Trapnell et al [TRG+12b] An
overview of the full protocol can be found in Figure 41
For the implementation of this procedure it were considered as two different groups the cases
1 and 2 (wFTC) against cases 3 and 4 (mFTC) The following step was to assemble transcripts for
each sample with Cufflinks 1 and afterwards create a single merged transcriptome annotation with
Cuffmerge 2 Cuffdiff 3 was then used to find significant changes in transcript expression
In order to find potential isoforms each sample was ran against the reference genome with
Cuffcompare 4
44 Genome version GRCh37 versus GRCh38
Even though IPATIMUPrsquos data have been assembled with reference genome version GRCh37
nowadays a more recent version (GRCh38) has been released in 2013 This new assembly is the
first major revision of the human genome in more than four years 5
The main differences between this two versions are
Alternate sequences several human chromosomal regions have sufficient variability to prevent
adequate representation by a single sequence This new version provides alternate sequence
for selected variant regions through the inclusion of alternate loci 6 scaffolds
Centromere 7 representation Previous method of representing centromeric regions have been
replaced by sequences from centromere models The models provide the approximate repeat
number and order for each centromere and are useful for read mapping and variation studies
Mitochondrial genome The new mitochondrial reference sequence is the Revised Cambridge
Reference Sequence with RefSeq accession number NC_0129201 The previous one was
RefSeq accession number NC_001907 which was not updated when GRCh37 assembly
later transitioned to the new version1Cufflinks httpcole-trapnell-labgithubiocufflinks2Cuffmerge httpcole-trapnell-labgithubiocufflinkscuffmergeindexhtml3Cuffdiff httpcole-trapnell-labgithubiocufflinkscuffdiffindexhtml4Cuffcompare httpcole-trapnell-labgithubiocufflinkscuffcompareindexhtml5As in UCSC mailing list at httpsgroupsgooglecomasoeucsceduforumtopic
genome-announce52Kv41YBXNY6Specific location of a gene on a chromosome
28
Case study
Figure 41 An overview of the Tuxedo Protocol with full steps TopHat for alignment Cufflinkspackage to find differential features between group samples and in the end CummeRbund to plotprevious results
Sequence updates Several erroneous bases and misassembled regions have been corrected and
more than 100 gaps have been filled or reduced
Analysis set The new assembly offers an analysis set that was created to accommodate next
generation sequencing read alignment pipelines Several GRCh38 regions have been elimi-
nated from this set to improve read mapping
29
Case study
45 Fusion genes
After we done some research on the technologies used for finding fusion genes in the reads we
have not been able to perform the analysis to answer the last question of our researching objectives
DeFuse required as input the original reads which were not provided This analysis would have
been interesting for relating the ocurrence of thyroid and the presence of fusion genes as well as if
there was any relevant difference between the samples of wFTC and mFTC
46 Results
461 Case study with reference genome GRCh37
The following table ( 41) demonstrates some genes that were differentially expressed with signif-
icance between mFTC and wFTC According to Celestino et al 8 CRABP1 C1QL1 and LCN2
are biomarkers of thyroid cancer and predictors of extrathyroidal extension It is commonly used
the value of 005 has threshold above which the differential expression is significant By inspect-
ing out the table we can find C1QL1 with a q-value of 0000555 and CRABP1 with a q-value
of 159E-11 which are in concordance with the previous article Furthermore it is verified the
increased gene expression in wFTC when compared to mFTC
Gene ID Gene Chr mFTC wFTC Fold change(log2) Q value
ENSG00000167748 KLK1 19 018672 111924 922742 0ENSG00000104725 NEFL 8 00196645 276961 104599 0ENSG00000174145 KIAA1239 4 00307388 144265 887444 0ENSG00000182379 NXPH4 12 008307 195786 788074 0ENSG00000131094 C1QL1 17 0121453 238957 429828 0000555ENSG00000142677 IL22RAI 1 150905 0384783 -529345 0ENSG00000138615 CILP 15 423569 0052726 -632793 241E-11ENSG00000141431 ASXL3 18 18938 001408 -707148 124E-09ENSG00000166426 CRABP1 15 748375 0367899 -766831 159E-11ENSG00000214145 LINC00887 3 19797 0119327 -737421 0000459
Table 41 Genes differentially expressed between minimally invasive follicular thryoid carcino-mas (mFTCs) and widely invasive follicular thyroid carcinomas (wFTCs)
In response to the previous researching objectives the Table 42 has the statistical results for
taks two and three From the data analysis we could conclude that less than 1 of genes have
isoforms but each one has an average of 389 alternatives
8Ricardo Celestino Torfin Nome Ana Pestana Andreas M Hoff Pedro A Gonccedilalves Catarina Eloy Eva SigstadRagnhild A Lothe Trine Bjoslashro Manuel Sobrinho-Simotildees Rofl I Skotheim Paula Soares CRAPBP1 C1QL1 andLCN2 are biomarkers of thyroid cancer and predictors of extrathyroidal extension subbmited for publication
30
Case study
Total genes 63896Total significant isoforms 689Total unique genes with isoforms 179Ratio of unique genes with isoformsgenes () 028Average of alternatives per gene with isoforms 389
Table 42 Statistical results for researching objectives number 2 and 3
462 Splicing analysis
Forward in the analysis Cuffcompare 9 has been used to search for novel isoforms when com-
pared to the reference genome The method was to compare each sample to the reference genome
and afterwards make an overlap of the results The main objective was then to infer about the
differences among wFTC and mFTC
Sample 1(wFTC)
Sample 2(wFTC)
Sample 3(mFTC)
Sample 4(mFTC)
Total genes 30440 36862 35539 37534Potential novel isoforms 7406 8450 8781 8830Table 43 Potential novel isoforms for each sample of IPATIMUPrsquos data
As demonstrated on Table 43 average there is a percentage of 24 of potentially novel iso-
forms found (at least one spliced junction is shared with a reference transcript) There is been
made an overlap of the results in order to encounter differences between wFTC and mFTC The
Table 44 presents the counting of differences between cases A brief analysis allows us to say
that we can not make any relationship between wFTC and mFTC On average there was a total of
3722 changes among this two sets The average within the sets are 3554 for wFTC and 3992 for
mFTC Given this results there was not a significant divergence to allow us to relate the splicing
and the occurrence of a more invasive Thyroid Carcinoma
Sets ChangesS1 S2 3554S1 S3 3609S1 S4 3612S2 S3 3847S2 S4 3820S3 S4 3929
Table 44 Number of differences between samples Syntax used S1 - Sample 1 S2 - Sample 2S3 - Sample 3 and S4 - Sample 4
9Cuffcompare httpcole-trapnell-labgithubiocufflinkscuffcompareindexhtml
31
Case study
463 Case study with reference genome GRCh38
In order to respond to the last research objective it has been applied the method of analysis has
before with a more recent human genome assembly After using the same protocol with Cufflinks
Cuffmerge and Cuffdiff sequentially we have come to some conclusions
The produced results of differential expression analysis for the same genes were very different
Genes that were highly significant before like C1QL1 and CRABP1 now had no relevance (q-
value gt 005) As mentioned before we had only access to TopHatrsquos output that used version
GRCh37 for the alignment and mapping process so we could not start from scratch the analysis
This outcome demonstrates two topics in particular
1 the introduction of novel annotations can make previous analysis outdated
2 there is the need to save the original reads in order to update earlier studies
The solution to this situation would have been to use the original reads to repeat the assembly
and then follow the Tuxedo protocol to collected correct and updated differential expression data
47 Chapter Summary
These section of development has been introduced in order to confer not only validation but also
to do some researching studies on the subject Four samples were collected and divided into two
distinct groups Tuxedo protocol was followed for responding to the research objectives The
case study for GRCh37 demonstrated the expression of C1QL1 and CRABP1 on wFTC when
compared to mFTC as indicated in the referred article On the other hand the same protocol when
applied with GRCh38 demonstrated the importance of saving the original reads and what is the
influence of newer releases in previous researching results Lastly the splicing analysis results did
not show any evidence of related isoforms count and the manifestation of the different stages of
the disease
32
Chapter 5
Conclusions and Future Work
The research of genomic-based cancers require highly complex data analysis Such analysis re-
quire most often the use of a large number of complex computational resources the gathering
of a lot of information over the Internet and the use of powerful computational resources Fur-
thermore the manipulation of the computational tools and resources require the assistance of an
informatics expert
The thesis work is a contribution towards the solution of the above mention problem We
propose and developed a framework that enables an expert biologist to perform genomic-based
complex analysis in a easy way and using the required powerful computational resources in a
transparent way
Using the developed framework we have used real data to address several research questions
provided by IPATIMUPrsquos researchers Firstly with the human genome GRCh37 we identified
two of the biomarkers of thyroid cancer by differential gene expression analysis Secondly we
found 689 significant isoforms 179 unique out of 63896 genes (ratio of 028) with an average
of 389 isoforms per gene Thirdly when trying to determine potential novel isoforms we came
at no conclusion of the differences of expression when comparing wFTC and mFTC The last
case was applying the Tuxedo protocol with the new GRCh38 on samples The outcome of the
experiment revealed the importance of saving the original reads and that newer releases become
previous analysis outdated
Future Work
This thesis work is just a starting point As stated before the framework was designed so it can be
extended with further modules to enable addressing other research questions
The case studies also showed us that RNA-seq analysis is very time consuming On the other
hand there are a lot of sub-tasks that can be run in parallel (like the task of aligning the reads)
33
Conclusions and Future Work
We will study and compare different techniques and opportunities to make RNA-seq in parallel as
much as possible
34
References
[bNE] Scitable by Nature Education Transcriptome available at httpwwwnaturecomscitabledefinitiontranscriptome-296 last accessJanuary 2015
[CAB+15] Fiona Cunningham M Ridwan Amode Daniel Barrell Kathryn Beal Konstanti-nos Billis Simon Brent Denise Carvalho-Silva Peter Clapham Guy CoatesStephen Fitzgerald Laurent Gil Carlos Garciacutea Giroacuten Leo Gordon ThibautHourlier Sarah E Hunt Sophie H Janacek Nathan Johnson Thomas Juette-mann Andreas K Kaumlhaumlri Stephen Keenan Fergal J Martin Thomas MaurelWilliam McLaren Daniel N Murphy Rishi Nag Bert Overduin Anne ParkerMateus Patricio Emily Perry Miguel Pignatelli Harpreet Singh Riat DanielSheppard Kieron Taylor Anja Thormann Alessandro Vullo Steven P WilderAmonida Zadissa Bronwen L Aken Ewan Birney Jennifer Harrow Rhoda Kin-sella Matthieu Muffato Magali Ruffier Stephen MJ Searle Giulietta SpudichStephen J Trevanion Andy Yates Daniel R Zerbino and Paul Flicek Ensembl2015 Nucleic Acids Research 43(D1)D662ndashD669 2015
[CFG+10] Peter J A Cock Christopher J Fields Naohisa Goto Michael L Heuer and Peter MRice The Sanger FASTQ file format for sequences with quality scores and theSolexaIllumina FASTQ variants Nucleic acids research 38(6)1767ndash71 April2010
[CH07] Geoffrey M Cooper and Robert E Hausman The Cell - A molecular approachAmerican Society for Microbiology 2007
[Cod70] E F Codd A relational model of data for large shared data banks Communica-tions of the ACM 13(6)377ndash387 June 1970
[Con11] The ENCODE Project Consortium A userrsquos guide to the encyclopedia of DNAelements (ENCODE) PLoS biology 9(4)e1001046 April 2011
[FMB14] N A Fonseca J A Marioni and A Brazma RNA-seq gene profiling - a system-atic empirical comparison Technical report May 2014
[FPMB14] Nuno A Fonseca Robert Petryszak John Marioni and Alvis Brazma irap - anintegrated rna-seq analysis pipeline bioRxiv 2014
[GCW+10] Qiang Gan Iouri Chepelev Gang Wei Lama Tarayrah Kairong Cui Keji Zhaoand Xin Chen Dynamic regulation of alternative splicing and chromatin structurein Drosophila gonads revealed by RNA-seq Cell research 20(7)763ndash83 July2010
35
REFERENCES
[GEN] GENIE Dna genes and chromossomes University of Leicesteravailable at httpwww2leacukdepartmentsgeneticsvgecschoolscollegestopicsdna-genes-chromosomes last access Jan-uary 2015
[Gri] Malachi Griffith Bioinformatics for Cancer Genomics (BiCG)available at httpbioinformaticscaworkshops2012bioinformatics-cancer-genomics-bicg last access January 2015
[GTBK11] Angela Goncalves Andrew Tikhonov Alvis Brazma and Misha Kapushesky Apipeline for RNA-seq data processing and quality assessment Bioinformatics (Ox-ford England) 27(6)867ndash9 March 2011
[HBB+02] T Hubbard D Barker E Birney G Cameron Y Chen L Clark T CoxJ Cuff V Curwen T Down R Durbin E Eyras J Gilbert M HammondL Huminiecki A Kasprzyk H Lehvaslaiho P Lijnzaad C Melsopp E Mon-gin R Pettett M Pocock S Potter A Rust E Schmidt S Searle G SlaterJ Smith W Spooner A Stabenau J Stalker E Stupka A Ureta-Vidal I Vastrikand M Clamp The ensembl genome database project Nucleic Acids Research30(1)38ndash41 2002
[HBD+13] R Hitzemann D Bottomly P Darakjian N Walter O Iancu R SearlesB Wilmot and S McWeeney Genes behavior and next-generation RNA se-quencing Genes Brain Behav 12(1)1ndash12 Feb 2013
[Ins] National Human Genome Research Institute Transcriptome available at httpwwwgenomegov13014330 last access January 2015
[Joh03] Jason M Johnson Genome-wide survey of human alternative pre-mrna splicingwith exon junction microarrays Science 3022141ndash2144 December 2003
[kn10] Gene set enrichment a problem of pathways Briefings in functional genomics9(5-6)385ndash90 December 2010
[kn11] Overview of available methods for diverse RNA-Seq data analyses Science ChinaLife sciences 54(12)1121ndash8 December 2011
[Lan10] Ben Langmead Aligning short sequencing reads with Bowtie Current proto-cols in bioinformatics editoral board Andreas D Baxevanis [et al] Chapter11Unit 117 December 2010
[LM10] Adam Lith and Jakob Mattsson Investigating storage solutions for large data - acomparison of well performing and scalable data storage solutions for real timeextraction and batch insertion of data Masterrsquos thesis 2010
[LTPS09] Ben Langmead Cole Trapnell Mihai Pop and Steven L Salzberg Ultrafastand memory-efficient alignment of short DNA sequences to the human genomeGenome biology 10(3)R25 January 2009
[ORY10] Alicia Oshlack Mark D Robinson and Matthew D Young From RNA-seq readsto differential expression results Genome biology 11(12)220 January 2010
[SG15] Marc W Schmid and Ueli Grossniklaus Rcount simple and flexible RNA-Seqread counting Bioinformatics 31(3)436ndash437 February 2015
36
REFERENCES
[SK11] Christof Strauch and Walter Kriha NoSQL databases Lecture Notes StuttgartMedia University February 2011
[SOdMVN12] Mikhail Shugay Intildeigo Ortiz de Mendiacutebil Joseacute L Vizmanos and Francisco JNovo Genomic hallmarks of genes involved in chromosomal translocations inhematological cancer PLoS Comput Biol 8(12)e1002797 12 2012
[The04] The ENCODE Project Consortium The ENCODE (ENCyclopedia Of DNA Ele-ments) Project Science (New York NY) 306(5696)636ndash40 October 2004
[TPS09] Cole Trapnell Lior Pachter and Steven L Salzberg TopHat discovering splicejunctions with RNA-Seq Bioinformatics (Oxford England) 25(9)1105ndash11 May2009
[TRG+12a] Cole Trapnell Adam Roberts Loyal Goff Geo Pertea Daehwan Kim David RKelley Harold Pimentel Steven L Salzberg John L Rinn and Lior Pachter Dif-ferential gene and transcript expression analysis of RNA-seq experiments withTopHat and Cufflinks Nature protocols 7(3)562ndash78 March 2012
[TRG+12b] Cole Trapnell Adam Roberts Loyal Goff Geo Pertea Daehwan Kim David RKelley Harold Pimentel Steven L Salzberg John L Rinn and Lior Pachter Dif-ferential gene and transcript expression analysis of RNA-seq experiments withTopHat and Cufflinks Nature protocols 7(3)562ndash78 March 2012
[WMM+11] Ying Wang Gaurang Mehta Rajiv Mayani Jingxi Lu Tade Souaiaia YanghoChen Andrew Clark Hee Jae Yoon Lin Wan Oleg V Evgrafov James AKnowles Ewa Deelman and Ting Chen RseqFlow workflows for RNA-Seq dataanalysis Bioinformatics (Oxford England) 27(18)2598ndash600 September 2011
[Wol13] Jochen B W Wolf Principles of transcriptome analysis and gene expressionquantification an rna-seq tutorial Molecular Ecology Resources 13(4)559ndash5722013
[ZW09] Mark Gerstein |amp Michael Snyder Zhong Wang Rna-seq a revolutionary tool fortranscriptomics Nature Reviews Genetics 1057ndash63 January 2009
37
REFERENCES
38
Appendix A
iRAP tools supported
A1 Mappers
Mapper Option name (mapper)TopHat 1 tophat1TopHat 2 tophat2SMALT smaltGSNAP gsnapSOAPsplice soapspliceBWA bwa1BWA bwa2Bowtie 1 bowtie1Bowtie2 bowtie2GEM gemSTAR starOSA osaMapSplice mapsplice
A2 Quantification
Quantifier Option name (quant_method)FluxCapacitor flux_capHT-Seq (union mode) htseq1HT-Seq (intersection non-empty mode) htseq2Cufflinks 1 (try to find novel transcripts-g) cufflinks1Cufflinks 2 (try to find novel transcripts-g) cufflinks2Cufflinks 1 (do not assemble novel transcripts-G) cufflinks1_ndCufflinks 2 (do not assemble novel transcripts-G) cufflinks2_ndNURD nurd
39
iRAP tools supported
A3 Differential expression [DE]
Method Option name (de_method)DESeq deseqDESeq2 deseq2EdgeR edgerCuffdiff 1 cuffdiff1Cuffdiff 2 cuffdiff2
A4 Gene set enrichment analysis [GSE]
Tool Option name (gse_tool)Piano piano
40
Appendix B
iRAP model of configuration file
1 This is a comment (lines that start with a are ignored by iRAP)
2 =============================================================================
3 name that you want to give to the experiment (no spaces)
4 All files produced by irap will be placed in a folder with the given name
5 name=myexp
6
7
8 =============================================================================
9 name of the species
10 species=homo_sapiens
11
12 =============================================================================
13 Fasta file with the reference genome
14 reference=Homo_sapiensGRCh3766dnafa
15
16 =============================================================================
17 GTF file with the annotations
18 gtf_file=Homo_sapiensGRCh3766gtf
19
20 =============================================================================
21 IRAP options (may be providedoverriden in the command line)
22
23
24 Mapper
25 mapper=
26
27
28 Quantification method
29 quant_method=
30
31
32 Dif expression method
33 Requires contrasts to be defined (see below)
41
iRAP model of configuration file
34 de_method=
35
36
37 Gene set enrichment (GSE) analysis
38 Requires de_method to be defined
39 Tool to use (none|piano)
40 gse_tool=piano
41
42 gse_method (mean|median|sum|fisher|fisher-exact|stouffer|tailStrength|wilcoxon|
reporter|page) see Piano vignete documentation for more details
43 gse_method=fisher
44 gse_pvalue=005
45 Minimum number of genes in a gene set
46 gse_minsize=3
47
48
49
50 TSV file with gene annotation
51 Format IDNamelocussourcelnameGOGOtermKEGG
52 Description
53 ID=gene_id (this is mandatory and should match the one given in the gtf file)
54 Name=gene name
55 locus=chrstart--end
56 source=biotype
57 lname=gene name
58 GO=go ids (multiple values can be separated by)
59 GO=GO terms (multiple values can be separated by)
60 KEGG=Kegg ids (multiple values can be separated by)
61 If auto is defined then iRAP will try to generate the file
62 - this may take a considerable amount of time and will only work
63 for a reduced number of species
64 off - default value
65 annot_tsv=
66
67
68 QC
69 Check data (reads) quality (on|off|none)
70 on - reads are filtered out based on their quality
71 off - the quality of the reads is assessed but no filtering is done
72 none- no quality control is performed
73 qual_filtering=on
74
75 Trim all reads to the minimum read size after quality trimming - Yes (y)| No (n)
76 only applicable if qual_filtering is on
77 trim_reads=y
78
79 Minimum base quality accepted (def 10)
80 min_read_quality=10
81
42
iRAP model of configuration file
82 Contamination check (cont_index parameter) Reads that likely
83 originate from organisms other than the one under study can be
84 discarded during pre-processment of the reads This is done by
85 aligning the reads to the genomes of organisms that might be a
86 source of contamination and discard those that map with a high
87 degree of fidelity By default iRAP will check if the data is
88 contaminated by e-coli An example to create a contamination
89 database is provided in the examplesex_add2contaminationDBsh
90 script The value of the parameter should be the file name prefix of
91 the bowtie index files
92
93 Disable contamination check
94 cont_index=no
95 Default value
96 cont_index=$(data_dir)contaminatione_coli
97
98
99 Misc options
100
101 Number of threads that may be used by IRAP
102 max_threads=1
103
104 Exon level quantification Yes (y)| No (n)
105 exon_quant=y
106
107 Transcript level quantification Yes (y)| No (n)
108 transcript_quant=y
109 =============================================================================
110 full or relative path to the directory where all the data can be found
111 data_dir=data
112
113 the directory should be organized as follows (see directory data in IRAP toplevel
directory)
114
115 $data_dir
116 $data_dir
117 contamination
118 e_coli1ebwt
119 e_coli2ebwt
120 e_coli3ebwt
121 e_coli4ebwt
122 e_coliREADME
123 e_colirev1ebwt
124 e_colirev2eb
125 raw_data
126 $species
127 fastq
128 fastq
129
43
iRAP model of configuration file
130 reference
131 $species
132 $gtf_file
133 $reference
134
135 Notes
136 1) $ denotes the value defined for the variable
137 2) Since version 050 the raw data (fastqbam) files may be
138 distributed across several sub-folders
139
140
141 =============================================================================
142 Only necessary if you intend to perform Differential Expression analysis
143
144 contrasts=contrast_def [contrast_def ]
145 contrasts=purpleVsPink purpleVsGrey
146
147 definition of each constrast
148 contrast= group group [ group ]
149 purlpleVsPink=Purple Pink
150 purlpleVsGrey=Purple Grey
151
152 groups
153 GroupName= Library_name [Library_name ]
154 Purlple=myLib1 myLib2
155 Pink=myLib3
156 Grey=myLib4
157
158 optional parameter used in the report (HTML) generation
159 groups=Purple Pink Grey
160
161 technical replicates
162 technicalreplicates=myLib1myLib2myLib3mylib4
163
164 Note names of groups contrasts and libraries should start with a letter and
contain only alphanumeric characters and the character _
165
166 =============================================================================
167 Data
168
169
170 Information for each library
171 LibName=Fastq file
172 Note
173 1 LibName should start with a letter and contain only alphanumeric characters
and the character _ LibName should not contain in _1 or _2
174 2 LibName should be different from the name of the fastq file for instance
175 f1=f1fastq
176 will produce an error
44
iRAP model of configuration file
177
178 Single-end
179 myLib1=f1fastq
180 read size
181 myLib1_rs=75
182 quality encoding (33 or 64)
183 myLib1_qual=33
184
185 strand specific protocol
186 mylib1_strand=first
187 mylib1_strand=second
188 Default value is both (strands)
189 mylib1_strand=both
190
191 Have the file in a different sub-folder
192 mylib1_dir=somesubfolder
193
194 See SAMBAM specification for more details about the following two parameters
195 read group id (to be included in the BAM file) - this is not supported by all
mappers
196 myLib1_rgid=
197 sambam header lines to include in the BAM file
198 myLib1_shl=COtThis is a commentnCOtand another line
199
200 LibName=Fastq file
201 myLib2=f2fastq
202 read size
203 myLib2_rs=75
204 quality encoding (33 or 64)
205 myLib2_qual=33
206
207
208 Paired-end
209 LibName=Fastq files
210 myLib3=f3_1fastq f3_2fastq
211 read size
212 myLib3_rs=50
213 quality encoding (33 or 64)
214 myLib3_qual=33
215 insert size
216 myLib3_ins=350
217 standard deviation
218 myLib3_sd=60
219
220 LibName=Fastq files
221 myLib4=f4_1fastq f4_2fastq
222 read size
223 myLib4_rs=50
224 quality encoding (33 or 64)
45
iRAP model of configuration file
225 myLib4_qual=33
226 insert size
227 myLib4_ins=350
228 standard deviation
229 myLib4_sd=60
230
231
232
233
234 list the names of your single-end (se) and paired (pe) libraries
235 se=myLib1 myLib2
236 pe=myLib3 myLib4
237 No SE data
238 se=
239 No PE data
240 pe=
241
242
243
244 Passingoverriding parameters
245
246 It is possible to pass parameters to the mappers and quantification
247 methods but that should be done carefully since it may break the
248 pipeline (if the location of the input andor output files is
249 changed)
250
251 Overridingchanging the mappersrsquo parameters
252 _map_options=options
253 Example
254 tophat2_map_options=--min-intron-length 5 --no-coverage-search
255
256 Overridingchanging the parameters of the quantification methods
257 _params=options
258 Example
259 htseq_params= -q
46
Appendix C
iRAP example configuration file
1 minimal configuration file for DE
2 experiment name
3 name=ecoli_ex
4 species
5 species=ecoli_k12
6 reference genome
7 reference=Escherichia_coli_str_k_12_substr_mg1655GCA_000005845119dnatoplevel
fagz
8 gtf file
9 gtf_file=Escherichia_coli_str_k_12_substr_mg1655GCA_000005845119gtfgz
10 Enable filtering based on quality
11 qual_filtering=on
12 Use a contamination data set to filter out reads
13 cont_index=no
14 Toplevel directory with the data
15 data_dir=
16
17 some contrasts
18 GA=Group A
19 contrasts=GAvsGB GBvsGA
20 GAvsGB=GA GB
21 GBvsGA=GB GA
22 GA=FA FB FC
23 GB=FD FE FF
24
25 se=FA FB FC FD FE FF
26
27 FA=SRR933983fastqgz
28 FA_rs=50
29 FA_qual=33
30
31 FB=SRR933984fastqgz
32 FB_rs=50
47
iRAP example configuration file
33 FB_qual=33
34
35 FC=SRR933985fastqgz
36 FC_rs=50
37 FC_qual=33
38
39 FD=SRR933989fastqgz
40 FD_rs=50
41 FD_qual=33
42
43 FE=SRR933990fastqgz
44 FE_rs=50
45 FE_qual=33
46
47 FF=SRR933990fastqgz
48 FF_rs=50
49 FF_qual=33
50 EOF
48
- Front Page
- Table of Contents
- List of Figures
- List of Tables
- 1 Introduction
-
- 11 Context
- 12 Motivation and Goals
- 13 Proposed Solution
- 14 Structure of the Dissertation
-
- 2 Basic Concepts and Bibliographic Review
-
- 21 Biological Basic Concepts
-
- 211 Genome
- 212 Transcriptome Assembly and Gene expression
-
- 22 RNA-Seq Analysis
-
- 221 RNA-Seq microarrays and DNA sequencing
- 222 RNA-Seq Pipeline
-
- 23 Standard File Formats used
-
- 231 FASTA
- 232 FASTQ
- 233 SAM and BAM
- 234 GFF and GTF
-
- 24 Relevant Data Repositories
- 25 Tools for RNA-seq and Differential Analysis
- 26 Relational and Non-relational Databases
- 27 Tecnologies
- 28 Related Work
- 29 Chapter Summary
-
- 3 The Gemini framework
-
- 31 Gemini
- 32 Gemini Architecture
-
- 321 Physical Architecture
-
- 33 Data Management
- 34 Web Interface
- 35 Use cases
- 36 Case studies
-
- 361 Full pipeline
- 362 Stage pipeline
-
- 37 Chapter Summary
-
- 4 Case study
-
- 41 Samples characterization
- 42 Researching objectives
- 43 Protocol of analysis
- 44 Genome version GRCh37 versus GRCh38
- 45 Fusion genes
- 46 Results
-
- 461 Case study with reference genome GRCh37
- 462 Splicing analysis
- 463 Case study with reference genome GRCh38
-
- 47 Chapter Summary
-
- 5 Conclusions and Future Work
- References
- A iRAP tools supported
-
- A1 Mappers
- A2 Quantification
- A3 Differential expression [DE]
- A4 Gene set enrichment analysis [GSE]
-
- B iRAP model of configuration file
- C iRAP example configuration file
-
Case study
Total genes 63896Total significant isoforms 689Total unique genes with isoforms 179Ratio of unique genes with isoformsgenes () 028Average of alternatives per gene with isoforms 389
Table 42 Statistical results for researching objectives number 2 and 3
462 Splicing analysis
Forward in the analysis Cuffcompare 9 has been used to search for novel isoforms when com-
pared to the reference genome The method was to compare each sample to the reference genome
and afterwards make an overlap of the results The main objective was then to infer about the
differences among wFTC and mFTC
Sample 1(wFTC)
Sample 2(wFTC)
Sample 3(mFTC)
Sample 4(mFTC)
Total genes 30440 36862 35539 37534Potential novel isoforms 7406 8450 8781 8830Table 43 Potential novel isoforms for each sample of IPATIMUPrsquos data
As demonstrated on Table 43 average there is a percentage of 24 of potentially novel iso-
forms found (at least one spliced junction is shared with a reference transcript) There is been
made an overlap of the results in order to encounter differences between wFTC and mFTC The
Table 44 presents the counting of differences between cases A brief analysis allows us to say
that we can not make any relationship between wFTC and mFTC On average there was a total of
3722 changes among this two sets The average within the sets are 3554 for wFTC and 3992 for
mFTC Given this results there was not a significant divergence to allow us to relate the splicing
and the occurrence of a more invasive Thyroid Carcinoma
Sets ChangesS1 S2 3554S1 S3 3609S1 S4 3612S2 S3 3847S2 S4 3820S3 S4 3929
Table 44 Number of differences between samples Syntax used S1 - Sample 1 S2 - Sample 2S3 - Sample 3 and S4 - Sample 4
9Cuffcompare httpcole-trapnell-labgithubiocufflinkscuffcompareindexhtml
31
Case study
463 Case study with reference genome GRCh38
In order to respond to the last research objective it has been applied the method of analysis has
before with a more recent human genome assembly After using the same protocol with Cufflinks
Cuffmerge and Cuffdiff sequentially we have come to some conclusions
The produced results of differential expression analysis for the same genes were very different
Genes that were highly significant before like C1QL1 and CRABP1 now had no relevance (q-
value gt 005) As mentioned before we had only access to TopHatrsquos output that used version
GRCh37 for the alignment and mapping process so we could not start from scratch the analysis
This outcome demonstrates two topics in particular
1 the introduction of novel annotations can make previous analysis outdated
2 there is the need to save the original reads in order to update earlier studies
The solution to this situation would have been to use the original reads to repeat the assembly
and then follow the Tuxedo protocol to collected correct and updated differential expression data
47 Chapter Summary
These section of development has been introduced in order to confer not only validation but also
to do some researching studies on the subject Four samples were collected and divided into two
distinct groups Tuxedo protocol was followed for responding to the research objectives The
case study for GRCh37 demonstrated the expression of C1QL1 and CRABP1 on wFTC when
compared to mFTC as indicated in the referred article On the other hand the same protocol when
applied with GRCh38 demonstrated the importance of saving the original reads and what is the
influence of newer releases in previous researching results Lastly the splicing analysis results did
not show any evidence of related isoforms count and the manifestation of the different stages of
the disease
32
Chapter 5
Conclusions and Future Work
The research of genomic-based cancers require highly complex data analysis Such analysis re-
quire most often the use of a large number of complex computational resources the gathering
of a lot of information over the Internet and the use of powerful computational resources Fur-
thermore the manipulation of the computational tools and resources require the assistance of an
informatics expert
The thesis work is a contribution towards the solution of the above mention problem We
propose and developed a framework that enables an expert biologist to perform genomic-based
complex analysis in a easy way and using the required powerful computational resources in a
transparent way
Using the developed framework we have used real data to address several research questions
provided by IPATIMUPrsquos researchers Firstly with the human genome GRCh37 we identified
two of the biomarkers of thyroid cancer by differential gene expression analysis Secondly we
found 689 significant isoforms 179 unique out of 63896 genes (ratio of 028) with an average
of 389 isoforms per gene Thirdly when trying to determine potential novel isoforms we came
at no conclusion of the differences of expression when comparing wFTC and mFTC The last
case was applying the Tuxedo protocol with the new GRCh38 on samples The outcome of the
experiment revealed the importance of saving the original reads and that newer releases become
previous analysis outdated
Future Work
This thesis work is just a starting point As stated before the framework was designed so it can be
extended with further modules to enable addressing other research questions
The case studies also showed us that RNA-seq analysis is very time consuming On the other
hand there are a lot of sub-tasks that can be run in parallel (like the task of aligning the reads)
33
Conclusions and Future Work
We will study and compare different techniques and opportunities to make RNA-seq in parallel as
much as possible
34
References
[bNE] Scitable by Nature Education Transcriptome available at httpwwwnaturecomscitabledefinitiontranscriptome-296 last accessJanuary 2015
[CAB+15] Fiona Cunningham M Ridwan Amode Daniel Barrell Kathryn Beal Konstanti-nos Billis Simon Brent Denise Carvalho-Silva Peter Clapham Guy CoatesStephen Fitzgerald Laurent Gil Carlos Garciacutea Giroacuten Leo Gordon ThibautHourlier Sarah E Hunt Sophie H Janacek Nathan Johnson Thomas Juette-mann Andreas K Kaumlhaumlri Stephen Keenan Fergal J Martin Thomas MaurelWilliam McLaren Daniel N Murphy Rishi Nag Bert Overduin Anne ParkerMateus Patricio Emily Perry Miguel Pignatelli Harpreet Singh Riat DanielSheppard Kieron Taylor Anja Thormann Alessandro Vullo Steven P WilderAmonida Zadissa Bronwen L Aken Ewan Birney Jennifer Harrow Rhoda Kin-sella Matthieu Muffato Magali Ruffier Stephen MJ Searle Giulietta SpudichStephen J Trevanion Andy Yates Daniel R Zerbino and Paul Flicek Ensembl2015 Nucleic Acids Research 43(D1)D662ndashD669 2015
[CFG+10] Peter J A Cock Christopher J Fields Naohisa Goto Michael L Heuer and Peter MRice The Sanger FASTQ file format for sequences with quality scores and theSolexaIllumina FASTQ variants Nucleic acids research 38(6)1767ndash71 April2010
[CH07] Geoffrey M Cooper and Robert E Hausman The Cell - A molecular approachAmerican Society for Microbiology 2007
[Cod70] E F Codd A relational model of data for large shared data banks Communica-tions of the ACM 13(6)377ndash387 June 1970
[Con11] The ENCODE Project Consortium A userrsquos guide to the encyclopedia of DNAelements (ENCODE) PLoS biology 9(4)e1001046 April 2011
[FMB14] N A Fonseca J A Marioni and A Brazma RNA-seq gene profiling - a system-atic empirical comparison Technical report May 2014
[FPMB14] Nuno A Fonseca Robert Petryszak John Marioni and Alvis Brazma irap - anintegrated rna-seq analysis pipeline bioRxiv 2014
[GCW+10] Qiang Gan Iouri Chepelev Gang Wei Lama Tarayrah Kairong Cui Keji Zhaoand Xin Chen Dynamic regulation of alternative splicing and chromatin structurein Drosophila gonads revealed by RNA-seq Cell research 20(7)763ndash83 July2010
35
REFERENCES
[GEN] GENIE Dna genes and chromossomes University of Leicesteravailable at httpwww2leacukdepartmentsgeneticsvgecschoolscollegestopicsdna-genes-chromosomes last access Jan-uary 2015
[Gri] Malachi Griffith Bioinformatics for Cancer Genomics (BiCG)available at httpbioinformaticscaworkshops2012bioinformatics-cancer-genomics-bicg last access January 2015
[GTBK11] Angela Goncalves Andrew Tikhonov Alvis Brazma and Misha Kapushesky Apipeline for RNA-seq data processing and quality assessment Bioinformatics (Ox-ford England) 27(6)867ndash9 March 2011
[HBB+02] T Hubbard D Barker E Birney G Cameron Y Chen L Clark T CoxJ Cuff V Curwen T Down R Durbin E Eyras J Gilbert M HammondL Huminiecki A Kasprzyk H Lehvaslaiho P Lijnzaad C Melsopp E Mon-gin R Pettett M Pocock S Potter A Rust E Schmidt S Searle G SlaterJ Smith W Spooner A Stabenau J Stalker E Stupka A Ureta-Vidal I Vastrikand M Clamp The ensembl genome database project Nucleic Acids Research30(1)38ndash41 2002
[HBD+13] R Hitzemann D Bottomly P Darakjian N Walter O Iancu R SearlesB Wilmot and S McWeeney Genes behavior and next-generation RNA se-quencing Genes Brain Behav 12(1)1ndash12 Feb 2013
[Ins] National Human Genome Research Institute Transcriptome available at httpwwwgenomegov13014330 last access January 2015
[Joh03] Jason M Johnson Genome-wide survey of human alternative pre-mrna splicingwith exon junction microarrays Science 3022141ndash2144 December 2003
[kn10] Gene set enrichment a problem of pathways Briefings in functional genomics9(5-6)385ndash90 December 2010
[kn11] Overview of available methods for diverse RNA-Seq data analyses Science ChinaLife sciences 54(12)1121ndash8 December 2011
[Lan10] Ben Langmead Aligning short sequencing reads with Bowtie Current proto-cols in bioinformatics editoral board Andreas D Baxevanis [et al] Chapter11Unit 117 December 2010
[LM10] Adam Lith and Jakob Mattsson Investigating storage solutions for large data - acomparison of well performing and scalable data storage solutions for real timeextraction and batch insertion of data Masterrsquos thesis 2010
[LTPS09] Ben Langmead Cole Trapnell Mihai Pop and Steven L Salzberg Ultrafastand memory-efficient alignment of short DNA sequences to the human genomeGenome biology 10(3)R25 January 2009
[ORY10] Alicia Oshlack Mark D Robinson and Matthew D Young From RNA-seq readsto differential expression results Genome biology 11(12)220 January 2010
[SG15] Marc W Schmid and Ueli Grossniklaus Rcount simple and flexible RNA-Seqread counting Bioinformatics 31(3)436ndash437 February 2015
36
REFERENCES
[SK11] Christof Strauch and Walter Kriha NoSQL databases Lecture Notes StuttgartMedia University February 2011
[SOdMVN12] Mikhail Shugay Intildeigo Ortiz de Mendiacutebil Joseacute L Vizmanos and Francisco JNovo Genomic hallmarks of genes involved in chromosomal translocations inhematological cancer PLoS Comput Biol 8(12)e1002797 12 2012
[The04] The ENCODE Project Consortium The ENCODE (ENCyclopedia Of DNA Ele-ments) Project Science (New York NY) 306(5696)636ndash40 October 2004
[TPS09] Cole Trapnell Lior Pachter and Steven L Salzberg TopHat discovering splicejunctions with RNA-Seq Bioinformatics (Oxford England) 25(9)1105ndash11 May2009
[TRG+12a] Cole Trapnell Adam Roberts Loyal Goff Geo Pertea Daehwan Kim David RKelley Harold Pimentel Steven L Salzberg John L Rinn and Lior Pachter Dif-ferential gene and transcript expression analysis of RNA-seq experiments withTopHat and Cufflinks Nature protocols 7(3)562ndash78 March 2012
[TRG+12b] Cole Trapnell Adam Roberts Loyal Goff Geo Pertea Daehwan Kim David RKelley Harold Pimentel Steven L Salzberg John L Rinn and Lior Pachter Dif-ferential gene and transcript expression analysis of RNA-seq experiments withTopHat and Cufflinks Nature protocols 7(3)562ndash78 March 2012
[WMM+11] Ying Wang Gaurang Mehta Rajiv Mayani Jingxi Lu Tade Souaiaia YanghoChen Andrew Clark Hee Jae Yoon Lin Wan Oleg V Evgrafov James AKnowles Ewa Deelman and Ting Chen RseqFlow workflows for RNA-Seq dataanalysis Bioinformatics (Oxford England) 27(18)2598ndash600 September 2011
[Wol13] Jochen B W Wolf Principles of transcriptome analysis and gene expressionquantification an rna-seq tutorial Molecular Ecology Resources 13(4)559ndash5722013
[ZW09] Mark Gerstein |amp Michael Snyder Zhong Wang Rna-seq a revolutionary tool fortranscriptomics Nature Reviews Genetics 1057ndash63 January 2009
37
REFERENCES
38
Appendix A
iRAP tools supported
A1 Mappers
Mapper Option name (mapper)TopHat 1 tophat1TopHat 2 tophat2SMALT smaltGSNAP gsnapSOAPsplice soapspliceBWA bwa1BWA bwa2Bowtie 1 bowtie1Bowtie2 bowtie2GEM gemSTAR starOSA osaMapSplice mapsplice
A2 Quantification
Quantifier Option name (quant_method)FluxCapacitor flux_capHT-Seq (union mode) htseq1HT-Seq (intersection non-empty mode) htseq2Cufflinks 1 (try to find novel transcripts-g) cufflinks1Cufflinks 2 (try to find novel transcripts-g) cufflinks2Cufflinks 1 (do not assemble novel transcripts-G) cufflinks1_ndCufflinks 2 (do not assemble novel transcripts-G) cufflinks2_ndNURD nurd
39
iRAP tools supported
A3 Differential expression [DE]
Method Option name (de_method)DESeq deseqDESeq2 deseq2EdgeR edgerCuffdiff 1 cuffdiff1Cuffdiff 2 cuffdiff2
A4 Gene set enrichment analysis [GSE]
Tool Option name (gse_tool)Piano piano
40
Appendix B
iRAP model of configuration file
1 This is a comment (lines that start with a are ignored by iRAP)
2 =============================================================================
3 name that you want to give to the experiment (no spaces)
4 All files produced by irap will be placed in a folder with the given name
5 name=myexp
6
7
8 =============================================================================
9 name of the species
10 species=homo_sapiens
11
12 =============================================================================
13 Fasta file with the reference genome
14 reference=Homo_sapiensGRCh3766dnafa
15
16 =============================================================================
17 GTF file with the annotations
18 gtf_file=Homo_sapiensGRCh3766gtf
19
20 =============================================================================
21 IRAP options (may be providedoverriden in the command line)
22
23
24 Mapper
25 mapper=
26
27
28 Quantification method
29 quant_method=
30
31
32 Dif expression method
33 Requires contrasts to be defined (see below)
41
iRAP model of configuration file
34 de_method=
35
36
37 Gene set enrichment (GSE) analysis
38 Requires de_method to be defined
39 Tool to use (none|piano)
40 gse_tool=piano
41
42 gse_method (mean|median|sum|fisher|fisher-exact|stouffer|tailStrength|wilcoxon|
reporter|page) see Piano vignete documentation for more details
43 gse_method=fisher
44 gse_pvalue=005
45 Minimum number of genes in a gene set
46 gse_minsize=3
47
48
49
50 TSV file with gene annotation
51 Format IDNamelocussourcelnameGOGOtermKEGG
52 Description
53 ID=gene_id (this is mandatory and should match the one given in the gtf file)
54 Name=gene name
55 locus=chrstart--end
56 source=biotype
57 lname=gene name
58 GO=go ids (multiple values can be separated by)
59 GO=GO terms (multiple values can be separated by)
60 KEGG=Kegg ids (multiple values can be separated by)
61 If auto is defined then iRAP will try to generate the file
62 - this may take a considerable amount of time and will only work
63 for a reduced number of species
64 off - default value
65 annot_tsv=
66
67
68 QC
69 Check data (reads) quality (on|off|none)
70 on - reads are filtered out based on their quality
71 off - the quality of the reads is assessed but no filtering is done
72 none- no quality control is performed
73 qual_filtering=on
74
75 Trim all reads to the minimum read size after quality trimming - Yes (y)| No (n)
76 only applicable if qual_filtering is on
77 trim_reads=y
78
79 Minimum base quality accepted (def 10)
80 min_read_quality=10
81
42
iRAP model of configuration file
82 Contamination check (cont_index parameter) Reads that likely
83 originate from organisms other than the one under study can be
84 discarded during pre-processment of the reads This is done by
85 aligning the reads to the genomes of organisms that might be a
86 source of contamination and discard those that map with a high
87 degree of fidelity By default iRAP will check if the data is
88 contaminated by e-coli An example to create a contamination
89 database is provided in the examplesex_add2contaminationDBsh
90 script The value of the parameter should be the file name prefix of
91 the bowtie index files
92
93 Disable contamination check
94 cont_index=no
95 Default value
96 cont_index=$(data_dir)contaminatione_coli
97
98
99 Misc options
100
101 Number of threads that may be used by IRAP
102 max_threads=1
103
104 Exon level quantification Yes (y)| No (n)
105 exon_quant=y
106
107 Transcript level quantification Yes (y)| No (n)
108 transcript_quant=y
109 =============================================================================
110 full or relative path to the directory where all the data can be found
111 data_dir=data
112
113 the directory should be organized as follows (see directory data in IRAP toplevel
directory)
114
115 $data_dir
116 $data_dir
117 contamination
118 e_coli1ebwt
119 e_coli2ebwt
120 e_coli3ebwt
121 e_coli4ebwt
122 e_coliREADME
123 e_colirev1ebwt
124 e_colirev2eb
125 raw_data
126 $species
127 fastq
128 fastq
129
43
iRAP model of configuration file
130 reference
131 $species
132 $gtf_file
133 $reference
134
135 Notes
136 1) $ denotes the value defined for the variable
137 2) Since version 050 the raw data (fastqbam) files may be
138 distributed across several sub-folders
139
140
141 =============================================================================
142 Only necessary if you intend to perform Differential Expression analysis
143
144 contrasts=contrast_def [contrast_def ]
145 contrasts=purpleVsPink purpleVsGrey
146
147 definition of each constrast
148 contrast= group group [ group ]
149 purlpleVsPink=Purple Pink
150 purlpleVsGrey=Purple Grey
151
152 groups
153 GroupName= Library_name [Library_name ]
154 Purlple=myLib1 myLib2
155 Pink=myLib3
156 Grey=myLib4
157
158 optional parameter used in the report (HTML) generation
159 groups=Purple Pink Grey
160
161 technical replicates
162 technicalreplicates=myLib1myLib2myLib3mylib4
163
164 Note names of groups contrasts and libraries should start with a letter and
contain only alphanumeric characters and the character _
165
166 =============================================================================
167 Data
168
169
170 Information for each library
171 LibName=Fastq file
172 Note
173 1 LibName should start with a letter and contain only alphanumeric characters
and the character _ LibName should not contain in _1 or _2
174 2 LibName should be different from the name of the fastq file for instance
175 f1=f1fastq
176 will produce an error
44
iRAP model of configuration file
177
178 Single-end
179 myLib1=f1fastq
180 read size
181 myLib1_rs=75
182 quality encoding (33 or 64)
183 myLib1_qual=33
184
185 strand specific protocol
186 mylib1_strand=first
187 mylib1_strand=second
188 Default value is both (strands)
189 mylib1_strand=both
190
191 Have the file in a different sub-folder
192 mylib1_dir=somesubfolder
193
194 See SAMBAM specification for more details about the following two parameters
195 read group id (to be included in the BAM file) - this is not supported by all
mappers
196 myLib1_rgid=
197 sambam header lines to include in the BAM file
198 myLib1_shl=COtThis is a commentnCOtand another line
199
200 LibName=Fastq file
201 myLib2=f2fastq
202 read size
203 myLib2_rs=75
204 quality encoding (33 or 64)
205 myLib2_qual=33
206
207
208 Paired-end
209 LibName=Fastq files
210 myLib3=f3_1fastq f3_2fastq
211 read size
212 myLib3_rs=50
213 quality encoding (33 or 64)
214 myLib3_qual=33
215 insert size
216 myLib3_ins=350
217 standard deviation
218 myLib3_sd=60
219
220 LibName=Fastq files
221 myLib4=f4_1fastq f4_2fastq
222 read size
223 myLib4_rs=50
224 quality encoding (33 or 64)
45
iRAP model of configuration file
225 myLib4_qual=33
226 insert size
227 myLib4_ins=350
228 standard deviation
229 myLib4_sd=60
230
231
232
233
234 list the names of your single-end (se) and paired (pe) libraries
235 se=myLib1 myLib2
236 pe=myLib3 myLib4
237 No SE data
238 se=
239 No PE data
240 pe=
241
242
243
244 Passingoverriding parameters
245
246 It is possible to pass parameters to the mappers and quantification
247 methods but that should be done carefully since it may break the
248 pipeline (if the location of the input andor output files is
249 changed)
250
251 Overridingchanging the mappersrsquo parameters
252 _map_options=options
253 Example
254 tophat2_map_options=--min-intron-length 5 --no-coverage-search
255
256 Overridingchanging the parameters of the quantification methods
257 _params=options
258 Example
259 htseq_params= -q
46
Appendix C
iRAP example configuration file
1 minimal configuration file for DE
2 experiment name
3 name=ecoli_ex
4 species
5 species=ecoli_k12
6 reference genome
7 reference=Escherichia_coli_str_k_12_substr_mg1655GCA_000005845119dnatoplevel
fagz
8 gtf file
9 gtf_file=Escherichia_coli_str_k_12_substr_mg1655GCA_000005845119gtfgz
10 Enable filtering based on quality
11 qual_filtering=on
12 Use a contamination data set to filter out reads
13 cont_index=no
14 Toplevel directory with the data
15 data_dir=
16
17 some contrasts
18 GA=Group A
19 contrasts=GAvsGB GBvsGA
20 GAvsGB=GA GB
21 GBvsGA=GB GA
22 GA=FA FB FC
23 GB=FD FE FF
24
25 se=FA FB FC FD FE FF
26
27 FA=SRR933983fastqgz
28 FA_rs=50
29 FA_qual=33
30
31 FB=SRR933984fastqgz
32 FB_rs=50
47
iRAP example configuration file
33 FB_qual=33
34
35 FC=SRR933985fastqgz
36 FC_rs=50
37 FC_qual=33
38
39 FD=SRR933989fastqgz
40 FD_rs=50
41 FD_qual=33
42
43 FE=SRR933990fastqgz
44 FE_rs=50
45 FE_qual=33
46
47 FF=SRR933990fastqgz
48 FF_rs=50
49 FF_qual=33
50 EOF
48
- Front Page
- Table of Contents
- List of Figures
- List of Tables
- 1 Introduction
-
- 11 Context
- 12 Motivation and Goals
- 13 Proposed Solution
- 14 Structure of the Dissertation
-
- 2 Basic Concepts and Bibliographic Review
-
- 21 Biological Basic Concepts
-
- 211 Genome
- 212 Transcriptome Assembly and Gene expression
-
- 22 RNA-Seq Analysis
-
- 221 RNA-Seq microarrays and DNA sequencing
- 222 RNA-Seq Pipeline
-
- 23 Standard File Formats used
-
- 231 FASTA
- 232 FASTQ
- 233 SAM and BAM
- 234 GFF and GTF
-
- 24 Relevant Data Repositories
- 25 Tools for RNA-seq and Differential Analysis
- 26 Relational and Non-relational Databases
- 27 Tecnologies
- 28 Related Work
- 29 Chapter Summary
-
- 3 The Gemini framework
-
- 31 Gemini
- 32 Gemini Architecture
-
- 321 Physical Architecture
-
- 33 Data Management
- 34 Web Interface
- 35 Use cases
- 36 Case studies
-
- 361 Full pipeline
- 362 Stage pipeline
-
- 37 Chapter Summary
-
- 4 Case study
-
- 41 Samples characterization
- 42 Researching objectives
- 43 Protocol of analysis
- 44 Genome version GRCh37 versus GRCh38
- 45 Fusion genes
- 46 Results
-
- 461 Case study with reference genome GRCh37
- 462 Splicing analysis
- 463 Case study with reference genome GRCh38
-
- 47 Chapter Summary
-
- 5 Conclusions and Future Work
- References
- A iRAP tools supported
-
- A1 Mappers
- A2 Quantification
- A3 Differential expression [DE]
- A4 Gene set enrichment analysis [GSE]
-
- B iRAP model of configuration file
- C iRAP example configuration file
-
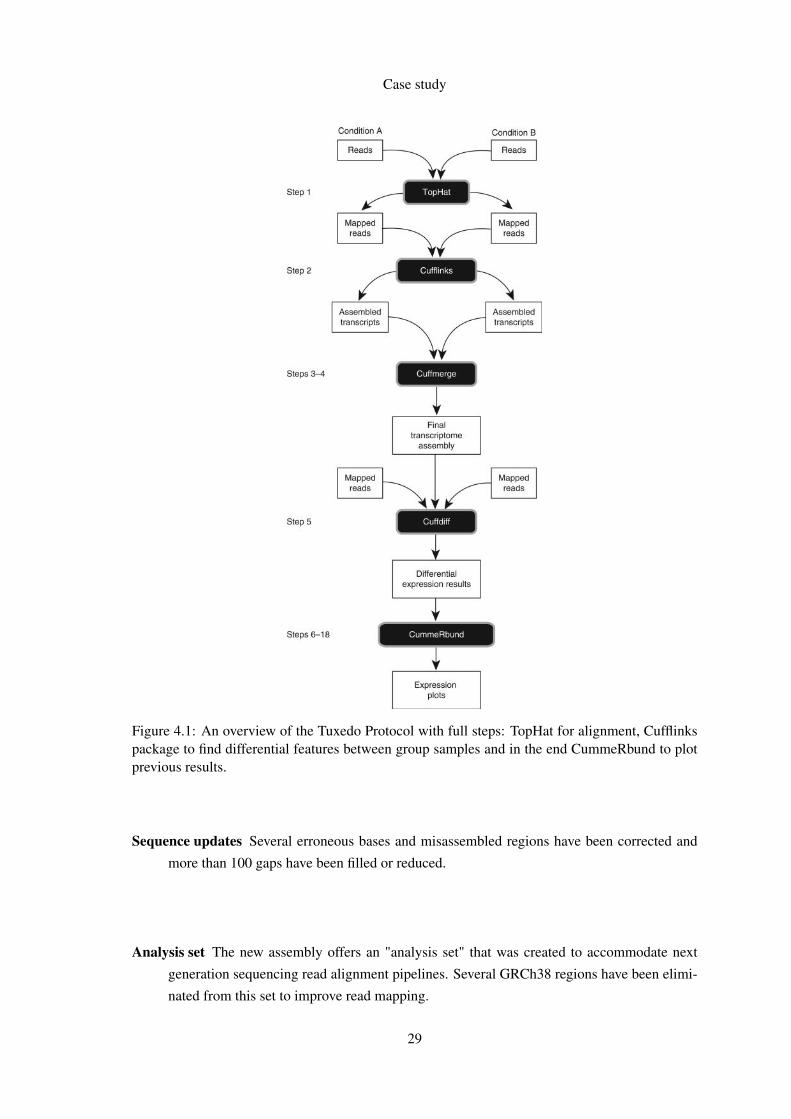
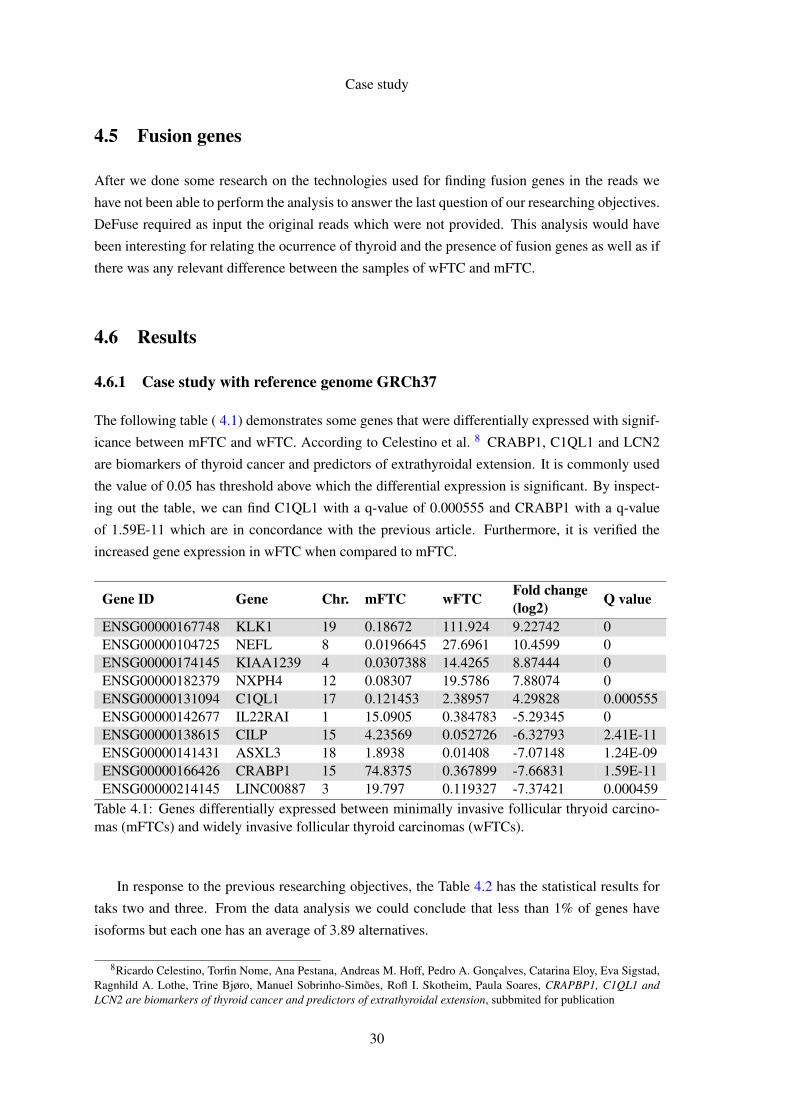
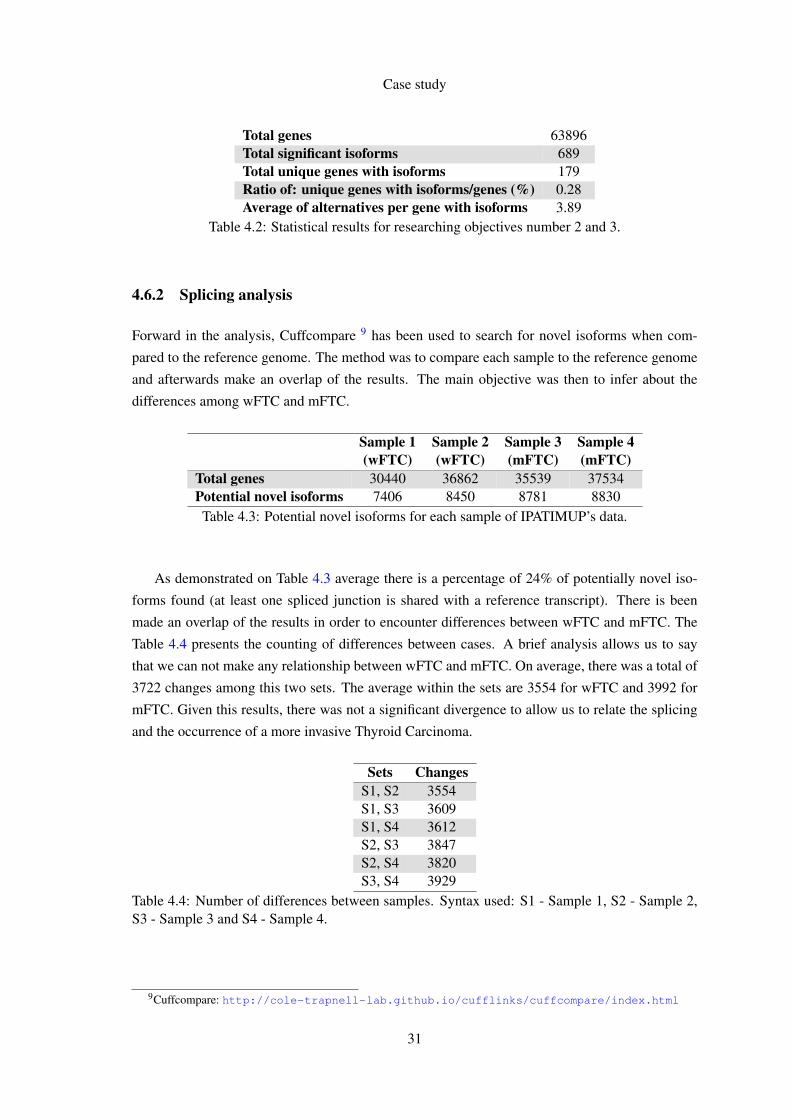
REFERENCES
[GEN] GENIE Dna genes and chromossomes University of Leicesteravailable at httpwww2leacukdepartmentsgeneticsvgecschoolscollegestopicsdna-genes-chromosomes last access Jan-uary 2015
[Gri] Malachi Griffith Bioinformatics for Cancer Genomics (BiCG)available at httpbioinformaticscaworkshops2012bioinformatics-cancer-genomics-bicg last access January 2015
[GTBK11] Angela Goncalves Andrew Tikhonov Alvis Brazma and Misha Kapushesky Apipeline for RNA-seq data processing and quality assessment Bioinformatics (Ox-ford England) 27(6)867ndash9 March 2011
[HBB+02] T Hubbard D Barker E Birney G Cameron Y Chen L Clark T CoxJ Cuff V Curwen T Down R Durbin E Eyras J Gilbert M HammondL Huminiecki A Kasprzyk H Lehvaslaiho P Lijnzaad C Melsopp E Mon-gin R Pettett M Pocock S Potter A Rust E Schmidt S Searle G SlaterJ Smith W Spooner A Stabenau J Stalker E Stupka A Ureta-Vidal I Vastrikand M Clamp The ensembl genome database project Nucleic Acids Research30(1)38ndash41 2002
[HBD+13] R Hitzemann D Bottomly P Darakjian N Walter O Iancu R SearlesB Wilmot and S McWeeney Genes behavior and next-generation RNA se-quencing Genes Brain Behav 12(1)1ndash12 Feb 2013
[Ins] National Human Genome Research Institute Transcriptome available at httpwwwgenomegov13014330 last access January 2015
[Joh03] Jason M Johnson Genome-wide survey of human alternative pre-mrna splicingwith exon junction microarrays Science 3022141ndash2144 December 2003
[kn10] Gene set enrichment a problem of pathways Briefings in functional genomics9(5-6)385ndash90 December 2010
[kn11] Overview of available methods for diverse RNA-Seq data analyses Science ChinaLife sciences 54(12)1121ndash8 December 2011
[Lan10] Ben Langmead Aligning short sequencing reads with Bowtie Current proto-cols in bioinformatics editoral board Andreas D Baxevanis [et al] Chapter11Unit 117 December 2010
[LM10] Adam Lith and Jakob Mattsson Investigating storage solutions for large data - acomparison of well performing and scalable data storage solutions for real timeextraction and batch insertion of data Masterrsquos thesis 2010
[LTPS09] Ben Langmead Cole Trapnell Mihai Pop and Steven L Salzberg Ultrafastand memory-efficient alignment of short DNA sequences to the human genomeGenome biology 10(3)R25 January 2009
[ORY10] Alicia Oshlack Mark D Robinson and Matthew D Young From RNA-seq readsto differential expression results Genome biology 11(12)220 January 2010
[SG15] Marc W Schmid and Ueli Grossniklaus Rcount simple and flexible RNA-Seqread counting Bioinformatics 31(3)436ndash437 February 2015
36
REFERENCES
[SK11] Christof Strauch and Walter Kriha NoSQL databases Lecture Notes StuttgartMedia University February 2011
[SOdMVN12] Mikhail Shugay Intildeigo Ortiz de Mendiacutebil Joseacute L Vizmanos and Francisco JNovo Genomic hallmarks of genes involved in chromosomal translocations inhematological cancer PLoS Comput Biol 8(12)e1002797 12 2012
[The04] The ENCODE Project Consortium The ENCODE (ENCyclopedia Of DNA Ele-ments) Project Science (New York NY) 306(5696)636ndash40 October 2004
[TPS09] Cole Trapnell Lior Pachter and Steven L Salzberg TopHat discovering splicejunctions with RNA-Seq Bioinformatics (Oxford England) 25(9)1105ndash11 May2009
[TRG+12a] Cole Trapnell Adam Roberts Loyal Goff Geo Pertea Daehwan Kim David RKelley Harold Pimentel Steven L Salzberg John L Rinn and Lior Pachter Dif-ferential gene and transcript expression analysis of RNA-seq experiments withTopHat and Cufflinks Nature protocols 7(3)562ndash78 March 2012
[TRG+12b] Cole Trapnell Adam Roberts Loyal Goff Geo Pertea Daehwan Kim David RKelley Harold Pimentel Steven L Salzberg John L Rinn and Lior Pachter Dif-ferential gene and transcript expression analysis of RNA-seq experiments withTopHat and Cufflinks Nature protocols 7(3)562ndash78 March 2012
[WMM+11] Ying Wang Gaurang Mehta Rajiv Mayani Jingxi Lu Tade Souaiaia YanghoChen Andrew Clark Hee Jae Yoon Lin Wan Oleg V Evgrafov James AKnowles Ewa Deelman and Ting Chen RseqFlow workflows for RNA-Seq dataanalysis Bioinformatics (Oxford England) 27(18)2598ndash600 September 2011
[Wol13] Jochen B W Wolf Principles of transcriptome analysis and gene expressionquantification an rna-seq tutorial Molecular Ecology Resources 13(4)559ndash5722013
[ZW09] Mark Gerstein |amp Michael Snyder Zhong Wang Rna-seq a revolutionary tool fortranscriptomics Nature Reviews Genetics 1057ndash63 January 2009
37
REFERENCES
38
Appendix A
iRAP tools supported
A1 Mappers
Mapper Option name (mapper)TopHat 1 tophat1TopHat 2 tophat2SMALT smaltGSNAP gsnapSOAPsplice soapspliceBWA bwa1BWA bwa2Bowtie 1 bowtie1Bowtie2 bowtie2GEM gemSTAR starOSA osaMapSplice mapsplice
A2 Quantification
Quantifier Option name (quant_method)FluxCapacitor flux_capHT-Seq (union mode) htseq1HT-Seq (intersection non-empty mode) htseq2Cufflinks 1 (try to find novel transcripts-g) cufflinks1Cufflinks 2 (try to find novel transcripts-g) cufflinks2Cufflinks 1 (do not assemble novel transcripts-G) cufflinks1_ndCufflinks 2 (do not assemble novel transcripts-G) cufflinks2_ndNURD nurd
39
iRAP tools supported
A3 Differential expression [DE]
Method Option name (de_method)DESeq deseqDESeq2 deseq2EdgeR edgerCuffdiff 1 cuffdiff1Cuffdiff 2 cuffdiff2
A4 Gene set enrichment analysis [GSE]
Tool Option name (gse_tool)Piano piano
40
Appendix B
iRAP model of configuration file
1 This is a comment (lines that start with a are ignored by iRAP)
2 =============================================================================
3 name that you want to give to the experiment (no spaces)
4 All files produced by irap will be placed in a folder with the given name
5 name=myexp
6
7
8 =============================================================================
9 name of the species
10 species=homo_sapiens
11
12 =============================================================================
13 Fasta file with the reference genome
14 reference=Homo_sapiensGRCh3766dnafa
15
16 =============================================================================
17 GTF file with the annotations
18 gtf_file=Homo_sapiensGRCh3766gtf
19
20 =============================================================================
21 IRAP options (may be providedoverriden in the command line)
22
23
24 Mapper
25 mapper=
26
27
28 Quantification method
29 quant_method=
30
31
32 Dif expression method
33 Requires contrasts to be defined (see below)
41
iRAP model of configuration file
34 de_method=
35
36
37 Gene set enrichment (GSE) analysis
38 Requires de_method to be defined
39 Tool to use (none|piano)
40 gse_tool=piano
41
42 gse_method (mean|median|sum|fisher|fisher-exact|stouffer|tailStrength|wilcoxon|
reporter|page) see Piano vignete documentation for more details
43 gse_method=fisher
44 gse_pvalue=005
45 Minimum number of genes in a gene set
46 gse_minsize=3
47
48
49
50 TSV file with gene annotation
51 Format IDNamelocussourcelnameGOGOtermKEGG
52 Description
53 ID=gene_id (this is mandatory and should match the one given in the gtf file)
54 Name=gene name
55 locus=chrstart--end
56 source=biotype
57 lname=gene name
58 GO=go ids (multiple values can be separated by)
59 GO=GO terms (multiple values can be separated by)
60 KEGG=Kegg ids (multiple values can be separated by)
61 If auto is defined then iRAP will try to generate the file
62 - this may take a considerable amount of time and will only work
63 for a reduced number of species
64 off - default value
65 annot_tsv=
66
67
68 QC
69 Check data (reads) quality (on|off|none)
70 on - reads are filtered out based on their quality
71 off - the quality of the reads is assessed but no filtering is done
72 none- no quality control is performed
73 qual_filtering=on
74
75 Trim all reads to the minimum read size after quality trimming - Yes (y)| No (n)
76 only applicable if qual_filtering is on
77 trim_reads=y
78
79 Minimum base quality accepted (def 10)
80 min_read_quality=10
81
42
iRAP model of configuration file
82 Contamination check (cont_index parameter) Reads that likely
83 originate from organisms other than the one under study can be
84 discarded during pre-processment of the reads This is done by
85 aligning the reads to the genomes of organisms that might be a
86 source of contamination and discard those that map with a high
87 degree of fidelity By default iRAP will check if the data is
88 contaminated by e-coli An example to create a contamination
89 database is provided in the examplesex_add2contaminationDBsh
90 script The value of the parameter should be the file name prefix of
91 the bowtie index files
92
93 Disable contamination check
94 cont_index=no
95 Default value
96 cont_index=$(data_dir)contaminatione_coli
97
98
99 Misc options
100
101 Number of threads that may be used by IRAP
102 max_threads=1
103
104 Exon level quantification Yes (y)| No (n)
105 exon_quant=y
106
107 Transcript level quantification Yes (y)| No (n)
108 transcript_quant=y
109 =============================================================================
110 full or relative path to the directory where all the data can be found
111 data_dir=data
112
113 the directory should be organized as follows (see directory data in IRAP toplevel
directory)
114
115 $data_dir
116 $data_dir
117 contamination
118 e_coli1ebwt
119 e_coli2ebwt
120 e_coli3ebwt
121 e_coli4ebwt
122 e_coliREADME
123 e_colirev1ebwt
124 e_colirev2eb
125 raw_data
126 $species
127 fastq
128 fastq
129
43
iRAP model of configuration file
130 reference
131 $species
132 $gtf_file
133 $reference
134
135 Notes
136 1) $ denotes the value defined for the variable
137 2) Since version 050 the raw data (fastqbam) files may be
138 distributed across several sub-folders
139
140
141 =============================================================================
142 Only necessary if you intend to perform Differential Expression analysis
143
144 contrasts=contrast_def [contrast_def ]
145 contrasts=purpleVsPink purpleVsGrey
146
147 definition of each constrast
148 contrast= group group [ group ]
149 purlpleVsPink=Purple Pink
150 purlpleVsGrey=Purple Grey
151
152 groups
153 GroupName= Library_name [Library_name ]
154 Purlple=myLib1 myLib2
155 Pink=myLib3
156 Grey=myLib4
157
158 optional parameter used in the report (HTML) generation
159 groups=Purple Pink Grey
160
161 technical replicates
162 technicalreplicates=myLib1myLib2myLib3mylib4
163
164 Note names of groups contrasts and libraries should start with a letter and
contain only alphanumeric characters and the character _
165
166 =============================================================================
167 Data
168
169
170 Information for each library
171 LibName=Fastq file
172 Note
173 1 LibName should start with a letter and contain only alphanumeric characters
and the character _ LibName should not contain in _1 or _2
174 2 LibName should be different from the name of the fastq file for instance
175 f1=f1fastq
176 will produce an error
44
iRAP model of configuration file
177
178 Single-end
179 myLib1=f1fastq
180 read size
181 myLib1_rs=75
182 quality encoding (33 or 64)
183 myLib1_qual=33
184
185 strand specific protocol
186 mylib1_strand=first
187 mylib1_strand=second
188 Default value is both (strands)
189 mylib1_strand=both
190
191 Have the file in a different sub-folder
192 mylib1_dir=somesubfolder
193
194 See SAMBAM specification for more details about the following two parameters
195 read group id (to be included in the BAM file) - this is not supported by all
mappers
196 myLib1_rgid=
197 sambam header lines to include in the BAM file
198 myLib1_shl=COtThis is a commentnCOtand another line
199
200 LibName=Fastq file
201 myLib2=f2fastq
202 read size
203 myLib2_rs=75
204 quality encoding (33 or 64)
205 myLib2_qual=33
206
207
208 Paired-end
209 LibName=Fastq files
210 myLib3=f3_1fastq f3_2fastq
211 read size
212 myLib3_rs=50
213 quality encoding (33 or 64)
214 myLib3_qual=33
215 insert size
216 myLib3_ins=350
217 standard deviation
218 myLib3_sd=60
219
220 LibName=Fastq files
221 myLib4=f4_1fastq f4_2fastq
222 read size
223 myLib4_rs=50
224 quality encoding (33 or 64)
45
iRAP model of configuration file
225 myLib4_qual=33
226 insert size
227 myLib4_ins=350
228 standard deviation
229 myLib4_sd=60
230
231
232
233
234 list the names of your single-end (se) and paired (pe) libraries
235 se=myLib1 myLib2
236 pe=myLib3 myLib4
237 No SE data
238 se=
239 No PE data
240 pe=
241
242
243
244 Passingoverriding parameters
245
246 It is possible to pass parameters to the mappers and quantification
247 methods but that should be done carefully since it may break the
248 pipeline (if the location of the input andor output files is
249 changed)
250
251 Overridingchanging the mappersrsquo parameters
252 _map_options=options
253 Example
254 tophat2_map_options=--min-intron-length 5 --no-coverage-search
255
256 Overridingchanging the parameters of the quantification methods
257 _params=options
258 Example
259 htseq_params= -q
46
Appendix C
iRAP example configuration file
1 minimal configuration file for DE
2 experiment name
3 name=ecoli_ex
4 species
5 species=ecoli_k12
6 reference genome
7 reference=Escherichia_coli_str_k_12_substr_mg1655GCA_000005845119dnatoplevel
fagz
8 gtf file
9 gtf_file=Escherichia_coli_str_k_12_substr_mg1655GCA_000005845119gtfgz
10 Enable filtering based on quality
11 qual_filtering=on
12 Use a contamination data set to filter out reads
13 cont_index=no
14 Toplevel directory with the data
15 data_dir=
16
17 some contrasts
18 GA=Group A
19 contrasts=GAvsGB GBvsGA
20 GAvsGB=GA GB
21 GBvsGA=GB GA
22 GA=FA FB FC
23 GB=FD FE FF
24
25 se=FA FB FC FD FE FF
26
27 FA=SRR933983fastqgz
28 FA_rs=50
29 FA_qual=33
30
31 FB=SRR933984fastqgz
32 FB_rs=50
47
iRAP example configuration file
33 FB_qual=33
34
35 FC=SRR933985fastqgz
36 FC_rs=50
37 FC_qual=33
38
39 FD=SRR933989fastqgz
40 FD_rs=50
41 FD_qual=33
42
43 FE=SRR933990fastqgz
44 FE_rs=50
45 FE_qual=33
46
47 FF=SRR933990fastqgz
48 FF_rs=50
49 FF_qual=33
50 EOF
48
- Front Page
- Table of Contents
- List of Figures
- List of Tables
- 1 Introduction
-
- 11 Context
- 12 Motivation and Goals
- 13 Proposed Solution
- 14 Structure of the Dissertation
-
- 2 Basic Concepts and Bibliographic Review
-
- 21 Biological Basic Concepts
-
- 211 Genome
- 212 Transcriptome Assembly and Gene expression
-
- 22 RNA-Seq Analysis
-
- 221 RNA-Seq microarrays and DNA sequencing
- 222 RNA-Seq Pipeline
-
- 23 Standard File Formats used
-
- 231 FASTA
- 232 FASTQ
- 233 SAM and BAM
- 234 GFF and GTF
-
- 24 Relevant Data Repositories
- 25 Tools for RNA-seq and Differential Analysis
- 26 Relational and Non-relational Databases
- 27 Tecnologies
- 28 Related Work
- 29 Chapter Summary
-
- 3 The Gemini framework
-
- 31 Gemini
- 32 Gemini Architecture
-
- 321 Physical Architecture
-
- 33 Data Management
- 34 Web Interface
- 35 Use cases
- 36 Case studies
-
- 361 Full pipeline
- 362 Stage pipeline
-
- 37 Chapter Summary
-
- 4 Case study
-
- 41 Samples characterization
- 42 Researching objectives
- 43 Protocol of analysis
- 44 Genome version GRCh37 versus GRCh38
- 45 Fusion genes
- 46 Results
-
- 461 Case study with reference genome GRCh37
- 462 Splicing analysis
- 463 Case study with reference genome GRCh38
-
- 47 Chapter Summary
-
- 5 Conclusions and Future Work
- References
- A iRAP tools supported
-
- A1 Mappers
- A2 Quantification
- A3 Differential expression [DE]
- A4 Gene set enrichment analysis [GSE]
-
- B iRAP model of configuration file
- C iRAP example configuration file
-

REFERENCES
[SK11] Christof Strauch and Walter Kriha NoSQL databases Lecture Notes StuttgartMedia University February 2011
[SOdMVN12] Mikhail Shugay Intildeigo Ortiz de Mendiacutebil Joseacute L Vizmanos and Francisco JNovo Genomic hallmarks of genes involved in chromosomal translocations inhematological cancer PLoS Comput Biol 8(12)e1002797 12 2012
[The04] The ENCODE Project Consortium The ENCODE (ENCyclopedia Of DNA Ele-ments) Project Science (New York NY) 306(5696)636ndash40 October 2004
[TPS09] Cole Trapnell Lior Pachter and Steven L Salzberg TopHat discovering splicejunctions with RNA-Seq Bioinformatics (Oxford England) 25(9)1105ndash11 May2009
[TRG+12a] Cole Trapnell Adam Roberts Loyal Goff Geo Pertea Daehwan Kim David RKelley Harold Pimentel Steven L Salzberg John L Rinn and Lior Pachter Dif-ferential gene and transcript expression analysis of RNA-seq experiments withTopHat and Cufflinks Nature protocols 7(3)562ndash78 March 2012
[TRG+12b] Cole Trapnell Adam Roberts Loyal Goff Geo Pertea Daehwan Kim David RKelley Harold Pimentel Steven L Salzberg John L Rinn and Lior Pachter Dif-ferential gene and transcript expression analysis of RNA-seq experiments withTopHat and Cufflinks Nature protocols 7(3)562ndash78 March 2012
[WMM+11] Ying Wang Gaurang Mehta Rajiv Mayani Jingxi Lu Tade Souaiaia YanghoChen Andrew Clark Hee Jae Yoon Lin Wan Oleg V Evgrafov James AKnowles Ewa Deelman and Ting Chen RseqFlow workflows for RNA-Seq dataanalysis Bioinformatics (Oxford England) 27(18)2598ndash600 September 2011
[Wol13] Jochen B W Wolf Principles of transcriptome analysis and gene expressionquantification an rna-seq tutorial Molecular Ecology Resources 13(4)559ndash5722013
[ZW09] Mark Gerstein |amp Michael Snyder Zhong Wang Rna-seq a revolutionary tool fortranscriptomics Nature Reviews Genetics 1057ndash63 January 2009
37
REFERENCES
38
Appendix A
iRAP tools supported
A1 Mappers
Mapper Option name (mapper)TopHat 1 tophat1TopHat 2 tophat2SMALT smaltGSNAP gsnapSOAPsplice soapspliceBWA bwa1BWA bwa2Bowtie 1 bowtie1Bowtie2 bowtie2GEM gemSTAR starOSA osaMapSplice mapsplice
A2 Quantification
Quantifier Option name (quant_method)FluxCapacitor flux_capHT-Seq (union mode) htseq1HT-Seq (intersection non-empty mode) htseq2Cufflinks 1 (try to find novel transcripts-g) cufflinks1Cufflinks 2 (try to find novel transcripts-g) cufflinks2Cufflinks 1 (do not assemble novel transcripts-G) cufflinks1_ndCufflinks 2 (do not assemble novel transcripts-G) cufflinks2_ndNURD nurd
39
iRAP tools supported
A3 Differential expression [DE]
Method Option name (de_method)DESeq deseqDESeq2 deseq2EdgeR edgerCuffdiff 1 cuffdiff1Cuffdiff 2 cuffdiff2
A4 Gene set enrichment analysis [GSE]
Tool Option name (gse_tool)Piano piano
40
Appendix B
iRAP model of configuration file
1 This is a comment (lines that start with a are ignored by iRAP)
2 =============================================================================
3 name that you want to give to the experiment (no spaces)
4 All files produced by irap will be placed in a folder with the given name
5 name=myexp
6
7
8 =============================================================================
9 name of the species
10 species=homo_sapiens
11
12 =============================================================================
13 Fasta file with the reference genome
14 reference=Homo_sapiensGRCh3766dnafa
15
16 =============================================================================
17 GTF file with the annotations
18 gtf_file=Homo_sapiensGRCh3766gtf
19
20 =============================================================================
21 IRAP options (may be providedoverriden in the command line)
22
23
24 Mapper
25 mapper=
26
27
28 Quantification method
29 quant_method=
30
31
32 Dif expression method
33 Requires contrasts to be defined (see below)
41
iRAP model of configuration file
34 de_method=
35
36
37 Gene set enrichment (GSE) analysis
38 Requires de_method to be defined
39 Tool to use (none|piano)
40 gse_tool=piano
41
42 gse_method (mean|median|sum|fisher|fisher-exact|stouffer|tailStrength|wilcoxon|
reporter|page) see Piano vignete documentation for more details
43 gse_method=fisher
44 gse_pvalue=005
45 Minimum number of genes in a gene set
46 gse_minsize=3
47
48
49
50 TSV file with gene annotation
51 Format IDNamelocussourcelnameGOGOtermKEGG
52 Description
53 ID=gene_id (this is mandatory and should match the one given in the gtf file)
54 Name=gene name
55 locus=chrstart--end
56 source=biotype
57 lname=gene name
58 GO=go ids (multiple values can be separated by)
59 GO=GO terms (multiple values can be separated by)
60 KEGG=Kegg ids (multiple values can be separated by)
61 If auto is defined then iRAP will try to generate the file
62 - this may take a considerable amount of time and will only work
63 for a reduced number of species
64 off - default value
65 annot_tsv=
66
67
68 QC
69 Check data (reads) quality (on|off|none)
70 on - reads are filtered out based on their quality
71 off - the quality of the reads is assessed but no filtering is done
72 none- no quality control is performed
73 qual_filtering=on
74
75 Trim all reads to the minimum read size after quality trimming - Yes (y)| No (n)
76 only applicable if qual_filtering is on
77 trim_reads=y
78
79 Minimum base quality accepted (def 10)
80 min_read_quality=10
81
42
iRAP model of configuration file
82 Contamination check (cont_index parameter) Reads that likely
83 originate from organisms other than the one under study can be
84 discarded during pre-processment of the reads This is done by
85 aligning the reads to the genomes of organisms that might be a
86 source of contamination and discard those that map with a high
87 degree of fidelity By default iRAP will check if the data is
88 contaminated by e-coli An example to create a contamination
89 database is provided in the examplesex_add2contaminationDBsh
90 script The value of the parameter should be the file name prefix of
91 the bowtie index files
92
93 Disable contamination check
94 cont_index=no
95 Default value
96 cont_index=$(data_dir)contaminatione_coli
97
98
99 Misc options
100
101 Number of threads that may be used by IRAP
102 max_threads=1
103
104 Exon level quantification Yes (y)| No (n)
105 exon_quant=y
106
107 Transcript level quantification Yes (y)| No (n)
108 transcript_quant=y
109 =============================================================================
110 full or relative path to the directory where all the data can be found
111 data_dir=data
112
113 the directory should be organized as follows (see directory data in IRAP toplevel
directory)
114
115 $data_dir
116 $data_dir
117 contamination
118 e_coli1ebwt
119 e_coli2ebwt
120 e_coli3ebwt
121 e_coli4ebwt
122 e_coliREADME
123 e_colirev1ebwt
124 e_colirev2eb
125 raw_data
126 $species
127 fastq
128 fastq
129
43
iRAP model of configuration file
130 reference
131 $species
132 $gtf_file
133 $reference
134
135 Notes
136 1) $ denotes the value defined for the variable
137 2) Since version 050 the raw data (fastqbam) files may be
138 distributed across several sub-folders
139
140
141 =============================================================================
142 Only necessary if you intend to perform Differential Expression analysis
143
144 contrasts=contrast_def [contrast_def ]
145 contrasts=purpleVsPink purpleVsGrey
146
147 definition of each constrast
148 contrast= group group [ group ]
149 purlpleVsPink=Purple Pink
150 purlpleVsGrey=Purple Grey
151
152 groups
153 GroupName= Library_name [Library_name ]
154 Purlple=myLib1 myLib2
155 Pink=myLib3
156 Grey=myLib4
157
158 optional parameter used in the report (HTML) generation
159 groups=Purple Pink Grey
160
161 technical replicates
162 technicalreplicates=myLib1myLib2myLib3mylib4
163
164 Note names of groups contrasts and libraries should start with a letter and
contain only alphanumeric characters and the character _
165
166 =============================================================================
167 Data
168
169
170 Information for each library
171 LibName=Fastq file
172 Note
173 1 LibName should start with a letter and contain only alphanumeric characters
and the character _ LibName should not contain in _1 or _2
174 2 LibName should be different from the name of the fastq file for instance
175 f1=f1fastq
176 will produce an error
44
iRAP model of configuration file
177
178 Single-end
179 myLib1=f1fastq
180 read size
181 myLib1_rs=75
182 quality encoding (33 or 64)
183 myLib1_qual=33
184
185 strand specific protocol
186 mylib1_strand=first
187 mylib1_strand=second
188 Default value is both (strands)
189 mylib1_strand=both
190
191 Have the file in a different sub-folder
192 mylib1_dir=somesubfolder
193
194 See SAMBAM specification for more details about the following two parameters
195 read group id (to be included in the BAM file) - this is not supported by all
mappers
196 myLib1_rgid=
197 sambam header lines to include in the BAM file
198 myLib1_shl=COtThis is a commentnCOtand another line
199
200 LibName=Fastq file
201 myLib2=f2fastq
202 read size
203 myLib2_rs=75
204 quality encoding (33 or 64)
205 myLib2_qual=33
206
207
208 Paired-end
209 LibName=Fastq files
210 myLib3=f3_1fastq f3_2fastq
211 read size
212 myLib3_rs=50
213 quality encoding (33 or 64)
214 myLib3_qual=33
215 insert size
216 myLib3_ins=350
217 standard deviation
218 myLib3_sd=60
219
220 LibName=Fastq files
221 myLib4=f4_1fastq f4_2fastq
222 read size
223 myLib4_rs=50
224 quality encoding (33 or 64)
45
iRAP model of configuration file
225 myLib4_qual=33
226 insert size
227 myLib4_ins=350
228 standard deviation
229 myLib4_sd=60
230
231
232
233
234 list the names of your single-end (se) and paired (pe) libraries
235 se=myLib1 myLib2
236 pe=myLib3 myLib4
237 No SE data
238 se=
239 No PE data
240 pe=
241
242
243
244 Passingoverriding parameters
245
246 It is possible to pass parameters to the mappers and quantification
247 methods but that should be done carefully since it may break the
248 pipeline (if the location of the input andor output files is
249 changed)
250
251 Overridingchanging the mappersrsquo parameters
252 _map_options=options
253 Example
254 tophat2_map_options=--min-intron-length 5 --no-coverage-search
255
256 Overridingchanging the parameters of the quantification methods
257 _params=options
258 Example
259 htseq_params= -q
46
Appendix C
iRAP example configuration file
1 minimal configuration file for DE
2 experiment name
3 name=ecoli_ex
4 species
5 species=ecoli_k12
6 reference genome
7 reference=Escherichia_coli_str_k_12_substr_mg1655GCA_000005845119dnatoplevel
fagz
8 gtf file
9 gtf_file=Escherichia_coli_str_k_12_substr_mg1655GCA_000005845119gtfgz
10 Enable filtering based on quality
11 qual_filtering=on
12 Use a contamination data set to filter out reads
13 cont_index=no
14 Toplevel directory with the data
15 data_dir=
16
17 some contrasts
18 GA=Group A
19 contrasts=GAvsGB GBvsGA
20 GAvsGB=GA GB
21 GBvsGA=GB GA
22 GA=FA FB FC
23 GB=FD FE FF
24
25 se=FA FB FC FD FE FF
26
27 FA=SRR933983fastqgz
28 FA_rs=50
29 FA_qual=33
30
31 FB=SRR933984fastqgz
32 FB_rs=50
47
iRAP example configuration file
33 FB_qual=33
34
35 FC=SRR933985fastqgz
36 FC_rs=50
37 FC_qual=33
38
39 FD=SRR933989fastqgz
40 FD_rs=50
41 FD_qual=33
42
43 FE=SRR933990fastqgz
44 FE_rs=50
45 FE_qual=33
46
47 FF=SRR933990fastqgz
48 FF_rs=50
49 FF_qual=33
50 EOF
48
- Front Page
- Table of Contents
- List of Figures
- List of Tables
- 1 Introduction
-
- 11 Context
- 12 Motivation and Goals
- 13 Proposed Solution
- 14 Structure of the Dissertation
-
- 2 Basic Concepts and Bibliographic Review
-
- 21 Biological Basic Concepts
-
- 211 Genome
- 212 Transcriptome Assembly and Gene expression
-
- 22 RNA-Seq Analysis
-
- 221 RNA-Seq microarrays and DNA sequencing
- 222 RNA-Seq Pipeline
-
- 23 Standard File Formats used
-
- 231 FASTA
- 232 FASTQ
- 233 SAM and BAM
- 234 GFF and GTF
-
- 24 Relevant Data Repositories
- 25 Tools for RNA-seq and Differential Analysis
- 26 Relational and Non-relational Databases
- 27 Tecnologies
- 28 Related Work
- 29 Chapter Summary
-
- 3 The Gemini framework
-
- 31 Gemini
- 32 Gemini Architecture
-
- 321 Physical Architecture
-
- 33 Data Management
- 34 Web Interface
- 35 Use cases
- 36 Case studies
-
- 361 Full pipeline
- 362 Stage pipeline
-
- 37 Chapter Summary
-
- 4 Case study
-
- 41 Samples characterization
- 42 Researching objectives
- 43 Protocol of analysis
- 44 Genome version GRCh37 versus GRCh38
- 45 Fusion genes
- 46 Results
-
- 461 Case study with reference genome GRCh37
- 462 Splicing analysis
- 463 Case study with reference genome GRCh38
-
- 47 Chapter Summary
-
- 5 Conclusions and Future Work
- References
- A iRAP tools supported
-
- A1 Mappers
- A2 Quantification
- A3 Differential expression [DE]
- A4 Gene set enrichment analysis [GSE]
-
- B iRAP model of configuration file
- C iRAP example configuration file
-
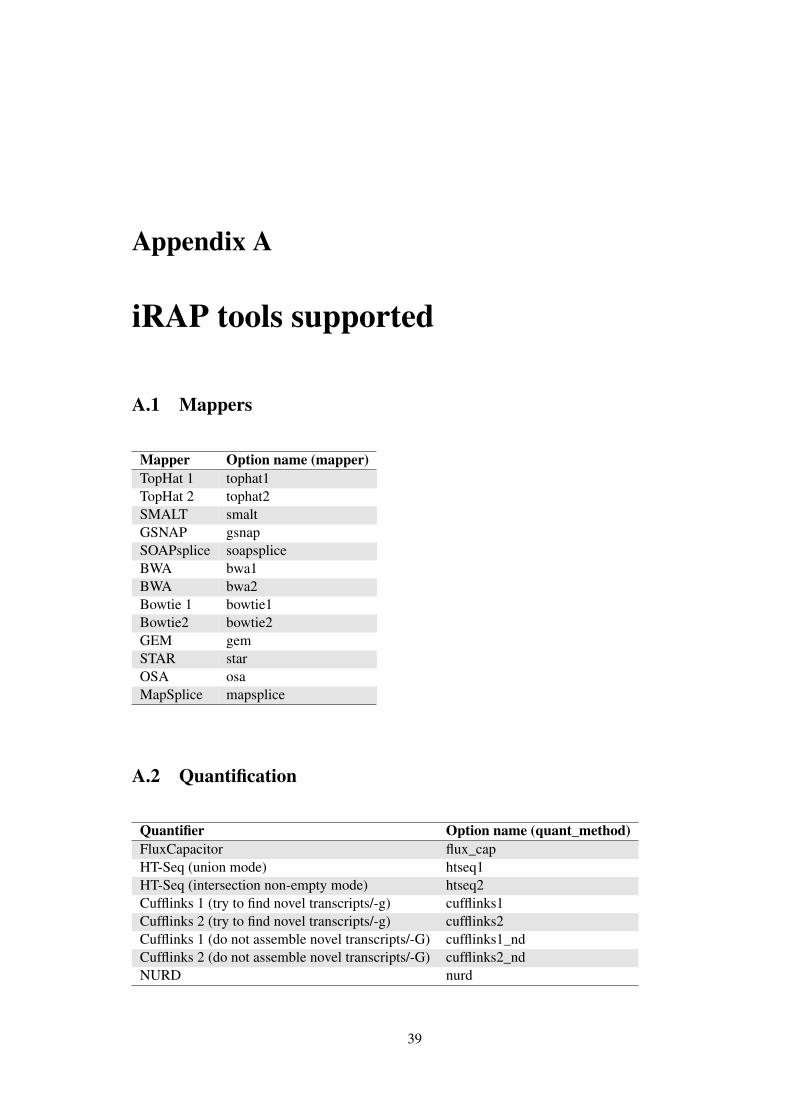
iRAP model of configuration file
34 de_method=
35
36
37 Gene set enrichment (GSE) analysis
38 Requires de_method to be defined
39 Tool to use (none|piano)
40 gse_tool=piano
41
42 gse_method (mean|median|sum|fisher|fisher-exact|stouffer|tailStrength|wilcoxon|
reporter|page) see Piano vignete documentation for more details
43 gse_method=fisher
44 gse_pvalue=005
45 Minimum number of genes in a gene set
46 gse_minsize=3
47
48
49
50 TSV file with gene annotation
51 Format IDNamelocussourcelnameGOGOtermKEGG
52 Description
53 ID=gene_id (this is mandatory and should match the one given in the gtf file)
54 Name=gene name
55 locus=chrstart--end
56 source=biotype
57 lname=gene name
58 GO=go ids (multiple values can be separated by)
59 GO=GO terms (multiple values can be separated by)
60 KEGG=Kegg ids (multiple values can be separated by)
61 If auto is defined then iRAP will try to generate the file
62 - this may take a considerable amount of time and will only work
63 for a reduced number of species
64 off - default value
65 annot_tsv=
66
67
68 QC
69 Check data (reads) quality (on|off|none)
70 on - reads are filtered out based on their quality
71 off - the quality of the reads is assessed but no filtering is done
72 none- no quality control is performed
73 qual_filtering=on
74
75 Trim all reads to the minimum read size after quality trimming - Yes (y)| No (n)
76 only applicable if qual_filtering is on
77 trim_reads=y
78
79 Minimum base quality accepted (def 10)
80 min_read_quality=10
81
42
iRAP model of configuration file
82 Contamination check (cont_index parameter) Reads that likely
83 originate from organisms other than the one under study can be
84 discarded during pre-processment of the reads This is done by
85 aligning the reads to the genomes of organisms that might be a
86 source of contamination and discard those that map with a high
87 degree of fidelity By default iRAP will check if the data is
88 contaminated by e-coli An example to create a contamination
89 database is provided in the examplesex_add2contaminationDBsh
90 script The value of the parameter should be the file name prefix of
91 the bowtie index files
92
93 Disable contamination check
94 cont_index=no
95 Default value
96 cont_index=$(data_dir)contaminatione_coli
97
98
99 Misc options
100
101 Number of threads that may be used by IRAP
102 max_threads=1
103
104 Exon level quantification Yes (y)| No (n)
105 exon_quant=y
106
107 Transcript level quantification Yes (y)| No (n)
108 transcript_quant=y
109 =============================================================================
110 full or relative path to the directory where all the data can be found
111 data_dir=data
112
113 the directory should be organized as follows (see directory data in IRAP toplevel
directory)
114
115 $data_dir
116 $data_dir
117 contamination
118 e_coli1ebwt
119 e_coli2ebwt
120 e_coli3ebwt
121 e_coli4ebwt
122 e_coliREADME
123 e_colirev1ebwt
124 e_colirev2eb
125 raw_data
126 $species
127 fastq
128 fastq
129
43
iRAP model of configuration file
130 reference
131 $species
132 $gtf_file
133 $reference
134
135 Notes
136 1) $ denotes the value defined for the variable
137 2) Since version 050 the raw data (fastqbam) files may be
138 distributed across several sub-folders
139
140
141 =============================================================================
142 Only necessary if you intend to perform Differential Expression analysis
143
144 contrasts=contrast_def [contrast_def ]
145 contrasts=purpleVsPink purpleVsGrey
146
147 definition of each constrast
148 contrast= group group [ group ]
149 purlpleVsPink=Purple Pink
150 purlpleVsGrey=Purple Grey
151
152 groups
153 GroupName= Library_name [Library_name ]
154 Purlple=myLib1 myLib2
155 Pink=myLib3
156 Grey=myLib4
157
158 optional parameter used in the report (HTML) generation
159 groups=Purple Pink Grey
160
161 technical replicates
162 technicalreplicates=myLib1myLib2myLib3mylib4
163
164 Note names of groups contrasts and libraries should start with a letter and
contain only alphanumeric characters and the character _
165
166 =============================================================================
167 Data
168
169
170 Information for each library
171 LibName=Fastq file
172 Note
173 1 LibName should start with a letter and contain only alphanumeric characters
and the character _ LibName should not contain in _1 or _2
174 2 LibName should be different from the name of the fastq file for instance
175 f1=f1fastq
176 will produce an error
44
iRAP model of configuration file
177
178 Single-end
179 myLib1=f1fastq
180 read size
181 myLib1_rs=75
182 quality encoding (33 or 64)
183 myLib1_qual=33
184
185 strand specific protocol
186 mylib1_strand=first
187 mylib1_strand=second
188 Default value is both (strands)
189 mylib1_strand=both
190
191 Have the file in a different sub-folder
192 mylib1_dir=somesubfolder
193
194 See SAMBAM specification for more details about the following two parameters
195 read group id (to be included in the BAM file) - this is not supported by all
mappers
196 myLib1_rgid=
197 sambam header lines to include in the BAM file
198 myLib1_shl=COtThis is a commentnCOtand another line
199
200 LibName=Fastq file
201 myLib2=f2fastq
202 read size
203 myLib2_rs=75
204 quality encoding (33 or 64)
205 myLib2_qual=33
206
207
208 Paired-end
209 LibName=Fastq files
210 myLib3=f3_1fastq f3_2fastq
211 read size
212 myLib3_rs=50
213 quality encoding (33 or 64)
214 myLib3_qual=33
215 insert size
216 myLib3_ins=350
217 standard deviation
218 myLib3_sd=60
219
220 LibName=Fastq files
221 myLib4=f4_1fastq f4_2fastq
222 read size
223 myLib4_rs=50
224 quality encoding (33 or 64)
45
iRAP model of configuration file
225 myLib4_qual=33
226 insert size
227 myLib4_ins=350
228 standard deviation
229 myLib4_sd=60
230
231
232
233
234 list the names of your single-end (se) and paired (pe) libraries
235 se=myLib1 myLib2
236 pe=myLib3 myLib4
237 No SE data
238 se=
239 No PE data
240 pe=
241
242
243
244 Passingoverriding parameters
245
246 It is possible to pass parameters to the mappers and quantification
247 methods but that should be done carefully since it may break the
248 pipeline (if the location of the input andor output files is
249 changed)
250
251 Overridingchanging the mappersrsquo parameters
252 _map_options=options
253 Example
254 tophat2_map_options=--min-intron-length 5 --no-coverage-search
255
256 Overridingchanging the parameters of the quantification methods
257 _params=options
258 Example
259 htseq_params= -q
46
Appendix C
iRAP example configuration file
1 minimal configuration file for DE
2 experiment name
3 name=ecoli_ex
4 species
5 species=ecoli_k12
6 reference genome
7 reference=Escherichia_coli_str_k_12_substr_mg1655GCA_000005845119dnatoplevel
fagz
8 gtf file
9 gtf_file=Escherichia_coli_str_k_12_substr_mg1655GCA_000005845119gtfgz
10 Enable filtering based on quality
11 qual_filtering=on
12 Use a contamination data set to filter out reads
13 cont_index=no
14 Toplevel directory with the data
15 data_dir=
16
17 some contrasts
18 GA=Group A
19 contrasts=GAvsGB GBvsGA
20 GAvsGB=GA GB
21 GBvsGA=GB GA
22 GA=FA FB FC
23 GB=FD FE FF
24
25 se=FA FB FC FD FE FF
26
27 FA=SRR933983fastqgz
28 FA_rs=50
29 FA_qual=33
30
31 FB=SRR933984fastqgz
32 FB_rs=50
47
iRAP example configuration file
33 FB_qual=33
34
35 FC=SRR933985fastqgz
36 FC_rs=50
37 FC_qual=33
38
39 FD=SRR933989fastqgz
40 FD_rs=50
41 FD_qual=33
42
43 FE=SRR933990fastqgz
44 FE_rs=50
45 FE_qual=33
46
47 FF=SRR933990fastqgz
48 FF_rs=50
49 FF_qual=33
50 EOF
48
- Front Page
- Table of Contents
- List of Figures
- List of Tables
- 1 Introduction
-
- 11 Context
- 12 Motivation and Goals
- 13 Proposed Solution
- 14 Structure of the Dissertation
-
- 2 Basic Concepts and Bibliographic Review
-
- 21 Biological Basic Concepts
-
- 211 Genome
- 212 Transcriptome Assembly and Gene expression
-
- 22 RNA-Seq Analysis
-
- 221 RNA-Seq microarrays and DNA sequencing
- 222 RNA-Seq Pipeline
-
- 23 Standard File Formats used
-
- 231 FASTA
- 232 FASTQ
- 233 SAM and BAM
- 234 GFF and GTF
-
- 24 Relevant Data Repositories
- 25 Tools for RNA-seq and Differential Analysis
- 26 Relational and Non-relational Databases
- 27 Tecnologies
- 28 Related Work
- 29 Chapter Summary
-
- 3 The Gemini framework
-
- 31 Gemini
- 32 Gemini Architecture
-
- 321 Physical Architecture
-
- 33 Data Management
- 34 Web Interface
- 35 Use cases
- 36 Case studies
-
- 361 Full pipeline
- 362 Stage pipeline
-
- 37 Chapter Summary
-
- 4 Case study
-
- 41 Samples characterization
- 42 Researching objectives
- 43 Protocol of analysis
- 44 Genome version GRCh37 versus GRCh38
- 45 Fusion genes
- 46 Results
-
- 461 Case study with reference genome GRCh37
- 462 Splicing analysis
- 463 Case study with reference genome GRCh38
-
- 47 Chapter Summary
-
- 5 Conclusions and Future Work
- References
- A iRAP tools supported
-
- A1 Mappers
- A2 Quantification
- A3 Differential expression [DE]
- A4 Gene set enrichment analysis [GSE]
-
- B iRAP model of configuration file
- C iRAP example configuration file
-
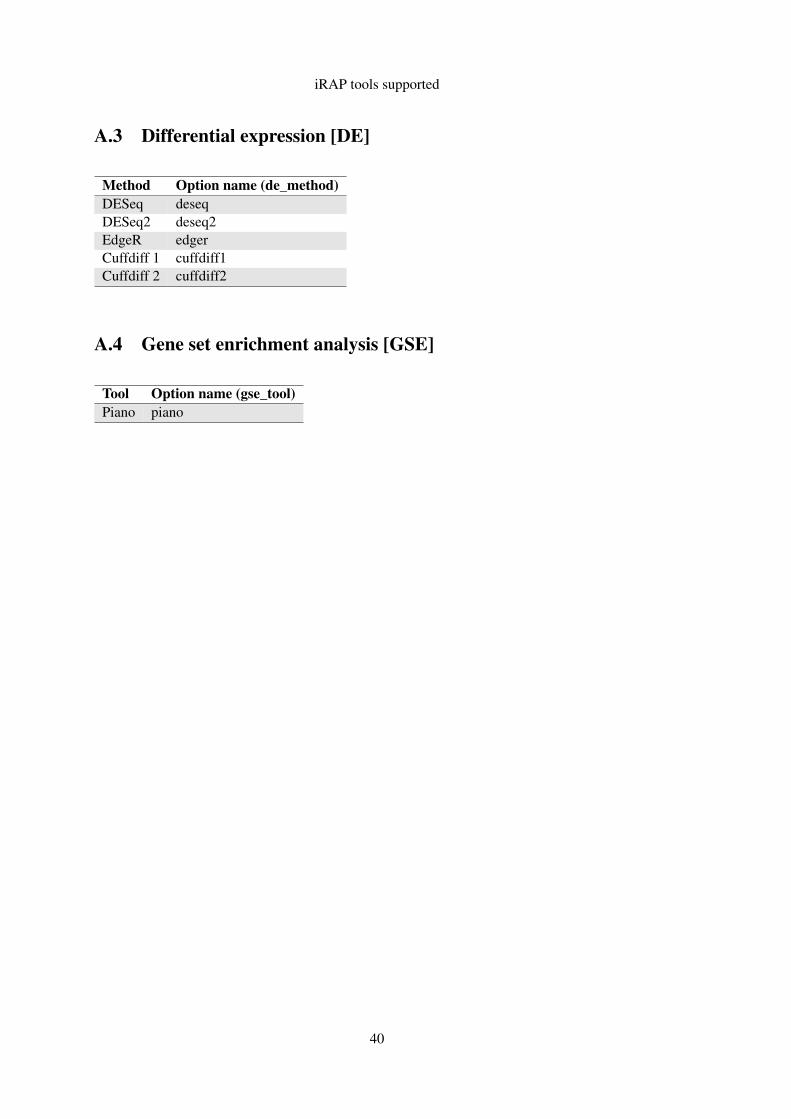
iRAP model of configuration file
82 Contamination check (cont_index parameter) Reads that likely
83 originate from organisms other than the one under study can be
84 discarded during pre-processment of the reads This is done by
85 aligning the reads to the genomes of organisms that might be a
86 source of contamination and discard those that map with a high
87 degree of fidelity By default iRAP will check if the data is
88 contaminated by e-coli An example to create a contamination
89 database is provided in the examplesex_add2contaminationDBsh
90 script The value of the parameter should be the file name prefix of
91 the bowtie index files
92
93 Disable contamination check
94 cont_index=no
95 Default value
96 cont_index=$(data_dir)contaminatione_coli
97
98
99 Misc options
100
101 Number of threads that may be used by IRAP
102 max_threads=1
103
104 Exon level quantification Yes (y)| No (n)
105 exon_quant=y
106
107 Transcript level quantification Yes (y)| No (n)
108 transcript_quant=y
109 =============================================================================
110 full or relative path to the directory where all the data can be found
111 data_dir=data
112
113 the directory should be organized as follows (see directory data in IRAP toplevel
directory)
114
115 $data_dir
116 $data_dir
117 contamination
118 e_coli1ebwt
119 e_coli2ebwt
120 e_coli3ebwt
121 e_coli4ebwt
122 e_coliREADME
123 e_colirev1ebwt
124 e_colirev2eb
125 raw_data
126 $species
127 fastq
128 fastq
129
43
iRAP model of configuration file
130 reference
131 $species
132 $gtf_file
133 $reference
134
135 Notes
136 1) $ denotes the value defined for the variable
137 2) Since version 050 the raw data (fastqbam) files may be
138 distributed across several sub-folders
139
140
141 =============================================================================
142 Only necessary if you intend to perform Differential Expression analysis
143
144 contrasts=contrast_def [contrast_def ]
145 contrasts=purpleVsPink purpleVsGrey
146
147 definition of each constrast
148 contrast= group group [ group ]
149 purlpleVsPink=Purple Pink
150 purlpleVsGrey=Purple Grey
151
152 groups
153 GroupName= Library_name [Library_name ]
154 Purlple=myLib1 myLib2
155 Pink=myLib3
156 Grey=myLib4
157
158 optional parameter used in the report (HTML) generation
159 groups=Purple Pink Grey
160
161 technical replicates
162 technicalreplicates=myLib1myLib2myLib3mylib4
163
164 Note names of groups contrasts and libraries should start with a letter and
contain only alphanumeric characters and the character _
165
166 =============================================================================
167 Data
168
169
170 Information for each library
171 LibName=Fastq file
172 Note
173 1 LibName should start with a letter and contain only alphanumeric characters
and the character _ LibName should not contain in _1 or _2
174 2 LibName should be different from the name of the fastq file for instance
175 f1=f1fastq
176 will produce an error
44
iRAP model of configuration file
177
178 Single-end
179 myLib1=f1fastq
180 read size
181 myLib1_rs=75
182 quality encoding (33 or 64)
183 myLib1_qual=33
184
185 strand specific protocol
186 mylib1_strand=first
187 mylib1_strand=second
188 Default value is both (strands)
189 mylib1_strand=both
190
191 Have the file in a different sub-folder
192 mylib1_dir=somesubfolder
193
194 See SAMBAM specification for more details about the following two parameters
195 read group id (to be included in the BAM file) - this is not supported by all
mappers
196 myLib1_rgid=
197 sambam header lines to include in the BAM file
198 myLib1_shl=COtThis is a commentnCOtand another line
199
200 LibName=Fastq file
201 myLib2=f2fastq
202 read size
203 myLib2_rs=75
204 quality encoding (33 or 64)
205 myLib2_qual=33
206
207
208 Paired-end
209 LibName=Fastq files
210 myLib3=f3_1fastq f3_2fastq
211 read size
212 myLib3_rs=50
213 quality encoding (33 or 64)
214 myLib3_qual=33
215 insert size
216 myLib3_ins=350
217 standard deviation
218 myLib3_sd=60
219
220 LibName=Fastq files
221 myLib4=f4_1fastq f4_2fastq
222 read size
223 myLib4_rs=50
224 quality encoding (33 or 64)
45
iRAP model of configuration file
225 myLib4_qual=33
226 insert size
227 myLib4_ins=350
228 standard deviation
229 myLib4_sd=60
230
231
232
233
234 list the names of your single-end (se) and paired (pe) libraries
235 se=myLib1 myLib2
236 pe=myLib3 myLib4
237 No SE data
238 se=
239 No PE data
240 pe=
241
242
243
244 Passingoverriding parameters
245
246 It is possible to pass parameters to the mappers and quantification
247 methods but that should be done carefully since it may break the
248 pipeline (if the location of the input andor output files is
249 changed)
250
251 Overridingchanging the mappersrsquo parameters
252 _map_options=options
253 Example
254 tophat2_map_options=--min-intron-length 5 --no-coverage-search
255
256 Overridingchanging the parameters of the quantification methods
257 _params=options
258 Example
259 htseq_params= -q
46
Appendix C
iRAP example configuration file
1 minimal configuration file for DE
2 experiment name
3 name=ecoli_ex
4 species
5 species=ecoli_k12
6 reference genome
7 reference=Escherichia_coli_str_k_12_substr_mg1655GCA_000005845119dnatoplevel
fagz
8 gtf file
9 gtf_file=Escherichia_coli_str_k_12_substr_mg1655GCA_000005845119gtfgz
10 Enable filtering based on quality
11 qual_filtering=on
12 Use a contamination data set to filter out reads
13 cont_index=no
14 Toplevel directory with the data
15 data_dir=
16
17 some contrasts
18 GA=Group A
19 contrasts=GAvsGB GBvsGA
20 GAvsGB=GA GB
21 GBvsGA=GB GA
22 GA=FA FB FC
23 GB=FD FE FF
24
25 se=FA FB FC FD FE FF
26
27 FA=SRR933983fastqgz
28 FA_rs=50
29 FA_qual=33
30
31 FB=SRR933984fastqgz
32 FB_rs=50
47
iRAP example configuration file
33 FB_qual=33
34
35 FC=SRR933985fastqgz
36 FC_rs=50
37 FC_qual=33
38
39 FD=SRR933989fastqgz
40 FD_rs=50
41 FD_qual=33
42
43 FE=SRR933990fastqgz
44 FE_rs=50
45 FE_qual=33
46
47 FF=SRR933990fastqgz
48 FF_rs=50
49 FF_qual=33
50 EOF
48
- Front Page
- Table of Contents
- List of Figures
- List of Tables
- 1 Introduction
-
- 11 Context
- 12 Motivation and Goals
- 13 Proposed Solution
- 14 Structure of the Dissertation
-
- 2 Basic Concepts and Bibliographic Review
-
- 21 Biological Basic Concepts
-
- 211 Genome
- 212 Transcriptome Assembly and Gene expression
-
- 22 RNA-Seq Analysis
-
- 221 RNA-Seq microarrays and DNA sequencing
- 222 RNA-Seq Pipeline
-
- 23 Standard File Formats used
-
- 231 FASTA
- 232 FASTQ
- 233 SAM and BAM
- 234 GFF and GTF
-
- 24 Relevant Data Repositories
- 25 Tools for RNA-seq and Differential Analysis
- 26 Relational and Non-relational Databases
- 27 Tecnologies
- 28 Related Work
- 29 Chapter Summary
-
- 3 The Gemini framework
-
- 31 Gemini
- 32 Gemini Architecture
-
- 321 Physical Architecture
-
- 33 Data Management
- 34 Web Interface
- 35 Use cases
- 36 Case studies
-
- 361 Full pipeline
- 362 Stage pipeline
-
- 37 Chapter Summary
-
- 4 Case study
-
- 41 Samples characterization
- 42 Researching objectives
- 43 Protocol of analysis
- 44 Genome version GRCh37 versus GRCh38
- 45 Fusion genes
- 46 Results
-
- 461 Case study with reference genome GRCh37
- 462 Splicing analysis
- 463 Case study with reference genome GRCh38
-
- 47 Chapter Summary
-
- 5 Conclusions and Future Work
- References
- A iRAP tools supported
-
- A1 Mappers
- A2 Quantification
- A3 Differential expression [DE]
- A4 Gene set enrichment analysis [GSE]
-
- B iRAP model of configuration file
- C iRAP example configuration file
-
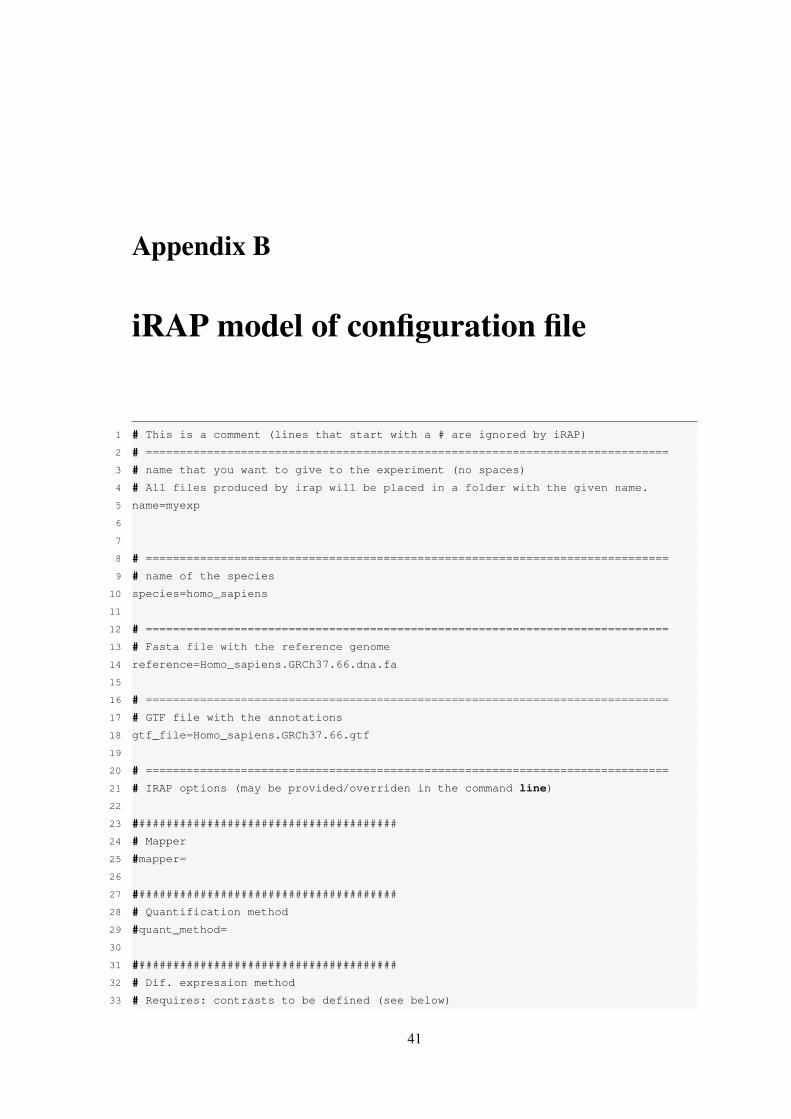
iRAP model of configuration file
130 reference
131 $species
132 $gtf_file
133 $reference
134
135 Notes
136 1) $ denotes the value defined for the variable
137 2) Since version 050 the raw data (fastqbam) files may be
138 distributed across several sub-folders
139
140
141 =============================================================================
142 Only necessary if you intend to perform Differential Expression analysis
143
144 contrasts=contrast_def [contrast_def ]
145 contrasts=purpleVsPink purpleVsGrey
146
147 definition of each constrast
148 contrast= group group [ group ]
149 purlpleVsPink=Purple Pink
150 purlpleVsGrey=Purple Grey
151
152 groups
153 GroupName= Library_name [Library_name ]
154 Purlple=myLib1 myLib2
155 Pink=myLib3
156 Grey=myLib4
157
158 optional parameter used in the report (HTML) generation
159 groups=Purple Pink Grey
160
161 technical replicates
162 technicalreplicates=myLib1myLib2myLib3mylib4
163
164 Note names of groups contrasts and libraries should start with a letter and
contain only alphanumeric characters and the character _
165
166 =============================================================================
167 Data
168
169
170 Information for each library
171 LibName=Fastq file
172 Note
173 1 LibName should start with a letter and contain only alphanumeric characters
and the character _ LibName should not contain in _1 or _2
174 2 LibName should be different from the name of the fastq file for instance
175 f1=f1fastq
176 will produce an error
44
iRAP model of configuration file
177
178 Single-end
179 myLib1=f1fastq
180 read size
181 myLib1_rs=75
182 quality encoding (33 or 64)
183 myLib1_qual=33
184
185 strand specific protocol
186 mylib1_strand=first
187 mylib1_strand=second
188 Default value is both (strands)
189 mylib1_strand=both
190
191 Have the file in a different sub-folder
192 mylib1_dir=somesubfolder
193
194 See SAMBAM specification for more details about the following two parameters
195 read group id (to be included in the BAM file) - this is not supported by all
mappers
196 myLib1_rgid=
197 sambam header lines to include in the BAM file
198 myLib1_shl=COtThis is a commentnCOtand another line
199
200 LibName=Fastq file
201 myLib2=f2fastq
202 read size
203 myLib2_rs=75
204 quality encoding (33 or 64)
205 myLib2_qual=33
206
207
208 Paired-end
209 LibName=Fastq files
210 myLib3=f3_1fastq f3_2fastq
211 read size
212 myLib3_rs=50
213 quality encoding (33 or 64)
214 myLib3_qual=33
215 insert size
216 myLib3_ins=350
217 standard deviation
218 myLib3_sd=60
219
220 LibName=Fastq files
221 myLib4=f4_1fastq f4_2fastq
222 read size
223 myLib4_rs=50
224 quality encoding (33 or 64)
45
iRAP model of configuration file
225 myLib4_qual=33
226 insert size
227 myLib4_ins=350
228 standard deviation
229 myLib4_sd=60
230
231
232
233
234 list the names of your single-end (se) and paired (pe) libraries
235 se=myLib1 myLib2
236 pe=myLib3 myLib4
237 No SE data
238 se=
239 No PE data
240 pe=
241
242
243
244 Passingoverriding parameters
245
246 It is possible to pass parameters to the mappers and quantification
247 methods but that should be done carefully since it may break the
248 pipeline (if the location of the input andor output files is
249 changed)
250
251 Overridingchanging the mappersrsquo parameters
252 _map_options=options
253 Example
254 tophat2_map_options=--min-intron-length 5 --no-coverage-search
255
256 Overridingchanging the parameters of the quantification methods
257 _params=options
258 Example
259 htseq_params= -q
46
Appendix C
iRAP example configuration file
1 minimal configuration file for DE
2 experiment name
3 name=ecoli_ex
4 species
5 species=ecoli_k12
6 reference genome
7 reference=Escherichia_coli_str_k_12_substr_mg1655GCA_000005845119dnatoplevel
fagz
8 gtf file
9 gtf_file=Escherichia_coli_str_k_12_substr_mg1655GCA_000005845119gtfgz
10 Enable filtering based on quality
11 qual_filtering=on
12 Use a contamination data set to filter out reads
13 cont_index=no
14 Toplevel directory with the data
15 data_dir=
16
17 some contrasts
18 GA=Group A
19 contrasts=GAvsGB GBvsGA
20 GAvsGB=GA GB
21 GBvsGA=GB GA
22 GA=FA FB FC
23 GB=FD FE FF
24
25 se=FA FB FC FD FE FF
26
27 FA=SRR933983fastqgz
28 FA_rs=50
29 FA_qual=33
30
31 FB=SRR933984fastqgz
32 FB_rs=50
47
iRAP example configuration file
33 FB_qual=33
34
35 FC=SRR933985fastqgz
36 FC_rs=50
37 FC_qual=33
38
39 FD=SRR933989fastqgz
40 FD_rs=50
41 FD_qual=33
42
43 FE=SRR933990fastqgz
44 FE_rs=50
45 FE_qual=33
46
47 FF=SRR933990fastqgz
48 FF_rs=50
49 FF_qual=33
50 EOF
48
- Front Page
- Table of Contents
- List of Figures
- List of Tables
- 1 Introduction
-
- 11 Context
- 12 Motivation and Goals
- 13 Proposed Solution
- 14 Structure of the Dissertation
-
- 2 Basic Concepts and Bibliographic Review
-
- 21 Biological Basic Concepts
-
- 211 Genome
- 212 Transcriptome Assembly and Gene expression
-
- 22 RNA-Seq Analysis
-
- 221 RNA-Seq microarrays and DNA sequencing
- 222 RNA-Seq Pipeline
-
- 23 Standard File Formats used
-
- 231 FASTA
- 232 FASTQ
- 233 SAM and BAM
- 234 GFF and GTF
-
- 24 Relevant Data Repositories
- 25 Tools for RNA-seq and Differential Analysis
- 26 Relational and Non-relational Databases
- 27 Tecnologies
- 28 Related Work
- 29 Chapter Summary
-
- 3 The Gemini framework
-
- 31 Gemini
- 32 Gemini Architecture
-
- 321 Physical Architecture
-
- 33 Data Management
- 34 Web Interface
- 35 Use cases
- 36 Case studies
-
- 361 Full pipeline
- 362 Stage pipeline
-
- 37 Chapter Summary
-
- 4 Case study
-
- 41 Samples characterization
- 42 Researching objectives
- 43 Protocol of analysis
- 44 Genome version GRCh37 versus GRCh38
- 45 Fusion genes
- 46 Results
-
- 461 Case study with reference genome GRCh37
- 462 Splicing analysis
- 463 Case study with reference genome GRCh38
-
- 47 Chapter Summary
-
- 5 Conclusions and Future Work
- References
- A iRAP tools supported
-
- A1 Mappers
- A2 Quantification
- A3 Differential expression [DE]
- A4 Gene set enrichment analysis [GSE]
-
- B iRAP model of configuration file
- C iRAP example configuration file
-
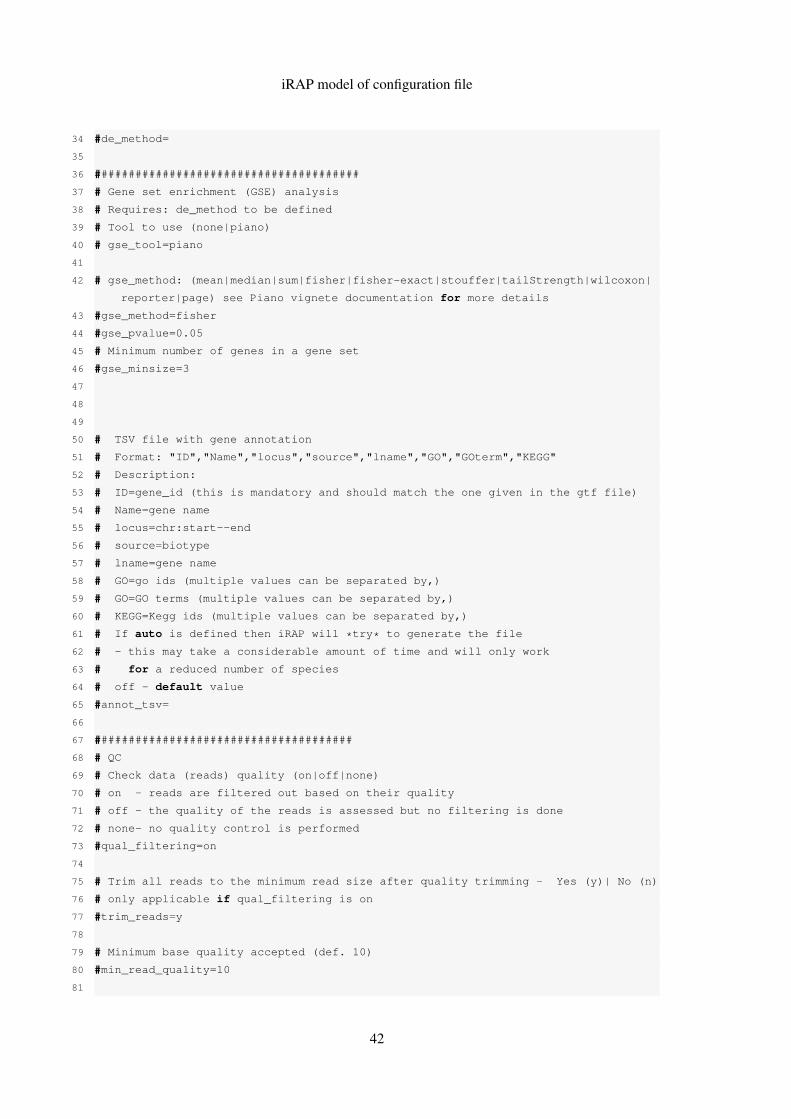
iRAP model of configuration file
177
178 Single-end
179 myLib1=f1fastq
180 read size
181 myLib1_rs=75
182 quality encoding (33 or 64)
183 myLib1_qual=33
184
185 strand specific protocol
186 mylib1_strand=first
187 mylib1_strand=second
188 Default value is both (strands)
189 mylib1_strand=both
190
191 Have the file in a different sub-folder
192 mylib1_dir=somesubfolder
193
194 See SAMBAM specification for more details about the following two parameters
195 read group id (to be included in the BAM file) - this is not supported by all
mappers
196 myLib1_rgid=
197 sambam header lines to include in the BAM file
198 myLib1_shl=COtThis is a commentnCOtand another line
199
200 LibName=Fastq file
201 myLib2=f2fastq
202 read size
203 myLib2_rs=75
204 quality encoding (33 or 64)
205 myLib2_qual=33
206
207
208 Paired-end
209 LibName=Fastq files
210 myLib3=f3_1fastq f3_2fastq
211 read size
212 myLib3_rs=50
213 quality encoding (33 or 64)
214 myLib3_qual=33
215 insert size
216 myLib3_ins=350
217 standard deviation
218 myLib3_sd=60
219
220 LibName=Fastq files
221 myLib4=f4_1fastq f4_2fastq
222 read size
223 myLib4_rs=50
224 quality encoding (33 or 64)
45
iRAP model of configuration file
225 myLib4_qual=33
226 insert size
227 myLib4_ins=350
228 standard deviation
229 myLib4_sd=60
230
231
232
233
234 list the names of your single-end (se) and paired (pe) libraries
235 se=myLib1 myLib2
236 pe=myLib3 myLib4
237 No SE data
238 se=
239 No PE data
240 pe=
241
242
243
244 Passingoverriding parameters
245
246 It is possible to pass parameters to the mappers and quantification
247 methods but that should be done carefully since it may break the
248 pipeline (if the location of the input andor output files is
249 changed)
250
251 Overridingchanging the mappersrsquo parameters
252 _map_options=options
253 Example
254 tophat2_map_options=--min-intron-length 5 --no-coverage-search
255
256 Overridingchanging the parameters of the quantification methods
257 _params=options
258 Example
259 htseq_params= -q
46
Appendix C
iRAP example configuration file
1 minimal configuration file for DE
2 experiment name
3 name=ecoli_ex
4 species
5 species=ecoli_k12
6 reference genome
7 reference=Escherichia_coli_str_k_12_substr_mg1655GCA_000005845119dnatoplevel
fagz
8 gtf file
9 gtf_file=Escherichia_coli_str_k_12_substr_mg1655GCA_000005845119gtfgz
10 Enable filtering based on quality
11 qual_filtering=on
12 Use a contamination data set to filter out reads
13 cont_index=no
14 Toplevel directory with the data
15 data_dir=
16
17 some contrasts
18 GA=Group A
19 contrasts=GAvsGB GBvsGA
20 GAvsGB=GA GB
21 GBvsGA=GB GA
22 GA=FA FB FC
23 GB=FD FE FF
24
25 se=FA FB FC FD FE FF
26
27 FA=SRR933983fastqgz
28 FA_rs=50
29 FA_qual=33
30
31 FB=SRR933984fastqgz
32 FB_rs=50
47
iRAP example configuration file
33 FB_qual=33
34
35 FC=SRR933985fastqgz
36 FC_rs=50
37 FC_qual=33
38
39 FD=SRR933989fastqgz
40 FD_rs=50
41 FD_qual=33
42
43 FE=SRR933990fastqgz
44 FE_rs=50
45 FE_qual=33
46
47 FF=SRR933990fastqgz
48 FF_rs=50
49 FF_qual=33
50 EOF
48
- Front Page
- Table of Contents
- List of Figures
- List of Tables
- 1 Introduction
-
- 11 Context
- 12 Motivation and Goals
- 13 Proposed Solution
- 14 Structure of the Dissertation
-
- 2 Basic Concepts and Bibliographic Review
-
- 21 Biological Basic Concepts
-
- 211 Genome
- 212 Transcriptome Assembly and Gene expression
-
- 22 RNA-Seq Analysis
-
- 221 RNA-Seq microarrays and DNA sequencing
- 222 RNA-Seq Pipeline
-
- 23 Standard File Formats used
-
- 231 FASTA
- 232 FASTQ
- 233 SAM and BAM
- 234 GFF and GTF
-
- 24 Relevant Data Repositories
- 25 Tools for RNA-seq and Differential Analysis
- 26 Relational and Non-relational Databases
- 27 Tecnologies
- 28 Related Work
- 29 Chapter Summary
-
- 3 The Gemini framework
-
- 31 Gemini
- 32 Gemini Architecture
-
- 321 Physical Architecture
-
- 33 Data Management
- 34 Web Interface
- 35 Use cases
- 36 Case studies
-
- 361 Full pipeline
- 362 Stage pipeline
-
- 37 Chapter Summary
-
- 4 Case study
-
- 41 Samples characterization
- 42 Researching objectives
- 43 Protocol of analysis
- 44 Genome version GRCh37 versus GRCh38
- 45 Fusion genes
- 46 Results
-
- 461 Case study with reference genome GRCh37
- 462 Splicing analysis
- 463 Case study with reference genome GRCh38
-
- 47 Chapter Summary
-
- 5 Conclusions and Future Work
- References
- A iRAP tools supported
-
- A1 Mappers
- A2 Quantification
- A3 Differential expression [DE]
- A4 Gene set enrichment analysis [GSE]
-
- B iRAP model of configuration file
- C iRAP example configuration file
-
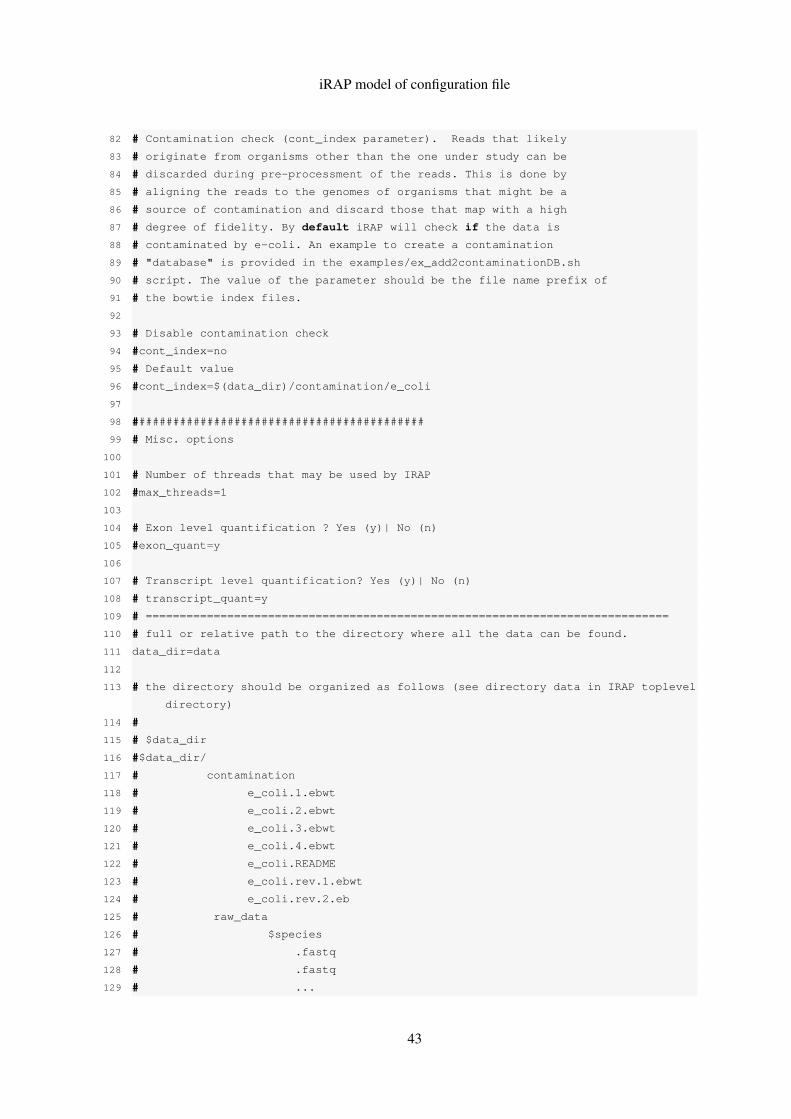
iRAP model of configuration file
225 myLib4_qual=33
226 insert size
227 myLib4_ins=350
228 standard deviation
229 myLib4_sd=60
230
231
232
233
234 list the names of your single-end (se) and paired (pe) libraries
235 se=myLib1 myLib2
236 pe=myLib3 myLib4
237 No SE data
238 se=
239 No PE data
240 pe=
241
242
243
244 Passingoverriding parameters
245
246 It is possible to pass parameters to the mappers and quantification
247 methods but that should be done carefully since it may break the
248 pipeline (if the location of the input andor output files is
249 changed)
250
251 Overridingchanging the mappersrsquo parameters
252 _map_options=options
253 Example
254 tophat2_map_options=--min-intron-length 5 --no-coverage-search
255
256 Overridingchanging the parameters of the quantification methods
257 _params=options
258 Example
259 htseq_params= -q
46
Appendix C
iRAP example configuration file
1 minimal configuration file for DE
2 experiment name
3 name=ecoli_ex
4 species
5 species=ecoli_k12
6 reference genome
7 reference=Escherichia_coli_str_k_12_substr_mg1655GCA_000005845119dnatoplevel
fagz
8 gtf file
9 gtf_file=Escherichia_coli_str_k_12_substr_mg1655GCA_000005845119gtfgz
10 Enable filtering based on quality
11 qual_filtering=on
12 Use a contamination data set to filter out reads
13 cont_index=no
14 Toplevel directory with the data
15 data_dir=
16
17 some contrasts
18 GA=Group A
19 contrasts=GAvsGB GBvsGA
20 GAvsGB=GA GB
21 GBvsGA=GB GA
22 GA=FA FB FC
23 GB=FD FE FF
24
25 se=FA FB FC FD FE FF
26
27 FA=SRR933983fastqgz
28 FA_rs=50
29 FA_qual=33
30
31 FB=SRR933984fastqgz
32 FB_rs=50
47
iRAP example configuration file
33 FB_qual=33
34
35 FC=SRR933985fastqgz
36 FC_rs=50
37 FC_qual=33
38
39 FD=SRR933989fastqgz
40 FD_rs=50
41 FD_qual=33
42
43 FE=SRR933990fastqgz
44 FE_rs=50
45 FE_qual=33
46
47 FF=SRR933990fastqgz
48 FF_rs=50
49 FF_qual=33
50 EOF
48
- Front Page
- Table of Contents
- List of Figures
- List of Tables
- 1 Introduction
-
- 11 Context
- 12 Motivation and Goals
- 13 Proposed Solution
- 14 Structure of the Dissertation
-
- 2 Basic Concepts and Bibliographic Review
-
- 21 Biological Basic Concepts
-
- 211 Genome
- 212 Transcriptome Assembly and Gene expression
-
- 22 RNA-Seq Analysis
-
- 221 RNA-Seq microarrays and DNA sequencing
- 222 RNA-Seq Pipeline
-
- 23 Standard File Formats used
-
- 231 FASTA
- 232 FASTQ
- 233 SAM and BAM
- 234 GFF and GTF
-
- 24 Relevant Data Repositories
- 25 Tools for RNA-seq and Differential Analysis
- 26 Relational and Non-relational Databases
- 27 Tecnologies
- 28 Related Work
- 29 Chapter Summary
-
- 3 The Gemini framework
-
- 31 Gemini
- 32 Gemini Architecture
-
- 321 Physical Architecture
-
- 33 Data Management
- 34 Web Interface
- 35 Use cases
- 36 Case studies
-
- 361 Full pipeline
- 362 Stage pipeline
-
- 37 Chapter Summary
-
- 4 Case study
-
- 41 Samples characterization
- 42 Researching objectives
- 43 Protocol of analysis
- 44 Genome version GRCh37 versus GRCh38
- 45 Fusion genes
- 46 Results
-
- 461 Case study with reference genome GRCh37
- 462 Splicing analysis
- 463 Case study with reference genome GRCh38
-
- 47 Chapter Summary
-
- 5 Conclusions and Future Work
- References
- A iRAP tools supported
-
- A1 Mappers
- A2 Quantification
- A3 Differential expression [DE]
- A4 Gene set enrichment analysis [GSE]
-
- B iRAP model of configuration file
- C iRAP example configuration file
-
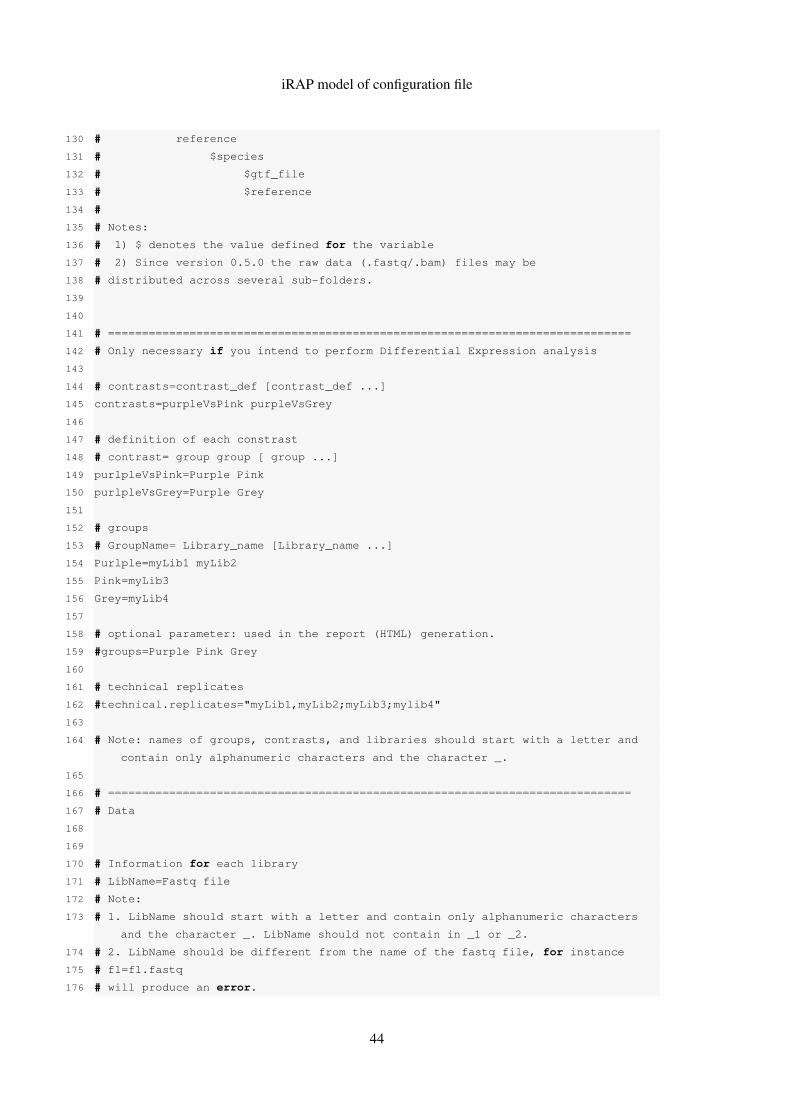
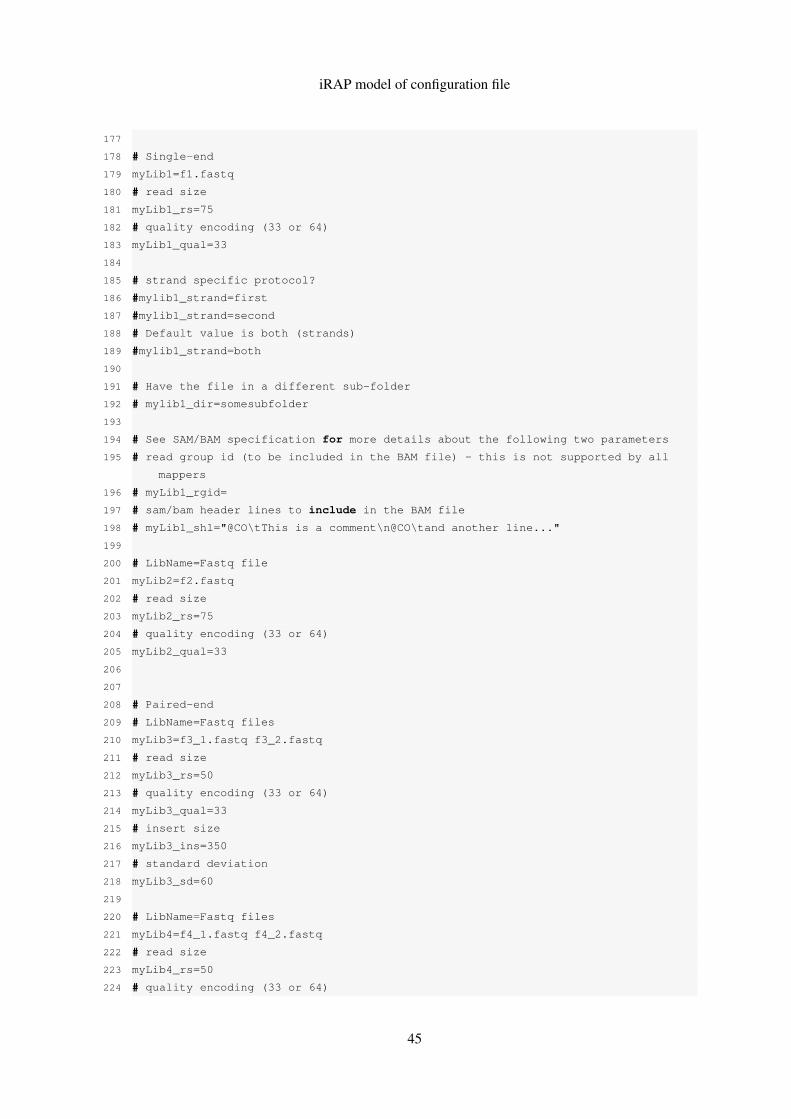