assessing the capability of multi-scale drought datasets to quantify drought severity and to...
TRANSCRIPT
INTERNATIONAL JOURNAL OF CLIMATOLOGYInt. J. Climatol. (2012)Published online in Wiley Online Library(wileyonlinelibrary.com) DOI: 10.1002/joc.3555
Assessing the capability of multi-scale drought datasetsto quantify drought severity and to identify drought
impacts: an example in the Ebro Basin
Enrique Moran-Tejeda,a* Andrej Ceglar,b Barbara Medved-Cvikl,b Sergio M. Vicente-Serrano,a
Juan I. Lopez-Moreno,a Jose C. Gonzalez-Hidalgo,c Jesus Revuelto,a Jorge Lorenzo-Lacruz,a
Julio Camarerod and Edmond Pashoa
a Department of Geoenvironmental Processes and Global Change, Instituto Pirenaico de Ecologıa, CSIC, Zaragoza, Spainb Biotechnical Faculty, University of Ljubljana, Ljubljana, Slovenia
c Departamento de Geografıa, Universidad de Zaragoza, Zaragoza, Spaind ARAID-Instituto Pirenaico de Ecologıa, CSIC, Zaragoza, Spain
ABSTRACT: Assessing the risk, the severity and the likely evolution of droughts are key tasks for improving preparednessof regions prone to drought conditions, and mitigation of drought consequences. The access to real-time and high-qualityclimatic information is essential for this purpose. Different climatic databases are being developed and made available onreal time by climatic research institutions, but their capability for quantifying droughts characteristics including severity,or spatio-temporal variability, is uncertain given their low spatial resolution. In this study, we assessed the capability ofthree databases with contrasted spatial resolution for measuring spatial and temporal variability of drought occurrence. Thestandardized precipitation index, calculated for each database, showed that the low resolution datasets allow an acceptablemeasurement of the magnitude, intensity and duration of droughts, while failing mostly in detecting the spatial patternsof the specific drought episodes. Moreover, the capability of the datasets for assessing the impacts of droughts on surfacehydrology and tree growth was examined. Results confirmed the usefulness of the drought index for assessing droughtimpacts on water resources and forest ecosystems even when low resolution databases are used. Copyright 2012 RoyalMeteorological Society
KEY WORDS drought; real-time monitoring; standardized precipitation index; low resolution datasets; streamflow; waterresources; dendrochronology; tree growth
Received 16 December 2011; Revised 20 June 2012; Accepted 23 June 2012
1. Introduction
Understanding, monitoring and mitigating droughts is avery difficult task as a consequence of the intrinsic natureof the phenomenon. A drought can be identified by itseffects at different levels, but there is not a physicalmeasurable variable that enables quantifying droughts.Due to its long-term development and duration, progres-sive character of its impacts and diffuse spatial limits,drought is amongst the most complex natural hazards tobe identified, analysed, monitored and managed (Burtonet al., 1978; Wilhite, 1993). Drought conditions are muchmore difficult to identify than other natural hazards sincedrought is commonly the result of a number of factors,which are only apparent after a long period of precipi-tation deficit. Moreover, it is very difficult to determineits onset, extent and end. In contrast to other natural haz-ards such as floods, which are typically restricted to smallregions and to well-defined temporal intervals, drought is
∗ Correspondence to: E. Moran-Tejeda, Instituto Pirenaico de Ecologıa,CSIC, Zaragoza, Spain. E-mail: [email protected]
difficult to locate in time and space, affecting wide areasover long time periods.
As a consequence, most of the actions conductedto mitigate the negative effects of droughts are takenduring the response and recovery phases of the disastermanagement cycle, i.e. they are focused on alleviatingthe immediate effects of drought once the phenomenonhas occurred and restoring the affected areas to theirprevious state (Wilhite and Svoboda, 2000). While thesemeasures are still necessary, their effectiveness is limitedin the long-term basis, since they can only cope withspecific catastrophes; i.e. they hardly contribute to reducethe vulnerability of the affected societies to drought. Toreduce the drought vulnerability of the affected societies,it is necessary to promote an integral conception ofdrought risk management (Wilhite, 1996). Hence, event-oriented actions need to be complemented by othermeasures focused on promoting drought risk mitigationand preparedness (Wilhite, 2002).
Two fundamental requisites for reinforcing droughtmitigation and preparedness in the long term are (1) anaccurate drought risk assessment quantifying the extent of
Copyright 2012 Royal Meteorological Society
E. MORAN-TEJEDA et al.
the hazard and the degree of vulnerability of the differentregions; and (2) real-time information on the develop-ment of drought conditions and early forecasting of thelikely evolution of the drought. This was acknowledgedby the World Summit on Sustainable development (24August to 2 September 2002) by the UN and the Johan-nesburg Plan of Implementation of the Agenda 21, whopointed to prioritize policy actions that include ‘. . . Pro-viding affordable local access to information to improvemonitoring and early warning related to desertificationand drought.’ The Review of implementation of Agenda21 and the Johannesburg Plan of Implementation by theCommission on Sustainable Development of the UN Eco-nomic and Social Council (5–16 May 2008) stressedas well that ‘the establishment and effective operationof systems and networks for drought monitoring, earlywarning and drought impact assessment are essential tothe identification and formulation of effective and timelyresponse actions’.
New technologies are available for developing mon-itoring and early warning systems based on real-timeinformation to support decision making (Svoboda et al.,2002; Carbone et al., 2008). Currently, the main problemassociated to the different drought monitoring systemsdeveloped worldwide is the access to high-quality cli-mate information on a real time. In Europe, for example,the competences for collecting information correspondto the different states and governmental agencies, thusa common network of meteorological observatories isnot available at the continental scale. In addition, mostof the existing meteorological information is not open-access and available on real time. One of the other majorproblems associated to climatic data is the existence ofdata gaps in the series, and the irregular spatial coverageof the meteorological stations. This is particularly rele-vant for precipitation, given its stochastic nature in timeand space. To overcome these problems, it has becomemore and more frequent during the last two decades thedevelopment and use of gridded climatic databases (Tren-berth, 1997; Goddard et al., 2001; Perry and Hollis, 2005;Herrera et al., 2012). These allow characterizing contin-uously in space the behaviour of climatic variables, thuspermitting regional and supra-regional climatic studiesbeing accomplished. However, they are product of sta-tistical and geostatistical interpolations, and subject of anumber of errors and uncertainties throughout the pro-cess of construction (Haylock et al., 2008). It should berecommendable, prior the use a gridded product, the cor-rection of errors and the validation with other grids orwith stations data (Hofstra et al., 2010; Herrera et al.,2012).
Nowadays, there are available different grid climaticdatabases that enables large-scale monitoring of climatevariables, including those of the climate research unit(CRU, University of East Anglia) (Mitchell and Jones,2005), the Telecommunication Net of the World Meteo-rological Organization (http://www.wmo.int/pages/prog/www/index en.html) or the Global Precipitation Clima-tology Centre (GPCC) (ftp://ftp-anon.dwd.de/pub/data/
gpcc/html/monitoring download.html), among others.These climatic datasets have, however, very low spatialresolution (typically 100 km2), and do not enable to findspatial particularities in climate behavior, as the avail-able station-based datasets by the national governmentalagencies do. We thus consider essential to validate thesedatasets against finer resolution grids prior to their utiliza-tion for real-time monitoring of droughts in the differentterritories of the European continent.
The objectives of this paper are (1) to analyse thecapability of ‘low resolution’ datasets for quantifyingdrought severity in a drought-prone area of southernEurope, the Ebro Basin (Northeast Spain); and (2) toassess the potential of the datasets for quantifying droughtimpacts on different sub-systems, such as hydrology andforestry. The assessment is based on the comparison ofthe standardized precipitation index (SPI) calculated fromthree different datasets of contrasted resolution. Detailsof each database will be given in Section 3.1.
2. Study area
The Ebro Basin (Figure 1) is located in the northeastof Spain and it is a region with complex topographyand diverse climate conditions. In the North, the Pyre-nees record a humid climate with precipitation above1300 mm. However, the centre of the Ebro Basin is thenorthernmost semi-arid region of Europe, water availabil-ity is often scarce and the management of water resourcesis a priority task. The Ebro valley is usually isolatedfrom humid air masses by mountains located at the northand south, thus drought is a very frequent hazard inthis area (Vicente-Serrano, 2005), affecting reservoir stor-age levels (Vicente-Serrano and Lopez-Moreno, 2005),river flows (Lopez-Moreno et al., 2011), crop production(Vicente-Serrano et al., 2006), and vegetation activity(Vicente-Serrano, 2007). Aridity is inherent to this area,with a negative water balance (precipitation minus evap-otranspiration) as a consequence of the high potentialevapotranspiration (PET) that occurs in summer. Thus,annual PET reaches 1300 mm in some sectors of the val-ley where annual precipitation hardly reaches 300 mm. Inspite of this, irrigation is a common practice in the lowsectors of the Basin, and numerous reservoirs were builtin the last decades to satisfy growing water demands.Drought monitoring is therefore a priority in the region.Real-time information on the developing of drought isnecessary to assess the possible impacts on the ecology,water resources and cultivations of the Basin.
3. Data
3.1. Precipitation datasetsThree different precipitation datasets have been used forthe purpose of the study.
• EBRO: a high quality and dense dataset of precipitationobservations from the complete net of meteorologi-cal observatories available in Spain has been used as
Copyright 2012 Royal Meteorological Society Int. J. Climatol. (2012)
ASSESSING DROUGHT DATASETS FOR IDENTIFYING DROUGHT SEVERITY AND IMPACTS
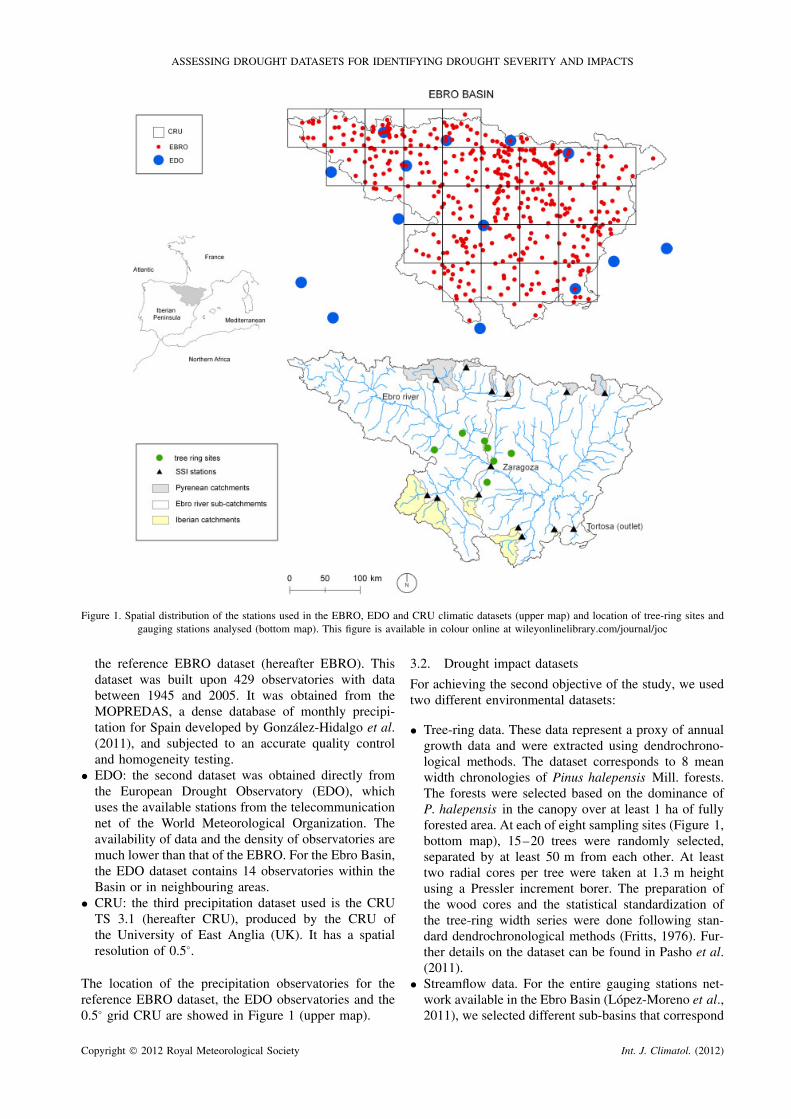
Figure 1. Spatial distribution of the stations used in the EBRO, EDO and CRU climatic datasets (upper map) and location of tree-ring sites andgauging stations analysed (bottom map). This figure is available in colour online at wileyonlinelibrary.com/journal/joc
the reference EBRO dataset (hereafter EBRO). Thisdataset was built upon 429 observatories with databetween 1945 and 2005. It was obtained from theMOPREDAS, a dense database of monthly precipi-tation for Spain developed by Gonzalez-Hidalgo et al.(2011), and subjected to an accurate quality controland homogeneity testing.
• EDO: the second dataset was obtained directly fromthe European Drought Observatory (EDO), whichuses the available stations from the telecommunicationnet of the World Meteorological Organization. Theavailability of data and the density of observatories aremuch lower than that of the EBRO. For the Ebro Basin,the EDO dataset contains 14 observatories within theBasin or in neighbouring areas.
• CRU: the third precipitation dataset used is the CRUTS 3.1 (hereafter CRU), produced by the CRU ofthe University of East Anglia (UK). It has a spatialresolution of 0.5°.
The location of the precipitation observatories for thereference EBRO dataset, the EDO observatories and the0.5° grid CRU are showed in Figure 1 (upper map).
3.2. Drought impact datasets
For achieving the second objective of the study, we usedtwo different environmental datasets:
• Tree-ring data. These data represent a proxy of annualgrowth data and were extracted using dendrochrono-logical methods. The dataset corresponds to 8 meanwidth chronologies of Pinus halepensis Mill. forests.The forests were selected based on the dominance ofP. halepensis in the canopy over at least 1 ha of fullyforested area. At each of eight sampling sites (Figure 1,bottom map), 15–20 trees were randomly selected,separated by at least 50 m from each other. At leasttwo radial cores per tree were taken at 1.3 m heightusing a Pressler increment borer. The preparation ofthe wood cores and the statistical standardization ofthe tree-ring width series were done following stan-dard dendrochronological methods (Fritts, 1976). Fur-ther details on the dataset can be found in Pasho et al.(2011).
• Streamflow data. For the entire gauging stations net-work available in the Ebro Basin (Lopez-Moreno et al.,2011), we selected different sub-basins that correspond
Copyright 2012 Royal Meteorological Society Int. J. Climatol. (2012)
E. MORAN-TEJEDA et al.
to the headwaters, the medium course and the out-let of the main stream, the Ebro River. The series ofmonthly river discharges (Hm3 year−1) were convertedto standard units through calculation of the standard-ized streamflow index (SSI) (see the details of calcula-tion in Vicente-Serrano et al., 2011). Figure 1 (bottommap) shows the location of the different gauging sta-tions and their correspondent watersheds.
4. Methods
4.1. Selection of a drought index
Drought indicators are the most essential element fordrought analysis and monitoring since they allow identi-fying and quantifying droughts (e.g., see reviews in Heim,2002; Mishra and Singh, 2010; Sivakumar et al., 2010).For the purpose of this study, we have selected the SPI(McKee et al., 1993) since it has been recommended bythe World Meteorological Organization as the referencedrought index, and it only needs precipitation data to becomputed.
The SPI enables to be calculated at different timescales. The time period from the arrival of water inputsto availability of a given usable resource differs con-siderably. Thus, the time scale over which water deficitaccumulates becomes extremely important and function-ally separates hydrological, environmental, agriculturaland other types of drought. This multi-scalar nature ofdroughts (McKee et al. 1993) was the other reason forselecting the SPI versus other traditional indices (suchas the Palmer drought severity index). The computationof the SPI is well documented, therefore we suggest theinterested reader that check the original proposal (McKeeet al. 1993), or the detailed version of the index that wehave used, in Vicente-Serrano (2006) or Lopez-Morenoand Vicente-Serrano (2008).
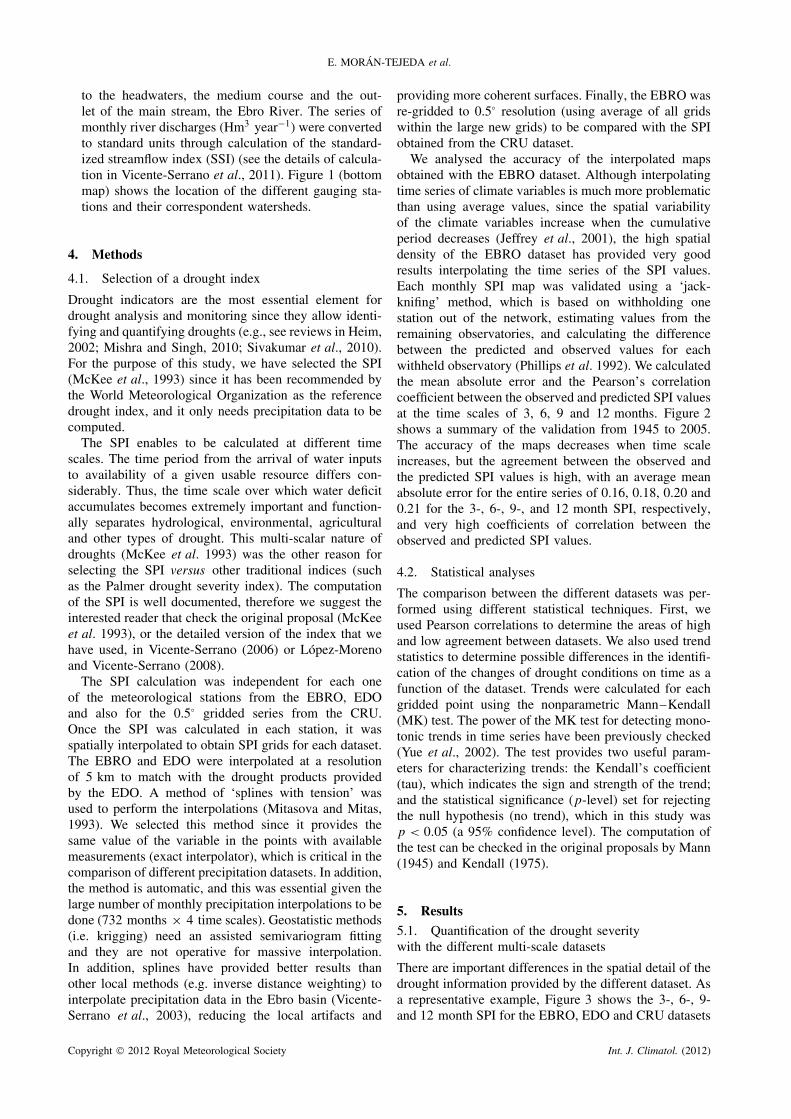
The SPI calculation was independent for each oneof the meteorological stations from the EBRO, EDOand also for the 0.5° gridded series from the CRU.Once the SPI was calculated in each station, it wasspatially interpolated to obtain SPI grids for each dataset.The EBRO and EDO were interpolated at a resolutionof 5 km to match with the drought products providedby the EDO. A method of ‘splines with tension’ wasused to perform the interpolations (Mitasova and Mitas,1993). We selected this method since it provides thesame value of the variable in the points with availablemeasurements (exact interpolator), which is critical in thecomparison of different precipitation datasets. In addition,the method is automatic, and this was essential given thelarge number of monthly precipitation interpolations to bedone (732 months × 4 time scales). Geostatistic methods(i.e. krigging) need an assisted semivariogram fittingand they are not operative for massive interpolation.In addition, splines have provided better results thanother local methods (e.g. inverse distance weighting) tointerpolate precipitation data in the Ebro basin (Vicente-Serrano et al., 2003), reducing the local artifacts and
providing more coherent surfaces. Finally, the EBRO wasre-gridded to 0.5° resolution (using average of all gridswithin the large new grids) to be compared with the SPIobtained from the CRU dataset.
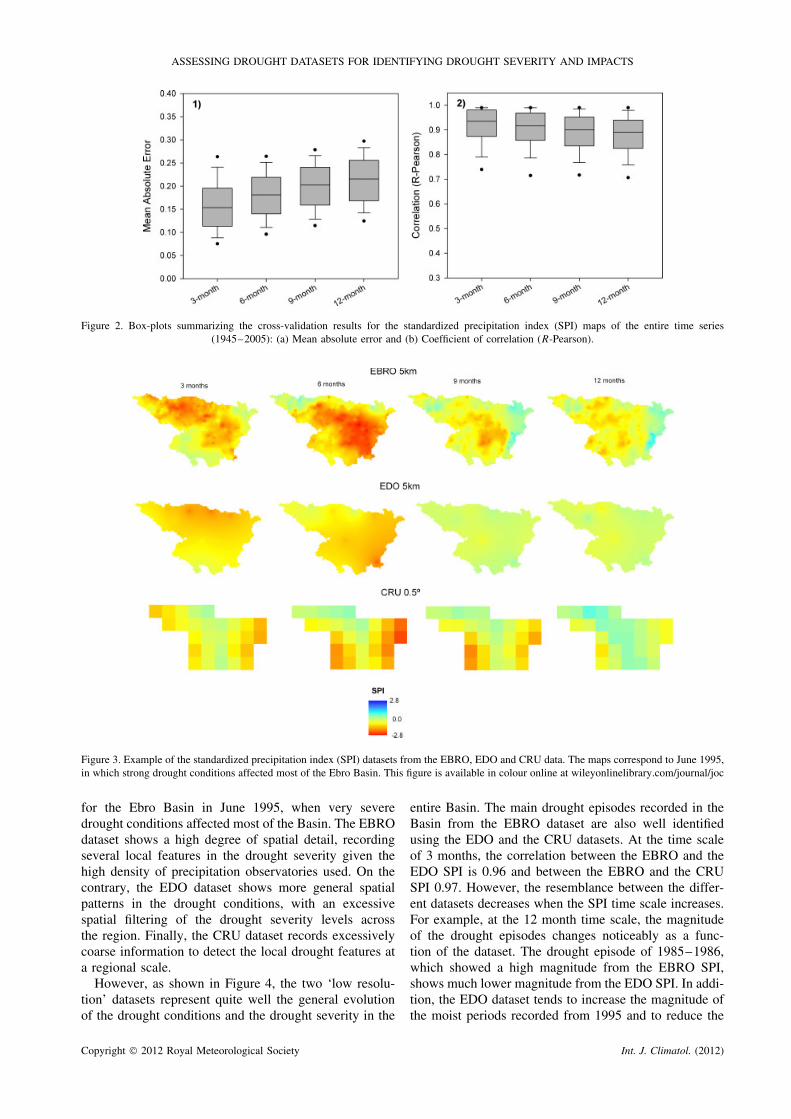
We analysed the accuracy of the interpolated mapsobtained with the EBRO dataset. Although interpolatingtime series of climate variables is much more problematicthan using average values, since the spatial variabilityof the climate variables increase when the cumulativeperiod decreases (Jeffrey et al., 2001), the high spatialdensity of the EBRO dataset has provided very goodresults interpolating the time series of the SPI values.Each monthly SPI map was validated using a ‘jack-knifing’ method, which is based on withholding onestation out of the network, estimating values from theremaining observatories, and calculating the differencebetween the predicted and observed values for eachwithheld observatory (Phillips et al. 1992). We calculatedthe mean absolute error and the Pearson’s correlationcoefficient between the observed and predicted SPI valuesat the time scales of 3, 6, 9 and 12 months. Figure 2shows a summary of the validation from 1945 to 2005.The accuracy of the maps decreases when time scaleincreases, but the agreement between the observed andthe predicted SPI values is high, with an average meanabsolute error for the entire series of 0.16, 0.18, 0.20 and0.21 for the 3-, 6-, 9-, and 12 month SPI, respectively,and very high coefficients of correlation between theobserved and predicted SPI values.
4.2. Statistical analyses
The comparison between the different datasets was per-formed using different statistical techniques. First, weused Pearson correlations to determine the areas of highand low agreement between datasets. We also used trendstatistics to determine possible differences in the identifi-cation of the changes of drought conditions on time as afunction of the dataset. Trends were calculated for eachgridded point using the nonparametric Mann–Kendall(MK) test. The power of the MK test for detecting mono-tonic trends in time series have been previously checked(Yue et al., 2002). The test provides two useful param-eters for characterizing trends: the Kendall’s coefficient(tau), which indicates the sign and strength of the trend;and the statistical significance (p-level) set for rejectingthe null hypothesis (no trend), which in this study wasp < 0.05 (a 95% confidence level). The computation ofthe test can be checked in the original proposals by Mann(1945) and Kendall (1975).
5. Results
5.1. Quantification of the drought severitywith the different multi-scale datasets
There are important differences in the spatial detail of thedrought information provided by the different dataset. Asa representative example, Figure 3 shows the 3-, 6-, 9-and 12 month SPI for the EBRO, EDO and CRU datasets
Copyright 2012 Royal Meteorological Society Int. J. Climatol. (2012)
ASSESSING DROUGHT DATASETS FOR IDENTIFYING DROUGHT SEVERITY AND IMPACTS
Figure 2. Box-plots summarizing the cross-validation results for the standardized precipitation index (SPI) maps of the entire time series(1945–2005): (a) Mean absolute error and (b) Coefficient of correlation (R-Pearson).
Figure 3. Example of the standardized precipitation index (SPI) datasets from the EBRO, EDO and CRU data. The maps correspond to June 1995,in which strong drought conditions affected most of the Ebro Basin. This figure is available in colour online at wileyonlinelibrary.com/journal/joc
for the Ebro Basin in June 1995, when very severedrought conditions affected most of the Basin. The EBROdataset shows a high degree of spatial detail, recordingseveral local features in the drought severity given thehigh density of precipitation observatories used. On thecontrary, the EDO dataset shows more general spatialpatterns in the drought conditions, with an excessivespatial filtering of the drought severity levels acrossthe region. Finally, the CRU dataset records excessivelycoarse information to detect the local drought features ata regional scale.
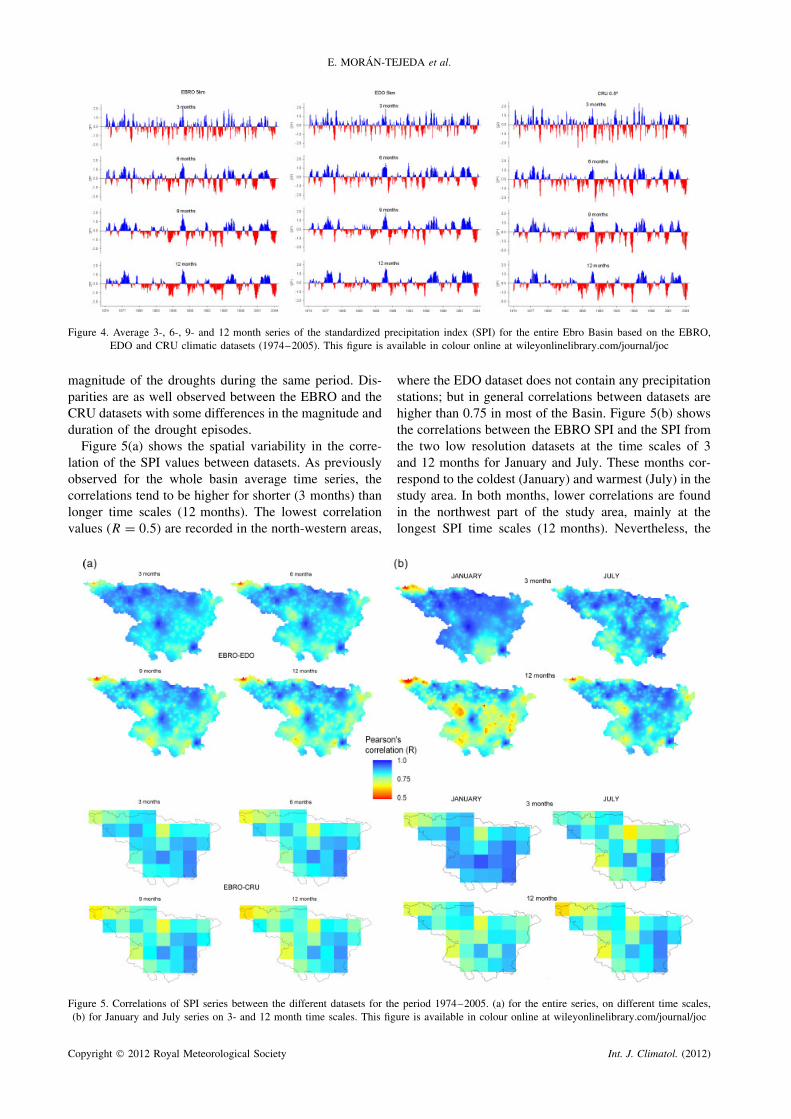
However, as shown in Figure 4, the two ‘low resolu-tion’ datasets represent quite well the general evolutionof the drought conditions and the drought severity in the
entire Basin. The main drought episodes recorded in theBasin from the EBRO dataset are also well identifiedusing the EDO and the CRU datasets. At the time scaleof 3 months, the correlation between the EBRO and theEDO SPI is 0.96 and between the EBRO and the CRUSPI 0.97. However, the resemblance between the differ-ent datasets decreases when the SPI time scale increases.For example, at the 12 month time scale, the magnitudeof the drought episodes changes noticeably as a func-tion of the dataset. The drought episode of 1985–1986,which showed a high magnitude from the EBRO SPI,shows much lower magnitude from the EDO SPI. In addi-tion, the EDO dataset tends to increase the magnitude ofthe moist periods recorded from 1995 and to reduce the
Copyright 2012 Royal Meteorological Society Int. J. Climatol. (2012)
E. MORAN-TEJEDA et al.
Figure 4. Average 3-, 6-, 9- and 12 month series of the standardized precipitation index (SPI) for the entire Ebro Basin based on the EBRO,EDO and CRU climatic datasets (1974–2005). This figure is available in colour online at wileyonlinelibrary.com/journal/joc
magnitude of the droughts during the same period. Dis-parities are as well observed between the EBRO and theCRU datasets with some differences in the magnitude andduration of the drought episodes.
Figure 5(a) shows the spatial variability in the corre-lation of the SPI values between datasets. As previouslyobserved for the whole basin average time series, thecorrelations tend to be higher for shorter (3 months) thanlonger time scales (12 months). The lowest correlationvalues (R = 0.5) are recorded in the north-western areas,
where the EDO dataset does not contain any precipitationstations; but in general correlations between datasets arehigher than 0.75 in most of the Basin. Figure 5(b) showsthe correlations between the EBRO SPI and the SPI fromthe two low resolution datasets at the time scales of 3and 12 months for January and July. These months cor-respond to the coldest (January) and warmest (July) in thestudy area. In both months, lower correlations are foundin the northwest part of the study area, mainly at thelongest SPI time scales (12 months). Nevertheless, the
Figure 5. Correlations of SPI series between the different datasets for the period 1974–2005. (a) for the entire series, on different time scales,(b) for January and July series on 3- and 12 month time scales. This figure is available in colour online at wileyonlinelibrary.com/journal/joc
Copyright 2012 Royal Meteorological Society Int. J. Climatol. (2012)
ASSESSING DROUGHT DATASETS FOR IDENTIFYING DROUGHT SEVERITY AND IMPACTS
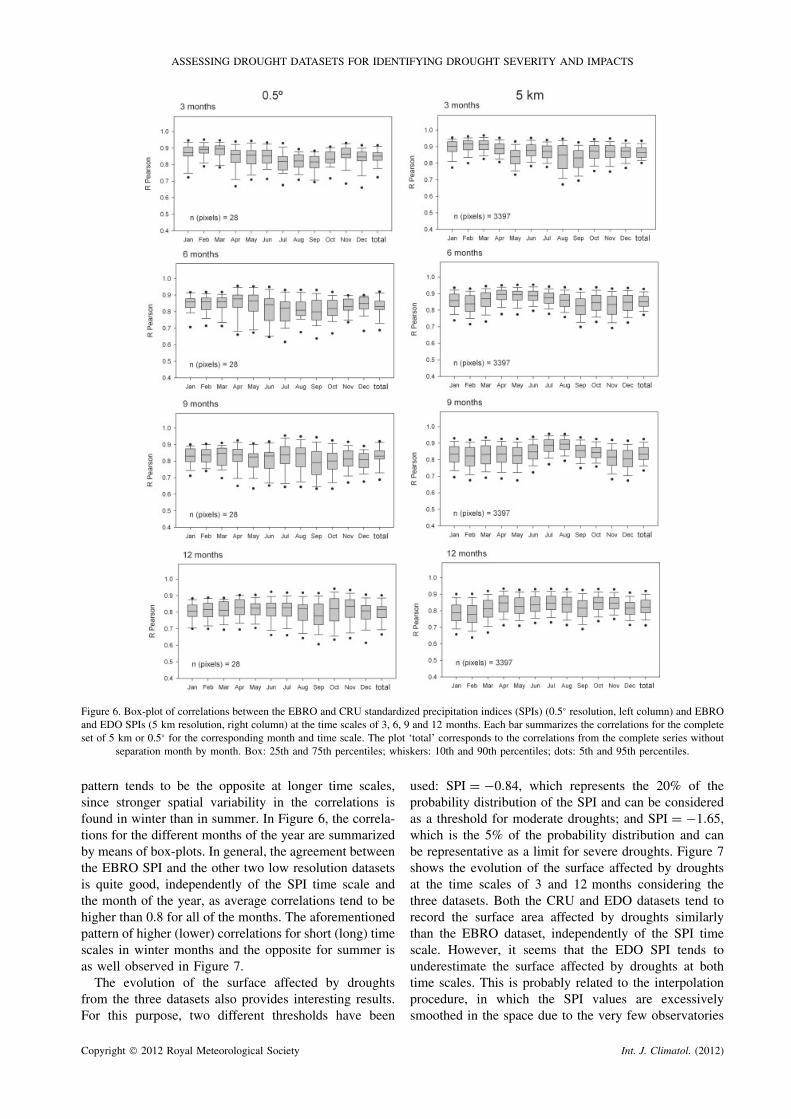
Figure 6. Box-plot of correlations between the EBRO and CRU standardized precipitation indices (SPIs) (0.5° resolution, left column) and EBROand EDO SPIs (5 km resolution, right column) at the time scales of 3, 6, 9 and 12 months. Each bar summarizes the correlations for the completeset of 5 km or 0.5° for the corresponding month and time scale. The plot ‘total’ corresponds to the correlations from the complete series without
separation month by month. Box: 25th and 75th percentiles; whiskers: 10th and 90th percentiles; dots: 5th and 95th percentiles.
pattern tends to be the opposite at longer time scales,since stronger spatial variability in the correlations isfound in winter than in summer. In Figure 6, the correla-tions for the different months of the year are summarizedby means of box-plots. In general, the agreement betweenthe EBRO SPI and the other two low resolution datasetsis quite good, independently of the SPI time scale andthe month of the year, as average correlations tend to behigher than 0.8 for all of the months. The aforementionedpattern of higher (lower) correlations for short (long) timescales in winter months and the opposite for summer isas well observed in Figure 7.
The evolution of the surface affected by droughtsfrom the three datasets also provides interesting results.For this purpose, two different thresholds have been
used: SPI = −0.84, which represents the 20% of theprobability distribution of the SPI and can be consideredas a threshold for moderate droughts; and SPI = −1.65,which is the 5% of the probability distribution and canbe representative as a limit for severe droughts. Figure 7shows the evolution of the surface affected by droughtsat the time scales of 3 and 12 months considering thethree datasets. Both the CRU and EDO datasets tend torecord the surface area affected by droughts similarlythan the EBRO dataset, independently of the SPI timescale. However, it seems that the EDO SPI tends tounderestimate the surface affected by droughts at bothtime scales. This is probably related to the interpolationprocedure, in which the SPI values are excessivelysmoothed in the space due to the very few observatories
Copyright 2012 Royal Meteorological Society Int. J. Climatol. (2012)
E. MORAN-TEJEDA et al.
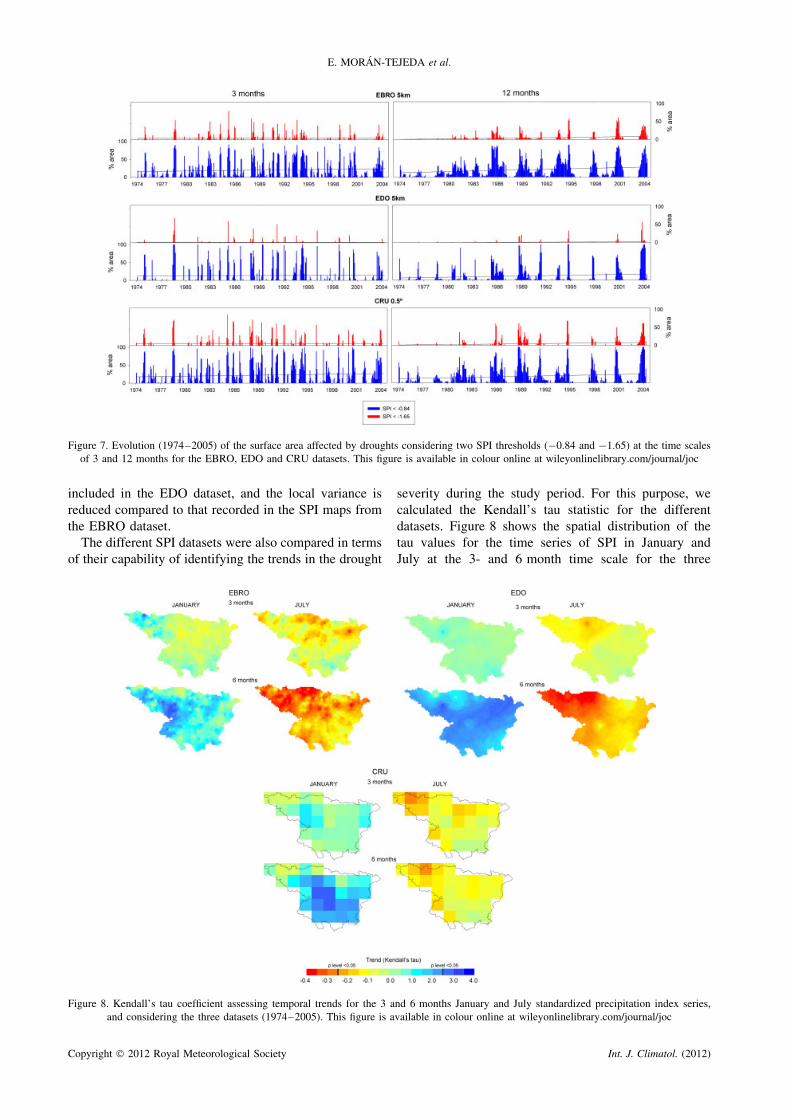
Figure 7. Evolution (1974–2005) of the surface area affected by droughts considering two SPI thresholds (−0.84 and −1.65) at the time scalesof 3 and 12 months for the EBRO, EDO and CRU datasets. This figure is available in colour online at wileyonlinelibrary.com/journal/joc
included in the EDO dataset, and the local variance isreduced compared to that recorded in the SPI maps fromthe EBRO dataset.
The different SPI datasets were also compared in termsof their capability of identifying the trends in the drought
severity during the study period. For this purpose, wecalculated the Kendall’s tau statistic for the differentdatasets. Figure 8 shows the spatial distribution of thetau values for the time series of SPI in January andJuly at the 3- and 6 month time scale for the three
Figure 8. Kendall’s tau coefficient assessing temporal trends for the 3 and 6 months January and July standardized precipitation index series,and considering the three datasets (1974–2005). This figure is available in colour online at wileyonlinelibrary.com/journal/joc
Copyright 2012 Royal Meteorological Society Int. J. Climatol. (2012)
ASSESSING DROUGHT DATASETS FOR IDENTIFYING DROUGHT SEVERITY AND IMPACTS
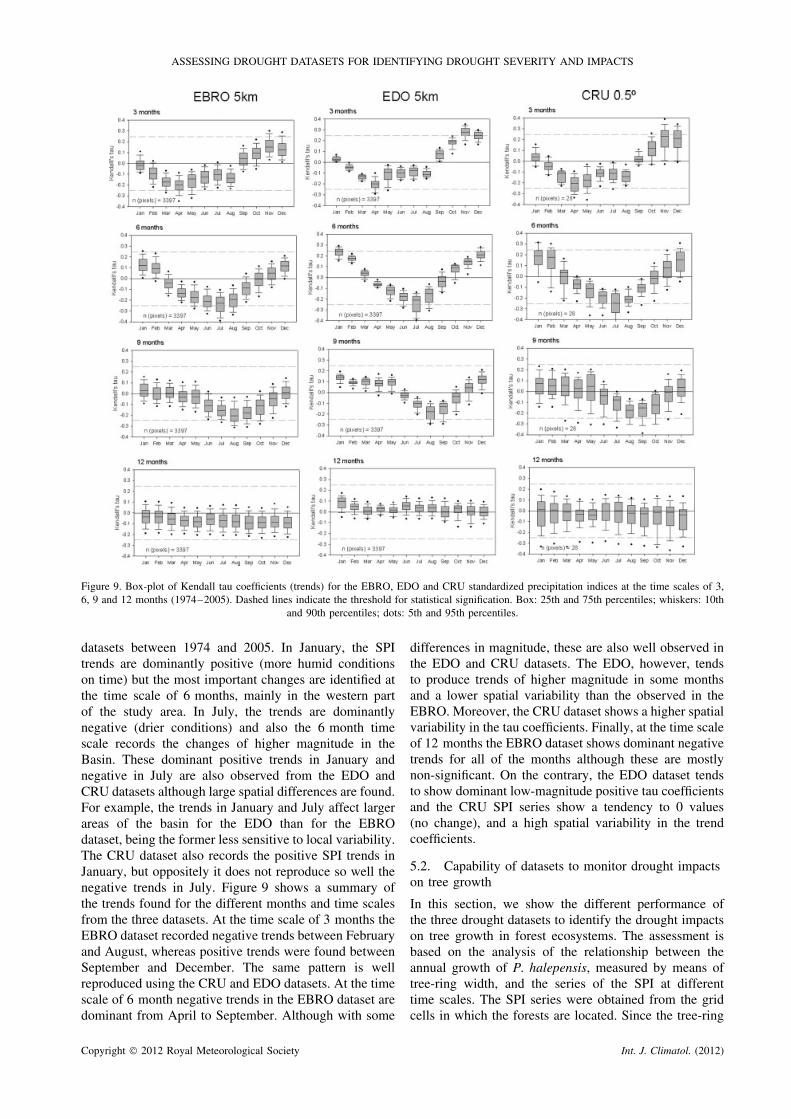
Figure 9. Box-plot of Kendall tau coefficients (trends) for the EBRO, EDO and CRU standardized precipitation indices at the time scales of 3,6, 9 and 12 months (1974–2005). Dashed lines indicate the threshold for statistical signification. Box: 25th and 75th percentiles; whiskers: 10th
and 90th percentiles; dots: 5th and 95th percentiles.
datasets between 1974 and 2005. In January, the SPItrends are dominantly positive (more humid conditionson time) but the most important changes are identified atthe time scale of 6 months, mainly in the western partof the study area. In July, the trends are dominantlynegative (drier conditions) and also the 6 month timescale records the changes of higher magnitude in theBasin. These dominant positive trends in January andnegative in July are also observed from the EDO andCRU datasets although large spatial differences are found.For example, the trends in January and July affect largerareas of the basin for the EDO than for the EBROdataset, being the former less sensitive to local variability.The CRU dataset also records the positive SPI trends inJanuary, but oppositely it does not reproduce so well thenegative trends in July. Figure 9 shows a summary ofthe trends found for the different months and time scalesfrom the three datasets. At the time scale of 3 months theEBRO dataset recorded negative trends between Februaryand August, whereas positive trends were found betweenSeptember and December. The same pattern is wellreproduced using the CRU and EDO datasets. At the timescale of 6 month negative trends in the EBRO dataset aredominant from April to September. Although with some
differences in magnitude, these are also well observed inthe EDO and CRU datasets. The EDO, however, tendsto produce trends of higher magnitude in some monthsand a lower spatial variability than the observed in theEBRO. Moreover, the CRU dataset shows a higher spatialvariability in the tau coefficients. Finally, at the time scaleof 12 months the EBRO dataset shows dominant negativetrends for all of the months although these are mostlynon-significant. On the contrary, the EDO dataset tendsto show dominant low-magnitude positive tau coefficientsand the CRU SPI series show a tendency to 0 values(no change), and a high spatial variability in the trendcoefficients.
5.2. Capability of datasets to monitor drought impactson tree growth
In this section, we show the different performance ofthe three drought datasets to identify the drought impactson tree growth in forest ecosystems. The assessment isbased on the analysis of the relationship between theannual growth of P. halepensis, measured by means oftree-ring width, and the series of the SPI at differenttime scales. The SPI series were obtained from the gridcells in which the forests are located. Since the tree-ring
Copyright 2012 Royal Meteorological Society Int. J. Climatol. (2012)
E. MORAN-TEJEDA et al.
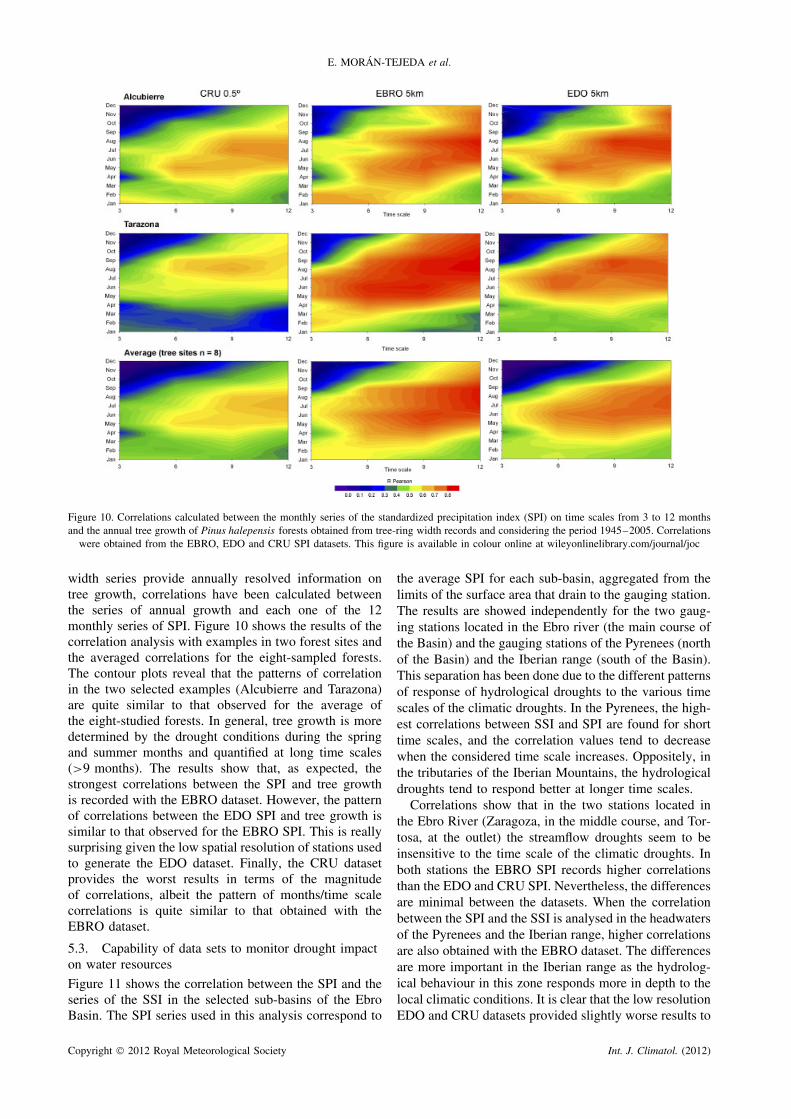
Figure 10. Correlations calculated between the monthly series of the standardized precipitation index (SPI) on time scales from 3 to 12 monthsand the annual tree growth of Pinus halepensis forests obtained from tree-ring width records and considering the period 1945–2005. Correlations
were obtained from the EBRO, EDO and CRU SPI datasets. This figure is available in colour online at wileyonlinelibrary.com/journal/joc
width series provide annually resolved information ontree growth, correlations have been calculated betweenthe series of annual growth and each one of the 12monthly series of SPI. Figure 10 shows the results of thecorrelation analysis with examples in two forest sites andthe averaged correlations for the eight-sampled forests.The contour plots reveal that the patterns of correlationin the two selected examples (Alcubierre and Tarazona)are quite similar to that observed for the average ofthe eight-studied forests. In general, tree growth is moredetermined by the drought conditions during the springand summer months and quantified at long time scales(>9 months). The results show that, as expected, thestrongest correlations between the SPI and tree growthis recorded with the EBRO dataset. However, the patternof correlations between the EDO SPI and tree growth issimilar to that observed for the EBRO SPI. This is reallysurprising given the low spatial resolution of stations usedto generate the EDO dataset. Finally, the CRU datasetprovides the worst results in terms of the magnitudeof correlations, albeit the pattern of months/time scalecorrelations is quite similar to that obtained with theEBRO dataset.
5.3. Capability of data sets to monitor drought impacton water resources
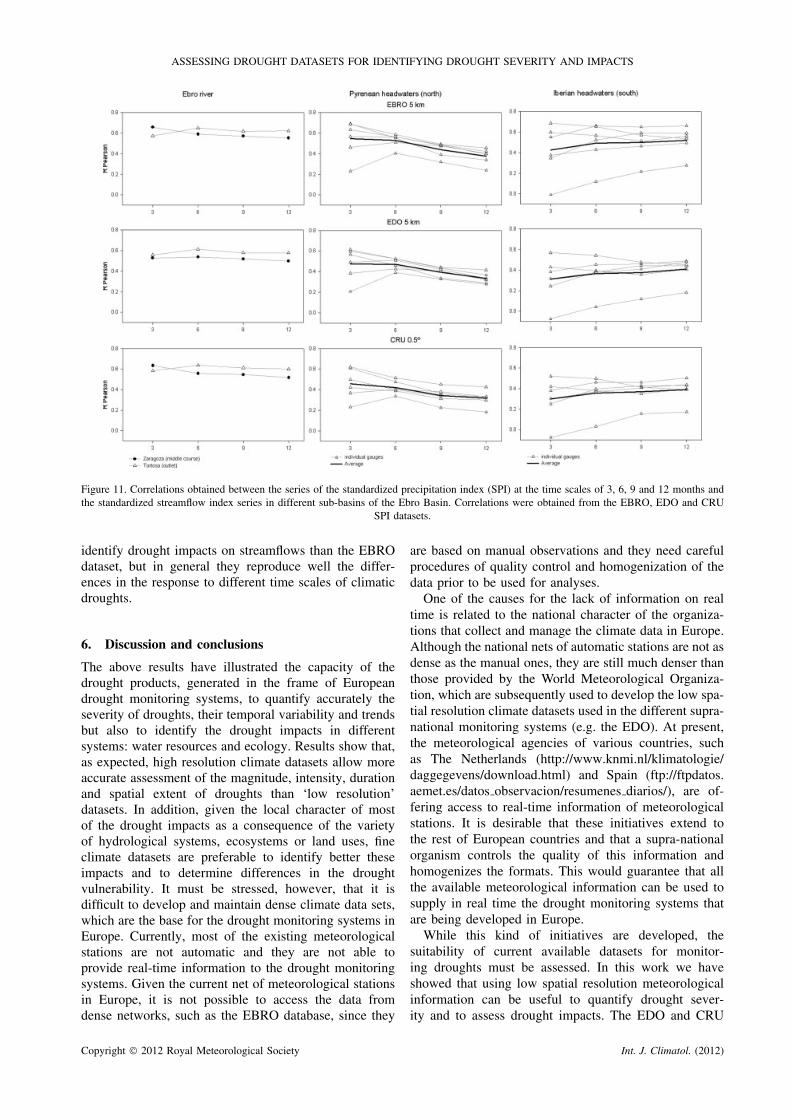
Figure 11 shows the correlation between the SPI and theseries of the SSI in the selected sub-basins of the EbroBasin. The SPI series used in this analysis correspond to
the average SPI for each sub-basin, aggregated from thelimits of the surface area that drain to the gauging station.The results are showed independently for the two gaug-ing stations located in the Ebro river (the main course ofthe Basin) and the gauging stations of the Pyrenees (northof the Basin) and the Iberian range (south of the Basin).This separation has been done due to the different patternsof response of hydrological droughts to the various timescales of the climatic droughts. In the Pyrenees, the high-est correlations between SSI and SPI are found for shorttime scales, and the correlation values tend to decreasewhen the considered time scale increases. Oppositely, inthe tributaries of the Iberian Mountains, the hydrologicaldroughts tend to respond better at longer time scales.
Correlations show that in the two stations located inthe Ebro River (Zaragoza, in the middle course, and Tor-tosa, at the outlet) the streamflow droughts seem to beinsensitive to the time scale of the climatic droughts. Inboth stations the EBRO SPI records higher correlationsthan the EDO and CRU SPI. Nevertheless, the differencesare minimal between the datasets. When the correlationbetween the SPI and the SSI is analysed in the headwatersof the Pyrenees and the Iberian range, higher correlationsare also obtained with the EBRO dataset. The differencesare more important in the Iberian range as the hydrolog-ical behaviour in this zone responds more in depth to thelocal climatic conditions. It is clear that the low resolutionEDO and CRU datasets provided slightly worse results to
Copyright 2012 Royal Meteorological Society Int. J. Climatol. (2012)
ASSESSING DROUGHT DATASETS FOR IDENTIFYING DROUGHT SEVERITY AND IMPACTS
Figure 11. Correlations obtained between the series of the standardized precipitation index (SPI) at the time scales of 3, 6, 9 and 12 months andthe standardized streamflow index series in different sub-basins of the Ebro Basin. Correlations were obtained from the EBRO, EDO and CRU
SPI datasets.
identify drought impacts on streamflows than the EBROdataset, but in general they reproduce well the differ-ences in the response to different time scales of climaticdroughts.
6. Discussion and conclusions
The above results have illustrated the capacity of thedrought products, generated in the frame of Europeandrought monitoring systems, to quantify accurately theseverity of droughts, their temporal variability and trendsbut also to identify the drought impacts in differentsystems: water resources and ecology. Results show that,as expected, high resolution climate datasets allow moreaccurate assessment of the magnitude, intensity, durationand spatial extent of droughts than ‘low resolution’datasets. In addition, given the local character of mostof the drought impacts as a consequence of the varietyof hydrological systems, ecosystems or land uses, fineclimate datasets are preferable to identify better theseimpacts and to determine differences in the droughtvulnerability. It must be stressed, however, that it isdifficult to develop and maintain dense climate data sets,which are the base for the drought monitoring systems inEurope. Currently, most of the existing meteorologicalstations are not automatic and they are not able toprovide real-time information to the drought monitoringsystems. Given the current net of meteorological stationsin Europe, it is not possible to access the data fromdense networks, such as the EBRO database, since they
are based on manual observations and they need carefulprocedures of quality control and homogenization of thedata prior to be used for analyses.
One of the causes for the lack of information on realtime is related to the national character of the organiza-tions that collect and manage the climate data in Europe.Although the national nets of automatic stations are not asdense as the manual ones, they are still much denser thanthose provided by the World Meteorological Organiza-tion, which are subsequently used to develop the low spa-tial resolution climate datasets used in the different supra-national monitoring systems (e.g. the EDO). At present,the meteorological agencies of various countries, suchas The Netherlands (http://www.knmi.nl/klimatologie/daggegevens/download.html) and Spain (ftp://ftpdatos.aemet.es/datos observacion/resumenes diarios/), are of-fering access to real-time information of meteorologicalstations. It is desirable that these initiatives extend tothe rest of European countries and that a supra-nationalorganism controls the quality of this information andhomogenizes the formats. This would guarantee that allthe available meteorological information can be used tosupply in real time the drought monitoring systems thatare being developed in Europe.
While this kind of initiatives are developed, thesuitability of current available datasets for monitor-ing droughts must be assessed. In this work we haveshowed that using low spatial resolution meteorologicalinformation can be useful to quantify drought sever-ity and to assess drought impacts. The EDO and CRU
Copyright 2012 Royal Meteorological Society Int. J. Climatol. (2012)
E. MORAN-TEJEDA et al.
datasets failed mainly in detecting the spatial patternsof the specific drought episodes. This was expectable,given the high spatial variability of precipitation in theregion and the low density of stations (or grids) used tobuild the databases. The correlation between the low res-olution (EDO and CRU) datasets and the EBRO datasettend to be lower in summer than in winter months. Itis interesting to interpret these differences as a functionof the diverse meteorological factors that drive the cli-mate of the region in the different seasons of the year.In winter, the precipitation is usually related to polardepressions and associated fronts that cross the IberianPeninsula. In summer, the Azores high is usually in itsnorthernmost position blocking the entrance of Atlanticair masses, and most precipitation is associated to convec-tive phenomena, thus dependent on local factors such astopography. The spatial variability of precipitation tendsto be higher, therefore, in summer than in winter months.This would explain the stronger spatial differences foundin the 3 month SPI for the series of July regarding Jan-uary. Therefore, when short SPI time scales are used tomonitor drought conditions in the Ebro Basin, the spatialdensity of observations is more critical in summer thanin winter months. The opposite pattern was observed forlong time scales, this is, lower correlation in winter thanin summer months. This is because the SPI values in win-ter for long time scales (6–9 months) are mainly drivenby the precipitation events recorded in the previous sum-mer and autumn and the events that drive the long timescale SPI in July are recorded in winter. For example,the magnitude of the 6 month or the 9 month SPI in Julywill mainly depend on the winter and spring precipita-tion, which are less spatially variable than the summerand autumn precipitation.
In spite of the lower level of resemblance for summermonths and long time scales, the correlations betweendatasets are rather high. This result suggests the useful-ness of the two low resolution datasets for detecting both,severity and temporal variability of droughts. The resultsshowed that the EDO and CRU databases reproduce quiteaccurately the temporal variability of the SPI, but theEDO fails to identify the main drought episodes affectingthe region as a consequence of the excessive smoothingof the interpolated maps, especially at long time scales.Nevertheless, they allow identifying the main featuresof the drought changes (trends), which is of particularrelevance in the frame of the current climate change sce-narios, which in general project more frequent and intensedroughts throughout the 21st century in southern Europe(Meehl et al, 2007; Giorgi and Lionello, 2008). Similarlyto drought intensity, the EDO and CRU datasets are lesssensitive to local variability in the detection of trendscompared to the reference dataset.
Finally, the potential of different datasets for identi-fying drought impacts was examined as well. The twoselected systems, water resources and forests, are crit-ical in drought-prone regions, such as the Ebro Basin.Lopez-Moreno et al. (2011) demonstrated a generalizeddecrease of streamflows in the majority of the rivers in
the Basin during the second half of the 20th century,which is representative of the decrease of water resourcesin other Iberian basins (Moran-Tejeda et al., 2011b) andother Circum-Mediterranean areas (Kahya et al. 2004;Lespinas et al., 2010; Mavromatis and Stathis, 2011).Moreover, the projections for future availability of waterresources depict a decrease of at least 20% by the endof the present century in the Mediterranean Basin (IPCC,2007). This alerts about the necessity of large-scale infor-mation on the probable evolution of water resources inrelation with drought occurrence. The studied datasetsprovide evidence of a high resemblance between the vari-ability of SPI and SSI, which indicates the suitability ofusing real-time climatic information for preparedness andmitigation of drought consequences over the availabilityof water resources. However, some differences betweendatasets are observed in relation to the spatial scale of thestudied catchments. In the stations located along the EbroRiver, the differences between the three datasets for iden-tifying drought impacts are minimal. Therefore, when thedrought indices are aggregated at low spatial scales (largebasins) the spatial resolution of the climatic dataset is nota limiting factor for relating streamflow and drought vari-ability. On the contrary, when small basins located in theheadwaters are analysed, the spatial resolution of the cli-mate datasets is logically more critical since the scale ismore local. When the correlation between the SPI andthe SSI is analysed in the headwaters of the Pyreneesand the Iberian range, the EBRO dataset performs betterthan the two low resolution datasets. However, the EDOand CRU datasets are able of reproducing acceptably thepatterns of change of correlation between SPI and SSIas a function of the considered time scale. Thus, in thePyrenean headwaters the three datasets record higher cor-relations at low time scales and values tend to decreasewith increasing time scale. On the contrary, in the Iberianheadwaters, correlations are higher for long time scales,and this is as well reproduced similarly by the threedatasets. The differences in the response times of stream-flows to precipitation between the Pyrenees headwatersand the Iberian headwaters can be explained by naturaland human-induced factors. On the one hand because ofthe different lithology that dominates in the two moun-tain ranges. While in the Pyrenees, the varied lithologyinduce a rapid response of the hydrological system to theclimatic inputs, in the Iberian range the dominant lime-stones determine a higher temporal inertia in the riverflows. Limestone substrates facilitate the free drain ofwater from precipitation straight to the aquifers, givingto a lagged response of runoff (Soulsby et al., 2010).Thus, the response of streamflows to precipitation deficitsor droughts is observed for the longest temporal scales.Differing response of streamflows to precipitation due tocontrasted lithology has also been observed between otherSpanish mountain, the Cantabrian Range and the CentralSystem (Moran-Tejeda et al., 2011a). On the other hand,some rivers of the Pyrenees and the Iberian mountainsare regulated for irrigation, hydropower, or for managing
Copyright 2012 Royal Meteorological Society Int. J. Climatol. (2012)
ASSESSING DROUGHT DATASETS FOR IDENTIFYING DROUGHT SEVERITY AND IMPACTS
floods and droughts. The different patterns of manage-ment of reservoirs may be responsible as well for theobserved differences in the response times of stream-flows to SPI. (Vicente-Serrano and Lopez-Moreno, 2005;Lorenzo-Lacruz et al., 2010).
The impact of droughts on forests is of wide interest.Pasho et al. (2011) recently demonstrated the suitabilityof multi-scalar drought indices, such as the SPI, tomonitor impacts of droughts on tree growth, given thedifferent response of tree species or habitats to waterdeficit. The correlations between tree-rings width and SPIreach maximum values at the longest time scales for theP. halepensis indicating that tree growth is limited bythe accumulated drought conditions of the previous year.At the monthly basis, the moisture conditions of spring(when the rates of radial growth are maximum; Pashoet al. 2011) and summer months are the most importantin constraining the growth of trees. These two featuresare reproduced by the three datasets, although the EBROreference displays the strongest correlations between tree-ring width and SPI. At this respect, it is relevant tostress that the EDO performs notably better than the CRUdataset, which hardly reaches values of correlation of 0.6between the tree growth and SPI series.
In general, it is observed that the drought impactsand the drought vulnerability of the different sub-systemsare better identified using drought information at a highspatial resolution but the low resolution datasets alsoprovide reliable outputs in terms of understanding multi-source impacts. Further research would be desirable toassess the capability of these datasets for reproducingthe vulnerability of other water-dependent systems suchas those related to agriculture and tourism, given itsimplications for socio-economic development, especiallyin regions where water is a strategic resource, such as theMediterranean Basin.
The variety of users of the real-time drought infor-mation demand the best information as is possible. Atpresent the drought monitoring systems are not usingthe best available information but the current providedinformation is good for most of the management andscientific purposes. Therefore, the main recommenda-tion that may be inferred from the above analyses isthat drought monitoring systems must provide droughtinformation based on the available climatic informa-tion, independently of the spatial scale at which thedata is available. In addition, efforts must be conductedto improve the access to the available climatic infor-mation at real time in Europe to improve monitor-ing systems that allow taking more realistic decisionsand more efficient drought preparedness and mitiga-tion of the drought impacts. In this sense, the initia-tive of developing a Pan-EDO (Niemeyer et al., 2009;http://edo.jrc.ec.europa.eu/php/index.php?action=view&id=201) using different spatial resolution datasetsseems to be a very useful tool to access real-time informa-tion about the drought severity on different spatial levelsand time scales.
Acknowledgements
This work has been supported by the research projectsCGL2008-01189/BTE, CGL2011-27574-CO2-02 andCGL2011-27536 financed by the Spanish Commissionof Science and Technology and FEDER, EUROGEOSS(FP7-ENV-2008-1-226487) and ACQWA (FP7-ENV-2007-1-212250) financed by the VII Framework Pro-gramme of the European Commission, ‘Efecto de losescenarios de cambio climatico sobre la hidrologıa super-ficial y la gestion de embalses del Pirineo Aragones’financed by ‘Obra Social La Caixa’ and the Aragon Gov-ernment and Influencia del cambio climatico en el turismode nieve, CTTP01/10, Financed by the Comision de Tra-bajo de los Pirineos.
ReferencesBurton I, Kates RW, White G.F. 1978. The environment as hazard.
Oxford University Press: New York, 240 pp.Carbone GJ, Rhee J, Mizzell HP, Boyles R. 2008. Decision support: a
regional-scale drought monitoring tool for the Carolinas. Bulletin ofthe American Meteorological Society 89: 20–28.
Fritts HC. 1976. Tree Rings and Climate. Academic Press: New York.Giorgi F, Lionello P. 2008. Climate change projections for the
Mediterranean region. Global and Planetary Change 63: 90–104.Goddard L, Mason S, Zebiak SE, Ropelewski CF, Basher R, Cane
MA. 2001. Current approaches to seasonal-to-interannual climatepredictions. International Journal of Climatology 21: 1111–1152.
Gonzalez-Hidalgo JC, Brunetti M, De Luis M. 2011. A new toolfor monthly precipitation analysis in Spain: MOPREDAS database(Monthly precipitation trends December 1945–November 2005).International Journal of Climatology 31: 715–731.
Haylock M, Hofstra N, Klein-Tank A, Klok EJ, Jones P, NewM. 2008. A European daily high-resolution gridded data set ofsurface temperature and precipitation for 1950–2006. Journal ofGeophysical Research 113(D20): 119.
Heim RR. 2002. A review of twentieth-century drought indices used inthe United States. Bulletin of the American Meteorological Society83: 1149–1165.
Herrera S, Gutierrez JM, Ancell R, Pons MR, Frıas MD, Fernandez J.2012. Development and analysis of a 50 year high-resolution dailygridded precipitation dataset over Spain (Spain02). InternationalJournal of Climatology 32: 74–85, DOI: 10.1002/joc.2256.
Hofstra N, New M, McSweeney C. 2010. The influence of interpolationand station network density on the distributions and trends of climatevariables in gridded daily data. Climate Dynamics 35(5): 842–858.
IPCC. 2007. Climate Change 2007: Synthesis Report, Pachauri RK,Reisinger A (eds). IPCC: Geneva, Switzerland, 104. pp. Contributionof Working Groups I, II and III to the Fourth Assessment Report ofthe Intergovernmental Panel on Climate Change.
Jeffrey SJ, Carter JO, Moodie KB, Beswick AR. 2001. Using spatialinterpolation to construct a comprehensive archive of Australianclimate data. Environmental Modelling & Software 16: 309–330.
Kahya E, Kalayci S. 2004. Trend analysis of streamflow in Turkey.Journal of Hydrology 289: 128–144.
Kendall MG. 1975. Kendall Rank Correlation Methods, Griffin:London.
Lespinas F, Ludwig W, Heussner S. 2010. Impact of recent climatechange on the hydrology of coastal Mediterranean rivers in SouthernFrance. Climatic Change 99: 425–456.
Lopez-Moreno JI, Vicente-Serrano SM. 2008. Positive and negativephases of the wintertime North Atlantic Oscillation and droughtoccurrence over Europe: a multi-temporal-scale approach. Journalof Climate 21: 1220–1243.
Lopez-Moreno JI, Vicente-Serrano SM, Moran-Tejeda E, Zabalza J,Lorenzo-Lacruz J, Garcıa-Ruiz JM. 2011. Impact of climateevolution and land use changes on water yield in the ebro basin.Hydrology and Earth System Sciences 15: 311–322.
Lorenzo-Lacruz J, Vicente-Serrano SM, Lopez-Moreno JI, BeguerıaS, Garcıa-Ruiz JM, Cuadrat JM. 2010. The impact of droughtsand water management on various hydrological systems in theheadwaters of the Tagus River (central Spain). Journal of Hydrology386: 13–26.
Copyright 2012 Royal Meteorological Society Int. J. Climatol. (2012)
E. MORAN-TEJEDA et al.
Mann HB. 1945. Non parametric test against trend. Econometrica 13:245–259.
Mavromatis T, Stathis D. 2011. Response of the water balance inGreece to temperature. Theoretical and Applied Climatology 104:23–34.
McKee TBN, Doesken J, Kleist J. 1993. The relationship ofdrought frequency and duration to time scales. Eight Conferenceon Applied Climatology. Anaheim, CA, American MeteorologicalSociety 179–184.
Meehl GA Stocker TF Collins WD Friedlingstein P Gaye AT GregoryJM Kitoh A Knutti R Murphy JM Noda A Raper SCB Watterson IGWeaver AJ Zhao Z-C 2007. Global climate projections. In ClimateChange 2007: The Physical Science Basis Contribution of WorkingGroup I to the Fourth Assessment Report of the IntergovernmentalPanel on Climate Change. Solomon S, Qin D, Manning M, Chen Z,Marquis M, Averyt KB, Tignor M, Miller HL (eds). 2007 CambridgeUniversity Press: Cambridge and New York.
Mishra AK, Singh VP 2010. A review of drought concepts. Journal ofHydrology 391: 202–216.
Mitasova H, Mitas L, 1993. Interpolation by regularized spline withtension. Mathematical Geology 25: 641–655.
Mitchell TD, Jones PD. 2005. An improved method of constructinga database of monthly climate observations and associated high-resolution grids. International Journal of Climatology 25: 693–712.
Moran-Tejeda E, Lopez-Moreno JI, Ceballos-Barbancho A, Vicente-Serrano SM. 2011a. Evaluating Duero’s basin (Spain) response to theNAO phases: spatial and seasonal variability. Hydrological Processes25: 1313–1326, DOI: 10.1002/hyp.7907.
Moran-Tejeda E, Lopez-Moreno JI, Ceballos-Barbancho A, Vicente-Serrano SM. 2011b. River regimes and recent hydrological changesin the Duero Basin (Spain). Journal of Hydrology 404: 241–258,DOI: 10.1016/j.jhydrol.2011.04.034.
Niemeyer A, de Jager B, Kurnik G, Laguardia D, Magni O, NitchevaS, Rossi C, Weissteiner. 2009. Current state of development of theEuropean Drought Observatory Geophysical Research Abstracts Vol.11, EGU2009-12802.
Pasho E, Julio Camarero J, de Luis M, Vicente-Serrano SM. 2011.Impacts of drought at different time scales on forest growth acrossa wide climatic gradient in north-eastern Spain. Agricultural andForest Meteorology 151: 1800–1811.
Perry M, Hollis D. 2005. The generation of monthly gridded datasetsfor a range of climatic variables over the UK. International Journalof Climatology 25(8): 1041–1054.
Phillips DL, Dolph J, Marks D. 1992. A comparison of geostatisticalprocedures for spatial analysis of precipitation in mountainousterrain. Agricultural and Forest Meteorology 58: 119–141.
Sivakumar MVK, Motha RP, Wilhite DA, Wood DA (eds) 2010.Agricultural Drought Indices: Proceedings of an Expert Meeting2–4 June 2010, Murcia, Spain, 219 pp. World MeteorologicalOrganization, Geneva, Switzerland.
Soulsby C, Tetzlaff D, Hrachowitz M. 2010. Are transit timesuseful process-based tools for flow prediction and classification inungauged basins in montane regions? Hydrological Processes 24:1685–1696.
Svoboda M, Lecomte D, Hayes M, Heim R, Gleason K, Angel J,Rippey B, Tinker R, Palecki M, Stooksbury D, Miskus D,Stephens S. 2002. The drought monitor. Bulletin of the AmericanMeteorological Society 83: 1181–1190.
Trenberth KE. 1997. Short-term climate variations: recent accomplish-ments and issues for future progress. Bulletin of the American Mete-orological Society 78: 1081–1096.
Vicente-Serrano SM. 2007. Evaluating the impact of drought usingremote sensing in a Mediterranean, semi-arid region. NaturalHazards 40: 173–208.
Vicente-Serrano SM. 2005. Las sequıas climaticas en el valle mediodel Ebro: Factores atmosfericos, evolucion temporal y variabilidadespacial Consejo de Proteccion de la Naturaleza de Aragon.277 pp.
Vicente-Serrano SM. 2006. Differences in spatial patterns of droughton different time scales: an analysis of the Iberian Peninsula. WaterResources Management 20: 37–60.
Vicente-Serrano S Lopez-Moreno JI. 2005. Hydrological response todifferent time scales of climatological drought: an evaluation ofthe standardized precipitation index. Hydrology and Earth SystemSciences 9: 523–533.
Vicente Serrano SM, Saz MA, Cuadrat JM. 2003. Comparativeanalysis of interpolation methods in the middle Ebro valley(Spain): application to annual precipitation and temperature. ClimateResearch 24: 161–180.
Vicente-Serrano SM, Cuadrat JM. Romo A. 2006. Early predictionof crop productions using drought indices at different time scalesand remote sensing data: application in the Ebro valley (North-eastSpain). International Journal of Remote Sensing 27: 511–518.
Vicente-Serrano SM, Lopez-Moreno JI, Beguerıa S, Lorenzo-Lacruz J,Azorin-Molina C, Moran-Tejeda E. 2011. Accurate computation of astreamflow drought index. Journal of Hydrologic Engineering 17(2):318–332, DOI: 10.1061/(ASCE)HE.1943–5584.0000433.
Wilhite DA. 1993. Drought Assessment, Management and Planning:Theory and Case Studies. Kluwer: Boston.
Wilhite DA. 1996. A methodology for drought preparedness. NaturalHazards 13: 229–252.
Wilhite DA. 2002. Combating drought through preparedness. NaturalResources Forum 26: 275–285.
Wilhite DA, Svoboda MD. 2000. Drought early warning systems in thecontext of drought preparedness and mitigation. In Early WarningSystems for Drought Preparedness and Drought Management. WorldMeteorological Organization: Lisboa, 1–21.
Yue S, Pilon P, Cavadias G. 2002. Power of the Mann-Kendall andSpearman’s rho tests for detecting monotonic trends in hydrologicalseries. Journal of Hydrology 259: 254–271.
Copyright 2012 Royal Meteorological Society Int. J. Climatol. (2012)