assessing scoring functions for protein−ligand interactions
TRANSCRIPT

Assessing Scoring Functions for Protein-Ligand Interactions
Philippe Ferrara,†,§ Holger Gohlke,†,§ Daniel J. Price,† Gerhard Klebe,‡ and Charles L. Brooks III*,†
Department of Molecular Biology (TPC6), The Scripps Research Institute, 10550 North Torrey Pines Road,La Jolla, California 92037, and Institut fur Pharmazeutische Chemie, Philipps-Universitat Marburg,Marbacher Weg 6, D-35032 Marburg, Germany
Received October 1, 2003
An assessment of nine scoring functions commonly applied in docking using a set of 189 protein-ligand complexes is presented. The scoring functions include the CHARMm potential, the scoringfunction DrugScore, the scoring function used in AutoDock, the three scoring functionsimplemented in DOCK, as well as three scoring functions implemented in the CScore modulein SYBYL (PMF, Gold, ChemScore). We evaluated the abilities of these scoring functions torecognize near-native configurations among a set of decoys and to rank binding affinities.Binding site decoys were generated by molecular dynamics with restraints. To investigatewhether the scoring functions can also be applied for binding site detection, decoys on theprotein surface were generated. The influence of the assignment of protonation states wasprobed by either assigning “standard” protonation states to binding site residues or adjustingprotonation states according to experimental evidence. The role of solvation models inconjunction with CHARMm was explored in detail. These include a distance-dependent dielectricfunction, a generalized Born model, and the Poisson equation. We evaluated the effect of usinga rigid receptor on the outcome of docking by generating all-pairs decoys (“cross-decoys”) forsix trypsin and seven HIV-1 protease complexes. The scoring functions perform well todiscriminate near-native from misdocked conformations, with CHARMm, DOCK-energy,DrugScore, ChemScore, and AutoDock yielding recognition rates of around 80%. Significantdegradation in performance is observed in going from decoy to cross-decoy recognition forCHARMm in the case of HIV-1 protease, whereas DrugScore and ChemScore, as well asCHARMm in the case of trypsin, show only small deterioration. In contrast, the prediction ofbinding affinities remains problematic for all of the scoring functions. ChemScore gives thehighest correlation value with R2 ) 0.51 for the set of 189 complexes and R2 ) 0.43 for the setof 116 complexes that does not contain any of the complexes used to calibrate this scoringfunction. Neither a more accurate treatment of solvation nor a more sophisticated charge modelfor zinc improves the quality of the results. Improved modeling of the protonation states,however, leads to a better prediction of binding affinities in the case of the generalized Bornand the Poisson continuum models used in conjunction with the CHARMm force field.
1. Introduction
Molecular recognition is a problem of fundamentalimportance in biology. An understanding of its prin-ciples would result in a more efficient application ofmedicinal chemistry. In particular, it is important fordrug discovery to capture the physical principles re-sponsible for the recognition of a drug by its proteintarget. The ever growing amount of structural informa-tion makes computer-aided structure-based ligand de-sign methods a useful alternative strategy to experi-mental high-throughput screening to find novel leadsin a drug development program.1
Computer-aided structure-based methods are aimedat predicting the binding mode of a ligand in the bindingsite of a protein or any molecular target and at obtainingan estimate of the binding affinity. These methodsinvolve two computational steps: docking and scoring.
In the docking step, multiple protein-ligand configura-tions, called poses, are generated. Several current dock-ing programs have the ability to generate poses closeto the native structure (usually an rmsd of e2 Å isaccepted as close) in many cases.2-7 Then, a scoringfunction is used to calculate the affinity between thereceptor and the ligand for each pose. There are severalrequirements a useful scoring function should satisfy.First, the poses must be ranked correctly; i.e., those thatresemble most closely the experimental structuresshould score best. In addition, if multiple ligands aredocked, their binding free energies need to be rankedaccurately. In a virtual screening simulation, weakbinders should be distinguished from nonbinders. Fi-nally, a scoring function must be sufficiently fast to beapplied in a docking algorithm. This makes it almostimpossible to use methods that require the generationof a correctly weighted ensemble of conformations toobtain the free energy of binding, although calculationsof binding affinities based on algorithms that identifythe most stable conformations of the free and boundspecies have been reported.8,9 These studies highlight
* To whom correspondence should be addressed. Phone: (1 858) 7848035. Fax: (1 858) 784 8688. E-mail: [email protected].
† The Scripps Research Institute.§ These authors contributed equally.‡ Philipps-Universitat Marburg.
3032 J. Med. Chem. 2004, 47, 3032-3047
10.1021/jm030489h CCC: $27.50 © 2004 American Chemical SocietyPublished on Web 05/04/2004

the important role of the configurational entropy, whichis not explicitly taken into account in calculations usingthe single-structure approach.
Scoring functions can be grouped into three classes:force-field-based, knowledge-based, and empirical scor-ing functions (see refs 10 and 11 for a review). Force-field-based scoring functions apply classical molecularmechanics energy functions. They approximate thebinding free energy of protein-ligand complexes by asum of van der Waals and electrostatic interactions.Solvation is usually taken into account using a distance-dependent dielectric function, although solvent modelsbased on continuum electrostatics have been devel-oped.12,13 Nonpolar contributions are usually assumedto be proportional to the solvent-accessible surface area.A drawback is that the energy landscapes associatedwith force-field potentials are usually rugged, andtherefore, minimization is required prior to any energyevaluation.
Empirical scoring functions estimate the binding freeenergy by summing interaction terms derived fromweighted structural parameters. The weights are ob-tained by fitting the scoring function to experimentalbinding constants of a training set of protein-ligandcomplexes. The archetypical scoring function pioneeredby Bohm consists of five contributions, which representhydrogen bonds, ionic and lipophilic interactions, andthe loss of external and configurational entropy uponbinding.14,15 The main drawback of empirical scoringfunctions is that it is unclear whether they are able topredict the binding affinity of ligands structurallydifferent from those used in the training set.
Knowledge-based scoring functions represent thebinding affinity as a sum of protein-ligand atom pairinteractions. These potentials are derived from theprotein-ligand complexes with known structures, whereprobability distributions of interatomic distances areconverted into distance-dependent interaction free ener-gies of protein-ligand atom pairs using the “inverse”Boltzmann law.16 However, the structures deposited inthe Protein Data Bank (PDB) do not provide a thermo-dynamic ensemble at equilibrium, and therefore, aknowledge-based potential should be considered as astatistical preference rather than a potential of meanforce. A key ingredient of a knowledge-based potentialis the reference state, which determines the weightsbetween the various probability distributions. Recently,several approaches to derive these potentials have beenproposed.17-20 They differ in their definition of thereference state, the protein and ligand atom types, andthe list of protein-ligand complexes from which theywere extracted.
No scoring function performs in a satisfactory way,which led to a pragmatic compromise, the so-calledconsensus scoring approach. Here, several scoring func-tions are combined and only those poses that receivehigh scores by two or more scoring functions areconsidered favorable.21 It was shown that this methodyields a large reduction of false positives when appliedeither to choosing the ligands with the lowest bindingfree energies among a set of ligands or to selecting thebest poses between different docked configurations of aparticular ligand.
Here, we present an assessment of nine scoringfunctions, most of which are implemented in widely useddocking programs. The scoring functions cover the threeclasses described above: CHARMm22 and DOCK-chemical5 represent force-field-based methods; Chem-Score23 and the potentials implemented in GOLD3,24 andAutoDock6,25,26 are empirical scoring functions; Drug-Score20 and PMF19 are knowledge-based potentials.Finally, DOCK-contact counts the number of contactsbetween the ligand and the receptor. The study wasperformed on data from the Ligand-Protein Database(LPDB), which is World Wide Web accessible (http://lpdb.scripps.edu) and comprises 189 protein-ligandcomplexes.27 This data set corresponds to 49 differentreceptors with both high-resolution structure (2.1 Å onaverage) and known experimental binding affinity. Inthis respect, the current study is the most comprehen-sive comparison of scoring functions reported so far.
Several studies analyzing the performance of dockingprograms in combination with various scoring functionshave been reported in the case of virtual screeningapplications.21,28,29 In such a study, the foremost goalis to identify true hits in a database of mainly nonbind-ers. This point is not addressed in this study, but wewere interested in correctly ranking ligands alreadyknown to bind, which is of primary interest in leadoptimization. In addition, to separate the dockingproblem from the scoring problem, nearly 100 decoyshave been constructed for each protein-ligand pairwhose deviations from the crystal structure representa continuous spectrum in the neighborhood of thebinding site. This set was then rescored by all functions.Finally, misdocked structures far from the binding sitewere generated to test whether the scoring functionscan successfully detect binding pockets.27 The presentstudy was motivated by earlier work by Vieth et al. toidentify key features of binding energy landscapesnecessary and sufficient for the development of success-ful docking and scoring algorithms.30,31 We note that astudy similar in spirit has been reported very recentlyby Wang et al. on a data set of 100 complexes, whichassesses 11 scoring functions in their ability to recognizenative poses among a set of decoys and to predictbinding affinities.32 The next paragraphs explain towhich extent our study goes beyond theirs.
The experimental conditions, such as pH or saltconcentration, under which crystallization and thebinding assay are performed and the packing in thecrystal form can have a profound impact on the bindingmode and the affinity of the ligand. This has beenrecently revealed in a study of trypsin crystals,33 whichshows the occurrence of protonation and crystal formdependent binding modes. For a series of aliphatic cyclicureas bound to HIV-1 protease, the binding energiescomputed by the Poisson equation significantly dependon the protonation state of the two active site asparticacids.9 Therefore, it may be anticipated that it isimportant to correctly model the protonation state ofthe ligand and the receptor, at least for the scoringfunctions that make use of partial charges. It is worthnoting that the pH of crystallization of the complexesdeposited in the LPDB is as low as 3.0 and as high as8.5. We investigated this issue by adjusting, for some
Scoring Functions for Interactions Journal of Medicinal Chemistry, 2004, Vol. 47, No. 12 3033

of the complexes, the protonation state according toexperimental evidence when available.
Solvation plays an important role in molecular rec-ognition, and accurately incorporating solvent effects indocking approaches represents a major challenge. Sol-vation models based on continuum electrostatics havebeen implemented in docking13,34 and de novo liganddesign programs.12 In a virtual screening simulationagainst three receptors, it was shown that includingligand solvation improves the ranking of known ligandsand leads to low-energy compounds with net formalcharges consistent with those of known ligands.34 Hence,in this study, we analyzed in depth the role of electro-statics in scoring by using various solvent models inconjunction with the CHARMm force field.
Zinc in the binding sites of metalloproteins performsessential biological functions and often contributesconsiderably to the binding affinity of small-moleculeligands. However, it is notoriously difficult to evaluatemetal-ligand interactions. More specifically, differentcharge sets may significantly influence binding energiescomputed by force-field scoring functions. Recently, ithas been shown that the use of partial atomic chargesdetermined by semiempirical calculations leads to abetter recognition of true ligands in database docking.35
Thus, we investigated the influence of the zinc chargemodel by comparing scoring results obtained for two setsof charges. First, zinc is modeled as a +2 ion; second,the charge transfer between the zinc and its coordinat-ing protein groups is taken into account, leading to aZn charge below +2 (see section 2).
It is obvious that docking algorithms that treat thereceptor as rigid will encounter problems in docking aligand into a binding site if the latter undergoes asignificant conformational change upon binding. It isunclear to what extent small changes in the receptorcompromise the accuracy of the scoring functions. Fromthe point of view of virtual screening applications, it iscommon practice to preferentially use coordinates of areceptor obtained with a ligand analogue. Studies thatassess the performance of scoring functions for cross-docking are rare. Murray et al. carried out docking andcross-docking experiments for three fairly rigid enzymes(thrombin, thermolysin, and neuraminidase) using theprogram PRO_LEADS, which makes use of the scoringfunction ChemScore.36 Docking and cross-docking simu-lations were also performed for a set of 34 protein-ligand complexes, which represents 17 pairs of com-plexes of the same protein bound to two different
ligands.37 Binding energies were computed by theDOCK energy potential and PMF. In both studies, thedecrease in performance was significant. We investi-gated the influence of the receptor structure by generat-ing cross-decoys for six trypsin and seven HIV-1 pro-tease complexes. We selected these two enzymes becausetheir receptors display a significantly different plastic-ity. In the former case, the receptor is fairly rigid,whereas it is more flexible in the latter.
2. Methods
In this section, we provide details of data preparationand briefly outline the scoring functions used in thisstudy.
2.1. Data Preparation. A detailed description of theselection and preparation of complexes in the LPDB isgiven in ref 27. We focus on the modifications since thefirst release of the database. To date, the LPDB com-prises 189 complexes, which correspond to 49 differentreceptors and cover a range of binding affinities of 12orders of magnitude (Table 1).
Recently, the importance of using error-free experi-mentally determined structural data for the develop-ment and evaluation of scoring functions has beennoted.38,39 In our case, using minimized crystal geom-etries alleviates the problem of short-range interactionssometimes found in the crystal. Furthermore, a surveyof our data reveals that in around 15% of the cases,crystal contacts are found to the ligand. To investigatethe influence of crystal contacts on the outcome of theprediction of binding affinities, we also used decoys foraffinity prediction in addition to the minimized crystalstructure. However, we did not find any significantchange in the results. In the case of identification ofnear-native poses, some of the crystal geometries maynot be relevant as references due to the presence ofcrystallographically related contacts. This point is notaddressed in this study.
2.1.1. Protonation State Assignment. A first setof structures was generated by using default values todetermine the protonation states of the titratable groups.As such, amines were protonated, carboxylate groupswere negatively charged, and hydroxyl groups areconsidered to be neutral. Imidazole rings were consid-ered neutral, with the hydrogen on the δ nitrogen,except when a hydrogen bond involving the Nε as adonor could be formed. Then, the hydrogen was placedon the ε nitrogen.
Table 1. Description of the Data Sets
no. data set no. of complexes pKi range R2 a protonation states zinc charge model
1a all 189 12 0.36 modified ab initio1b all 189 12 0.36 standard ab initio2 all/ChemScore + AutoDock 116 11 0.35 modified ab initio3 aspartic protease 52 7 0.05 modified NA4 oxidoreductase 37 8 0.23 modified ab initio5 serine protease 25 7 0.81 NA NA6 metalloprotease 13 10 0.58 modified ab initio7 immunoglobulin 10 6 0.50 modified NA8 lyase 10 (8b) 8 (3b) 0.18 NA ab initio9 L-arabinose binding protein 9 2 0.16 NA NA10 mhc 7 2 0.01 NA NA11 others 26 11 0.09 modified ab initioa Square of the correlation coefficient (R2) between the experimental binding affinities and the logarithm of the ligand molecular weights.
R2 values in italic denote an anticorrelation. b Without 1avn and 1ebg.
3034 Journal of Medicinal Chemistry, 2004, Vol. 47, No. 12 Ferrara et al.
As mentioned, the ligand binding mode and thebinding affinity can be strongly pH-dependent, whichled us to build a second set of conformations by adjustingthe protonation states of ligands and protein residuesaccording to either experimental evidence or chemicalintuition. This information (when available) was ex-tracted from the literature describing the crystallizationof the complex structure. For example, it was suggestedthat most of the ligands in the LPDB that are bound tocytochrome c peroxidase should be protonated.40 It isworth noting that the pH of crystallization for this seriesof ligands is close to 4.5. In some of the thermolysincomplexes, a contact between the ligand and the recep-tor involves two carboxylate oxygens separated by adistance of around 2.8 Å. In this case, a hydrogen atomwas placed on the oxygen belonging to the receptor. Inthe case of the aspartic protease family, experimentaland theoretical studies show that there is not a con-sensus choice for the protonation state of the twocatalytic aspartic acids in the binding site.41-49 Evenwhen it is assumed that the catalytic aspartates are ina monoprotonated form, the position of the protonremains unclear. An influence of the chemical natureof the inhibitor and the pH of the experiment on theionization state of the active site has been described.50
Since the pH of crystallization of most of the asparticprotease complexes in the LPDB ranges between 4.5 and5.5, the two catalytic aspartates are probably not in theform prevalent at physiological pH. In two cases (1hpxand 1hbv), the proton was placed on the outer oxygenof Asp25A, according to experimental evidence.51,52 Forthe remaining aspartic protease complexes, we made thesomewhat arbitrary choice to place a proton on one ofthe two inner oxygens of the carboxylate groups of thetwo aspartic acids.
2.1.2. Metal-Ligand Interactions. Modeling inter-actions between zinc and surrounding residues as solelyionic leads to assigning a +2 charge for Zn. However,charge transfer between zinc and its coordinatingprotein residues reduces the zinc charge, which mayinfluence the outcome of binding affinity calculations.To investigate this influence, the charge on the zinc andneighboring protein atoms was computed by Hartree-Fock calculations at the HF/6-31G*//HF/6-31G* levelusing Gaussian.53 The following coordinated groupswere included in the calculations: for a histidine, allatoms until the Cγ; for a cysteine until the Câ; for anaspartate until the Câ; for a glutamate until the Cγ.Ligand atoms were not taken into account in thecalculations. The bond between the zinc and its coordi-nated atoms was considered to be covalent. Therefore,for the complexes having a zinc bound to the ligand, onlythose decoys were used for which the distance betweenthe zinc and its closest ligand atom was less than thecorresponding average distance extracted from theCambridge Structural Database augmented by 0.25 Å.54
2.1.3. Decoy Generation. After these changes, thecrystal structures were reminimized, and for eachminimized protein-ligand pair, two sets of decoys havebeen generated.27 First, starting from the minimizedcrystal structure, we used the replica method inCHARMM to move simultaneously 25 copies of theligand within the rigid binding site. One-thousand stepsof Langevin molecular dynamics simulations at 300 K
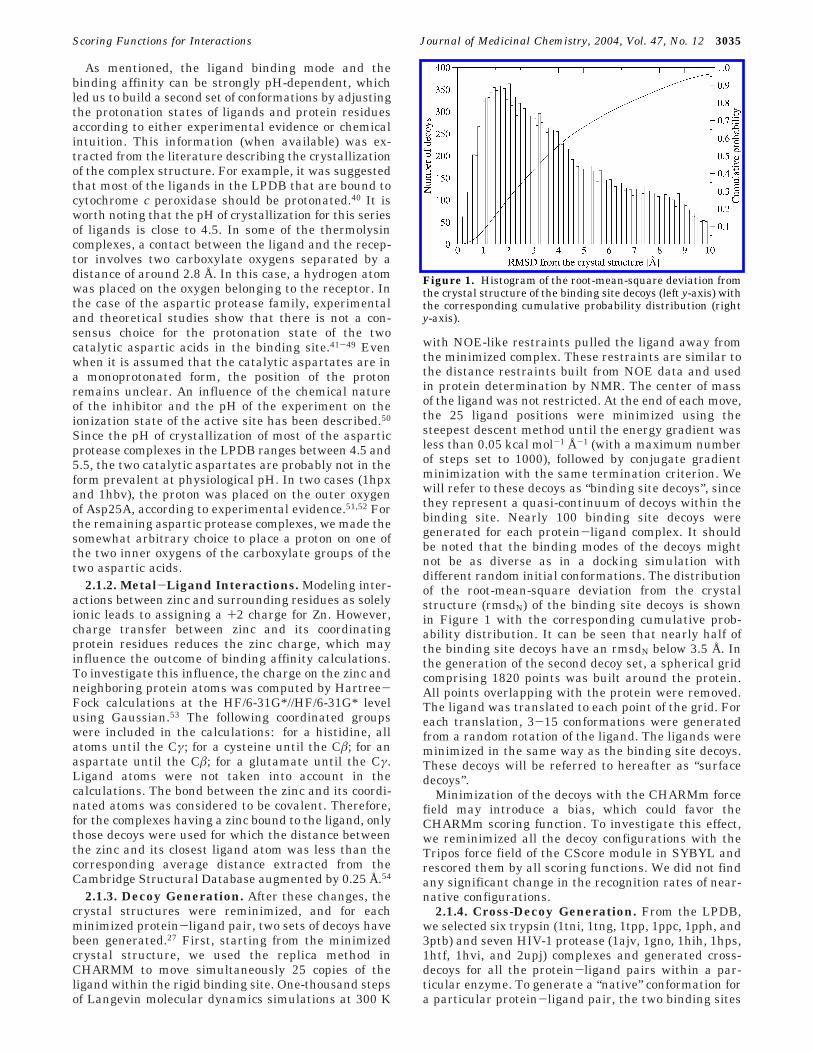
with NOE-like restraints pulled the ligand away fromthe minimized complex. These restraints are similar tothe distance restraints built from NOE data and usedin protein determination by NMR. The center of massof the ligand was not restricted. At the end of each move,the 25 ligand positions were minimized using thesteepest descent method until the energy gradient wasless than 0.05 kcal mol-1 Å-1 (with a maximum numberof steps set to 1000), followed by conjugate gradientminimization with the same termination criterion. Wewill refer to these decoys as “binding site decoys”, sincethey represent a quasi-continuum of decoys within thebinding site. Nearly 100 binding site decoys weregenerated for each protein-ligand complex. It shouldbe noted that the binding modes of the decoys mightnot be as diverse as in a docking simulation withdifferent random initial conformations. The distributionof the root-mean-square deviation from the crystalstructure (rmsdN) of the binding site decoys is shownin Figure 1 with the corresponding cumulative prob-ability distribution. It can be seen that nearly half ofthe binding site decoys have an rmsdN below 3.5 Å. Inthe generation of the second decoy set, a spherical gridcomprising 1820 points was built around the protein.All points overlapping with the protein were removed.The ligand was translated to each point of the grid. Foreach translation, 3-15 conformations were generatedfrom a random rotation of the ligand. The ligands wereminimized in the same way as the binding site decoys.These decoys will be referred to hereafter as “surfacedecoys”.
Minimization of the decoys with the CHARMm forcefield may introduce a bias, which could favor theCHARMm scoring function. To investigate this effect,we reminimized all the decoy configurations with theTripos force field of the CScore module in SYBYL andrescored them by all scoring functions. We did not findany significant change in the recognition rates of near-native configurations.
2.1.4. Cross-Decoy Generation. From the LPDB,we selected six trypsin (1tni, 1tng, 1tpp, 1ppc, 1pph, and3ptb) and seven HIV-1 protease (1ajv, 1gno, 1hih, 1hps,1htf, 1hvi, and 2upj) complexes and generated cross-decoys for all the protein-ligand pairs within a par-ticular enzyme. To generate a “native” conformation fora particular protein-ligand pair, the two binding sites
Figure 1. Histogram of the root-mean-square deviation fromthe crystal structure of the binding site decoys (left y-axis) withthe corresponding cumulative probability distribution (righty-axis).
Scoring Functions for Interactions Journal of Medicinal Chemistry, 2004, Vol. 47, No. 12 3035

were first superimposed and the ligand was thenminimized in the rigid binding site of the related proteinusing the conjugate gradient method until the energygradient was less than 0.5 kcal mol-1 Å-1 (with amaximum number of steps set to 1000). Binding sitedecoys were generated as described above for thenatural ligands, and no surface decoys were constructed.In total, cross-decoys corresponding to 72 protein-ligand combinations were generated.
2.2. Scoring Functions. An all-atom model was usedfor CHARMm, DOCK, and AutoDock. Partial chargesfor the protein were set up using the CHARMm forcefield.22 A modified version of INSIGHT II55 was used toassign the ligand partial charges, which makes use ofa bond increment scheme. Some of the bond incrementswere modified to better reproduce the 6-31G* ESPcharges (the modified bond increments are availableupon request). CHARMm was evaluated either in vacuoor in conjunction with various solvation models: namely,the Poisson equation,56 the generalized Born (GB)model,57 and either a constant (CDIE) or distance-dependent dielectric function (RDIE). Implicit electro-static solvation models approximate the energy associ-ated with solvating a charged solute, represented by alow-dielectric medium, in a solvent modeled by a high-dielectric medium. Calculations based on the Poissonequation are usually considered to be the benchmarkfor continuum electrostatics. They were carried outusing the CHARMM58 PBEQ module, which makes useof grid-based finite difference techniques (we will sub-sequently refer to them as FDP). The grid spacing wasset to either 0.25 Å (FDP0.25) or 0.4 Å (FDP0.4), the ionicstrength was set to zero, and the solute dielectricboundary was defined as the Lee-Richards molecularsurface.59 The solvent and solute dielectric constantswere set to 80 and either 1 or 4, respectively. A simplerand faster continuum dielectric approximation is the so-called generalized Born (GB) model, which approxi-mates the reaction field by a Coulomb potential.57
Numerical and analytical solutions to the GB modelhave been proposed.60-62 Here, we used a recentlydeveloped analytical GB model in which a correctionterm to the Coulomb field approximation has beenintroduced in conjunction with a more accurate descrip-tion of the molecular surface.63,64 The model containsfive parameters and utilizes a molecular volume builtfrom a superposition of atomic functions. The calcula-tions were performed for ε ) 1, and the solvationenergies were scaled by (ε - 1/80)/(1 - 1/80) to obtain theenergies for higher values of the dielectric constant. Aneven more simplified solvent model is based on a lineardistance-dependent dielectric function (called hereafterRDIE, ε(r) ) cr, where c is a constant that can rangefrom 1 to 80 and r is an atom-atom distance) toapproximate the screening effects of the electrostaticinteractions. For the CDIE/RDIE calculations, a sig-moidal switching function58 between 11 and 14 Å wasemployed for both the van der Waals and electrostaticterms. For the GB calculations, the van der Waals andthe electrostatic interactions were truncated between24 and 26 Å with a switching function.
Three scoring functions, called contact, energy, andchemical scoring, are available in the DOCK 4.0.1program suite.5 The contact scoring function counts the
number of heavy atom contacts between the ligand andthe receptor. The energy score is based on the non-bonded interaction energies of the Weiner et al. forcefield.65 AMBER charges were used for the protein, whileGasteiger-Marsili66 atomic charges as implemented inSYBYL67 were assigned to the ligands. A linear distance-dependent dielectric function (ε(r) ) 4r) was used forthe Coulomb potential, and the cutoff for steric andelectrostatic interactions was set to 10 Å. The chemicalscore is based on the energy score except that theattractive part of the van der Waals interaction is scaleddepending on the interacting atoms. The gridded_scoreflag was turned off in DOCK to enable scoring as acontinuous function.
DrugScore20 and AutoDock6,25,26 were evaluated byusing their original implementation. The CScore (Con-sensus Score) module68 implemented in SYBYL67 wasused to assess ChemScore,23 Gold,3,24 and PMF.19 Itshould be noted that the scores calculated by theoriginal scoring function and CScore can differ.28 Drug-Score and PMF are knowledge-based potentials, whichwere derived by using 1376 and 697 protein-ligandcomplexes, respectively, taken from the PDB. In Drug-Score, 17 atom types were defined, whereas PMF isbased on 16 protein atom types and 34 ligand atomtypes. A knowledge-based, solvent accessible surfacearea dependent solvation term is included in DrugScore.The GOLD scoring function is a sum of a hydrogen-bonding energy, a steric interaction energy (a 4-8potential) between the ligand and the protein, and aninternal energy for the ligand, which consists of a vander Waals energy and a torsional potential.3,24 Chem-Score is a regression-based scoring function, which usescontact terms for lipophilic and metal-binding contribu-tions and a hydrogen-bonding term. ChemScore alsoincludes a term that penalizes restriction of conforma-tional degrees of freedom upon binding.23 ChemScorewas calibrated on a data set of 82 protein-ligandcomplexes. AutoDock (version 3.0) is also a regression-based scoring function, which consists of a van derWaals, an electrostatic, a hydrogen bonding, and adesolvation energy term, augmented by an entropicterm that measures the loss of torsional degrees offreedom upon binding. The desolvation free energy istaken to be proportional to the volume around the atomsthat are exposed to the solvent.69 The scoring functionwas parametrized on a set of 30 protein-ligand com-plexes.6 To evaluate the influence of the charge set,AMBER/Gasteiger-Marsili and CHARMm/INSIGHT IIcharges were assigned to the complexes, and only theresults obtained by the AMBER/Gasteiger-Marsilicharges will be discussed, since both alternatives yieldvery similar results.
Finally, we note that the binding energies ∆E werecalculated according to ∆E ) Ecomplex - Eprotein - Eligandand, therefore, include only interaction energies be-tween the ligand and the protein. For the CHARMmforce field, taking into account the intraligand energyleads to a small improvement in the recognition of near-native configurations and to similar correlation coef-ficients with the experimentally determined bindingaffinities (data not shown).
2.3. Data Analysis. The performance of the scoringfunctions is evaluated in terms of their ability (a) to
3036 Journal of Medicinal Chemistry, 2004, Vol. 47, No. 12 Ferrara et al.

identify near-native ligand poses (e2 Å) among a set ofdecoy structures and (b) to correctly rank differentligands with respect to their binding affinities. Thelatter ability depends on the former because it cannotbe expected that correct binding affinities are obtainedusing misdocked protein-ligand configurations as thestructural basis.30 We did not investigate how often theminimized crystallographic structure scores best be-cause it does not always represent the global energyminimum and is seldom generated by docking tools.Instead, we used the percentage of complexes with aroot-mean-square deviation from the crystal structureof less than 2 Å of the best ranked structure as thecriterion to evaluate the success of a potential torecognize near-native binding modes.
Progress in understanding ligand-protein interac-tions has been made by using ideas of the statisticalenergy landscape theory.30,70,71 It has been suggestedthat the ruggedness of the binding energy surface canbe associated with structural flexibility and differenttypes of binding mechanisms.7,70 This finding led us toassess the discriminative power of a particular scoringfunction, which measures its ability to discriminatebetween well-docked structures and misdocked struc-tures. To do so, we used a criterion that has been definedpreviously in a study of the CHARMm force field as ascoring function for flexible docking.30 It is based on theZ score, which is defined as
where E represents the binding energy of the ligand-receptor complex, Eh is the mean energy, and σ is thestandard deviation of the energy distribution. In thiswork, this energy distribution corresponds either to thebinding energies of the well-docked conformations or tothose of the misdocked conformations (see below). Thediscriminative power, DP, of a given scoring function isthen defined as
where i refers to the different complexes and N is thenumber of complexes. Zmin
i,D and Zmini,M represent the Z
scores for the lowest energy structure among the well-docked and misdocked conformations, respectively. fi isthe fraction of the well-docked structures with Z scoreslower than those of the misdocked structures. Thedefinition of well-docked and misdocked was taken asbefore,30 i.e., the structures with a rmsdN smaller than2 Å and larger than 4 Å, respectively. A DP value ofzero means no discriminative power, and the lower thevalue of DP, the more reliable is the energy function infinding relevant solutions.
Finally, we used the square of the Pearson correlationcoefficient (R2) to evaluate the ability of a particularscoring function to predict experimental binding affini-ties. For instance, an R2 of 0.36 between the experi-mental binding affinities and the molecular weight ofthe ligands means that 36% of the variation in thelogarithm of the binding potency can be explained by avariation in the molecular weight. To relate the scores
calculated by a knowledge-based or a force-field-basedscoring function to an absolute binding affinity, it wouldbe necessary to scale all computed energies. This wasnot done in this study, and therefore, we do not providethe standard deviations from the observed affinities.
2.4. Description of the Data Sets. Table 1 lists thedata sets that were used to analyze the scoring func-tions. The first two sets (1a, 1b) each comprise the wholedatabase (189 complexes). However, they differ in theprotonation state assigned to the ionizable groups. Mostof the complexes used to calibrate ChemScore andAutoDock belong to the LPDB. Therefore, to betterevaluate the predictability of these two regression-basedscoring functions, we built set 2, where 69 complexesthat belong to the training set of ChemScore andAutoDock were removed. In a drug design project, oneis interested in either the relative binding free energybetween two different ligands for the same receptor(affinity) or the relative binding free energy between twodifferent receptors for the same ligand (specificity).Therefore, we also considered sets 3-11, where all 189complexes were classified according to their receptor.
3. Results and Discussion
3.1. Comparison of the Generalized Born Modelwith a Model Based on the Poisson Equation.Recently, a new solution for the GB model has beendescribed.63,64 Yet the model has only been validated fordifferent protein conformations and not for protein-ligand complexes. Since the solvation contribution to thebinding free energy (which is on the order of 10-100kcal mol-1) is determined as the difference betweensolvation free energies of the complex, the receptor, andthe ligand (the first two usually being on the order of103-104 kcal mol-1), already small absolute errors inthese solvation free energies lead to a large (relative)error in the predicted binding free energy. Furthermore,it has been questioned whether continuum solventmodels parametrized to reproduce vacuum-to-water freeenergy data can be used for binding reactions withoutreparametrization.72 Here, we present an extensivevalidation of this model based on a comparison withFDP results. The benchmark FDP solvation energieswere obtained using a grid spacing of 0.25 Å. Thesecalculations are computationally intensive, and there-fore, we tested the accuracy of the GB method on a setof only 84 complexes. Table 2 shows that the GBenergies for the complex, receptor, and ligand agree verywell with the FDP0.25 energies with an average absoluteerror below 1% for the complex and receptor. Theagreement is almost as good as between the FDP0.25 andFDP0.4 results. Figure 2 displays the correspondingbinding free energies obtained by the GB, FDP0.4, andFDP0.25 models. The cancellation of errors is much betterin the case of FDP0.4 than for the GB energies, leadingto an rms error of 2.52 kcal mol-1 of FDP0.4 comparedto FDP0.25, whereas in the case of GB an rms error of31.83 kcal mol-1 is obtained. The square of the correla-tion coefficient between the GB and FDP0.25 bindingenergies is R2 ) 0.58. Removing the 12 endothiapepsinand 18 cytochrome c peroxidase complexes results in animproved regression with R2 ) 0.76, which, however,is still worse than that obtained in the FDP0.4/FDP0.25case (R2 ) 0.99).
Z(E) )(E - Eh )
σ(1)
DP )1
N∑i)1
N
(Zmini,D - Zmin
i,M )fi (2)
Scoring Functions for Interactions Journal of Medicinal Chemistry, 2004, Vol. 47, No. 12 3037

3.2. Recognition of Near-Native Configurations.In this section, we consider only binding site decoys toanalyze the ability of the scoring functions to recognizenear-native poses. In the forthcoming analyses, theresults for the CHARMm force field were obtained bythe RDIE method with a dielectric constant of 4 (ε(r) )4r). We will refer to them as CHARMm-4r. This choiceallows a direct comparison with the DOCK-energycalculations, which were performed with the sametreatment for the electrostatic interactions. The influ-ence of the solvation models is discussed in the nextsection.
Figure 3 shows for different data sets the percentageof complexes for which the lowest energy decoy has anrmsdN of less than 2 Å. CHARMm-4r, DOCK-energy,ChemScore, DrugScore, and AutoDock reach a high rateof success with percentages ranging from 80% to 90%,whereas all the other functions yield recognition ratesof 53% to 65%. A decomposition of the CHARMmpotential energy values yields a recognition rate of 80%for the sets 1a and 1b if only the van der Waals potentialis used. A receptor-based analysis shows that themetalloprotease and lyase sets yield the lowest recogni-tion rates for most of the scoring functions. This mightbe due to the presence of a zinc in the binding site ofthese complexes.
All the scoring functions fail to recognize near-nativeconfigurations for the complexes 1cny, 1cnw, and 1avn.In all these cases, the ligand is significantly solvent-exposed and many decoys have a more favorable vander Waals interaction energy than in the crystal struc-ture. It can be expected that these decoys should bedisfavored by entropic and solvation effects, which arenot correctly captured by the analyzed scoring functions,at least in these cases.
Figure 4 displays the results for the discriminativepower. For the data set 1a, the force-field-based poten-tials CHARMm-4r and DOCK-energy perform best, withdiscriminative power values of -1.58 and -1.47, re-spectively. They are followed by DOCK-contact, Drug-
Table 2. Comparison of Electrostatic Energies Calculated by the GB and FDP Methods on a Data Set of 84 Complexesa
GB FDP0.4b
complex receptor ligand complex receptor ligand
absolute averagec (%) 0.51 0.60 2.10 0.48 0.49 1.88sloped (kcal mol-1) 0.997 0.997 1.011 1.004 1.004 1.009interceptd (kcal mol-1) 22.80 35.17 1.71 -4.77 -7.55 -0.68R2 d 0.9999 0.9999 0.9993 0.9999 0.9999 0.9999
a Benchmark energies were obtained from FDP with a grid spacing of 0.25 Å (FDP0.25). b FDP energies with a grid spacing of 0.4 Å.c Error (%) ) ⟨|GB/FDP0.4 - FDP0.25|/FDP0.25⟩. d Slope, intercept, and square of the correlation coefficient R of the least-squares fit line ofthe GB and FDP0.4 to the FDP0.25 energies.
Figure 2. Correlation between the FDP0.25 and GB bindingenergies (left) and between the FDP0.25 and FDP0.4 bindingenergies (right). FDP0.25 and FDP0.4 denote finite differencePoisson calculations with a grid spacing of 0.25 and 0.4 Å,respectively. The circles A and B comprise the cytochrome cperoxidase and endothiapepsin complexes, respectively. Figure 3. Percentage of complexes for which the lowest
energy decoy is within 2 Å from the crystal structure. Thescoring functions are represented on the x-axis (CHRM,CHARMm-RDIE (ε(r) ) 4r); DNrg, DOCK-Energy; DChm,DOCK-chemical; DCnt, DOCK-contact; DrugS, DrugScore;ChemS, ChemScore; AutoD, AutoDock), and the various datasets are represented on the y-axis (All, whole set (189complexes); All/NoTr., All without the complexes used tocalibrate ChemScore and AutoDock; AspPr., aspartic protease;Oxido., oxidoreductase; SerPr., serine protease; MetPr., met-alloprotease; Immu., immunoglobulin; Arab., L-arabinose bind-ing protein; Mhc, major histocompatibility protein).
Figure 4. Discriminative power. A discriminative power valueof zero means no discriminative power, and the lower thevalue, the more discriminative is the scoring function. SeeFigure 3 for the definition of the scoring functions and the datasets.
3038 Journal of Medicinal Chemistry, 2004, Vol. 47, No. 12 Ferrara et al.

Score, and ChemScore, with DP values of -1.20, -1.06,and -0.93, respectively.
A similar analysis was performed using the dockedand misdocked structures together. For the data set 1a,the percentage of complexes for which the lowest energydecoy has an rmsdN of less than 2 Å was within 2% ofthat obtained using only the docked structures for allthe scoring functions except PMF and DOCK-chemical(data not shown). For these potentials, the deteriorationin the performance is 7% and 11%, respectively. Thisresult shows that the analyzed scoring functions dis-criminate well the docked structures from the decoysthat are far from the binding site. This result is ofpractical importance in docking when the location of thebinding site is not known. One should note, however,that most of the binding sites that we considered aredeep. It is obviously more difficult to locate shallowbinding pockets, which may lead to a deterioration ofour results. A successful docking simulation usingAutoDock without prior knowledge of the binding sitehas been reported.73 Recently, a new method for deter-mining binding sites on proteins has been successfullyvalidated on seven protein-ligand complexes.74
We have found that with respect to our data set thesteric complementarity between the receptor and itsnatural ligand is crucial for recognizing near-nativestructures among a set of decoys. Our finding about therole of steric interaction is consistent with a study thatevaluated the two docking functions, DOCK-energy andPMF.37 This comparison was based on a set of 34protein-ligand complexes. It was found that omittingthe electrostatic term in CHARMm has a small impacton the ability of the molecular mechanics potential torecognize near-native poses. The success rate, definedas the percentage of complexes for which the lowestenergy decoy has an rmsdN smaller than 1.5 Å, was 79%for the DOCK-energy potential and 59% for the PMFpotential. These results agree well with ours. Althoughthe significance of steric interactions may imply thatthe electrostatic contribution is negligible, it should benoted that this effect may be overemphasized becauseof the preparation of the data set. Namely, minimizingreceptor and ligand in the crystal conformation may leadto a perfect “induced fit” (which may carry over for onlyslightly deviating decoys), whereas for all decoys, onlythe ligand geometries were minimized while keeping thereceptor rigid. Thus, taking into account the rathersteep potential curves in the case of van der Waalspotentials compared to the electrostatic ones, a less-than-ideal “induced fit” of more strongly deviatingdecoys would be more easily recognized by the van derWaals potential. In fact, the role of electrostatics hasbeen demonstrated in that optimization of electrostaticinteractions can be used to increase affinity and speci-ficity.75
Very recently, an evaluation of 11 scoring functionswas reported.32 It was based on a data set of 100protein-ligand complexes, 44 of which are deposited inthe LPDB, and the decoys were generated by thedocking program AutoDock. The recognition rates wereon average between 10% and 20% inferior to ours exceptfor ChemScore and D-Score, where D-Score stands forthe CScore implementation of the DOCK-energy poten-tial. In these two cases, we found much higher recogni-
tion rates. For the latter scoring function, the discrep-ancy comes partly from the fact that we used theacademic version of DOCK instead of D-Score. We alsoassessed D-Score, and the results were significantlyworse with respect to DOCK-energy (data not shown).For ChemScore, the origins of the discrepancy are notclear. We note that in the study of Wang et al.32 a highrecognition rate was obtained for the FlexX scoringfunction, which is also a regression-based scoring func-tion with contributions similar to those of ChemScore.It cannot be excluded that the difference comes fromthe fact that the decoys were not generated in the sameway in the two studies. DrugScore was validated on twosets of protein-ligand structures comprising 91 and 100complexes, respectively.20 The decoys were generated bythe docking tools FlexX and DOCK, respectively. Thepercentages of complexes found by DrugScore for whichthe top-ranking pose has an rmsdN below 2 Å were 73%and 70%, respectively. In addition, it was shown thatDrugScore and DOCK-energy yield similar results andperform better than DOCK-chemical. These findings areconsistent with our study. Furthermore, while it wasshown that DrugScore recognizes well-docked structuresslightly better than AutoDock,76 we found that Au-toDock yields slightly higher recognition rates thanDrugScore.
3.2.1. Effect of Solvation Models. Here, we analyzethe role of a variety of solvation models in conjunctionwith the CHARMm force field with respect to therecognition of near-native poses. In addition to the RDIEmodel (see previous section), we also consider the CDIEand GB models (see section 2 for a description). Figure5 (top) depicts the percentage of complexes for whichthe lowest energy decoy lies within 2 Å from the crystalstructure as a function of the solute dielectric constant.
Figure 5. Percentage of complexes for which the lowestenergy decoy is within 2 Å from the crystal structure (top) anddiscriminative power (bottom) for the CDIE, RDIE, and GBmodels as a function of the solute dielectric constant. Sets 1aand 1b comprise 189 complexes with the modified and stan-dard protonation states, respectively.
Scoring Functions for Interactions Journal of Medicinal Chemistry, 2004, Vol. 47, No. 12 3039

These curves are almost flat for a dielectric constantlarger than 20 and are, therefore, not shown. Withrespect to a van der Waals potential, the RDIE and GBmodels give slightly better results (around 10%), al-though in the latter case this is only achieved by usingthe modified protonation states. For ε ) 4, the successrate for the RDIE and GB models for set 1a is 89% and87%, respectively.
Figure 5 (bottom) shows the behavior of the discrimi-native power with respect to the dielectric constant. TheCHARMm van der Waals potential yields a DP valueof -1.34 and -1.33 for sets 1a and 1b, respectively. Thebest results are obtained by the GB model with themodified protonation states. For ε ) 4, GB gives a DPvalue of -1.83 compared to -1.58 and -1.16 for RDIEand CDIE, respectively. The GB model yields the bestdiscriminative power among all the scoring functionsanalyzed in this study. At low ε (ε < 5), RDIE discrimi-nates much better correctly docked structures frommisdocked ones than CDIE. These results suggest theuse of the RDIE model (with a dielectric constant of 3-4,where the discriminative power is highest) as a com-putationally efficient alternative to the GB model.
3.2.2. Effect of the Protonation States. Bindingaffinities determined by an empirical scoring functionare relatively insensitive to the atomic details of thereceptor and the ligand. To a lesser extent, this fact alsoholds for knowledge-based potentials. Therefore, addingor removing a proton is not expected to change signifi-cantly the binding energies calculated by such methods.For instance, ChemScore does not distinguish hydrogenbonds from ionic interactions. In general, empirical andknowledge-based scoring functions do not require aprotonation model. This fact is also true for the GOLDscoring function, which does not make use of partialcharges. Indeed, we consistently found very similarresults for these scoring functions with either thestandard or the modified protonation states. Largereffects may be expected for force-field-based potentials.For the CHARMm force field, this effect is investigatedin Figure 5. For low values of the dielectric constant,adjusting the protonation states slightly improves theability of the CHARMm potential to recognize well-docked structures. If we consider only the 84 complexeshaving a modified protonation state, the increase in thepercentage of complexes for which the lowest energydecoy has an rmsdN smaller than 2 Å is 17%, 11%, and29% for the CDIE, RDIE, and GB models with ε ) 1,respectively. For higher values of ε, the magnitude ofthe electrostatic interactions is reduced, and therefore,modifying the protonation state has a smaller effect.Lower values of discriminative power are also obtainedby modifying the protonation states. The results aremost similar for the RDIE model, which yields a highsuccess rate already using the standard protonationstates for any value of the dielectric constant. TheDOCK-energy and chemical scoring functions, whichmake use of a distance-dependent dielectric function,yield results similar to those from the CHARMm-RDIEmodel; i.e., a slight increase of performance is observedwhen adjusting the protonation states. These resultssuggest that different modeling of the protonation stateof the ligand and the receptor does not influence therecognition of well-docked configurations. On the other
hand, a virtual screening experiment against dihydro-folate reductase has shown that the protonation stateof methotrexate and pteridine affects significantly theirbinding energies computed by the DOCK force field.13
Furthermore, these two ligands obtained a high rankonly in their protonated form, which is in agreementwith experiment.
3.2.3. Effect of the Zinc Charge Model. Ligand-metal interactions are notoriously difficult to model, andusing different interaction models may influence sig-nificantly binding energies computed by force-fieldpotentials. This effect is investigated here for zinc usinga charge of +2, thus assuming ionic interactions, ordetermined by ab initio methods, taking into accountcharge transfer between the metal and liganded proteinresidues (see section 2). For the CHARMm force fieldand ε ) 4, the two charge models yield very similarpercentages of recognition (around 70%). Consideringthis result, one needs to keep in mind that we onlyconsidered decoys for which the distance between thezinc and its coordinated ligand atoms is close to thevalue in the crystal structure (see section 2).
3.2.4. Analysis of Cross-Decoys. We selectedCHARMm-4r, DrugScore, and ChemScore to analyzethe set of cross-decoys because they have yielded thehighest decoy recognition rates on the “native” com-plexes and represent the three classes of scoring func-tion. Figure 6 shows the rmsdN of the lowest energyconfiguration for the all-pairs decoys on trypsin (toppanels) and HIV-1 protease (bottom panels). On aver-age, there is a slight decrease in performance withrespect to the case of the decoys (about 12%), except forCHARMm-4r in the case of HIV-1 protease, in whichthe recognition rates decrease from 86% for the decoysto 52% for the cross-decoys. This result may be at-tributed to the increased steepness of the CHARMmforce field compared to the other two functions. How-ever, if we consider an rmsdN of 2.5 Å as a thresholdbelow which the recognition is considered to be success-ful, the recognition rate decreases from 86% for thedecoys to 74% for the cross-decoys for CHARMm-4r inthe case of HIV-1 protease. This result shows that thelarger decrease of performance for CHARMm-4r withrespect to DrugScore and ChemScore is somewhatmisleading. Furthermore, the rigidity of the trypsinreceptors, as well as the smaller size of the ligands,makes the recognition of well-docked configurations inthe case of the trypsin complexes much easier than inthe case of the HIV-1 complexes. A decomposition of theCHARMm potential energy values yields a recognitionrate of 67% and 71% for the trypsin and HIV-1 decoys,respectively, if only the van der Waals potential is used.These percentages are 67% and 55% for the trypsin andHIV-1 cross-decoys, respectively. This result shows thatthe crucial role of steric complementarity between theligand and the receptor that was highligthed previouslyin decoy recognition is still valid in cross-decoy recogni-tion. The average rmsd between the trypsin receptorsis 0.51 Å (with contributions of 0.15 and 0.96 Å for thebackbone and side chain atoms, respectively), whereasthis value is 0.87 Å for the HIV-1 receptors (0.58 and1.12 Å for the backbone and side chain atoms, respec-tively). DrugScore yields success rates for the cross-decoys that are even slightly higher than for the decoys.
3040 Journal of Medicinal Chemistry, 2004, Vol. 47, No. 12 Ferrara et al.
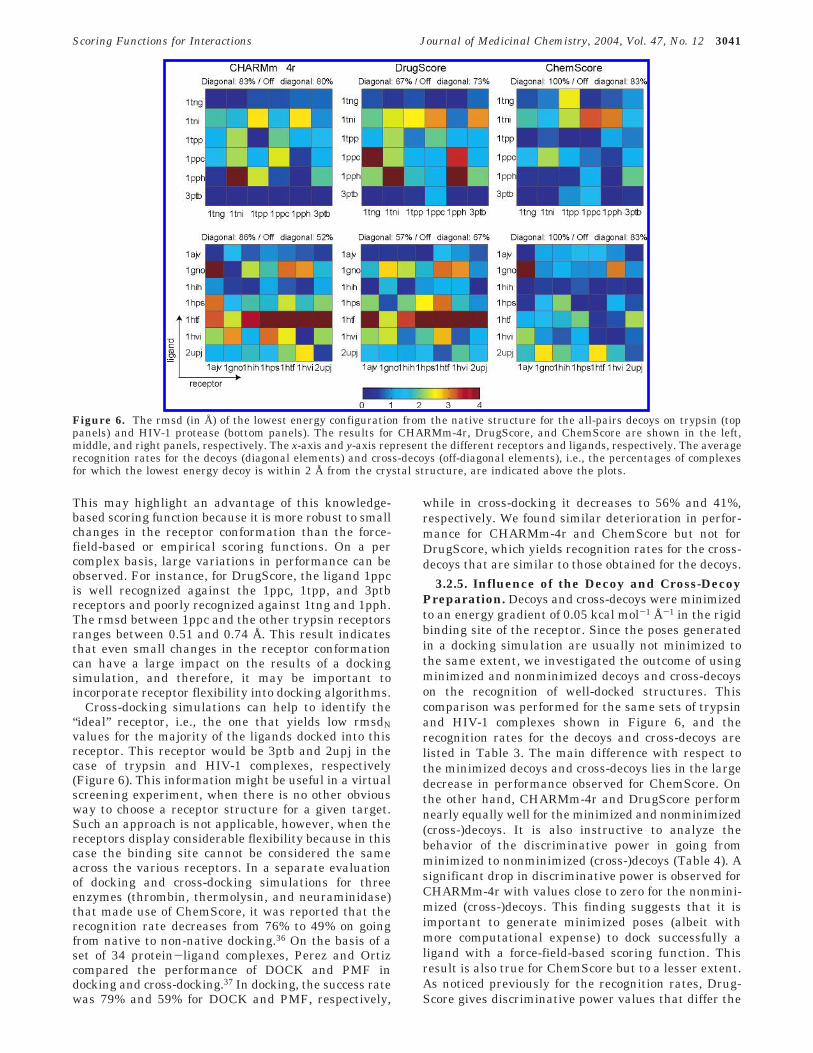
This may highlight an advantage of this knowledge-based scoring function because it is more robust to smallchanges in the receptor conformation than the force-field-based or empirical scoring functions. On a percomplex basis, large variations in performance can beobserved. For instance, for DrugScore, the ligand 1ppcis well recognized against the 1ppc, 1tpp, and 3ptbreceptors and poorly recognized against 1tng and 1pph.The rmsd between 1ppc and the other trypsin receptorsranges between 0.51 and 0.74 Å. This result indicatesthat even small changes in the receptor conformationcan have a large impact on the results of a dockingsimulation, and therefore, it may be important toincorporate receptor flexibility into docking algorithms.
Cross-docking simulations can help to identify the“ideal” receptor, i.e., the one that yields low rmsdNvalues for the majority of the ligands docked into thisreceptor. This receptor would be 3ptb and 2upj in thecase of trypsin and HIV-1 complexes, respectively(Figure 6). This information might be useful in a virtualscreening experiment, when there is no other obviousway to choose a receptor structure for a given target.Such an approach is not applicable, however, when thereceptors display considerable flexibility because in thiscase the binding site cannot be considered the sameacross the various receptors. In a separate evaluationof docking and cross-docking simulations for threeenzymes (thrombin, thermolysin, and neuraminidase)that made use of ChemScore, it was reported that therecognition rate decreases from 76% to 49% on goingfrom native to non-native docking.36 On the basis of aset of 34 protein-ligand complexes, Perez and Ortizcompared the performance of DOCK and PMF indocking and cross-docking.37 In docking, the success ratewas 79% and 59% for DOCK and PMF, respectively,
while in cross-docking it decreases to 56% and 41%,respectively. We found similar deterioration in perfor-mance for CHARMm-4r and ChemScore but not forDrugScore, which yields recognition rates for the cross-decoys that are similar to those obtained for the decoys.
3.2.5. Influence of the Decoy and Cross-DecoyPreparation. Decoys and cross-decoys were minimizedto an energy gradient of 0.05 kcal mol-1 Å-1 in the rigidbinding site of the receptor. Since the poses generatedin a docking simulation are usually not minimized tothe same extent, we investigated the outcome of usingminimized and nonminimized decoys and cross-decoyson the recognition of well-docked structures. Thiscomparison was performed for the same sets of trypsinand HIV-1 complexes shown in Figure 6, and therecognition rates for the decoys and cross-decoys arelisted in Table 3. The main difference with respect tothe minimized decoys and cross-decoys lies in the largedecrease in performance observed for ChemScore. Onthe other hand, CHARMm-4r and DrugScore performnearly equally well for the minimized and nonminimized(cross-)decoys. It is also instructive to analyze thebehavior of the discriminative power in going fromminimized to nonminimized (cross-)decoys (Table 4). Asignificant drop in discriminative power is observed forCHARMm-4r with values close to zero for the nonmini-mized (cross-)decoys. This finding suggests that it isimportant to generate minimized poses (albeit withmore computational expense) to dock successfully aligand with a force-field-based scoring function. Thisresult is also true for ChemScore but to a lesser extent.As noticed previously for the recognition rates, Drug-Score gives discriminative power values that differ the
Figure 6. The rmsd (in Å) of the lowest energy configuration from the native structure for the all-pairs decoys on trypsin (toppanels) and HIV-1 protease (bottom panels). The results for CHARMm-4r, DrugScore, and ChemScore are shown in the left,middle, and right panels, respectively. The x-axis and y-axis represent the different receptors and ligands, respectively. The averagerecognition rates for the decoys (diagonal elements) and cross-decoys (off-diagonal elements), i.e., the percentages of complexesfor which the lowest energy decoy is within 2 Å from the crystal structure, are indicated above the plots.
Scoring Functions for Interactions Journal of Medicinal Chemistry, 2004, Vol. 47, No. 12 3041

least between the two sets, indicating that the (free)energy surface of this scoring function is the leastrugged.
3.3. Prediction of Binding Affinities. In thissection, we analyze the ability of the scoring functionsto rank binding energies. Figure 7 shows the square ofthe correlation coefficients (R2 value) for the differentdata sets using the minimized crystal structure. Chem-Score achieves the highest correlation with an R2 valueof 0.51 for set 1a. ChemScore also yields the highest R2
value (R2 ) 0.43) for set 2, where the complexes usedto calibrate this scoring function and AutoDock wereremoved. In particular, ChemScore outperforms allother scoring functions except AutoDock for the immu-noglobulin set, although no immunoglobin was includedin the training set. It also gives higher R2 values thanmost of the other scoring functions for the data sets foroxidoreductase, lyase, and others. The training set ofChemScore contains 6 oxidoreductase, 1 lyase, and 11other complexes that belong also to the LPDB. Further-more, ChemScore ranks binding affinities significantlybetter than the other regression-based scoring functionAutoDock. Although the results always depend on theset of complexes, this suggests that ChemScore wasmore broadly parametrized; for instance, a larger di-
versity of interactions was present in the training set.In general, the other scoring functions perform well forthe serine protease and metalloprotease families andunsatisfactorily for the remaining data sets. The aspar-tic protease and oxidoreductase sets yield a low correla-tion despite the wide range of binding affinities of 7 and8 orders of magnitude, respectively. The CHARMm-4rand DOCK-energy obtain similar correlation coefficientsfor most of the sets. The R2 value between the bindingaffinities computed by these two potentials is 0.79.DOCK-chemical is the poorest scoring function to rankbinding affinities, whereas DOCK-contact, despite itssimplicity, yields results that are only slightly inferiorto CHARMm-4r or DrugScore. The correlation betweenthe binding affinities computed by all the scoringfunctions, including also the logarithm of the ligandmolecular weight as a scoring function (see also below),is generally high except when the R2 values are com-puted by either DOCK-chemical or CHARMm-CDIE andall the other scoring functions. For set 1a, the averageR2 value between the all-pairs scoring functions withoutDOCK-chemical and CHARMm-CDIE and betweenthese two scoring functions and all the other ones is 0.66and 0.24, respectively.
Correlation coefficients similar to our results wereobtained for DrugScore, Gold, and PMF in a previousstudy.32 In contrast, we found better results for DOCK-energy, ChemScore, and AutoDock than in ref 32. Asfor the recognition of near-native poses, the origin ofthe discrepancy for DOCK comes partly from the factthat we used the academic version instead of the CScoremodule. Different correlation values for ChemScore andAutoDock may indicate a set dependence and, therefore,a clear weakness of the regression-based scoring func-tions. The ability of DrugScore and PMF to rank bindingaffinities was previously investigated for various setsof protein-ligand complexes.19,77 These two knowledge-based functions achieved comparable results, for in-stance, high correlation coefficients for the serine pro-teases and metalloproteases. In our study, DrugScoreand PMF yield correlation values of 0.33 and 0.08 forset 1a, respectively. It cannot be ruled out that the poorperformance of PMF originates partly from the fact thatwe did not use the original implementation.
Table 3. Recognition of Well-Docked Structures among a Set of Decoys and Cross-Decoysa
trypsin HIV-1 protease
CHARMm-4r DrugScore ChemScore CHARMm-4r DrugScore ChemScore
decoys, min 83 67 100 86 57 100decoys, non-min 100 50 50 86 71 86cross-decoys, min 80 73 83 52 67 80cross-decoys, non-min 67 57 53 55 55 43a The percentage of complexes for which the lowest energy decoy is within 2 Å from the crystal structure is reported for minimized and
nonminimized sets of decoys and cross-decoys.
Table 4. Recognition of Well-Docked Structures among a Set of Decoys and Cross-Decoysa
trypsin HIV-1 protease
CHARMm-4r DrugScore ChemScore CHARMm-4r DrugScore ChemScore
decoys, min -0.92 -0.64 -0.87 -1.06 -0.84 -1.36decoys, non-min -0.18 -0.77 -0.56 -0.11 -0.36 -0.48cross-decoys, min -1.28 -0.79 -1.24 -0.80 -0.74 -1.13cross-decoys, non-min -0.13 -0.80 -0.23 -0.09 -0.62 -0.33a The discriminative power values are reported for minimized and nonminimized sets of decoys and cross-decoys.
Figure 7. Square of the correlation coefficients (R2) betweenexperimental and calculated binding energies. Values were setto zero in the case of an anticorrelation. See Figure 3 for thedefinition of scoring functions and data sets.
3042 Journal of Medicinal Chemistry, 2004, Vol. 47, No. 12 Ferrara et al.

The reason that all the scoring functions exceptDOCK-chemical perform well for the serine proteaseand metalloprotease families might relate to the factthat for these two sets the binding affinities correlatewell with the ligand size. The R2 value between theexperimental binding affinities and the logarithm of theligand molecular weights is 0.81 and 0.58, respectively.The logarithmic function was chosen because a surveyof experimental data has shown that the binding freeenergy depends on the number of heavy atoms roughlyin a logarithmic way; i.e., it increases initially but thenlevels off after 15 heavy atoms.78 ChemScore andAutoDock yield high R2 values for the immunoglobulindata set, whereas all the other scoring functions giveeither no correlation (DrugScore) or even an anticorre-lation. On the other hand, we note that the bindingenergies calculated by the PB and GB models correlatewell with the experimental binding affinities of theimmunoglobulins for ε e 2. In this case, the correlationcoefficient depends strongly on the dielectric constant,since it drops to zero for ε g 3 (see also below). For thisset, the experimental binding affinities anticorrelatewith the size of the ligand, and therefore, the successof ChemScore and AutoDock can be attributed to theirentropic term, which takes into account the decreasein rotational degrees of freedom upon binding. Whenthis contribution is removed, the square of the correla-tion coefficient for AutoDock decreases from 0.72 to 0.02,and the R2 value between the entropic contributionalone and the experimental values is 0.60. Since theCScore module does not provide the different contribu-tions of the scoring functions, this effect is unknown forChemScore, but a similar result is expected. It can beanticipated that adding to the other scoring functionsan entropic term like the one implemented in Chem-Score or AutoDock should improve the results in thiscase. However, it should be kept in mind that theseentropic contributions are based on simplified models.In a virtual screening experiment, it is likely that higherscores will be attributed to larger ligands if the scoringfunction contains only terms for favorable interactions.This problem can be overcome by considering therestriction of the degrees of freedom upon binding of(ideally) both binding partners. As a cheap alternative,normalizing the binding energies on the basis of thetotal number of heavy atoms has been proposed.79
Other reasons than the lack of an entropic term mustbe invoked to understand the failure of the scoringfunctions to rank binding affinities for the other classes.High correlation coefficients might not be expected forthe L-arabinose binding proteins and the major histo-compatibility proteins because of the small range ofbinding affinity values in connection with the uncer-tainties in the experimental values. This argument doesnot hold for the aspartic protease and oxidoreductasesets, however. In the former case, the enzyme undergoesa significant conformational change upon binding. More-over, crystallographic studies often show the presenceof a conserved water molecule bridging the inhibitor andthe two flaps. In all scoring functions used, ligand-water-receptor interactions are not considered, how-ever. In the oxidoreductase case, most of the ligands aresmall and interact with the heme, whereas others are
bound to a zinc. As a result, the calculation of bindingaffinities is particularly challenging.
3.3.1. Analysis of Solvation Models. We nextevaluate the performance of various solvation modelsused in conjunction with the CHARMm force field forranking ligands with respect to binding energies. FDPcalculations were carried out with a grid spacing of 0.4Å and a solute dielectric constant of either 1 (FDPε1) or4 (FDPε4). The FDPε1 model yields no correlation withexperiment (data not shown). Better results are ob-tained by FDPε4 for data set 1a. Yet the correlation ismoderate (R2 ) 0.35), only slightly larger than whenusing only a van der Waals potential (R2 ) 0.29) andcomparable to the value obtained by CHARMm-4r (R2
) 0.34).We then analyzed the performance of simpler solvent
models. These include the CDIE, RDIE, and GB models.Figure 8 shows the correlation between results obtainedwith these models and experimental binding affinitiesas a function of the solute dielectric constant for datasets 1a and 1b. The curves are almost flat for a dielectricconstant larger than 20 and are therefore not displayed.It can be seen that none of these models performsignificantly better than a van der Waals potential (R2
) 0.29). The GB model yields the best result with R2 )0.37 for ε ) 4 using the modified protonation states. Atlow ε (ε < 5), RDIE gives much better results than CDIEand almost as good results as GB with ε ) 4, albeit withconsiderably less computational cost. The choice of theoptimal value of the dielectric constant depends on thereceptor. Our results show that for the GB model thehighest correlation coefficients for the data sets 3-11are obtained using ε values that range between 1 and6. Furthermore, solvation energies computed by anelectrostatic continuum model depend strongly on theset of partial atomic charges and radii. Very recently,it has been shown that slightly scaling the atomic radiihas a profound impact on binding energies computedby the Poisson equation for benzamidine bound totrypsin.72 This parameter dependence clearly points toa limit of using such models for binding free energycalculations. Finally, a comparison of the GB and PBmodels with explicit solvent results has been reportedfor the calculation of the binding free energy of an
Figure 8. Square of the correlation coefficients (R2) betweenexperimental and calculated binding energies for the CDIE,RDIE, and GB models as a function of the solute dielectricconstant. Sets 1a and 1b comprise 189 complexes with themodified and standard protonation states, respectively.
Scoring Functions for Interactions Journal of Medicinal Chemistry, 2004, Vol. 47, No. 12 3043

octapeptide ligand to the murine MHC class I protein.80
Good agreement was found for the neutralized ligand,but large discrepancies were obtained for the ionizedligand.
3.3.2. Effect of the Protonation States. For all thescoring functions (without considering CHARMm; seebelow), we found very similar correlation values betweenthe standard and modified protonation states. On theother hand, the results depend strongly on the solvationmodel used with the CHARMm force field (Figure 8). Ahigher correlation between experiment and FDP or GBis achieved when using the complexes with the modifiedprotonation states. The improvement is significant forGB at low ε. For ε ) 4, the R2 value goes from 0.36 to0.55 when considering the 84 complexes with a modifiedprotonation state. Similar observations can be made forthe FDPε4 results. In contrast, these correlation valuesare very similar for RDIE. For the CDIE model, theresults are better using the standard protonation states.This finding suggests that using more realistic proto-nation states in conjunction with a reasonably accuratetreatment of solvation effects may lead to better agree-ment with experimental binding affinities. Nevertheless,neither the GB model nor the Poisson equation rankssignificantly better binding affinities than a distance-dependent dielectric function. The result for the RDIEmodel does not imply that modifying the protonationstate has no impact on the RDIE binding scores. For ε
) 4, the average binding energies for the 84 complexeswith a modified protonation state differ by 34, 8, and20 kcal/mol between the standard and modified proto-nation states for the CDIE, RDIE, and GB model,respectively. This result shows that adding a proton hasa large impact on binding energies calculated by a force-field-based scoring function.
3.3.3. Effect of the Zinc Charge Model. Thecorrelation values for the metalloproteins are very low(smaller than 0.1) for all the scoring functions using a+2 charge for zinc (data not shown). It is therefore ofinterest to investigate the effect of using chargesobtained by ab initio calculations. The correlationachieved by the FDPε1 (R2 ) 0.36) and FDPε4 (R2 ) 0.23)calculations in this case originates only from threecomplexes, 1avn, 6cpa, and 7cpa, which have the highestand the two lowest binding affinities among this set.When these three complexes are removed (which re-duces the range of binding affinities from 11 to 6 ordersof magnitude), the correlation drops to below 0.1.Similar conclusions are found for the other scoringpotentials. Thus, it might be that our ab initio zinccharges are not accurate enough, since we did not takeinto account the charge transfer between zinc and theligand atoms. Furthermore, the zinc charge is probablynot the same in the bound and unbound states. How-ever, if the interactions between zinc and surroundingatoms are similar for a series of ligand, a large cancel-lation of errors can be expected.81
3.3.4. Hydrophobic Effect. To model the effect ofhydrophobic desolvation, we added to the CHARMmforce field a contribution proportional to the solvent-accessible surface area (SASA). This term was investi-gated in connection with the CDIE, RDIE, GB, and PBmodels. The surface tension constant (γ) was variedbetween 5 and 30 cal mol-1 Å-2. Higher values of γ have
little physical meaning. For set 1a, the binding energiescomputed by the SASA term alone and the van derWaals potential correlate with an R2 value of 0.94. Thisindicates that the SASA term is not expected to yieldmuch improvement. Furthermore, the R2 value betweenthe experimental affinities and the energies calculatedby the SASA model is 0.29. On a receptor basis, thiscorrelation is the highest for the serine protease andmetalloprotease families with R2 values of 0.77 and 0.56,respectively. It is very low for the remaining classes witheven a strong anticorrelation for the immunoglobulinfamily (R ) -0.78). Again, these findings reflect thecorrelation (anticorrelation) of experimental bindingaffinities with respect to the size of the ligand for thesedata sets. In total, adding a SASA contribution to theCHARMm leads only to small improvements. Recently,deficiencies of a hydrophobic model based on the solvent-accessible surface area have been discussed. Hydrationfree energies of the cycloalkanes fall below the linearcorrelation for the n-alkane analogues.82,83 Simulationsof small alkanes have suggested that the SASA modelcan only describe the thermodynamics of cavity forma-tion but does not correctly model the favorable van derWaals interactions between interior atoms of the soluteand the solvent.84-86 These contributions may play animportant role in cases where the number of solvent-exposed and buried atoms changes considerably, suchas in binding reactions.
4. Conclusion
We presented an assessment of nine scoring functionsfor protein-ligand interactions using a database of 189protein-ligand complexes. Most of the potentials thatwe analyzed recognize well near-native configurationsamong a set of decoys. CHARMm, DOCK-energy, Drug-Score, ChemScore, and AutoDock showed the bestperformance in discriminating near-native from mis-docked structures. For these scoring functions, therecognition rate was between 80% and 90%, which isfairly remarkable and shows their usefulness in thedocking problem. The analysis of cross-decoys versusdecoys as well as minimized versus nonminimized poseshas shown that the knowledge-based potential Drug-Score is less sensitive to the atomic details of thereceptor than the regression-based scoring functionChemScore or the CHARMm force field. The cross-decoyresults also lead to the recommendation of evaluatingreceptor structures with respect to their “dockability”prior to predictive docking calculations.
We have found here that steric complementaritybetween the ligand and the receptor is more importantthan electrostatics to identify a near-native pose. As aresult, the treatment of solvation effects should have aminor impact on the ability of a force-field potential torecognize near-native configurations. In this regard, wehave shown that a computationally cheaper distance-dependent dielectric function works almost as well asa generalized Born model. However, it cannot be ex-cluded that the steric effect may be overemphasizedbecause of the preparation of the data set. In the caseof absolute binding free energy prediction, errors do notcancel out and different solvation contributions areexpected to play a larger role.
3044 Journal of Medicinal Chemistry, 2004, Vol. 47, No. 12 Ferrara et al.

On the other hand, our work has also confirmed thatthe prediction of binding affinities still represents amajor challenge. For the 189 complexes in the LPDB,only ChemScore achieves a fair correlation between thebinding scores and experimentally determined bindingenergies. Most of the scoring functions perform well onlyfor the serine protease and metalloprotease families andunsatisfactorily for the remaining data sets. For thesetwo sets, the experimental binding affinities correlatewell with the size of the ligands, which may explaintheir success. Including terms that account for changesin the degrees of freedom of the binding partners uponbinding is expected to yield an improvement in thesecases.
We have investigated in detail the effect of adjustingthe protonation state of binding site titratable groups.Improvement in the case of binding affinity predictionwas achieved for the generalized Born model and thePoisson equation used in conjunction with the CHARMmpotential. Despite this, these two models do not ranksignificantly better binding affinities than a distance-dependent dielectric function. It might be necessary toreparametrize these models to obtain better results inbinding free energy calculations. Since more accuratecharges for zinc do not lead to a better agreement withexperiment, the prediction of affinities for metallopro-teins remains problematic. Finally, we note that all ofthe decoys and updated data have been integrated intothe LPDB and are available at http://lpdb.scripps.edu.
Acknowledgment. We thank Dr.Olivier Roche forinitial construction of the LPDB. The Swiss NationalScience Foundation is gratefully acknowledged forfinancial support to P.F., and H.G. gratefully acknowl-edges a Feodor-Lynen fellowship from the Alexander-von-Humboldt Foundation, Germany. Financial supportfrom the NIH (Grants GM37554 and RR12255) is alsoappreciated.
Supporting Information Available: Three tables listingthe percentage of complexes for which the lowest energy decoyis within 2 Å from the crystal structure, the discriminativepower values of the scoring functions, and the correlation ofexperimental and calculated binding affinities using theminimized crystal structure. This material is available free ofcharge via the Internet at http://pubs.acs.org.
References(1) Bleicher, K. H.; Bohm, H. J.; Muller, K.; Alanine, A. I. Hit and
lead generation beyond high-throughput screening. Nat. Rev.Drug Discovery 2003, 2, 369-378.
(2) Abagyan, R.; Totrov, M.; Kuznetsov, D. ICMsA new method forprotein modeling and design: Applications to docking andstructure prediction from the distorted native conformation. J.Comput. Chem. 1994, 15, 488-506.
(3) Jones, G.; Willett, P.; Glen, R. C. Molecular recognition ofreceptor sites using a genetic algorithm with a description ofdesolvation. J. Mol. Biol. 1995, 245, 43-53.
(4) Rarey, M.; Kramer, B.; Lengauer, T.; Klebe, G. A fast flexibledocking method using an incremental construction algorithm.J. Mol. Biol. 1996, 261, 470-489.
(5) Ewing, T. J. A.; Kuntz, I. D. Critical evaluation of searchalgorithms for automated molecular docking and databasescreening. J. Comput. Chem. 1997, 18, 1175-1189.
(6) Morris, G. M.; Goodsell, D. S.; Halliday, R. S.; Huey, R.; Hart,W. E.; Belew, R. K.; Olson, A. J. Automated docking using aLamarckian genetic algorithm and an empirical binding freeenergy function. J. Comput. Chem. 1998, 19, 1639-1662.
(7) Wu, G.; Robertson, D. H.; Brooks, C. L., III; Vieth, M. Detailedanalysis of grid-based molecular docking: A case study ofCDOCKERA CHARMm-based MD docking algorithm. J. Com-put. Chem. 2003, 24, 1549-1562.
(8) Luo, R.; Gilson, M. K. Synthetic adenine receptors: Directcalculation of binding affinity and entropy. J. Am. Chem. Soc.2000, 122, 2934-2937.
(9) Mardis, K. L.; Luo, R.; Gilson, M. K. Interpreting trends in thebinding of cyclic ureas to HIV-1 protease. J. Mol. Biol. 2001,309, 507-517.
(10) Gohlke, H.; Klebe, G. Approaches to the description and predic-tion of the binding affinity of small-molecule ligands to macro-molecular receptors. Angew. Chem., Int. Ed. 2002, 41, 2644-2676.
(11) Buhm, H. J.; Stahl, M. The use of scoring functions in drugdiscovery applications. In Reviews in Computational Chemistry;Lipkowitz, K. B., Boyd, D. B., Eds.; Wiley-VCH: New York, 2002;Vol. 18, pp 41-87.
(12) Majeux, N.; Scarsi, M.; Apostolakis, J.; Ehrhardt, C.; Caisch, A.Exhaustive docking of molecular fragments on protein bindingsites with electrostatic solvation. Proteins: Struct., Funct., Genet.1999, 37, 88-105.
(13) Zou, X.; Sun, Y.; Kuntz, I. D. Inclusion of solvation in ligandbinding free energy calculations using the generalized-Bornmodel. J. Am. Chem. Soc. 1999, 121, 8033-8043.
(14) Bohm, H. J. The development of a simple empirical scoringfunction to estimate the binding constant for a protein-ligandcomplex of known three-dimensional structure. J. Comput.-Aided Mol. Des. 1994, 8, 243-256.
(15) Bohm, H. J. Prediction of binding constants of protein ligands:A fast method for the prioritization of hits obtained from de novodesign or 3d database search programs. J. Comput.-Aided Mol.Des. 1998, 12, 309-323.
(16) Sippl, M. J. Calculation of conformational ensembles frompotentials of mean force. An approach to the knowledge-basedprediction of local structures in globular proteins. J. Mol. Biol.1990, 213, 859-883.
(17) DeWitte, R.; Shakhnovich, E. SMoG: de novo design methodbased on simple, fast, and accurate free energy estimates. 1.Methodology and supporting evidence. J. Am. Chem. Soc. 1996,118, 11733-11744.
(18) Mitchell, J. B. O.; Laskowski, R. A.; Alexander, A.; Thornton, J.M. BLEEPsPotential of mean force describing protein-ligandinteractions: I. Generating potential. J. Comput. Chem. 1999,20, 1165-1176.
(19) Muegge, I.; Martin, Y. C. A general and fast scoring functionfor protein-ligand interactions: A simplified potential approach.J. Med. Chem. 1999, 42, 791-804.
(20) Gohlke, H.; Hendlich, M.; Klebe, G. Knowledge-based scoringfunction to predict protein-ligand interactions. J. Mol. Biol.2000, 295, 337-356.
(21) Charifson, P. S.; Corkery, J. J.; Murcko, M. A.; Walters, W. P.Consensus scoring: A method for obtaining improved hit ratesfrom docking databases of three-dimensional structures intoproteins. J. Med. Chem. 1999, 42, 5100-5109.
(22) Momany, F. A.; Rone, R. Validation of the general-purposeQUANTA. 3.2/CHARMm force-field. J. Comput. Chem. 1992, 13,888-900.
(23) Eldridge, M. D.; Murray, C. W.; Auton, T. R.; Paolini, G. V.; Mee,R. P. Empirical scoring functions. I: The development of a fastempirical scoring function to estimate the binding affinity ofligands in receptor complexes. J. Comput.-Aided Mol. Des. 1997,11, 425-445.
(24) Jones, G.; Willett, P.; Glen, R. C.; Leach, A. R.; Taylor, R.Development and validation of a genetic algorithm for flexibledocking. J. Mol. Biol. 1997, 267, 727-748.
(25) Goodsell, D. S.; Olson, A. J. Automated docking of substrates toproteins by simulated annealing. Proteins: Struct., Funct., Genet.1990, 8, 195-202.
(26) Morris, G. M.; Goodsell, D. S.; Huey, R.; Olson, A. J. Distributedautomated docking of exible ligands to proteins: Parallel ap-plications of AutoDock 2.4. J. Comput.-Aided Mol. Des. 1996,10, 293-304.
(27) Roche, O.; Kiyama, R.; Brooks, C. L., III. Ligand-proteindatabase: Linking protein-ligand complex structures to bindingdata. J. Med. Chem. 2001, 44, 3592-3598.
(28) Bissantz, C.; Folkers, G.; Rognan, D. Protein-based virtualscreening of chemical databases. 1. Evaluation of differentdocking/scoring combinations. J. Med. Chem. 2000, 43, 4759-4767.
(29) Stahl, M.; Rarey, M. Detailed analysis of scoring functions forvirtual screening. J. Med. Chem. 2001, 44, 1035-1042.
(30) Vieth, M.; Hirst, J.; Kolinski, A.; Brooks, C. L., III. Assessingenergy functions for flexible docking. J. Comput. Chem. 1998,19, 1612-1622.
(31) Vieth, M.; Hirst, J.; Dominy, B. N.; Daigler, H.; Brooks, C. L.,III. Assessing search strategies for flexible docking. J. Comput.Chem. 1998, 19, 1623-1631.
Scoring Functions for Interactions Journal of Medicinal Chemistry, 2004, Vol. 47, No. 12 3045

(32) Wang, R.; Lu, Y.; Wang, S. Comparative evaluation of 11 scoringfunctions for molecular docking. J. Med. Chem. 2003, 46, 2287-2303.
(33) Stubbs, M. T.; Reyda, S.; Dullweber, F.; Moller, M.; Klebe, G.;Dorsch, D.; Mederski, W.; Wurziger, H. pH-dependent bindingmodes observed in trypsin crystals: Lessons for structure-baseddrug design. ChemBioChem 2002, 3, 246-249.
(34) Shoichet, B. K.; Leach, A. R.; Kuntz, I. D. Ligand solvation inmolecular docking. Proteins: Struct., Funct., Genet. 1999, 34,4-16.
(35) Wei, B. Q.; Baase, W. A.; Weaver, L. H.; Matthews, B. W.;Shoichet, B. K. A model binding site for testing scoring functionsin molecular docking. J. Mol. Biol. 2002, 322, 339-355.
(36) Murray, C. W.; Baxter, C. A.; Frenkel, D. The sensitivity of theresults of molecular docking to induced fit effects: Applicationto thrombin, thermolysin and neuraminidase. J. Comput.-AidedMol. Des. 1999, 13, 547-562.
(37) Perez, C.; Ortiz, A. R. Evaluation of docking functions forprotein-ligand docking. J. Med. Chem. 2001, 44, 3768-3785.
(38) Nissink, J. W. M.; Murray, C.; Hartshorn, M.; Verdonk, M. L.;Cole, J. C.; Taylor, R. A new set for validating predictions ofprotein-ligand interaction. Proteins: Struct., Funct., Genet.2002, 49, 457-471.
(39) Davis, A. M.; Teague, S. J.; Kleywegt, G. J. Application andlimitations of X-ray crystallographic data in structure-basedligand and drug design. Angew. Chem., Int. Ed. 2003, 42, 2718-2736.
(40) Fitzgerald, M. M.; Musah, R. A.; McRee, D. E.; Goodin, D. B. Aligand-gated, hinged loop rearrangement opens a channel to aburied artificial protein cavity. Nat. Struct. Biol. 1996, 3, 626-631.
(41) Ferguson, D. M.; Radmer, R. J.; Kollman, P. A. Determinationof the relative binding free energies inhibitors to HIV-1 protease.J. Med. Chem. 1991, 34, 2654-2659.
(42) Harte, W. E., Jr.; Beveridge, D. L. Prediction of the protonationstate of the active site aspartyl residues in HIV-1 protease-inhibitor complexes via molecular dynamics simulation. J. Am.Chem. Soc. 1993, 115, 3883-3886.
(43) Yamazaki, T.; Nicholson, L. K.; Torchia, D. A.; Wingfield, P.;Stahl, S. J.; Kaufman, J. D.; Eyermann, C. J.; Hodge, C. N.; Lam,P. Y. S.; Ru, Y.; Jadhav, P. K.; Chang, C.-H.; Weber, P. C. NMRand X-ray evidence that the HIV protease catalytic aspartylgroups are protonated in the complex formed by the proteaseand a non-peptide cyclic urea-based inhibitor. J. Am. Chem. Soc.1994, 116, 10791-10792.
(44) Chen, X.; Tropsha, A. Relative binding free energies of peptideinhibitors of HIV-1 protease: The influence of the active siteprotonation state. J. Med. Chem. 1995, 38, 42-48.
(45) Gomez, J.; Freire, E. Thermodynamic mapping of the inhibitorsite of the aspartic protease endothiapepsin. J. Mol. Biol. 1995,252, 337-350.
(46) Smith, R.; Brereton, I. A.; Chai, R. Y.; Kent, S. B. H. Ionizationstates of the catalytic residues in HIV-1 protease. Nat. Struct.Biol. 1996, 3, 946-950.
(47) Tokarski, J. S.; Hopfinger, A. J. Constructing protein modelsfor ligand-receptor binding thermodynamic simulations: Anapplication to a set of peptidometic renin inhibitors. J. Chem.Inf. Comput. Sci. 1997, 37, 779-791.
(48) Kulkarni, S. S.; Kulkarni, V. M. Structure based prediction ofbinding affinity of human immunodeficiency virus-1 proteaseinhibitors. J. Chem. Inf. Comput. Sci. 1999, 39, 1128-1140.
(49) Piana, S.; Sebastiani, D.; Carloni, P.; Parrinello, M. Ab initiomolecular dynamics-based assignment of the protonation stateof pepstatin A/HIV-1 protease cleavage site. J. Am. Chem. Soc.2001, 123, 8730-8737.
(50) Tawa, G. J.; Topol, I. A.; Burt, S. K.; Erickson, J. W. Calculationof relative binding free energies of peptidic inhibitors to HIV-1protease and its I84V mutant. J. Am. Chem. Soc. 1998, 120,8856-8863.
(51) Baldwin, E. T.; Bhat, N.; Gulnik, S.; Liu, B.; Topol, I. A.; Kiso,Y.; Mimoto, T.; Mitsuya, H.; Erickson, J. W. Structure of HIV-1protease with KNI-272, a tight-binding transition-state analogcontaining allophenylnorstatine. Structure 1995, 3, 581-590.
(52) Hoog, S. S.; Zhao, Z.; Winborne, E.; Fisher, S.; Green, D. W.;DesJarlais, R. L.; Newlander, K. A.; Callahan, J. F.; Moore, M.L.; Huffman, W. L.; Abdel-Meguid, S. S. A check on rational drugdesign: crystal structure of a complex of human immunodefi-ciency virus type 1 protease with a novel-turn mimetic inhibitor.J. Med. Chem. 1995, 38, 3246-3252.
(53) Frisch, M. J.; Trucks, G. W.; Schlegel, H. B.; Scuseria, G. E.;Robb, M. A.; Cheeseman, J. R.; Zakrzewski, V. G.; Montgomery,J. A., Jr.; Stratmann, R. E.; Burant, J. C.; Dapprich, S.; Millam,J. M.; Daniels, A. D.; Kudin, K. N.; Strain, M. C.; Farkas, O.;Tomasi, J.; Barone, V.; Cossi, M.; Cammi, R.; Mennucci, B.;Pomelli, C.; Adamo, C.; Clifford, S.; Ochterski, J.; Petersson, G.
A.; Ayala, P. Y.; Cui, Q.; Morokuma, K.; Malick, D. K.; Rabuck,A. D.; Raghavachari, K.; Foresman, J. B.; Cioslowski, J.; Ortiz,J. V.; Stefanov, B. B.; Liu, G.; Liashenko, A.; Piskorz, P.;Komaromi, I.; Gomperts, R.; Martin, R. L.; Fox, D. J.; Keith, T.;Al-Laham, M. A.; Peng, C. Y.; Nanayakkara, A.; Gonzalez, C.;Challacombe, M.; Gill, P. M. W.; Johnson, B. G.; Chen, W.; Wong,M. W.; Andres, J. L.; Head-Gordon, M.; Replogle, E. S.; Pople,J. A. Gaussian 98; Gaussian, Inc.: Pittsburgh, PA, 1998.
(54) Harding, M. M. The geometry of metal-ligand interactionsrelevant to proteins. Acta Crystallogr. D 1999, 55, 1432-1443.
(55) INSIGHT II; Molecular Simulations: San Diego, CA, 2002.(56) Warwicker, J.; Watson, H. C. Calculation of the electric potential
in the active site cleft due to R-helix dipoles. J. Mol. Biol. 1982,157, 671-679.
(57) Still, W. C.; Tempczyk, A.; Hawley, R. C.; Hendrickson, T.Semianalytical treatment of solvation for molecular mechanicsand dynamics. J. Am. Chem. Soc. 1990, 112, 6127-6129.
(58) Brooks, B. R.; Bruccoleri, R. E.; Olafson, B. D.; States, D. J.;Swaminathan, S.; Karplus, M. CHARMM: A program formacromolecular energy, minimization, and dynamics calcula-tions. J. Comput. Chem. 1983, 4, 187-217.
(59) Lee, B.; Richards, F. M. The interpretation of protein struc-tures: estimation of static accessibility. J. Mol. Biol. 1971, 55,379-400.
(60) Scarsi, M.; Apostolakis, J.; Caisch, A. Continuum electrostaticenergies of macromolecules in aqueous solutions. J. Phys. Chem.A 1997, 101, 8098-8106.
(61) Qiu, D.; Shenkin, P. S.; Hollinger, F. P.; Still, W. C. The GB/SAcontinuum model for solvation. A fast analytical method for thecalculation of approximate Born radii. J. Phys. Chem. A 1997,101, 3005-3014.
(62) Dominy, B. N.; BrooksI, C. L., III. Development of a generalizedBorn model parametrization for proteins and nucleic acids. J.Phys. Chem. B 1999, 103, 3765-3773.
(63) Lee, M. S.; Salsbury, F. R.; Brooks, C. L., III. Novel generalizedBorn models. J. Chem. Phys. 2002, 116, 10606-10614.
(64) Lee, M. S.; Feig, M.; Salsbury, F. R.; Brooks, C. L., III. Newanalytic approximation to the standard molecular volume defini-tion and its application to generalized Born calculations. J.Comput. Chem. 2003, 24, 1348-1356.
(65) Weiner, S. J.; Kollman, P. A.; Nguyen, D. T.; Case, D. A. An allatom force field for simulations of proteins and nucleic acids. J.Comput. Chem. 1985, 7, 230-252.
(66) Gasteiger, J.; Marsili, M. Iterative partial equalization of orbitalelectronegativity. A rapid access to atomic charges. Tetrahedron1980, 36, 3219-3288.
(67) SYBYL;, Tripos Associates: St. Louis, MO, 2002.(68) Clark, R. D.; Strizhev, A.; Leonard, J. M.; Blake, J. F.; Matthew,
J. B. Consensus scoring for ligand/protein interactions. J. Mol.Graphics Modell. 2002, 20, 281-295.
(69) Stouten, P. F. W.; Froemmel, C.; Nakamura, H.; Sander, C. Aneffective solvation term based on atomic occupancies for use inprotein simulations. Mol. Simul. 1993, 10, 97-120.
(70) Tsai, C.-J.; Kumar, S.; Ma, B.; Nussinov, R. Folding funnels,binding funnels, and protein function. Protein Sci. 1999, 8,1181-1190.
(71) Verkhivker, G. M.; Bouzida, D.; Gehlhaar, D. K.; Retjo, P. A.;Freer, S. T.; Rose, P. W. Complexity and simplicity of ligand-macromolecule interactions: the energy landscape perspective.Curr. Opin. Struct. Biol. 2002, 12, 197-203.
(72) Rankin, K. N.; Sulea, T.; Purisima, E. O. On the transferabilityof hydration-parametrized continuum electrostatics models tosolvated binding calculations. J. Comput. Chem. 2003, 24, 954-962.
(73) Hetenyi, C.; van der Spoel, D. Efficient docking of peptides toproteins without prior knowledge of the binding site. Protein Sci.2002, 11, 1729-1737.
(74) Glick, M.; Robinson, D. D.; Grant, G. H.; Richards, W. G.Identification of ligand binding sites on proteins using a multi-scale approach. J. Am. Chem. Soc. 2002, 124, 2337-2344.
(75) Kangas, E.; Tidor, B. Optimizing electrostatic affinity in ligand-receptor binding: Theory, computation, and ligand properties.J. Chem. Phys. 1998, 109, 7522-7545.
(76) Sotriffer, C. A.; Gohlke, H.; Klebe, G. Docking into knowledge-based potential fields: A comparative evaluation of DrugScore.J. Med. Chem. 2002, 45, 1967-1970.
(77) Gohlke, H.; Hendlich, M.; Klebe, G. Predicting binding modes,binding affinities and “hot spots” for protein-ligand complexesusing a knowledge-based scoring function. Perspect. Drug Dis-covery Des. 2000, 20, 115-144.
(78) Kuntz, I. D.; Chen, K.; Sharp, K. A.; Kollman, P. A. The maximalaffinity of ligands. Proc. Natl. Acad. Sci. U.S.A. 1999, 96, 9997-1002.
3046 Journal of Medicinal Chemistry, 2004, Vol. 47, No. 12 Ferrara et al.

(79) Pan, Y.; Huang, N.; Cho, S.; MacKerell, A. D., Jr. Considerationof molecular weight during compound selection in virtual target-based database screening. J. Chem. Inf. Comput. Sci. 2003, 43,267-272.
(80) Zhang, L. Y.; Gallicchio, E.; Friesner, R. A.; Levy, R. M. Solventsmodels for protein-ligand binding: Comparison of implicitsolvent Poisson and surface generalized Born models withexplicit solvent simulations. J. Comput. Chem. 2001, 22, 591-607.
(81) Grzybowski, B. A.; Ishchenko, A. V.; Kim, C.-Y.; Topalov, G.;Chapman, R.; Christianson, D. W.; Whitesides, G. M.; Shakh-novich, E. I. Combinatorial computational method gives newpicomolar ligands for a known enzyme. Proc. Natl. Acad. Sci.U.S.A. 2002, 99, 1270-1273.
(82) Ben-Naim, A.; Marcus, Y. Solvation thermodynamics of nonionicsolutes. J. Chem. Phys. 1984, 81, 2016-2027.
(83) Simonson, T.; Brunger, A. T. Solvation free energies estimatedfrom macroscopic continuum theory: An accuracy assessment.J. Phys. Chem. 1994, 98, 4683-4694.
(84) Ashbaugh, H. S.; Kaler, E. W.; Paulaitis, M. E. A “universal”surface area correlation for molecular hydrophobic phenomena.J. Am. Chem. Soc. 1999, 121, 9243-9244.
(85) Gallicchio, E.; Kubo, M. M.; Levy, R. M. Enthalpy-entropy andcavity decomposition of alkane hydration free energies: Numer-ical results and implications for theories of hydrophobic solva-tion. J. Phys. Chem. B 2000, 104, 6271-6285.
(86) Pitera, J. W.; van Gunsteren, W. F. The importance of solute-solvent van der Waals interactions with interior atoms ofbiopolymers. J. Am. Chem. Soc. 2001, 123, 3163-3164.
JM030489H
Scoring Functions for Interactions Journal of Medicinal Chemistry, 2004, Vol. 47, No. 12 3047