aspire arkansas 2nd edition - historical data sheets - arkansas community foundation
DESCRIPTION
Historical fact sheets by issue from the second edition of Arkansas Community Foundation's Aspire Arkansas report. More information at www.arcf.org.TRANSCRIPT
1aspireARKANSAS
Appendix I: Historical Data
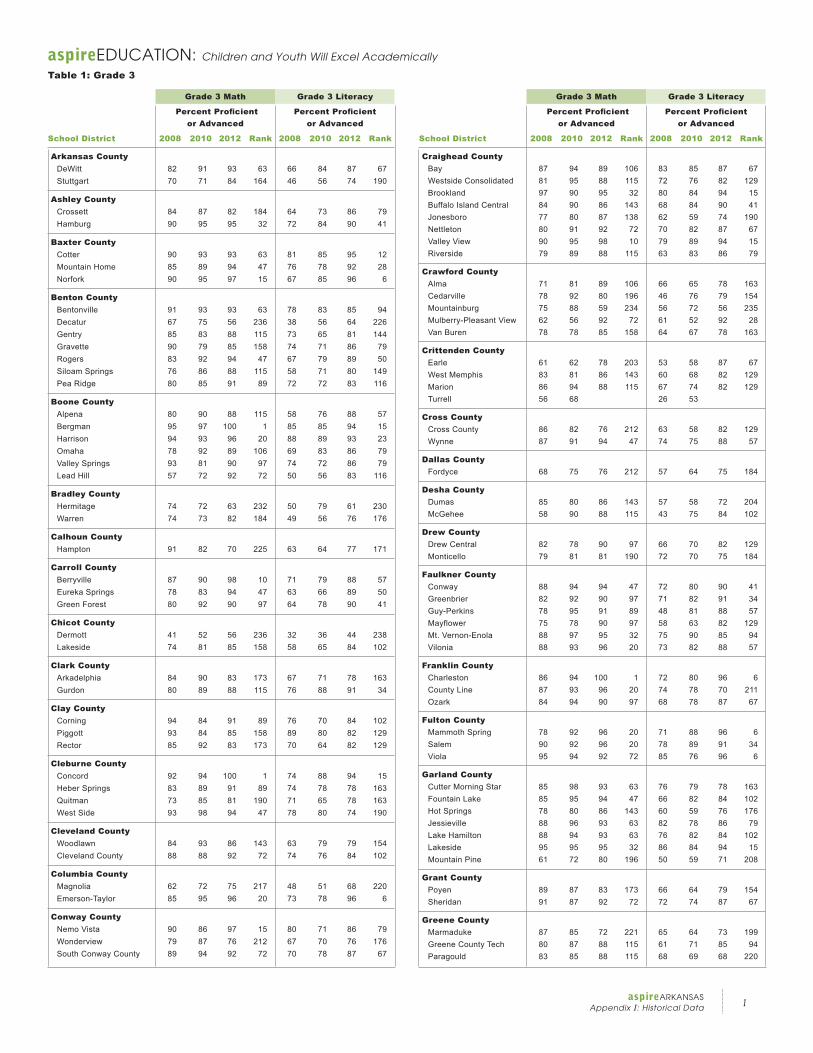
aspireEDUCATION: Children and Youth Will Excel Academically
Table 1: Grade 3
Grade 3 Math Grade 3 Literacy
PercentProficient PercentProficient or Advanced or Advanced
School District 2008 2010 2012 Rank 2008 2010 2012 Rank
Grade 3 Math Grade 3 Literacy
PercentProficient PercentProficient or Advanced or Advanced
School District 2008 2010 2012 Rank 2008 2010 2012 Rank
Arkansas County DeWitt 82 91 93 63 66 84 87 67 Stuttgart 70 71 84 164 46 56 74 190
Ashley County Crossett 84 87 82 184 64 73 86 79 Hamburg 90 95 95 32 72 84 90 41
Baxter County Cotter 90 93 93 63 81 85 95 12 Mountain Home 85 89 94 47 76 78 92 28 Norfork 90 95 97 15 67 85 96 6
Benton County Bentonville 91 93 93 63 78 83 85 94 Decatur 67 75 56 236 38 56 64 226 Gentry 85 83 88 115 73 65 81 144 Gravette 90 79 85 158 74 71 86 79 Rogers 83 92 94 47 67 79 89 50 Siloam Springs 76 86 88 115 58 71 80 149 Pea Ridge 80 85 91 89 72 72 83 116
Boone County Alpena 80 90 88 115 58 76 88 57 Bergman 95 97 100 1 85 85 94 15 Harrison 94 93 96 20 88 89 93 23 Omaha 78 92 89 106 69 83 86 79 Valley Springs 93 81 90 97 74 72 86 79 Lead Hill 57 72 92 72 50 56 83 116
Bradley County Hermitage 74 72 63 232 50 79 61 230 Warren 74 73 82 184 49 56 76 176
Calhoun County Hampton 91 82 70 225 63 64 77 171
Carroll County Berryville 87 90 98 10 71 79 88 57 Eureka Springs 78 83 94 47 63 66 89 50 Green Forest 80 92 90 97 64 78 90 41
Chicot County Dermott 41 52 56 236 32 36 44 238 Lakeside 74 81 85 158 58 65 84 102
Clark County Arkadelphia 84 90 83 173 67 71 78 163 Gurdon 80 89 88 115 76 88 91 34
Clay County Corning 94 84 91 89 76 70 84 102 Piggott 93 84 85 158 89 80 82 129 Rector 85 92 83 173 70 64 82 129
Cleburne County Concord 92 94 100 1 74 88 94 15 Heber Springs 83 89 91 89 74 78 78 163 Quitman 73 85 81 190 71 65 78 163 West Side 93 98 94 47 78 80 74 190
Cleveland County Woodlawn 84 93 86 143 63 79 79 154 Cleveland County 88 88 92 72 74 76 84 102
Columbia County Magnolia 62 72 75 217 48 51 68 220 Emerson-Taylor 85 95 96 20 73 78 96 6
Conway County Nemo Vista 90 86 97 15 80 71 86 79 Wonderview 79 87 76 212 67 70 76 176 South Conway County 89 94 92 72 70 78 87 67
Craighead County Bay 87 94 89 106 83 85 87 67 Westside Consolidated 81 95 88 115 72 76 82 129 Brookland 97 90 95 32 80 84 94 15 Buffalo Island Central 84 90 86 143 68 84 90 41 Jonesboro 77 80 87 138 62 59 74 190 Nettleton 80 91 92 72 70 82 87 67 Valley View 90 95 98 10 79 89 94 15 Riverside 79 89 88 115 63 83 86 79
Crawford County Alma 71 81 89 106 66 65 78 163 Cedarville 78 92 80 196 46 76 79 154 Mountainburg 75 88 59 234 56 72 56 235 Mulberry-Pleasant View 62 56 92 72 61 52 92 28 Van Buren 78 78 85 158 64 67 78 163
Crittenden County Earle 61 62 78 203 53 58 87 67 West Memphis 83 81 86 143 60 68 82 129 Marion 86 94 88 115 67 74 82 129 Turrell 56 68 26 53
Cross County Cross County 86 82 76 212 63 58 82 129 Wynne 87 91 94 47 74 75 88 57
Dallas County Fordyce 68 75 76 212 57 64 75 184
Desha County Dumas 85 80 86 143 57 58 72 204 McGehee 58 90 88 115 43 75 84 102
Drew County Drew Central 82 78 90 97 66 70 82 129 Monticello 79 81 81 190 72 70 75 184
Faulkner County Conway 88 94 94 47 72 80 90 41 Greenbrier 82 92 90 97 71 82 91 34 Guy-Perkins 78 95 91 89 48 81 88 57 Mayflower 75 78 90 97 58 63 82 129 Mt. Vernon-Enola 88 97 95 32 75 90 85 94 Vilonia 88 93 96 20 73 82 88 57
Franklin County Charleston 86 94 100 1 72 80 96 6 County Line 87 93 96 20 74 78 70 211 Ozark 84 94 90 97 68 78 87 67
Fulton County Mammoth Spring 78 92 96 20 71 88 96 6 Salem 90 92 96 20 78 89 91 34 Viola 95 94 92 72 85 76 96 6
Garland County Cutter Morning Star 85 98 93 63 76 79 78 163 Fountain Lake 85 95 94 47 66 82 84 102 Hot Springs 78 80 86 143 60 59 76 176 Jessieville 88 96 93 63 82 78 86 79 Lake Hamilton 88 94 93 63 76 82 84 102 Lakeside 95 95 95 32 86 84 94 15 Mountain Pine 61 72 80 196 50 59 71 208
Grant County Poyen 89 87 83 173 66 64 79 154 Sheridan 91 87 92 72 72 74 87 67
Greene County Marmaduke 87 85 72 221 65 64 73 199 Greene County Tech 80 87 88 115 61 71 85 94 Paragould 83 85 88 115 68 69 68 220
2aspireARKANSASAppendix I: Historical Data
Hempstead County Blevins 72 62 81 190 49 52 82 129 Hope 71 72 83 173 52 52 75 184 Spring Hill 97 100 100 1 88 100 97 4
Hot Spring County Bismarck 78 86 92 72 69 76 79 154 Glen Rose 89 98 94 47 80 85 86 79 Magnet Cove 92 89 95 32 79 80 95 12 Malvern 75 74 89 106 57 65 82 129 Ouachita 87 69 86 143 76 62 72 204
Howard County Dierks 75 84 77 211 58 70 76 176 Mineral Springs 45 68 67 228 42 60 65 224 Nashville 77 87 89 106 69 79 88 57
Independence County Batesville 85 84 84 164 76 70 82 129 Cushman 46 51 Southside 78 90 83 173 66 83 76 176 Midland 94 93 92 72 75 71 70 211 Cedar Ridge 82 88 76 212 66 77 69 217
Izard County Calico Rock 80 86 63 232 75 92 60 231 Melbourne 98 92 92 72 80 84 86 79 Izard County Consolidated 78 89 78 203 51 73 69 217
Jackson County Newport 81 74 86 143 63 57 83 116 Jackson County 86 95 92 72 66 90 80 149
Jefferson County Dollarway 65 59 66 229 35 38 64 226 Pine Bluff 53 66 70 225 43 47 59 232 Watson Chapel 68 76 79 199 62 61 77 171 White Hall 82 88 95 32 72 74 92 28
Johnson County Clarksville 84 93 87 138 76 86 85 94 Lamar 73 84 92 72 61 70 93 23 Westside 78 70 82 184 59 48 64 226
Lafayette County Bradley 61 84 95 32 32 84 100 1 Lafayette County 71 73 79 199 47 54 73 199
Lawrence County Hoxie 81 89 98 10 69 82 98 3 Sloan-Hendrix 90 87 88 115 81 59 86 79 Hillcrest 78 100 100 1 63 81 76 176 Lawrence County 86 74 82 184 68 78 83 116
Lee County Lee County 57 61 32 239 33 35 44 238
Lincoln County Star City 67 82 88 115 59 69 70 211
Little River County Ashdown 82 92 83 173 55 81 83 116 Foreman 75 77 79 199 68 73 75 184
Logan County Booneville 77 76 94 47 57 60 87 67 Magazine 71 86 100 1 63 77 93 23 Paris 89 85 83 173 83 73 77 171 Scranton 91 94 87 138 63 83 79 154
Lonoke County Lonoke 81 82 83 173 61 62 77 171 England 73 85 86 143 60 67 70 211 Carlisle 92 78 96 20 72 70 92 28 Cabot 90 91 92 72 72 79 87 67
Madison County Huntsville 82 84 84 164 65 69 79 154
Marion County Flippin 85 77 78 203 75 70 70 211 Yellville-Summit 76 83 88 115 69 81 79 154
Miller County Genoa Central 78 92 88 115 70 86 92 28 Fouke 83 87 88 115 65 74 86 79 Texarkana 80 79 86 143 62 66 79 154
Mississippi County Armorel 94 82 100 1 84 79 100 1 Blytheville 66 65 57 235 38 50 64 226 South Mississippi County 53 79 88 115 35 62 82 129 Gosnell 78 83 92 72 59 75 91 34 Manila 77 76 82 184 60 63 87 67 Osceola 51 60 72 221 37 42 72 204
Monroe County Brinkley 82 86 98 10 74 72 94 15 Clarendon 65 85 72 221 51 62 69 217
Montgomery County Caddo Hills 77 96 87 138 50 90 88 57 Mount Ida 82 85 84 164 64 73 66 222
Nevada County Prescott 85 89 84 164 74 82 83 116 Nevada 94 92 76 212 69 81 73 199
Newton County Jasper 79 88 86 143 72 76 74 190 Deer/Mt. Judea 82 88 69 227 63 72 55 236
Ouachita County Bearden 86 85 98 10 66 79 81 144 Camden-Fairview 68 79 88 115 51 63 84 102 Harmony Grove 74 83 78 203 65 75 76 176 Stephens 60 59 88 115 53 53 84 102
Perry County East End 70 78 81 190 58 72 73 199 Perryville 79 70 95 32 75 62 87 67
Phillips County Barton-Lexa 81 89 92 72 63 82 89 50 Helena/West Helena 66 66 65 230 48 55 66 222 Marvell 76 63 94 47 45 52 71 208
Pike County Delight 84 93 63 80 Centerpoint 84 87 99 8 57 63 83 116 Kirby 84 90 88 115 73 79 78 163 Murfreesboro 88 76 57 69 South Pike County 75 217 58 233
Poinsett County Harrisburg 89 84 88 115 76 72 83 116 Marked Tree 90 89 91 89 60 57 84 102 Trumann 64 84 84 164 64 60 85 94 Weiner 90 82 79 68 East Poinsett County 65 85 84 164 53 74 83 116
Grade 3 Math Grade 3 Literacy
PercentProficient PercentProficient or Advanced or Advanced
School District 2008 2010 2012 Rank 2008 2010 2012 Rank
Grade 3 Math Grade 3 Literacy
PercentProficient PercentProficient or Advanced or Advanced
School District 2008 2010 2012 Rank 2008 2010 2012 Rank
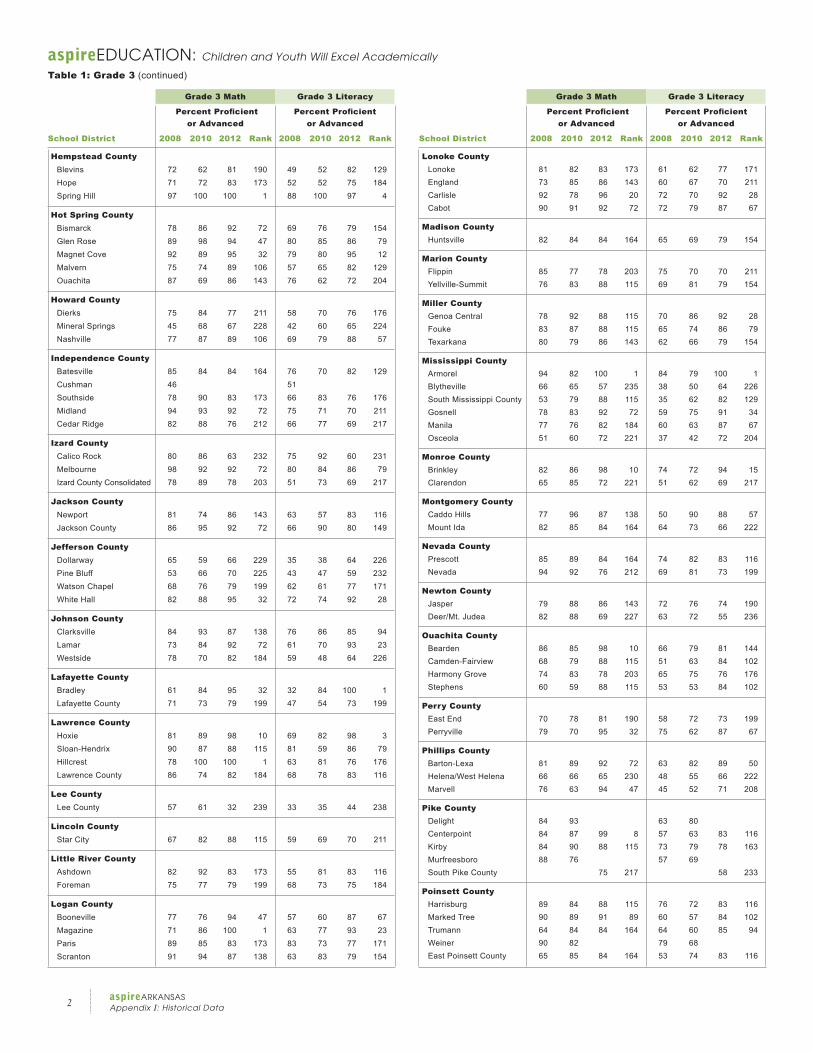
aspireEDUCATION: Children and Youth Will Excel Academically
Table 1: Grade 3 (continued)
3aspireARKANSAS
Appendix I: Historical Data
Polk County Mena 89 88 92 72 69 73 91 34 Van Cove 63 93 54 80 Wickes 83 99 70 84 Ouachita River 81 90 96 20 71 80 93 23 Cossatot River 94 47 90 41
Pope County Atkins 84 84 90 97 66 83 87 67 Dover 89 94 99 8 85 84 96 6 Hector 98 98 94 47 74 93 97 4 Pottsville 90 95 95 32 80 90 94 15 Russellville 85 91 91 89 72 74 84 102
Prairie County Des Arc 89 98 95 32 63 73 86 79 Hazen 71 74 71 224 62 65 74 190
Pulaski County Little Rock 65 71 73 220 49 58 70 211 North Little Rock 66 71 78 203 55 60 74 190 Pulaski County Special 75 81 86 143 59 66 83 116
Randolph County Maynard 84 89 91 89 71 78 77 171 Pocahontas 85 91 91 89 78 80 80 149
St. Francis County Forrest City 66 65 79 199 42 43 57 234 Hughes 40 74 65 230 15 69 65 224 Palestine/Wheatley 62 68 78 203 40 55 76 176
Saline County Bauxite 76 86 95 32 61 70 91 34 Benton 82 88 95 32 65 78 90 41 Bryant 89 95 94 47 74 85 90 41 Harmony Grove 81 81 96 20 63 55 82 129
Scott County Waldron 58 83 85 158 49 64 82 129
Searcy County Searcy County 93 90 97 15 75 84 85 94 Ozark Mountain 80 79 94 47 63 55 90 41
Sebastian County Fort Smith 64 79 86 143 51 67 81 144 Greenwood 90 95 97 15 75 80 92 28 Hackett 76 86 89 106 48 78 91 34 Hartford 60 84 85 158 51 74 75 184 Lavaca 83 90 89 106 74 83 83 116 Mansfield 72 81 86 143 45 71 89 50
Sevier County DeQueen 89 96 96 20 69 76 93 23 Horatio 69 87 84 164 56 84 80 149
Sharp County Cave City 82 86 95 32 75 76 90 41 Highland 90 89 96 20 78 74 86 79 Twin Rivers 77 88 45 41
Stone County Mountain View 76 94 88 115 74 81 73 199
Union County El Dorado 73 78 84 164 58 70 83 116 Junction City 82 67 81 190 65 79 75 184 Norphlet 76 92 82 184 65 84 89 50 Parkers Chapel 93 98 95 32 76 89 95 12 Smackover 62 77 78 203 57 71 71 208 Strong-Huttig 66 51 54 238 47 43 53 237
Van Buren County Clinton 91 94 90 97 81 76 89 50 Shirley 93 84 94 47 75 77 78 163 South Side 83 67 93 63 72 57 86 79
Washington County Elkins 84 90 94 47 52 73 84 102 Farmington 87 92 93 63 75 81 84 102 Fayetteville 81 83 88 115 72 74 84 102 Greenland 68 87 83 173 62 82 79 154 Lincoln 71 80 78 203 51 64 81 144 Prairie Grove 88 92 93 63 70 79 85 94 Springdale 74 82 86 143 58 70 81 144 West Fork 83 90 87 138 62 76 74 190
White County Bald Knob 82 85 81 190 70 70 72 204 Beebe 86 84 97 15 68 68 89 50 Bradford 89 100 83 173 55 82 74 190 White County Central 86 74 80 196 75 67 82 129 Riverview 86 92 83 173 70 86 88 57 Pangburn 100 81 96 20 88 76 94 15 Rose Bud 86 90 92 72 82 74 88 57 Searcy 85 88 89 106 77 80 84 102
Woodruff County Augusta 56 87 86 143 53 64 80 149 McCrory 74 86 89 106 68 74 86 79
Yell County Danville 89 85 95 32 66 66 88 57 Dardanelle 72 91 88 115 53 72 83 116 Western Yell County 74 86 90 97 49 59 85 94 Two Rivers 74 78 74 219 61 69 74 190
Grade 3 Math Grade 3 Literacy
PercentProficient PercentProficient or Advanced or Advanced
School District 2008 2010 2012 Rank 2008 2010 2012 Rank
Grade 3 Math Grade 3 Literacy
PercentProficient PercentProficient or Advanced or Advanced
School District 2008 2010 2012 Rank 2008 2010 2012 Rank
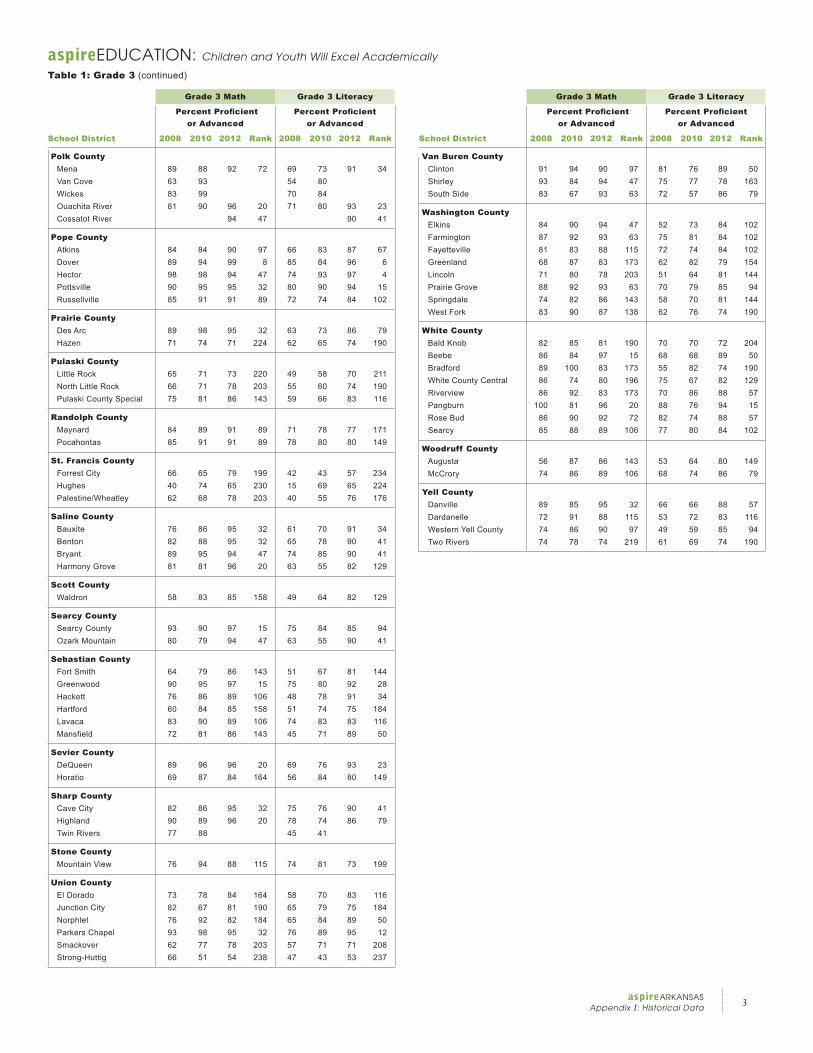
aspireEDUCATION: Children and Youth Will Excel Academically
Table 1: Grade 3 (continued)
4aspireARKANSASAppendix I: Historical Data
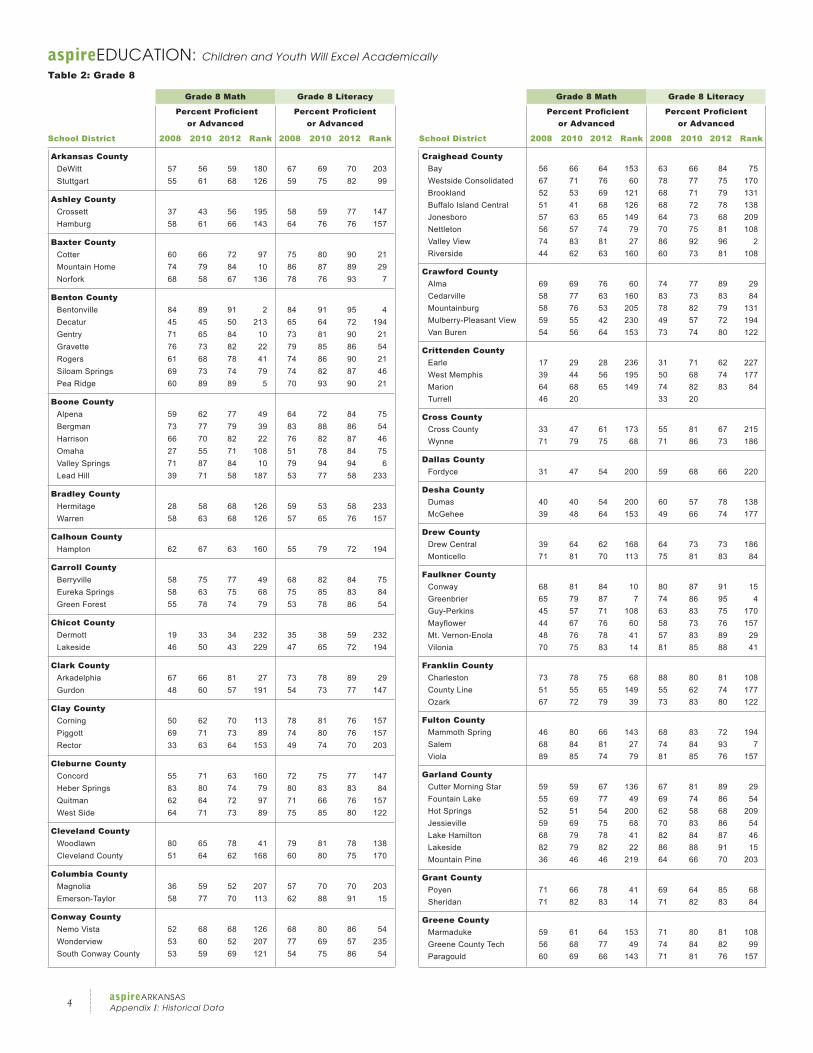
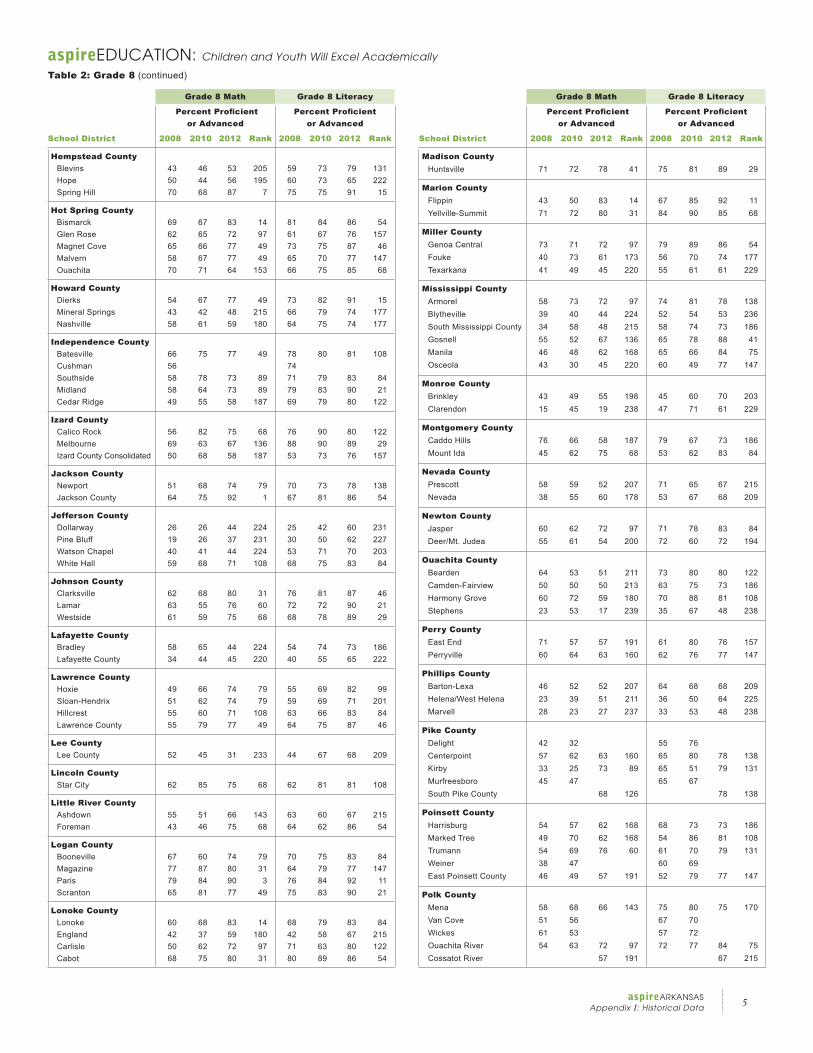
aspireEDUCATION: Children and Youth Will Excel Academically
Table 2: Grade 8
Grade 8 Math Grade 8 Literacy
PercentProficient PercentProficient or Advanced or Advanced
School District 2008 2010 2012 Rank 2008 2010 2012 Rank
Grade 8 Math Grade 8 Literacy
PercentProficient PercentProficient or Advanced or Advanced
School District 2008 2010 2012 Rank 2008 2010 2012 Rank
Arkansas County DeWitt 57 56 59 180 67 69 70 203 Stuttgart 55 61 68 126 59 75 82 99
Ashley County Crossett 37 43 56 195 58 59 77 147 Hamburg 58 61 66 143 64 76 76 157
Baxter County Cotter 60 66 72 97 75 80 90 21 Mountain Home 74 79 84 10 86 87 89 29 Norfork 68 58 67 136 78 76 93 7
Benton County Bentonville 84 89 91 2 84 91 95 4 Decatur 45 45 50 213 65 64 72 194 Gentry 71 65 84 10 73 81 90 21 Gravette 76 73 82 22 79 85 86 54 Rogers 61 68 78 41 74 86 90 21 Siloam Springs 69 73 74 79 74 82 87 46 Pea Ridge 60 89 89 5 70 93 90 21
Boone County Alpena 59 62 77 49 64 72 84 75 Bergman 73 77 79 39 83 88 86 54 Harrison 66 70 82 22 76 82 87 46 Omaha 27 55 71 108 51 78 84 75 Valley Springs 71 87 84 10 79 94 94 6 Lead Hill 39 71 58 187 53 77 58 233
Bradley County Hermitage 28 58 68 126 59 53 58 233 Warren 58 63 68 126 57 65 76 157
Calhoun County Hampton 62 67 63 160 55 79 72 194
Carroll County Berryville 58 75 77 49 68 82 84 75 Eureka Springs 58 63 75 68 75 85 83 84 Green Forest 55 78 74 79 53 78 86 54
Chicot County Dermott 19 33 34 232 35 38 59 232 Lakeside 46 50 43 229 47 65 72 194
Clark County Arkadelphia 67 66 81 27 73 78 89 29 Gurdon 48 60 57 191 54 73 77 147
Clay County Corning 50 62 70 113 78 81 76 157 Piggott 69 71 73 89 74 80 76 157 Rector 33 63 64 153 49 74 70 203
Cleburne County Concord 55 71 63 160 72 75 77 147 Heber Springs 83 80 74 79 80 83 83 84 Quitman 62 64 72 97 71 66 76 157 West Side 64 71 73 89 75 85 80 122
Cleveland County Woodlawn 80 65 78 41 79 81 78 138 Cleveland County 51 64 62 168 60 80 75 170
Columbia County Magnolia 36 59 52 207 57 70 70 203 Emerson-Taylor 58 77 70 113 62 88 91 15
Conway County Nemo Vista 52 68 68 126 68 80 86 54 Wonderview 53 60 52 207 77 69 57 235 South Conway County 53 59 69 121 54 75 86 54
Craighead County Bay 56 66 64 153 63 66 84 75 Westside Consolidated 67 71 76 60 78 77 75 170 Brookland 52 53 69 121 68 71 79 131 Buffalo Island Central 51 41 68 126 68 72 78 138 Jonesboro 57 63 65 149 64 73 68 209 Nettleton 56 57 74 79 70 75 81 108 Valley View 74 83 81 27 86 92 96 2 Riverside 44 62 63 160 60 73 81 108
Crawford County Alma 69 69 76 60 74 77 89 29 Cedarville 58 77 63 160 83 73 83 84 Mountainburg 58 76 53 205 78 82 79 131 Mulberry-Pleasant View 59 55 42 230 49 57 72 194 Van Buren 54 56 64 153 73 74 80 122
Crittenden County Earle 17 29 28 236 31 71 62 227 West Memphis 39 44 56 195 50 68 74 177 Marion 64 68 65 149 74 82 83 84 Turrell 46 20 33 20
Cross County Cross County 33 47 61 173 55 81 67 215 Wynne 71 79 75 68 71 86 73 186
Dallas County Fordyce 31 47 54 200 59 68 66 220
Desha County Dumas 40 40 54 200 60 57 78 138 McGehee 39 48 64 153 49 66 74 177
Drew County Drew Central 39 64 62 168 64 73 73 186 Monticello 71 81 70 113 75 81 83 84
Faulkner County Conway 68 81 84 10 80 87 91 15 Greenbrier 65 79 87 7 74 86 95 4 Guy-Perkins 45 57 71 108 63 83 75 170 Mayflower 44 67 76 60 58 73 76 157 Mt. Vernon-Enola 48 76 78 41 57 83 89 29 Vilonia 70 75 83 14 81 85 88 41
Franklin County Charleston 73 78 75 68 88 80 81 108 County Line 51 55 65 149 55 62 74 177 Ozark 67 72 79 39 73 83 80 122
Fulton County Mammoth Spring 46 80 66 143 68 83 72 194 Salem 68 84 81 27 74 84 93 7 Viola 89 85 74 79 81 85 76 157
Garland County Cutter Morning Star 59 59 67 136 67 81 89 29 Fountain Lake 55 69 77 49 69 74 86 54 Hot Springs 52 51 54 200 62 58 68 209 Jessieville 59 69 75 68 70 83 86 54 Lake Hamilton 68 79 78 41 82 84 87 46 Lakeside 82 79 82 22 86 88 91 15 Mountain Pine 36 46 46 219 64 66 70 203
Grant County Poyen 71 66 78 41 69 64 85 68 Sheridan 71 82 83 14 71 82 83 84
Greene County Marmaduke 59 61 64 153 71 80 81 108 Greene County Tech 56 68 77 49 74 84 82 99 Paragould 60 69 66 143 71 81 76 157
5aspireARKANSAS
Appendix I: Historical Data
Hempstead County Blevins 43 46 53 205 59 73 79 131 Hope 50 44 56 195 60 73 65 222 Spring Hill 70 68 87 7 75 75 91 15
Hot Spring County Bismarck 69 67 83 14 81 84 86 54 Glen Rose 62 65 72 97 61 67 76 157 Magnet Cove 65 66 77 49 73 75 87 46 Malvern 58 67 77 49 65 70 77 147 Ouachita 70 71 64 153 66 75 85 68
Howard County Dierks 54 67 77 49 73 82 91 15 Mineral Springs 43 42 48 215 66 79 74 177 Nashville 58 61 59 180 64 75 74 177
Independence County Batesville 66 75 77 49 78 80 81 108 Cushman 56 74 Southside 58 78 73 89 71 79 83 84 Midland 58 64 73 89 79 83 90 21 Cedar Ridge 49 55 58 187 69 79 80 122
Izard County Calico Rock 56 82 75 68 76 90 80 122 Melbourne 69 63 67 136 88 90 89 29 Izard County Consolidated 50 68 58 187 53 73 76 157
Jackson County Newport 51 68 74 79 70 73 78 138 Jackson County 64 75 92 1 67 81 86 54
Jefferson County Dollarway 26 26 44 224 25 42 60 231 Pine Bluff 19 26 37 231 30 50 62 227 Watson Chapel 40 41 44 224 53 71 70 203 White Hall 59 68 71 108 68 75 83 84
Johnson County Clarksville 62 68 80 31 76 81 87 46 Lamar 63 55 76 60 72 72 90 21 Westside 61 59 75 68 68 78 89 29
Lafayette County Bradley 58 65 44 224 54 74 73 186 Lafayette County 34 44 45 220 40 55 65 222
Lawrence County Hoxie 49 66 74 79 55 69 82 99 Sloan-Hendrix 51 62 74 79 59 69 71 201 Hillcrest 55 60 71 108 63 66 83 84 Lawrence County 55 79 77 49 64 75 87 46
Lee County Lee County 52 45 31 233 44 67 68 209
Lincoln County Star City 62 85 75 68 62 81 81 108
Little River County Ashdown 55 51 66 143 63 60 67 215 Foreman 43 46 75 68 64 62 86 54
Logan County Booneville 67 60 74 79 70 75 83 84 Magazine 77 87 80 31 64 79 77 147 Paris 79 84 90 3 76 84 92 11 Scranton 65 81 77 49 75 83 90 21
Lonoke County Lonoke 60 68 83 14 68 79 83 84 England 42 37 59 180 42 58 67 215 Carlisle 50 62 72 97 71 63 80 122 Cabot 68 75 80 31 80 89 86 54
Madison County Huntsville 71 72 78 41 75 81 89 29
Marion County Flippin 43 50 83 14 67 85 92 11 Yellville-Summit 71 72 80 31 84 90 85 68
Miller County Genoa Central 73 71 72 97 79 89 86 54 Fouke 40 73 61 173 56 70 74 177 Texarkana 41 49 45 220 55 61 61 229
Mississippi County Armorel 58 73 72 97 74 81 78 138 Blytheville 39 40 44 224 52 54 53 236 South Mississippi County 34 58 48 215 58 74 73 186 Gosnell 55 52 67 136 65 78 88 41 Manila 46 48 62 168 65 66 84 75 Osceola 43 30 45 220 60 49 77 147
Monroe County Brinkley 43 49 55 198 45 60 70 203 Clarendon 15 45 19 238 47 71 61 229
Montgomery County Caddo Hills 76 66 58 187 79 67 73 186 Mount Ida 45 62 75 68 53 62 83 84
Nevada County Prescott 58 59 52 207 71 65 67 215 Nevada 38 55 60 178 53 67 68 209
Newton County Jasper 60 62 72 97 71 78 83 84 Deer/Mt. Judea 55 61 54 200 72 60 72 194
Ouachita County Bearden 64 53 51 211 73 80 80 122 Camden-Fairview 50 50 50 213 63 75 73 186 Harmony Grove 60 72 59 180 70 88 81 108 Stephens 23 53 17 239 35 67 48 238
Perry County East End 71 57 57 191 61 80 76 157 Perryville 60 64 63 160 62 76 77 147
Phillips County Barton-Lexa 46 52 52 207 64 68 68 209 Helena/West Helena 23 39 51 211 36 50 64 225 Marvell 28 23 27 237 33 53 48 238
Pike County Delight 42 32 55 76 Centerpoint 57 62 63 160 65 80 78 138 Kirby 33 25 73 89 65 51 79 131 Murfreesboro 45 47 65 67 South Pike County 68 126 78 138
Poinsett County Harrisburg 54 57 62 168 68 73 73 186 Marked Tree 49 70 62 168 54 86 81 108 Trumann 54 69 76 60 61 70 79 131 Weiner 38 47 60 69 East Poinsett County 46 49 57 191 52 79 77 147
Polk County Mena 58 68 66 143 75 80 75 170 Van Cove 51 56 67 70 Wickes 61 53 57 72 Ouachita River 54 63 72 97 72 77 84 75 Cossatot River 57 191 67 215
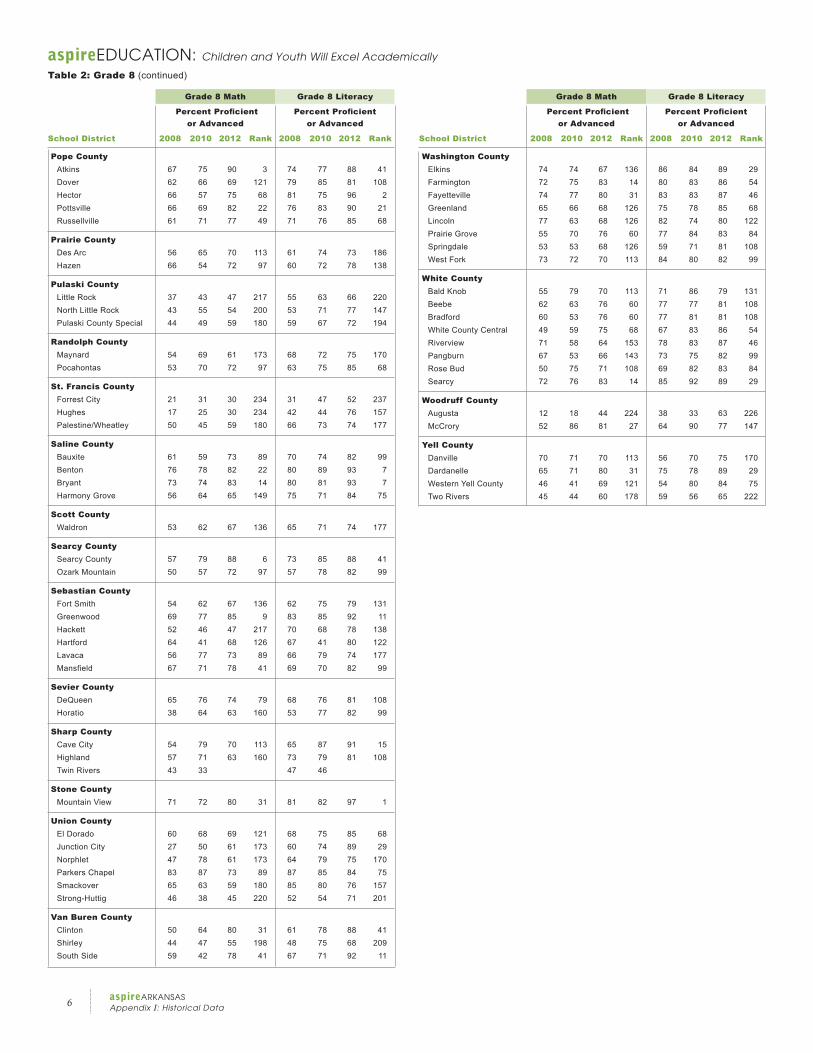
aspireEDUCATION: Children and Youth Will Excel Academically
Table 2: Grade 8 (continued)
Grade 8 Math Grade 8 Literacy
PercentProficient PercentProficient or Advanced or Advanced
School District 2008 2010 2012 Rank 2008 2010 2012 Rank
Grade 8 Math Grade 8 Literacy
PercentProficient PercentProficient or Advanced or Advanced
School District 2008 2010 2012 Rank 2008 2010 2012 Rank
6aspireARKANSASAppendix I: Historical Data
Pope County Atkins 67 75 90 3 74 77 88 41 Dover 62 66 69 121 79 85 81 108 Hector 66 57 75 68 81 75 96 2 Pottsville 66 69 82 22 76 83 90 21 Russellville 61 71 77 49 71 76 85 68
Prairie County Des Arc 56 65 70 113 61 74 73 186 Hazen 66 54 72 97 60 72 78 138
Pulaski County Little Rock 37 43 47 217 55 63 66 220 North Little Rock 43 55 54 200 53 71 77 147 Pulaski County Special 44 49 59 180 59 67 72 194
Randolph County Maynard 54 69 61 173 68 72 75 170 Pocahontas 53 70 72 97 63 75 85 68
St. Francis County Forrest City 21 31 30 234 31 47 52 237 Hughes 17 25 30 234 42 44 76 157 Palestine/Wheatley 50 45 59 180 66 73 74 177
Saline County Bauxite 61 59 73 89 70 74 82 99 Benton 76 78 82 22 80 89 93 7 Bryant 73 74 83 14 80 81 93 7 Harmony Grove 56 64 65 149 75 71 84 75
Scott County Waldron 53 62 67 136 65 71 74 177
Searcy County Searcy County 57 79 88 6 73 85 88 41 Ozark Mountain 50 57 72 97 57 78 82 99
Sebastian County Fort Smith 54 62 67 136 62 75 79 131 Greenwood 69 77 85 9 83 85 92 11 Hackett 52 46 47 217 70 68 78 138 Hartford 64 41 68 126 67 41 80 122 Lavaca 56 77 73 89 66 79 74 177 Mansfield 67 71 78 41 69 70 82 99
Sevier County DeQueen 65 76 74 79 68 76 81 108 Horatio 38 64 63 160 53 77 82 99
Sharp County Cave City 54 79 70 113 65 87 91 15 Highland 57 71 63 160 73 79 81 108 Twin Rivers 43 33 47 46
Stone County Mountain View 71 72 80 31 81 82 97 1
Union County El Dorado 60 68 69 121 68 75 85 68 Junction City 27 50 61 173 60 74 89 29 Norphlet 47 78 61 173 64 79 75 170 Parkers Chapel 83 87 73 89 87 85 84 75 Smackover 65 63 59 180 85 80 76 157 Strong-Huttig 46 38 45 220 52 54 71 201
Van Buren County Clinton 50 64 80 31 61 78 88 41 Shirley 44 47 55 198 48 75 68 209 South Side 59 42 78 41 67 71 92 11
Washington County Elkins 74 74 67 136 86 84 89 29 Farmington 72 75 83 14 80 83 86 54 Fayetteville 74 77 80 31 83 83 87 46 Greenland 65 66 68 126 75 78 85 68 Lincoln 77 63 68 126 82 74 80 122 Prairie Grove 55 70 76 60 77 84 83 84 Springdale 53 53 68 126 59 71 81 108 West Fork 73 72 70 113 84 80 82 99
White County Bald Knob 55 79 70 113 71 86 79 131 Beebe 62 63 76 60 77 77 81 108 Bradford 60 53 76 60 77 81 81 108 White County Central 49 59 75 68 67 83 86 54 Riverview 71 58 64 153 78 83 87 46 Pangburn 67 53 66 143 73 75 82 99 Rose Bud 50 75 71 108 69 82 83 84 Searcy 72 76 83 14 85 92 89 29
Woodruff County Augusta 12 18 44 224 38 33 63 226 McCrory 52 86 81 27 64 90 77 147
Yell County Danville 70 71 70 113 56 70 75 170 Dardanelle 65 71 80 31 75 78 89 29 Western Yell County 46 41 69 121 54 80 84 75 Two Rivers 45 44 60 178 59 56 65 222
aspireEDUCATION: Children and Youth Will Excel Academically
Table 2: Grade 8 (continued)
Grade 8 Math Grade 8 Literacy
PercentProficient PercentProficient or Advanced or Advanced
School District 2008 2010 2012 Rank 2008 2010 2012 Rank
Grade 8 Math Grade 8 Literacy
PercentProficient PercentProficient or Advanced or Advanced
School District 2008 2010 2012 Rank 2008 2010 2012 Rank
7aspireARKANSAS
Appendix I: Historical Data
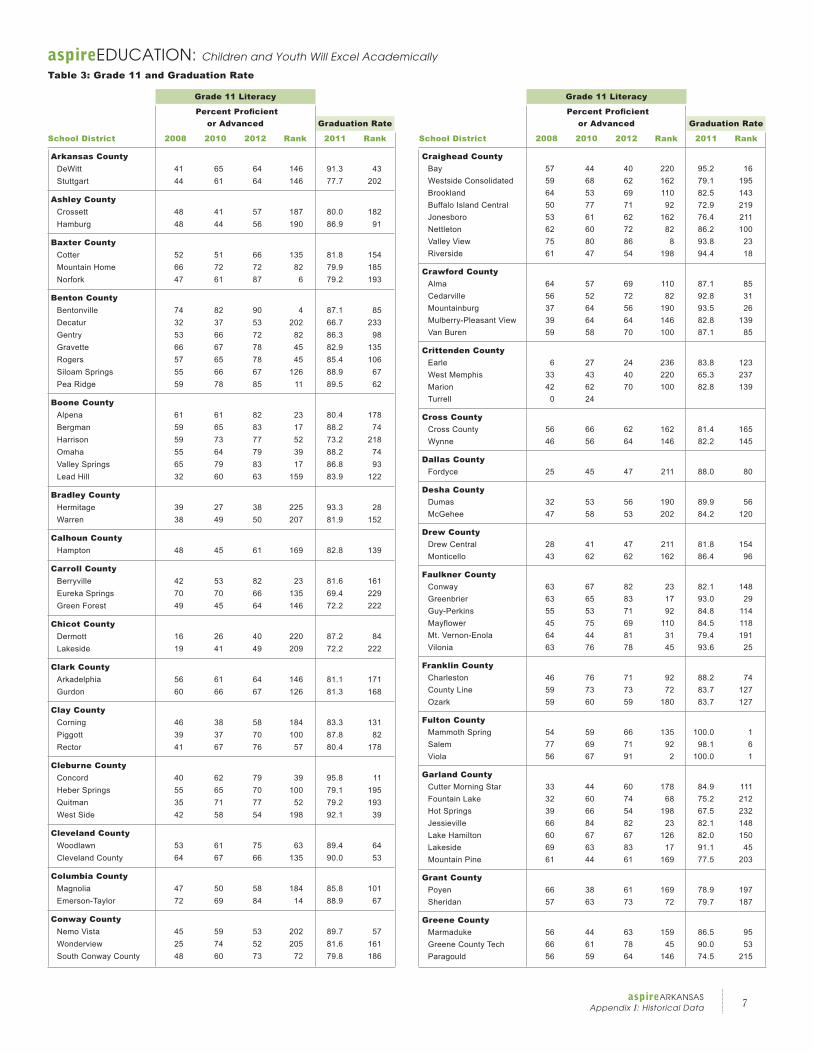
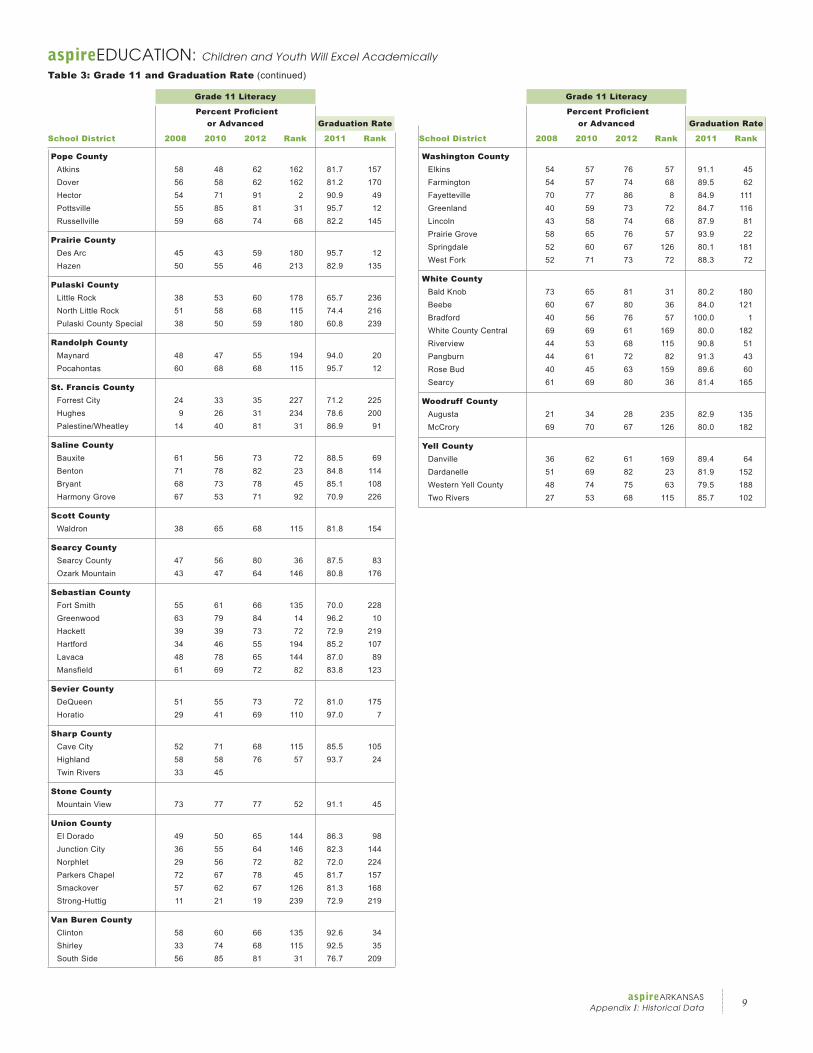
aspireEDUCATION: Children and Youth Will Excel Academically
Table 3: Grade 11 and Graduation Rate
Grade 11 Literacy
PercentProficient or Advanced Graduation Rate
School District 2008 2010 2012 Rank 2011 Rank
Grade 11 Literacy
PercentProficient or Advanced Graduation Rate
School District 2008 2010 2012 Rank 2011 Rank
Arkansas County DeWitt 41 65 64 146 91.3 43 Stuttgart 44 61 64 146 77.7 202
Ashley County Crossett 48 41 57 187 80.0 182 Hamburg 48 44 56 190 86.9 91
Baxter County Cotter 52 51 66 135 81.8 154 Mountain Home 66 72 72 82 79.9 185 Norfork 47 61 87 6 79.2 193
Benton County Bentonville 74 82 90 4 87.1 85 Decatur 32 37 53 202 66.7 233 Gentry 53 66 72 82 86.3 98 Gravette 66 67 78 45 82.9 135 Rogers 57 65 78 45 85.4 106 Siloam Springs 55 66 67 126 88.9 67 Pea Ridge 59 78 85 11 89.5 62
Boone County Alpena 61 61 82 23 80.4 178 Bergman 59 65 83 17 88.2 74 Harrison 59 73 77 52 73.2 218 Omaha 55 64 79 39 88.2 74 Valley Springs 65 79 83 17 86.8 93 Lead Hill 32 60 63 159 83.9 122
Bradley County Hermitage 39 27 38 225 93.3 28 Warren 38 49 50 207 81.9 152
Calhoun County Hampton 48 45 61 169 82.8 139
Carroll County Berryville 42 53 82 23 81.6 161 Eureka Springs 70 70 66 135 69.4 229 Green Forest 49 45 64 146 72.2 222
Chicot County Dermott 16 26 40 220 87.2 84 Lakeside 19 41 49 209 72.2 222
Clark County Arkadelphia 56 61 64 146 81.1 171 Gurdon 60 66 67 126 81.3 168
Clay County Corning 46 38 58 184 83.3 131 Piggott 39 37 70 100 87.8 82 Rector 41 67 76 57 80.4 178
Cleburne County Concord 40 62 79 39 95.8 11 Heber Springs 55 65 70 100 79.1 195 Quitman 35 71 77 52 79.2 193 West Side 42 58 54 198 92.1 39
Cleveland County Woodlawn 53 61 75 63 89.4 64 Cleveland County 64 67 66 135 90.0 53
Columbia County Magnolia 47 50 58 184 85.8 101 Emerson-Taylor 72 69 84 14 88.9 67
Conway County Nemo Vista 45 59 53 202 89.7 57 Wonderview 25 74 52 205 81.6 161 South Conway County 48 60 73 72 79.8 186
Craighead County Bay 57 44 40 220 95.2 16 Westside Consolidated 59 68 62 162 79.1 195 Brookland 64 53 69 110 82.5 143 Buffalo Island Central 50 77 71 92 72.9 219 Jonesboro 53 61 62 162 76.4 211 Nettleton 62 60 72 82 86.2 100 Valley View 75 80 86 8 93.8 23 Riverside 61 47 54 198 94.4 18
Crawford County Alma 64 57 69 110 87.1 85 Cedarville 56 52 72 82 92.8 31 Mountainburg 37 64 56 190 93.5 26 Mulberry-Pleasant View 39 64 64 146 82.8 139 Van Buren 59 58 70 100 87.1 85
Crittenden County Earle 6 27 24 236 83.8 123 West Memphis 33 43 40 220 65.3 237 Marion 42 62 70 100 82.8 139 Turrell 0 24
Cross County Cross County 56 66 62 162 81.4 165 Wynne 46 56 64 146 82.2 145
Dallas County Fordyce 25 45 47 211 88.0 80
Desha County Dumas 32 53 56 190 89.9 56 McGehee 47 58 53 202 84.2 120
Drew County Drew Central 28 41 47 211 81.8 154 Monticello 43 62 62 162 86.4 96
Faulkner County Conway 63 67 82 23 82.1 148 Greenbrier 63 65 83 17 93.0 29 Guy-Perkins 55 53 71 92 84.8 114 Mayflower 45 75 69 110 84.5 118 Mt. Vernon-Enola 64 44 81 31 79.4 191 Vilonia 63 76 78 45 93.6 25
Franklin County Charleston 46 76 71 92 88.2 74 County Line 59 73 73 72 83.7 127 Ozark 59 60 59 180 83.7 127
Fulton County Mammoth Spring 54 59 66 135 100.0 1 Salem 77 69 71 92 98.1 6 Viola 56 67 91 2 100.0 1
Garland County Cutter Morning Star 33 44 60 178 84.9 111 Fountain Lake 32 60 74 68 75.2 212 Hot Springs 39 66 54 198 67.5 232 Jessieville 66 84 82 23 82.1 148 Lake Hamilton 60 67 67 126 82.0 150 Lakeside 69 63 83 17 91.1 45 Mountain Pine 61 44 61 169 77.5 203
Grant County Poyen 66 38 61 169 78.9 197 Sheridan 57 63 73 72 79.7 187
Greene County Marmaduke 56 44 63 159 86.5 95 Greene County Tech 66 61 78 45 90.0 53 Paragould 56 59 64 146 74.5 215
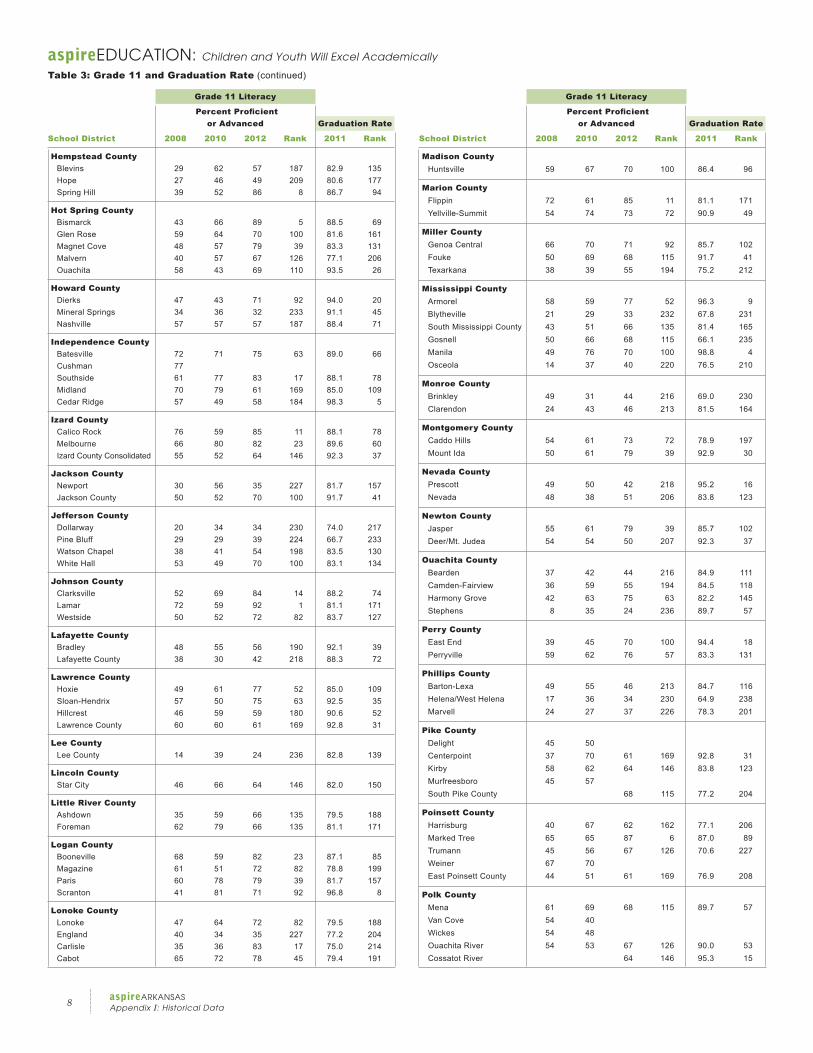
8aspireARKANSASAppendix I: Historical Data
Hempstead County Blevins 29 62 57 187 82.9 135 Hope 27 46 49 209 80.6 177 Spring Hill 39 52 86 8 86.7 94
Hot Spring County Bismarck 43 66 89 5 88.5 69 Glen Rose 59 64 70 100 81.6 161 Magnet Cove 48 57 79 39 83.3 131 Malvern 40 57 67 126 77.1 206 Ouachita 58 43 69 110 93.5 26
Howard County Dierks 47 43 71 92 94.0 20 Mineral Springs 34 36 32 233 91.1 45 Nashville 57 57 57 187 88.4 71
Independence County Batesville 72 71 75 63 89.0 66 Cushman 77 Southside 61 77 83 17 88.1 78 Midland 70 79 61 169 85.0 109 Cedar Ridge 57 49 58 184 98.3 5
Izard County Calico Rock 76 59 85 11 88.1 78 Melbourne 66 80 82 23 89.6 60 Izard County Consolidated 55 52 64 146 92.3 37
Jackson County Newport 30 56 35 227 81.7 157 Jackson County 50 52 70 100 91.7 41
Jefferson County Dollarway 20 34 34 230 74.0 217 Pine Bluff 29 29 39 224 66.7 233 Watson Chapel 38 41 54 198 83.5 130 White Hall 53 49 70 100 83.1 134
Johnson County Clarksville 52 69 84 14 88.2 74 Lamar 72 59 92 1 81.1 171 Westside 50 52 72 82 83.7 127
Lafayette County Bradley 48 55 56 190 92.1 39 Lafayette County 38 30 42 218 88.3 72
Lawrence County Hoxie 49 61 77 52 85.0 109 Sloan-Hendrix 57 50 75 63 92.5 35 Hillcrest 46 59 59 180 90.6 52 Lawrence County 60 60 61 169 92.8 31
Lee County Lee County 14 39 24 236 82.8 139
Lincoln County Star City 46 66 64 146 82.0 150
Little River County Ashdown 35 59 66 135 79.5 188 Foreman 62 79 66 135 81.1 171
Logan County Booneville 68 59 82 23 87.1 85 Magazine 61 51 72 82 78.8 199 Paris 60 78 79 39 81.7 157 Scranton 41 81 71 92 96.8 8
Lonoke County Lonoke 47 64 72 82 79.5 188 England 40 34 35 227 77.2 204 Carlisle 35 36 83 17 75.0 214 Cabot 65 72 78 45 79.4 191
Madison County Huntsville 59 67 70 100 86.4 96
Marion County Flippin 72 61 85 11 81.1 171 Yellville-Summit 54 74 73 72 90.9 49
Miller County Genoa Central 66 70 71 92 85.7 102 Fouke 50 69 68 115 91.7 41 Texarkana 38 39 55 194 75.2 212
Mississippi County Armorel 58 59 77 52 96.3 9 Blytheville 21 29 33 232 67.8 231 South Mississippi County 43 51 66 135 81.4 165 Gosnell 50 66 68 115 66.1 235 Manila 49 76 70 100 98.8 4 Osceola 14 37 40 220 76.5 210
Monroe County Brinkley 49 31 44 216 69.0 230 Clarendon 24 43 46 213 81.5 164
Montgomery County Caddo Hills 54 61 73 72 78.9 197 Mount Ida 50 61 79 39 92.9 30
Nevada County Prescott 49 50 42 218 95.2 16 Nevada 48 38 51 206 83.8 123
Newton County Jasper 55 61 79 39 85.7 102 Deer/Mt. Judea 54 54 50 207 92.3 37
Ouachita County Bearden 37 42 44 216 84.9 111 Camden-Fairview 36 59 55 194 84.5 118 Harmony Grove 42 63 75 63 82.2 145 Stephens 8 35 24 236 89.7 57
Perry County East End 39 45 70 100 94.4 18 Perryville 59 62 76 57 83.3 131
Phillips County Barton-Lexa 49 55 46 213 84.7 116 Helena/West Helena 17 36 34 230 64.9 238 Marvell 24 27 37 226 78.3 201
Pike County Delight 45 50 Centerpoint 37 70 61 169 92.8 31 Kirby 58 62 64 146 83.8 123 Murfreesboro 45 57 South Pike County 68 115 77.2 204
Poinsett County Harrisburg 40 67 62 162 77.1 206 Marked Tree 65 65 87 6 87.0 89 Trumann 45 56 67 126 70.6 227 Weiner 67 70 East Poinsett County 44 51 61 169 76.9 208
Polk County Mena 61 69 68 115 89.7 57 Van Cove 54 40 Wickes 54 48 Ouachita River 54 53 67 126 90.0 53 Cossatot River 64 146 95.3 15
aspireEDUCATION: Children and Youth Will Excel Academically
Table 3: Grade 11 and Graduation Rate (continued)
Grade 11 Literacy
PercentProficient or Advanced Graduation Rate
School District 2008 2010 2012 Rank 2011 Rank
Grade 11 Literacy
PercentProficient or Advanced Graduation Rate
School District 2008 2010 2012 Rank 2011 Rank
9aspireARKANSAS
Appendix I: Historical Data
Pope County Atkins 58 48 62 162 81.7 157 Dover 56 58 62 162 81.2 170 Hector 54 71 91 2 90.9 49 Pottsville 55 85 81 31 95.7 12 Russellville 59 68 74 68 82.2 145
Prairie County Des Arc 45 43 59 180 95.7 12 Hazen 50 55 46 213 82.9 135
Pulaski County Little Rock 38 53 60 178 65.7 236 North Little Rock 51 58 68 115 74.4 216 Pulaski County Special 38 50 59 180 60.8 239
Randolph County Maynard 48 47 55 194 94.0 20 Pocahontas 60 68 68 115 95.7 12
St. Francis County Forrest City 24 33 35 227 71.2 225 Hughes 9 26 31 234 78.6 200 Palestine/Wheatley 14 40 81 31 86.9 91
Saline County Bauxite 61 56 73 72 88.5 69 Benton 71 78 82 23 84.8 114 Bryant 68 73 78 45 85.1 108 Harmony Grove 67 53 71 92 70.9 226
Scott County Waldron 38 65 68 115 81.8 154
Searcy County Searcy County 47 56 80 36 87.5 83 Ozark Mountain 43 47 64 146 80.8 176
Sebastian County Fort Smith 55 61 66 135 70.0 228 Greenwood 63 79 84 14 96.2 10 Hackett 39 39 73 72 72.9 219 Hartford 34 46 55 194 85.2 107 Lavaca 48 78 65 144 87.0 89 Mansfield 61 69 72 82 83.8 123
Sevier County DeQueen 51 55 73 72 81.0 175 Horatio 29 41 69 110 97.0 7
Sharp County Cave City 52 71 68 115 85.5 105 Highland 58 58 76 57 93.7 24 Twin Rivers 33 45
Stone County Mountain View 73 77 77 52 91.1 45
Union County El Dorado 49 50 65 144 86.3 98 Junction City 36 55 64 146 82.3 144 Norphlet 29 56 72 82 72.0 224 Parkers Chapel 72 67 78 45 81.7 157 Smackover 57 62 67 126 81.3 168 Strong-Huttig 11 21 19 239 72.9 219
Van Buren County Clinton 58 60 66 135 92.6 34 Shirley 33 74 68 115 92.5 35 South Side 56 85 81 31 76.7 209
Washington County Elkins 54 57 76 57 91.1 45 Farmington 54 57 74 68 89.5 62 Fayetteville 70 77 86 8 84.9 111 Greenland 40 59 73 72 84.7 116 Lincoln 43 58 74 68 87.9 81 Prairie Grove 58 65 76 57 93.9 22 Springdale 52 60 67 126 80.1 181 West Fork 52 71 73 72 88.3 72
White County Bald Knob 73 65 81 31 80.2 180 Beebe 60 67 80 36 84.0 121 Bradford 40 56 76 57 100.0 1 White County Central 69 69 61 169 80.0 182 Riverview 44 53 68 115 90.8 51 Pangburn 44 61 72 82 91.3 43 Rose Bud 40 45 63 159 89.6 60 Searcy 61 69 80 36 81.4 165
Woodruff County Augusta 21 34 28 235 82.9 135 McCrory 69 70 67 126 80.0 182
Yell County Danville 36 62 61 169 89.4 64 Dardanelle 51 69 82 23 81.9 152 Western Yell County 48 74 75 63 79.5 188 Two Rivers 27 53 68 115 85.7 102
aspireEDUCATION: Children and Youth Will Excel Academically
Table 3: Grade 11 and Graduation Rate (continued)
Grade 11 Literacy
PercentProficient or Advanced Graduation Rate
School District 2008 2010 2012 Rank 2011 Rank
Grade 11 Literacy
PercentProficient or Advanced Graduation Rate
School District 2008 2010 2012 Rank 2011 Rank
10aspireARKANSASAppendix I: Historical Data
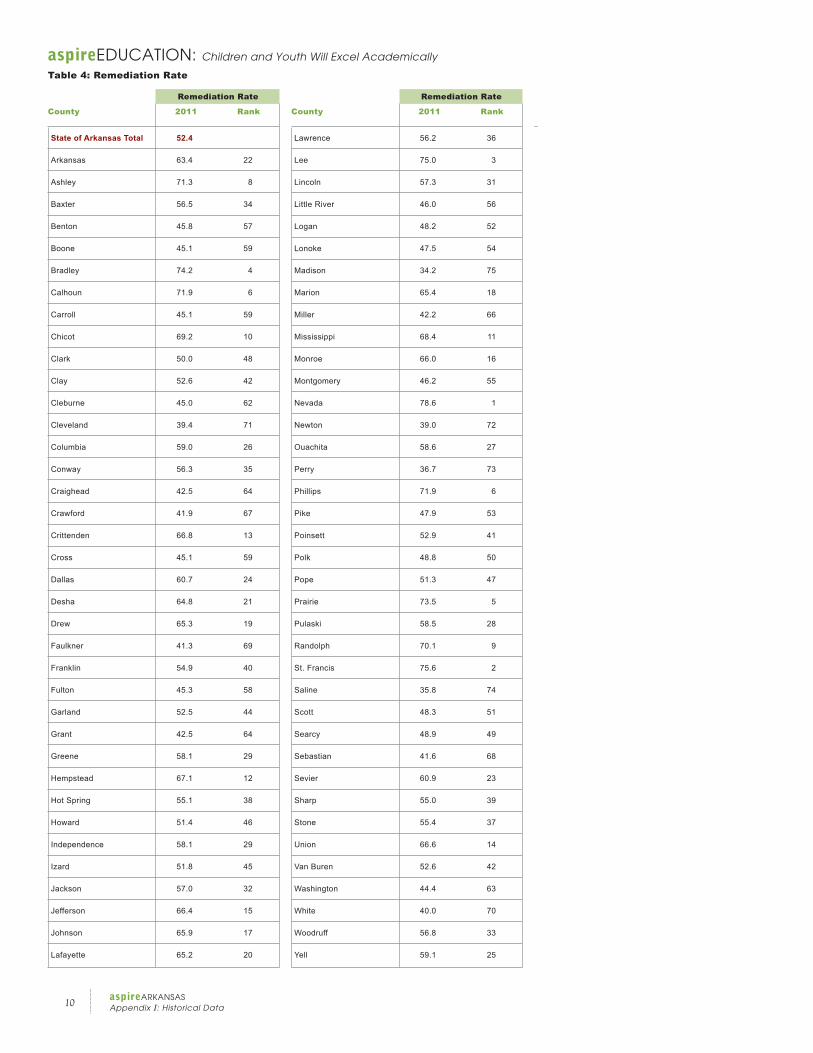
aspireEDUCATION: Children and Youth Will Excel Academically
Table 4: Remediation Rate
Remediation Rate
County 2011 Rank
Remediation Rate
County 2011 Rank
State of Arkansas Total 52.4
Arkansas 63.4 22
Ashley 71.3 8
Baxter 56.5 34
Benton 45.8 57
Boone 45.1 59
Bradley 74.2 4
Calhoun 71.9 6
Carroll 45.1 59
Chicot 69.2 10
Clark 50.0 48
Clay 52.6 42
Cleburne 45.0 62
Cleveland 39.4 71
Columbia 59.0 26
Conway 56.3 35
Craighead 42.5 64
Crawford 41.9 67
Crittenden 66.8 13
Cross 45.1 59
Dallas 60.7 24
Desha 64.8 21
Drew 65.3 19
Faulkner 41.3 69
Franklin 54.9 40
Fulton 45.3 58
Garland 52.5 44
Grant 42.5 64
Greene 58.1 29
Hempstead 67.1 12
Hot Spring 55.1 38
Howard 51.4 46
Independence 58.1 29
Izard 51.8 45
Jackson 57.0 32
Jefferson 66.4 15
Johnson 65.9 17
Lafayette 65.2 20
Lawrence 56.2 36
Lee 75.0 3
Lincoln 57.3 31
Little River 46.0 56
Logan 48.2 52
Lonoke 47.5 54
Madison 34.2 75
Marion 65.4 18
Miller 42.2 66
Mississippi 68.4 11
Monroe 66.0 16
Montgomery 46.2 55
Nevada 78.6 1
Newton 39.0 72
Ouachita 58.6 27
Perry 36.7 73
Phillips 71.9 6
Pike 47.9 53
Poinsett 52.9 41
Polk 48.8 50
Pope 51.3 47
Prairie 73.5 5
Pulaski 58.5 28
Randolph 70.1 9
St. Francis 75.6 2
Saline 35.8 74
Scott 48.3 51
Searcy 48.9 49
Sebastian 41.6 68
Sevier 60.9 23
Sharp 55.0 39
Stone 55.4 37
Union 66.6 14
Van Buren 52.6 42
Washington 44.4 63
White 40.0 70
Woodruff 56.8 33
Yell 59.1 25
11aspireARKANSAS
Appendix I: Historical Data
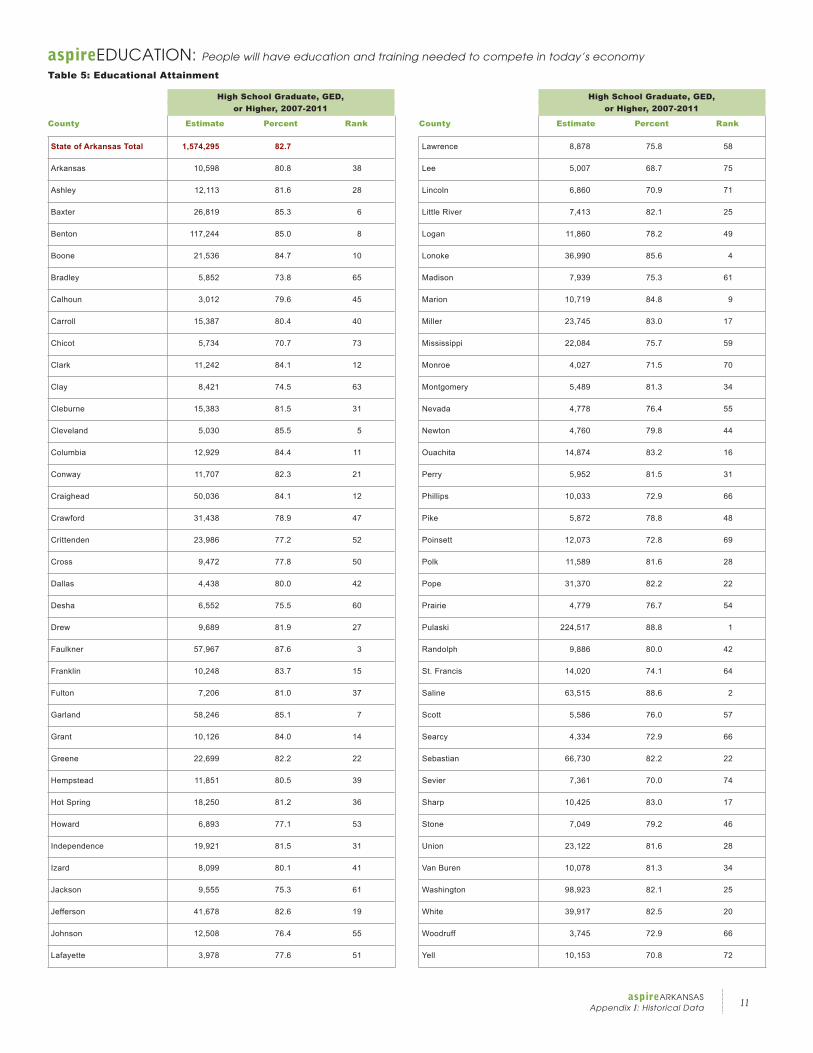
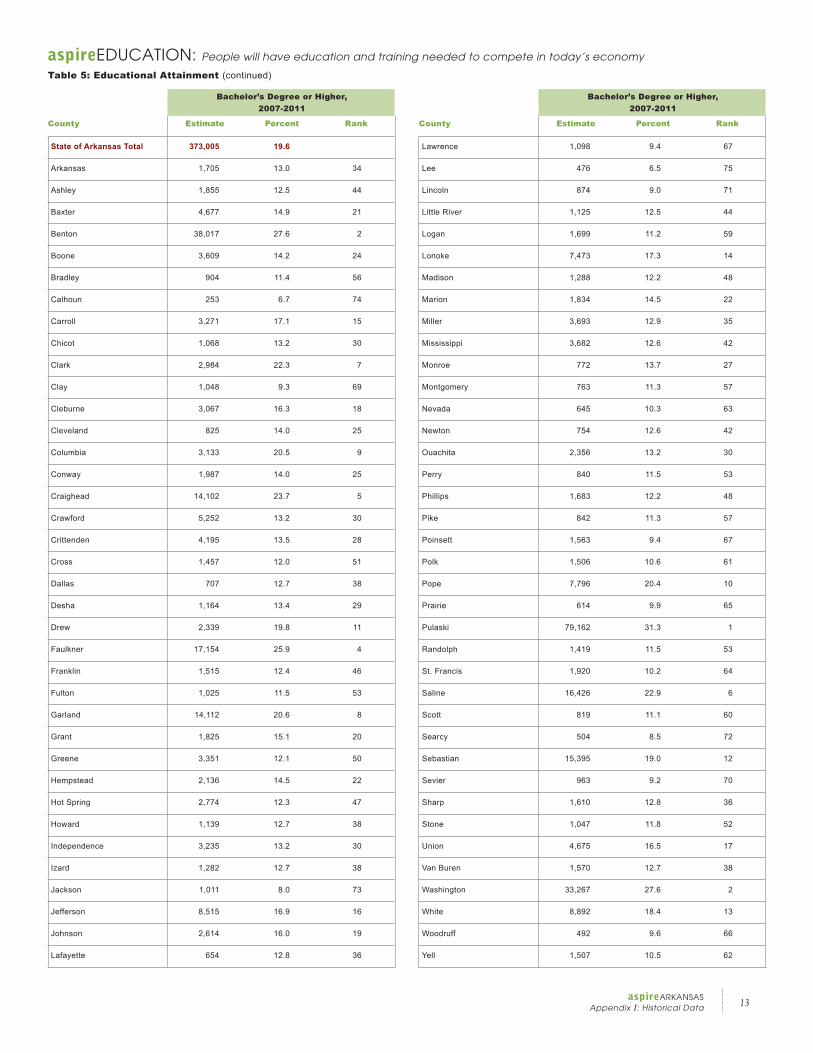
aspireEDUCATION: People will have education and training needed to compete in today’s economy
Table 5: Educational Attainment
High School Graduate, GED, or Higher, 2007-2011
County Estimate Percent Rank
High School Graduate, GED, or Higher, 2007-2011
County Estimate Percent Rank
State of Arkansas Total 1,574,295 82.7
Arkansas 10,598 80.8 38
Ashley 12,113 81.6 28
Baxter 26,819 85.3 6
Benton 117,244 85.0 8
Boone 21,536 84.7 10
Bradley 5,852 73.8 65
Calhoun 3,012 79.6 45
Carroll 15,387 80.4 40
Chicot 5,734 70.7 73
Clark 11,242 84.1 12
Clay 8,421 74.5 63
Cleburne 15,383 81.5 31
Cleveland 5,030 85.5 5
Columbia 12,929 84.4 11
Conway 11,707 82.3 21
Craighead 50,036 84.1 12
Crawford 31,438 78.9 47
Crittenden 23,986 77.2 52
Cross 9,472 77.8 50
Dallas 4,438 80.0 42
Desha 6,552 75.5 60
Drew 9,689 81.9 27
Faulkner 57,967 87.6 3
Franklin 10,248 83.7 15
Fulton 7,206 81.0 37
Garland 58,246 85.1 7
Grant 10,126 84.0 14
Greene 22,699 82.2 22
Hempstead 11,851 80.5 39
Hot Spring 18,250 81.2 36
Howard 6,893 77.1 53
Independence 19,921 81.5 31
Izard 8,099 80.1 41
Jackson 9,555 75.3 61
Jefferson 41,678 82.6 19
Johnson 12,508 76.4 55
Lafayette 3,978 77.6 51
Lawrence 8,878 75.8 58
Lee 5,007 68.7 75
Lincoln 6,860 70.9 71
Little River 7,413 82.1 25
Logan 11,860 78.2 49
Lonoke 36,990 85.6 4
Madison 7,939 75.3 61
Marion 10,719 84.8 9
Miller 23,745 83.0 17
Mississippi 22,084 75.7 59
Monroe 4,027 71.5 70
Montgomery 5,489 81.3 34
Nevada 4,778 76.4 55
Newton 4,760 79.8 44
Ouachita 14,874 83.2 16
Perry 5,952 81.5 31
Phillips 10,033 72.9 66
Pike 5,872 78.8 48
Poinsett 12,073 72.8 69
Polk 11,589 81.6 28
Pope 31,370 82.2 22
Prairie 4,779 76.7 54
Pulaski 224,517 88.8 1
Randolph 9,886 80.0 42
St. Francis 14,020 74.1 64
Saline 63,515 88.6 2
Scott 5,586 76.0 57
Searcy 4,334 72.9 66
Sebastian 66,730 82.2 22
Sevier 7,361 70.0 74
Sharp 10,425 83.0 17
Stone 7,049 79.2 46
Union 23,122 81.6 28
Van Buren 10,078 81.3 34
Washington 98,923 82.1 25
White 39,917 82.5 20
Woodruff 3,745 72.9 66
Yell 10,153 70.8 72
12aspireARKANSASAppendix I: Historical Data
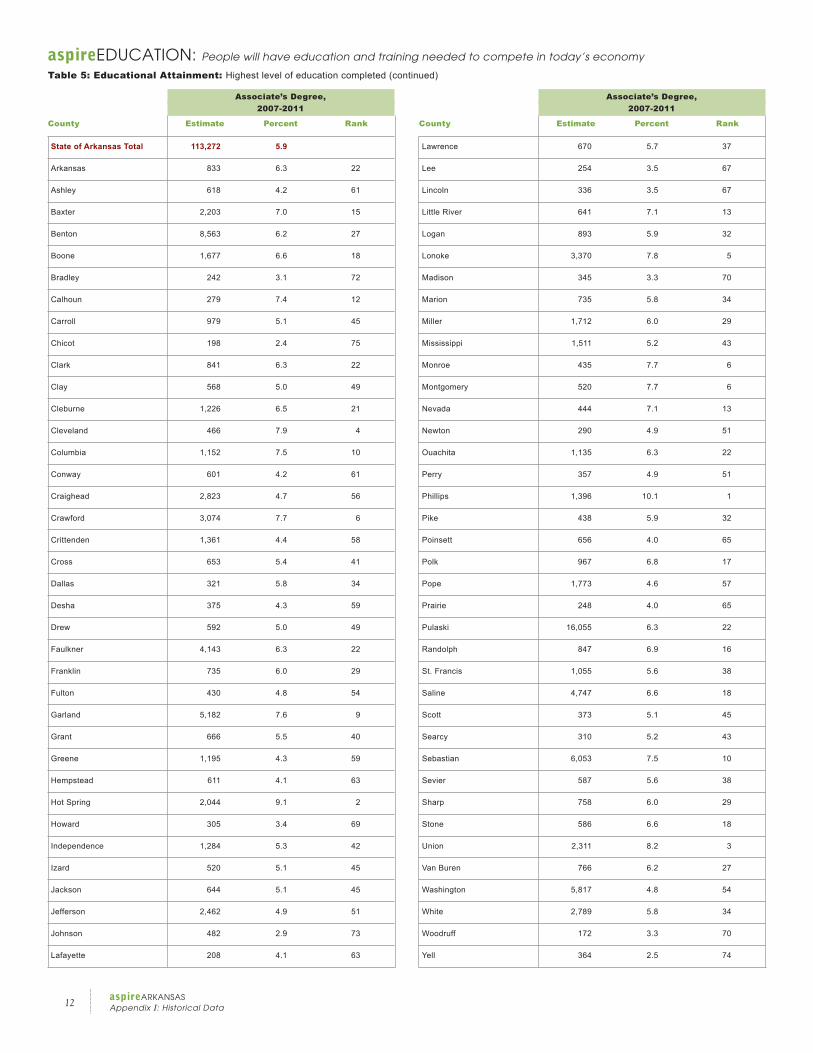
aspireEDUCATION: People will have education and training needed to compete in today’s economy
Table 5: Educational Attainment: Highest level of education completed (continued)
Associate’s Degree, 2007-2011
County Estimate Percent Rank
Associate’s Degree, 2007-2011
County Estimate Percent Rank
State of Arkansas Total 113,272 5.9
Arkansas 833 6.3 22
Ashley 618 4.2 61
Baxter 2,203 7.0 15
Benton 8,563 6.2 27
Boone 1,677 6.6 18
Bradley 242 3.1 72
Calhoun 279 7.4 12
Carroll 979 5.1 45
Chicot 198 2.4 75
Clark 841 6.3 22
Clay 568 5.0 49
Cleburne 1,226 6.5 21
Cleveland 466 7.9 4
Columbia 1,152 7.5 10
Conway 601 4.2 61
Craighead 2,823 4.7 56
Crawford 3,074 7.7 6
Crittenden 1,361 4.4 58
Cross 653 5.4 41
Dallas 321 5.8 34
Desha 375 4.3 59
Drew 592 5.0 49
Faulkner 4,143 6.3 22
Franklin 735 6.0 29
Fulton 430 4.8 54
Garland 5,182 7.6 9
Grant 666 5.5 40
Greene 1,195 4.3 59
Hempstead 611 4.1 63
Hot Spring 2,044 9.1 2
Howard 305 3.4 69
Independence 1,284 5.3 42
Izard 520 5.1 45
Jackson 644 5.1 45
Jefferson 2,462 4.9 51
Johnson 482 2.9 73
Lafayette 208 4.1 63
Lawrence 670 5.7 37
Lee 254 3.5 67
Lincoln 336 3.5 67
Little River 641 7.1 13
Logan 893 5.9 32
Lonoke 3,370 7.8 5
Madison 345 3.3 70
Marion 735 5.8 34
Miller 1,712 6.0 29
Mississippi 1,511 5.2 43
Monroe 435 7.7 6
Montgomery 520 7.7 6
Nevada 444 7.1 13
Newton 290 4.9 51
Ouachita 1,135 6.3 22
Perry 357 4.9 51
Phillips 1,396 10.1 1
Pike 438 5.9 32
Poinsett 656 4.0 65
Polk 967 6.8 17
Pope 1,773 4.6 57
Prairie 248 4.0 65
Pulaski 16,055 6.3 22
Randolph 847 6.9 16
St. Francis 1,055 5.6 38
Saline 4,747 6.6 18
Scott 373 5.1 45
Searcy 310 5.2 43
Sebastian 6,053 7.5 10
Sevier 587 5.6 38
Sharp 758 6.0 29
Stone 586 6.6 18
Union 2,311 8.2 3
Van Buren 766 6.2 27
Washington 5,817 4.8 54
White 2,789 5.8 34
Woodruff 172 3.3 70
Yell 364 2.5 74
13aspireARKANSAS
Appendix I: Historical Data
aspireEDUCATION: People will have education and training needed to compete in today’s economy
Table 5: Educational Attainment (continued)
Bachelor’s Degree or Higher, 2007-2011
County Estimate Percent Rank
Bachelor’s Degree or Higher, 2007-2011
County Estimate Percent Rank
State of Arkansas Total 373,005 19.6
Arkansas 1,705 13.0 34
Ashley 1,855 12.5 44
Baxter 4,677 14.9 21
Benton 38,017 27.6 2
Boone 3,609 14.2 24
Bradley 904 11.4 56
Calhoun 253 6.7 74
Carroll 3,271 17.1 15
Chicot 1,068 13.2 30
Clark 2,984 22.3 7
Clay 1,048 9.3 69
Cleburne 3,067 16.3 18
Cleveland 825 14.0 25
Columbia 3,133 20.5 9
Conway 1,987 14.0 25
Craighead 14,102 23.7 5
Crawford 5,252 13.2 30
Crittenden 4,195 13.5 28
Cross 1,457 12.0 51
Dallas 707 12.7 38
Desha 1,164 13.4 29
Drew 2,339 19.8 11
Faulkner 17,154 25.9 4
Franklin 1,515 12.4 46
Fulton 1,025 11.5 53
Garland 14,112 20.6 8
Grant 1,825 15.1 20
Greene 3,351 12.1 50
Hempstead 2,136 14.5 22
Hot Spring 2,774 12.3 47
Howard 1,139 12.7 38
Independence 3,235 13.2 30
Izard 1,282 12.7 38
Jackson 1,011 8.0 73
Jefferson 8,515 16.9 16
Johnson 2,614 16.0 19
Lafayette 654 12.8 36
Lawrence 1,098 9.4 67
Lee 476 6.5 75
Lincoln 874 9.0 71
Little River 1,125 12.5 44
Logan 1,699 11.2 59
Lonoke 7,473 17.3 14
Madison 1,288 12.2 48
Marion 1,834 14.5 22
Miller 3,693 12.9 35
Mississippi 3,682 12.6 42
Monroe 772 13.7 27
Montgomery 763 11.3 57
Nevada 645 10.3 63
Newton 754 12.6 42
Ouachita 2,356 13.2 30
Perry 840 11.5 53
Phillips 1,683 12.2 48
Pike 842 11.3 57
Poinsett 1,563 9.4 67
Polk 1,506 10.6 61
Pope 7,796 20.4 10
Prairie 614 9.9 65
Pulaski 79,162 31.3 1
Randolph 1,419 11.5 53
St. Francis 1,920 10.2 64
Saline 16,426 22.9 6
Scott 819 11.1 60
Searcy 504 8.5 72
Sebastian 15,395 19.0 12
Sevier 963 9.2 70
Sharp 1,610 12.8 36
Stone 1,047 11.8 52
Union 4,675 16.5 17
Van Buren 1,570 12.7 38
Washington 33,267 27.6 2
White 8,892 18.4 13
Woodruff 492 9.6 66
Yell 1,507 10.5 62
14aspireARKANSASAppendix I: Historical Data
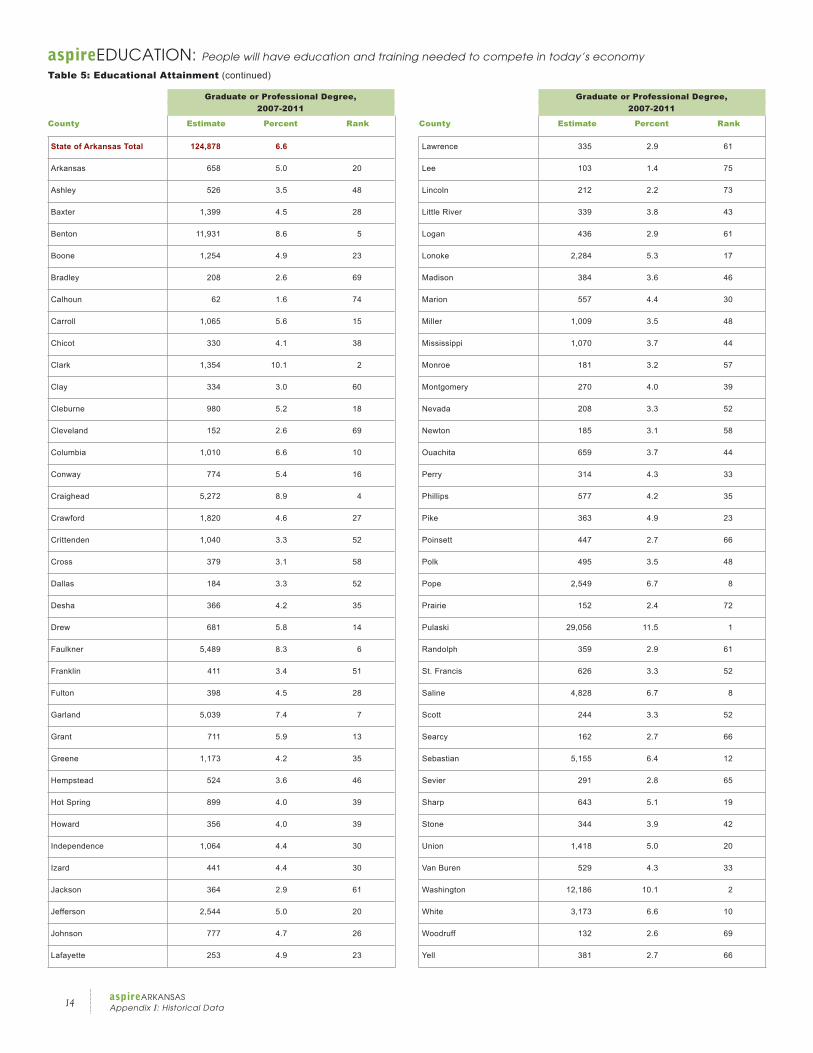
aspireEDUCATION: People will have education and training needed to compete in today’s economy
Table 5: Educational Attainment (continued)
Graduate or Professional Degree, 2007-2011
County Estimate Percent Rank
Graduate or Professional Degree, 2007-2011
County Estimate Percent Rank
State of Arkansas Total 124,878 6.6
Arkansas 658 5.0 20
Ashley 526 3.5 48
Baxter 1,399 4.5 28
Benton 11,931 8.6 5
Boone 1,254 4.9 23
Bradley 208 2.6 69
Calhoun 62 1.6 74
Carroll 1,065 5.6 15
Chicot 330 4.1 38
Clark 1,354 10.1 2
Clay 334 3.0 60
Cleburne 980 5.2 18
Cleveland 152 2.6 69
Columbia 1,010 6.6 10
Conway 774 5.4 16
Craighead 5,272 8.9 4
Crawford 1,820 4.6 27
Crittenden 1,040 3.3 52
Cross 379 3.1 58
Dallas 184 3.3 52
Desha 366 4.2 35
Drew 681 5.8 14
Faulkner 5,489 8.3 6
Franklin 411 3.4 51
Fulton 398 4.5 28
Garland 5,039 7.4 7
Grant 711 5.9 13
Greene 1,173 4.2 35
Hempstead 524 3.6 46
Hot Spring 899 4.0 39
Howard 356 4.0 39
Independence 1,064 4.4 30
Izard 441 4.4 30
Jackson 364 2.9 61
Jefferson 2,544 5.0 20
Johnson 777 4.7 26
Lafayette 253 4.9 23
Lawrence 335 2.9 61
Lee 103 1.4 75
Lincoln 212 2.2 73
Little River 339 3.8 43
Logan 436 2.9 61
Lonoke 2,284 5.3 17
Madison 384 3.6 46
Marion 557 4.4 30
Miller 1,009 3.5 48
Mississippi 1,070 3.7 44
Monroe 181 3.2 57
Montgomery 270 4.0 39
Nevada 208 3.3 52
Newton 185 3.1 58
Ouachita 659 3.7 44
Perry 314 4.3 33
Phillips 577 4.2 35
Pike 363 4.9 23
Poinsett 447 2.7 66
Polk 495 3.5 48
Pope 2,549 6.7 8
Prairie 152 2.4 72
Pulaski 29,056 11.5 1
Randolph 359 2.9 61
St. Francis 626 3.3 52
Saline 4,828 6.7 8
Scott 244 3.3 52
Searcy 162 2.7 66
Sebastian 5,155 6.4 12
Sevier 291 2.8 65
Sharp 643 5.1 19
Stone 344 3.9 42
Union 1,418 5.0 20
Van Buren 529 4.3 33
Washington 12,186 10.1 2
White 3,173 6.6 10
Woodruff 132 2.6 69
Yell 381 2.7 66
15aspireARKANSAS
Appendix I: Historical Data
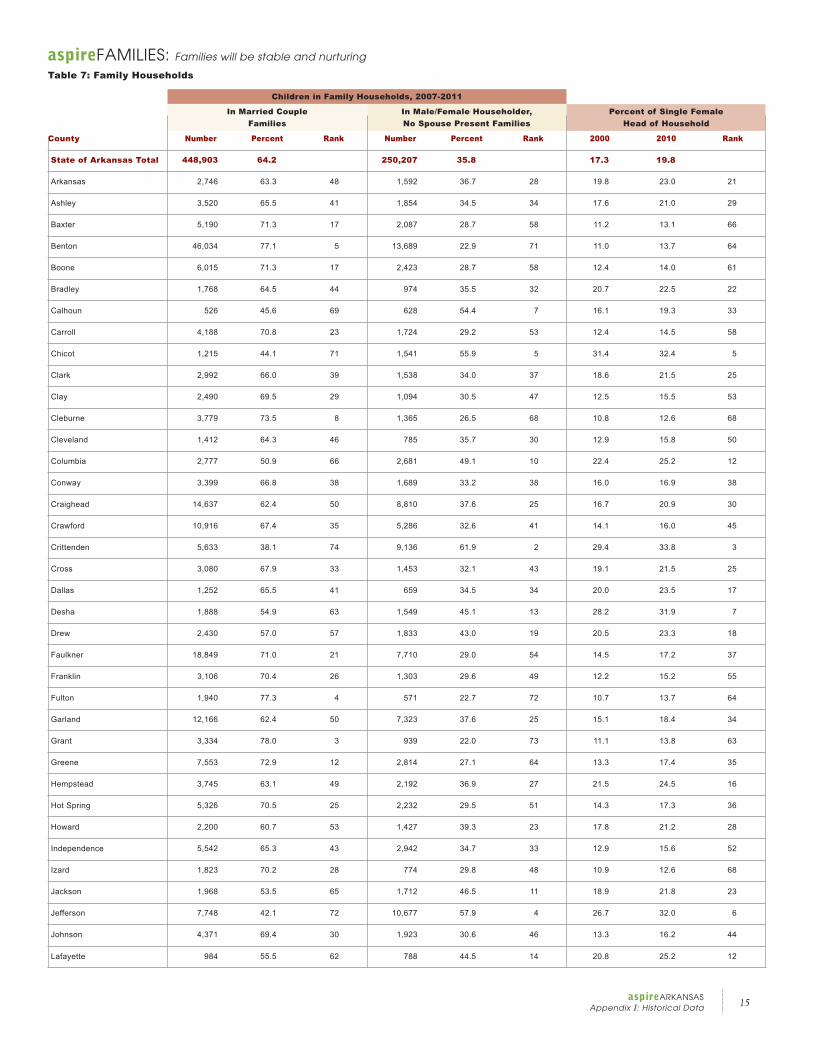
aspireFAMILIES: Families will be stable and nurturing
Table 7: Family Households
Children in Family Households, 2007-2011
In Married Couple In Male/Female Householder, Percent of Single Female Families No Spouse Present Families Head of Household
County Number Percent Rank Number Percent Rank 2000 2010 Rank
State of Arkansas Total 448,903 64.2 250,207 35.8 17.3 19.8
Arkansas 2,746 63.3 48 1,592 36.7 28 19.8 23.0 21
Ashley 3,520 65.5 41 1,854 34.5 34 17.6 21.0 29
Baxter 5,190 71.3 17 2,087 28.7 58 11.2 13.1 66
Benton 46,034 77.1 5 13,689 22.9 71 11.0 13.7 64
Boone 6,015 71.3 17 2,423 28.7 58 12.4 14.0 61
Bradley 1,768 64.5 44 974 35.5 32 20.7 22.5 22
Calhoun 526 45.6 69 628 54.4 7 16.1 19.3 33
Carroll 4,188 70.8 23 1,724 29.2 53 12.4 14.5 58
Chicot 1,215 44.1 71 1,541 55.9 5 31.4 32.4 5
Clark 2,992 66.0 39 1,538 34.0 37 18.6 21.5 25
Clay 2,490 69.5 29 1,094 30.5 47 12.5 15.5 53
Cleburne 3,779 73.5 8 1,365 26.5 68 10.8 12.6 68
Cleveland 1,412 64.3 46 785 35.7 30 12.9 15.8 50
Columbia 2,777 50.9 66 2,681 49.1 10 22.4 25.2 12
Conway 3,399 66.8 38 1,689 33.2 38 16.0 16.9 38
Craighead 14,637 62.4 50 8,810 37.6 25 16.7 20.9 30
Crawford 10,916 67.4 35 5,286 32.6 41 14.1 16.0 45
Crittenden 5,633 38.1 74 9,136 61.9 2 29.4 33.8 3
Cross 3,080 67.9 33 1,453 32.1 43 19.1 21.5 25
Dallas 1,252 65.5 41 659 34.5 34 20.0 23.5 17
Desha 1,888 54.9 63 1,549 45.1 13 28.2 31.9 7
Drew 2,430 57.0 57 1,833 43.0 19 20.5 23.3 18
Faulkner 18,849 71.0 21 7,710 29.0 54 14.5 17.2 37
Franklin 3,106 70.4 26 1,303 29.6 49 12.2 15.2 55
Fulton 1,940 77.3 4 571 22.7 72 10.7 13.7 64
Garland 12,166 62.4 50 7,323 37.6 25 15.1 18.4 34
Grant 3,334 78.0 3 939 22.0 73 11.1 13.8 63
Greene 7,553 72.9 12 2,814 27.1 64 13.3 17.4 35
Hempstead 3,745 63.1 49 2,192 36.9 27 21.5 24.5 16
Hot Spring 5,326 70.5 25 2,232 29.5 51 14.3 17.3 36
Howard 2,200 60.7 53 1,427 39.3 23 17.8 21.2 28
Independence 5,542 65.3 43 2,942 34.7 33 12.9 15.6 52
Izard 1,823 70.2 28 774 29.8 48 10.9 12.6 68
Jackson 1,968 53.5 65 1,712 46.5 11 18.9 21.8 23
Jefferson 7,748 42.1 72 10,677 57.9 4 26.7 32.0 6
Johnson 4,371 69.4 30 1,923 30.6 46 13.3 16.2 44
Lafayette 984 55.5 62 788 44.5 14 20.8 25.2 12
16aspireARKANSASAppendix I: Historical Data
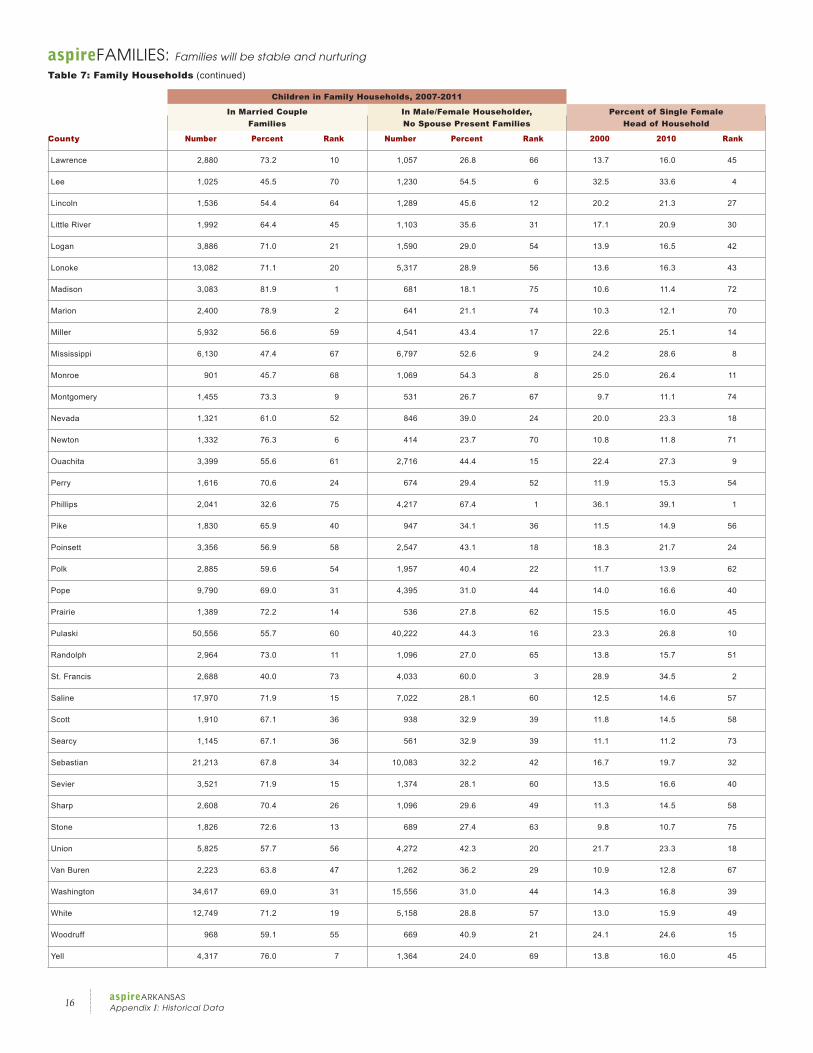
Children in Family Households, 2007-2011
In Married Couple In Male/Female Householder, Percent of Single Female Families No Spouse Present Families Head of Household
County Number Percent Rank Number Percent Rank 2000 2010 Rank
Lawrence 2,880 73.2 10 1,057 26.8 66 13.7 16.0 45
Lee 1,025 45.5 70 1,230 54.5 6 32.5 33.6 4
Lincoln 1,536 54.4 64 1,289 45.6 12 20.2 21.3 27
Little River 1,992 64.4 45 1,103 35.6 31 17.1 20.9 30
Logan 3,886 71.0 21 1,590 29.0 54 13.9 16.5 42
Lonoke 13,082 71.1 20 5,317 28.9 56 13.6 16.3 43
Madison 3,083 81.9 1 681 18.1 75 10.6 11.4 72
Marion 2,400 78.9 2 641 21.1 74 10.3 12.1 70
Miller 5,932 56.6 59 4,541 43.4 17 22.6 25.1 14
Mississippi 6,130 47.4 67 6,797 52.6 9 24.2 28.6 8
Monroe 901 45.7 68 1,069 54.3 8 25.0 26.4 11
Montgomery 1,455 73.3 9 531 26.7 67 9.7 11.1 74
Nevada 1,321 61.0 52 846 39.0 24 20.0 23.3 18
Newton 1,332 76.3 6 414 23.7 70 10.8 11.8 71
Ouachita 3,399 55.6 61 2,716 44.4 15 22.4 27.3 9
Perry 1,616 70.6 24 674 29.4 52 11.9 15.3 54
Phillips 2,041 32.6 75 4,217 67.4 1 36.1 39.1 1
Pike 1,830 65.9 40 947 34.1 36 11.5 14.9 56
Poinsett 3,356 56.9 58 2,547 43.1 18 18.3 21.7 24
Polk 2,885 59.6 54 1,957 40.4 22 11.7 13.9 62
Pope 9,790 69.0 31 4,395 31.0 44 14.0 16.6 40
Prairie 1,389 72.2 14 536 27.8 62 15.5 16.0 45
Pulaski 50,556 55.7 60 40,222 44.3 16 23.3 26.8 10
Randolph 2,964 73.0 11 1,096 27.0 65 13.8 15.7 51
St. Francis 2,688 40.0 73 4,033 60.0 3 28.9 34.5 2
Saline 17,970 71.9 15 7,022 28.1 60 12.5 14.6 57
Scott 1,910 67.1 36 938 32.9 39 11.8 14.5 58
Searcy 1,145 67.1 36 561 32.9 39 11.1 11.2 73
Sebastian 21,213 67.8 34 10,083 32.2 42 16.7 19.7 32
Sevier 3,521 71.9 15 1,374 28.1 60 13.5 16.6 40
Sharp 2,608 70.4 26 1,096 29.6 49 11.3 14.5 58
Stone 1,826 72.6 13 689 27.4 63 9.8 10.7 75
Union 5,825 57.7 56 4,272 42.3 20 21.7 23.3 18
Van Buren 2,223 63.8 47 1,262 36.2 29 10.9 12.8 67
Washington 34,617 69.0 31 15,556 31.0 44 14.3 16.8 39
White 12,749 71.2 19 5,158 28.8 57 13.0 15.9 49
Woodruff 968 59.1 55 669 40.9 21 24.1 24.6 15
Yell 4,317 76.0 7 1,364 24.0 69 13.8 16.0 45
aspireFAMILIES: Families will be stable and nurturing
Table 7: Family Households (continued)
17aspireARKANSAS
Appendix I: Historical Data
aspireFAMILIES: Families will be stable and nurturing
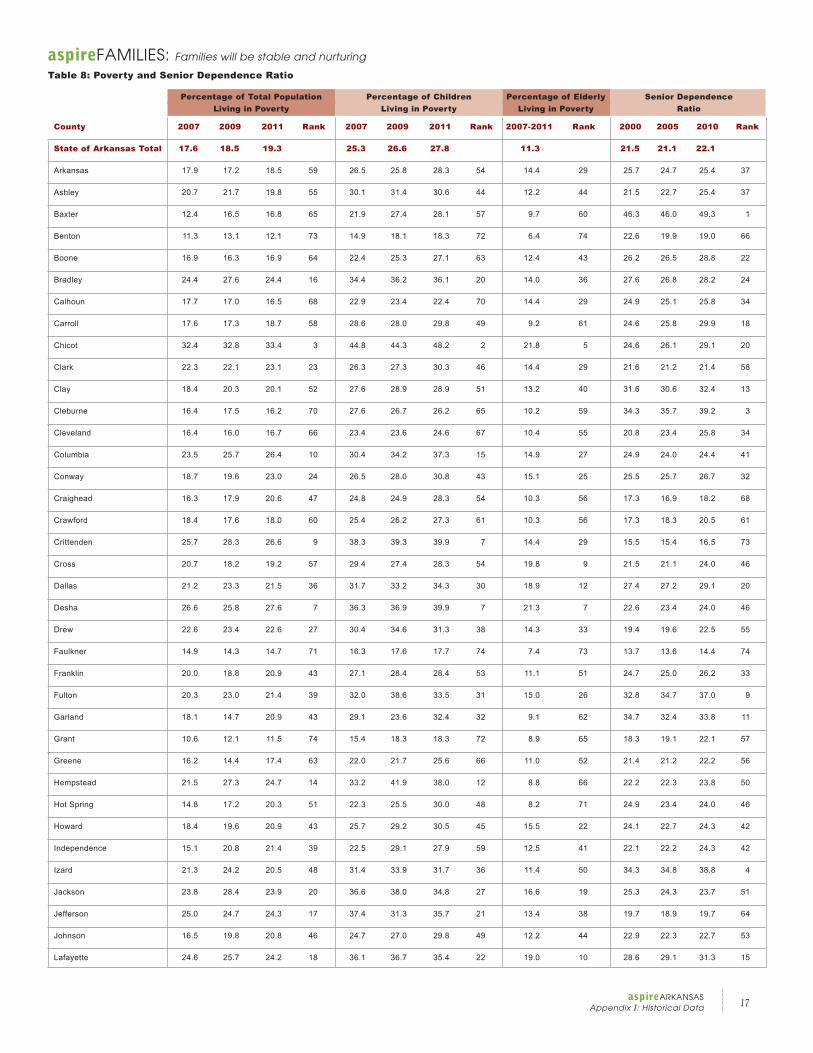
Table 8: Poverty and Senior Dependence Ratio
Percentage of Total Population Percentage of Children Percentage of Elderly Senior Dependence Living in Poverty Living in Poverty Living in Poverty Ratio
County 2007 2009 2011 Rank 2007 2009 2011 Rank 2007-2011 Rank 2000 2005 2010 Rank
State of Arkansas Total 17.6 18.5 19.3 25.3 26.6 27.8 11.3 21.5 21.1 22.1
Arkansas 17.9 17.2 18.5 59 26.5 25.8 28.3 54 14.4 29 25.7 24.7 25.4 37
Ashley 20.7 21.7 19.8 55 30.1 31.4 30.6 44 12.2 44 21.5 22.7 25.4 37
Baxter 12.4 16.5 16.8 65 21.9 27.4 28.1 57 9.7 60 46.3 46.0 49.3 1
Benton 11.3 13.1 12.1 73 14.9 18.1 18.3 72 6.4 74 22.6 19.9 19.0 66
Boone 16.9 16.3 16.9 64 22.4 25.3 27.1 63 12.4 43 26.2 26.5 28.8 22
Bradley 24.4 27.6 24.4 16 34.4 36.2 36.1 20 14.0 36 27.6 26.8 28.2 24
Calhoun 17.7 17.0 16.5 68 22.9 23.4 22.4 70 14.4 29 24.9 25.1 25.8 34
Carroll 17.6 17.3 18.7 58 28.6 28.0 29.8 49 9.2 61 24.6 25.8 29.9 18
Chicot 32.4 32.8 33.4 3 44.8 44.3 48.2 2 21.8 5 24.6 26.1 29.1 20
Clark 22.3 22.1 23.1 23 26.3 27.3 30.3 46 14.4 29 21.6 21.2 21.4 58
Clay 18.4 20.3 20.1 52 27.6 28.9 28.9 51 13.2 40 31.6 30.6 32.4 13
Cleburne 16.4 17.5 16.2 70 27.6 26.7 26.2 65 10.2 59 34.3 35.7 39.2 3
Cleveland 16.4 16.0 16.7 66 23.4 23.6 24.6 67 10.4 55 20.8 23.4 25.8 34
Columbia 23.5 25.7 26.4 10 30.4 34.2 37.3 15 14.9 27 24.9 24.0 24.4 41
Conway 18.7 19.6 23.0 24 26.5 28.0 30.8 43 15.1 25 25.5 25.7 26.7 32
Craighead 16.3 17.9 20.6 47 24.8 24.9 28.3 54 10.3 56 17.3 16.9 18.2 68
Crawford 18.4 17.6 18.0 60 25.4 26.2 27.3 61 10.3 56 17.3 18.3 20.5 61
Crittenden 25.7 28.3 26.6 9 38.3 39.3 39.9 7 14.4 29 15.5 15.4 16.5 73
Cross 20.7 18.2 19.2 57 29.4 27.4 28.3 54 19.8 9 21.5 21.1 24.0 46
Dallas 21.2 23.3 21.5 36 31.7 33.2 34.3 30 18.9 12 27.4 27.2 29.1 20
Desha 26.6 25.8 27.6 7 36.3 36.9 39.9 7 21.3 7 22.6 23.4 24.0 46
Drew 22.6 23.4 22.6 27 30.4 34.6 31.3 38 14.3 33 19.4 19.6 22.5 55
Faulkner 14.9 14.3 14.7 71 16.3 17.6 17.7 74 7.4 73 13.7 13.6 14.4 74
Franklin 20.0 18.8 20.9 43 27.1 28.4 28.4 53 11.1 51 24.7 25.0 26.2 33
Fulton 20.3 23.0 21.4 39 32.0 38.6 33.5 31 15.0 26 32.8 34.7 37.0 9
Garland 18.1 14.7 20.9 43 29.1 23.6 32.4 32 9.1 62 34.7 32.4 33.8 11
Grant 10.6 12.1 11.5 74 15.4 18.3 18.3 72 8.9 65 18.3 19.1 22.1 57
Greene 16.2 14.4 17.4 63 22.0 21.7 25.6 66 11.0 52 21.4 21.2 22.2 56
Hempstead 21.5 27.3 24.7 14 33.2 41.9 38.0 12 8.8 66 22.2 22.3 23.8 50
Hot Spring 14.8 17.2 20.3 51 22.3 25.5 30.0 48 8.2 71 24.9 23.4 24.0 46
Howard 18.4 19.6 20.9 43 25.7 29.2 30.5 45 15.5 22 24.1 22.7 24.3 42
Independence 15.1 20.8 21.4 39 22.5 29.1 27.9 59 12.5 41 22.1 22.2 24.3 42
Izard 21.3 24.2 20.5 48 31.4 33.9 31.7 36 11.4 50 34.3 34.8 38.8 4
Jackson 23.8 28.4 23.9 20 36.6 38.0 34.8 27 16.6 19 25.3 24.3 23.7 51
Jefferson 25.0 24.7 24.3 17 37.4 31.3 35.7 21 13.4 38 19.7 18.9 19.7 64
Johnson 16.5 19.8 20.8 46 24.7 27.0 29.8 49 12.2 44 22.9 22.3 22.7 53
Lafayette 24.6 25.7 24.2 18 36.1 36.7 35.4 22 19.0 10 28.6 29.1 31.3 15
18aspireARKANSASAppendix I: Historical Data
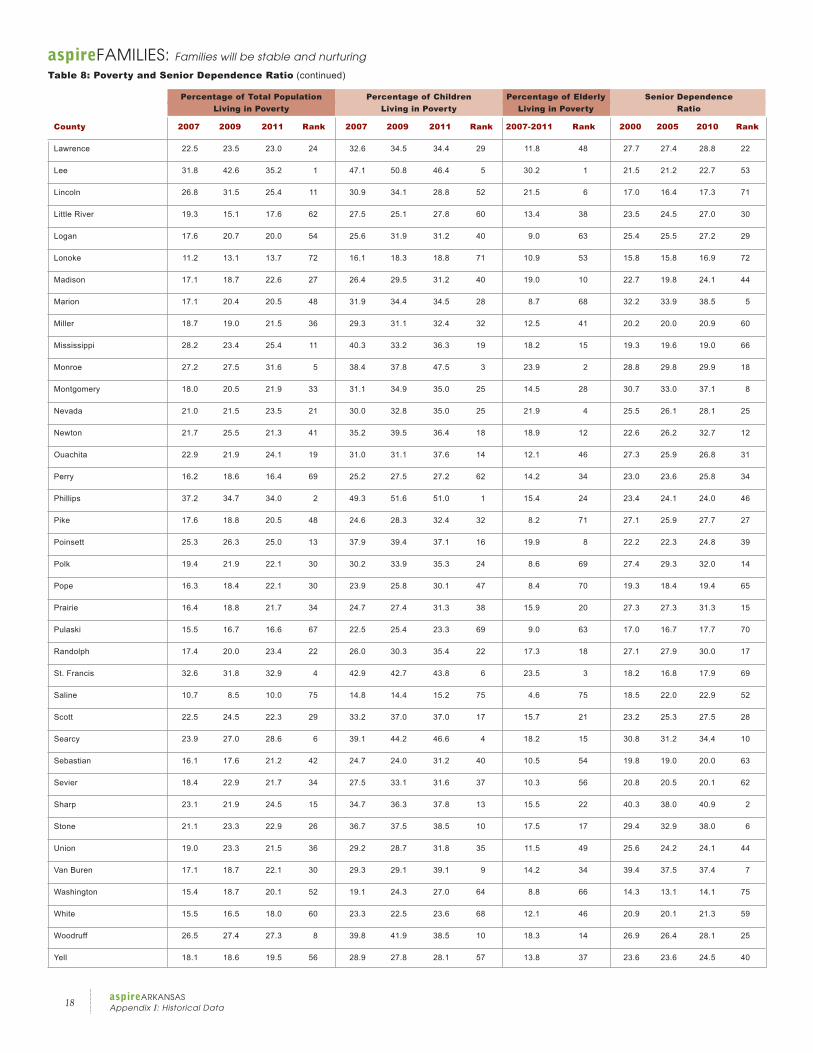
aspireFAMILIES: Families will be stable and nurturing
Table 8: Poverty and Senior Dependence Ratio (continued)
Percentage of Total Population Percentage of Children Percentage of Elderly Senior Dependence Living in Poverty Living in Poverty Living in Poverty Ratio
County 2007 2009 2011 Rank 2007 2009 2011 Rank 2007-2011 Rank 2000 2005 2010 Rank
Lawrence 22.5 23.5 23.0 24 32.6 34.5 34.4 29 11.8 48 27.7 27.4 28.8 22
Lee 31.8 42.6 35.2 1 47.1 50.8 46.4 5 30.2 1 21.5 21.2 22.7 53
Lincoln 26.8 31.5 25.4 11 30.9 34.1 28.8 52 21.5 6 17.0 16.4 17.3 71
Little River 19.3 15.1 17.6 62 27.5 25.1 27.8 60 13.4 38 23.5 24.5 27.0 30
Logan 17.6 20.7 20.0 54 25.6 31.9 31.2 40 9.0 63 25.4 25.5 27.2 29
Lonoke 11.2 13.1 13.7 72 16.1 18.3 18.8 71 10.9 53 15.8 15.8 16.9 72
Madison 17.1 18.7 22.6 27 26.4 29.5 31.2 40 19.0 10 22.7 19.8 24.1 44
Marion 17.1 20.4 20.5 48 31.9 34.4 34.5 28 8.7 68 32.2 33.9 38.5 5
Miller 18.7 19.0 21.5 36 29.3 31.1 32.4 32 12.5 41 20.2 20.0 20.9 60
Mississippi 28.2 23.4 25.4 11 40.3 33.2 36.3 19 18.2 15 19.3 19.6 19.0 66
Monroe 27.2 27.5 31.6 5 38.4 37.8 47.5 3 23.9 2 28.8 29.8 29.9 18
Montgomery 18.0 20.5 21.9 33 31.1 34.9 35.0 25 14.5 28 30.7 33.0 37.1 8
Nevada 21.0 21.5 23.5 21 30.0 32.8 35.0 25 21.9 4 25.5 26.1 28.1 25
Newton 21.7 25.5 21.3 41 35.2 39.5 36.4 18 18.9 12 22.6 26.2 32.7 12
Ouachita 22.9 21.9 24.1 19 31.0 31.1 37.6 14 12.1 46 27.3 25.9 26.8 31
Perry 16.2 18.6 16.4 69 25.2 27.5 27.2 62 14.2 34 23.0 23.6 25.8 34
Phillips 37.2 34.7 34.0 2 49.3 51.6 51.0 1 15.4 24 23.4 24.1 24.0 46
Pike 17.6 18.8 20.5 48 24.6 28.3 32.4 32 8.2 71 27.1 25.9 27.7 27
Poinsett 25.3 26.3 25.0 13 37.9 39.4 37.1 16 19.9 8 22.2 22.3 24.8 39
Polk 19.4 21.9 22.1 30 30.2 33.9 35.3 24 8.6 69 27.4 29.3 32.0 14
Pope 16.3 18.4 22.1 30 23.9 25.8 30.1 47 8.4 70 19.3 18.4 19.4 65
Prairie 16.4 18.8 21.7 34 24.7 27.4 31.3 38 15.9 20 27.3 27.3 31.3 15
Pulaski 15.5 16.7 16.6 67 22.5 25.4 23.3 69 9.0 63 17.0 16.7 17.7 70
Randolph 17.4 20.0 23.4 22 26.0 30.3 35.4 22 17.3 18 27.1 27.9 30.0 17
St. Francis 32.6 31.8 32.9 4 42.9 42.7 43.8 6 23.5 3 18.2 16.8 17.9 69
Saline 10.7 8.5 10.0 75 14.8 14.4 15.2 75 4.6 75 18.5 22.0 22.9 52
Scott 22.5 24.5 22.3 29 33.2 37.0 37.0 17 15.7 21 23.2 25.3 27.5 28
Searcy 23.9 27.0 28.6 6 39.1 44.2 46.6 4 18.2 15 30.8 31.2 34.4 10
Sebastian 16.1 17.6 21.2 42 24.7 24.0 31.2 40 10.5 54 19.8 19.0 20.0 63
Sevier 18.4 22.9 21.7 34 27.5 33.1 31.6 37 10.3 56 20.8 20.5 20.1 62
Sharp 23.1 21.9 24.5 15 34.7 36.3 37.8 13 15.5 22 40.3 38.0 40.9 2
Stone 21.1 23.3 22.9 26 36.7 37.5 38.5 10 17.5 17 29.4 32.9 38.0 6
Union 19.0 23.3 21.5 36 29.2 28.7 31.8 35 11.5 49 25.6 24.2 24.1 44
Van Buren 17.1 18.7 22.1 30 29.3 29.1 39.1 9 14.2 34 39.4 37.5 37.4 7
Washington 15.4 18.7 20.1 52 19.1 24.3 27.0 64 8.8 66 14.3 13.1 14.1 75
White 15.5 16.5 18.0 60 23.3 22.5 23.6 68 12.1 46 20.9 20.1 21.3 59
Woodruff 26.5 27.4 27.3 8 39.8 41.9 38.5 10 18.3 14 26.9 26.4 28.1 25
Yell 18.1 18.6 19.5 56 28.9 27.8 28.1 57 13.8 37 23.6 23.6 24.5 40
19aspireARKANSAS
Appendix I: Historical Data
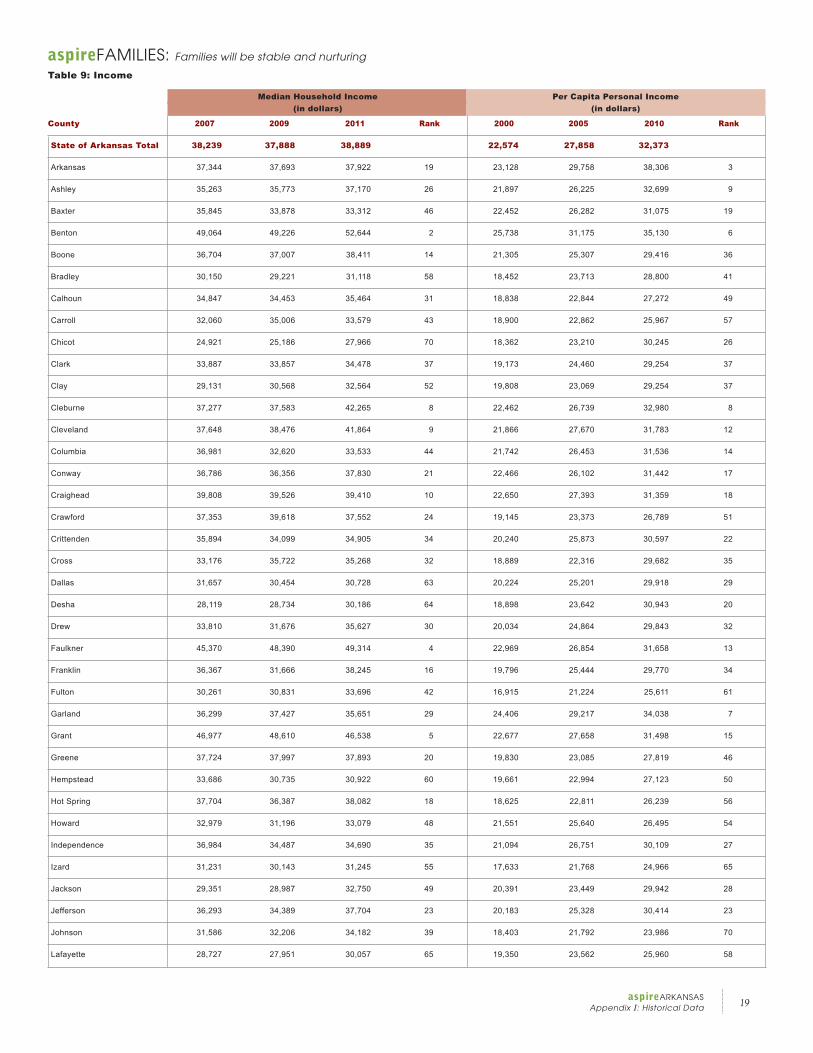
aspireFAMILIES: Families will be stable and nurturing
Table 9: Income
Median Household Income Per Capita Personal Income (in dollars) (in dollars)
County 2007 2009 2011 Rank 2000 2005 2010 Rank
State of Arkansas Total 38,239 37,888 38,889 22,574 27,858 32,373
Arkansas 37,344 37,693 37,922 19 23,128 29,758 38,306 3
Ashley 35,263 35,773 37,170 26 21,897 26,225 32,699 9
Baxter 35,845 33,878 33,312 46 22,452 26,282 31,075 19
Benton 49,064 49,226 52,644 2 25,738 31,175 35,130 6
Boone 36,704 37,007 38,411 14 21,305 25,307 29,416 36
Bradley 30,150 29,221 31,118 58 18,452 23,713 28,800 41
Calhoun 34,847 34,453 35,464 31 18,838 22,844 27,272 49
Carroll 32,060 35,006 33,579 43 18,900 22,862 25,967 57
Chicot 24,921 25,186 27,966 70 18,362 23,210 30,245 26
Clark 33,887 33,857 34,478 37 19,173 24,460 29,254 37
Clay 29,131 30,568 32,564 52 19,808 23,069 29,254 37
Cleburne 37,277 37,583 42,265 8 22,462 26,739 32,980 8
Cleveland 37,648 38,476 41,864 9 21,866 27,670 31,783 12
Columbia 36,981 32,620 33,533 44 21,742 26,453 31,536 14
Conway 36,786 36,356 37,830 21 22,466 26,102 31,442 17
Craighead 39,808 39,526 39,410 10 22,650 27,393 31,359 18
Crawford 37,353 39,618 37,552 24 19,145 23,373 26,789 51
Crittenden 35,894 34,099 34,905 34 20,240 25,873 30,597 22
Cross 33,176 35,722 35,268 32 18,889 22,316 29,682 35
Dallas 31,657 30,454 30,728 63 20,224 25,201 29,918 29
Desha 28,119 28,734 30,186 64 18,898 23,642 30,943 20
Drew 33,810 31,676 35,627 30 20,034 24,864 29,843 32
Faulkner 45,370 48,390 49,314 4 22,969 26,854 31,658 13
Franklin 36,367 31,666 38,245 16 19,796 25,444 29,770 34
Fulton 30,261 30,831 33,696 42 16,915 21,224 25,611 61
Garland 36,299 37,427 35,651 29 24,406 29,217 34,038 7
Grant 46,977 48,610 46,538 5 22,677 27,658 31,498 15
Greene 37,724 37,997 37,893 20 19,830 23,085 27,819 46
Hempstead 33,686 30,735 30,922 60 19,661 22,994 27,123 50
Hot Spring 37,704 36,387 38,082 18 18,625 22,811 26,239 56
Howard 32,979 31,196 33,079 48 21,551 25,640 26,495 54
Independence 36,984 34,487 34,690 35 21,094 26,751 30,109 27
Izard 31,231 30,143 31,245 55 17,633 21,768 24,966 65
Jackson 29,351 28,987 32,750 49 20,391 23,449 29,942 28
Jefferson 36,293 34,389 37,704 23 20,183 25,328 30,414 23
Johnson 31,586 32,206 34,182 39 18,403 21,792 23,986 70
Lafayette 28,727 27,951 30,057 65 19,350 23,562 25,960 58
20aspireARKANSASAppendix I: Historical Data
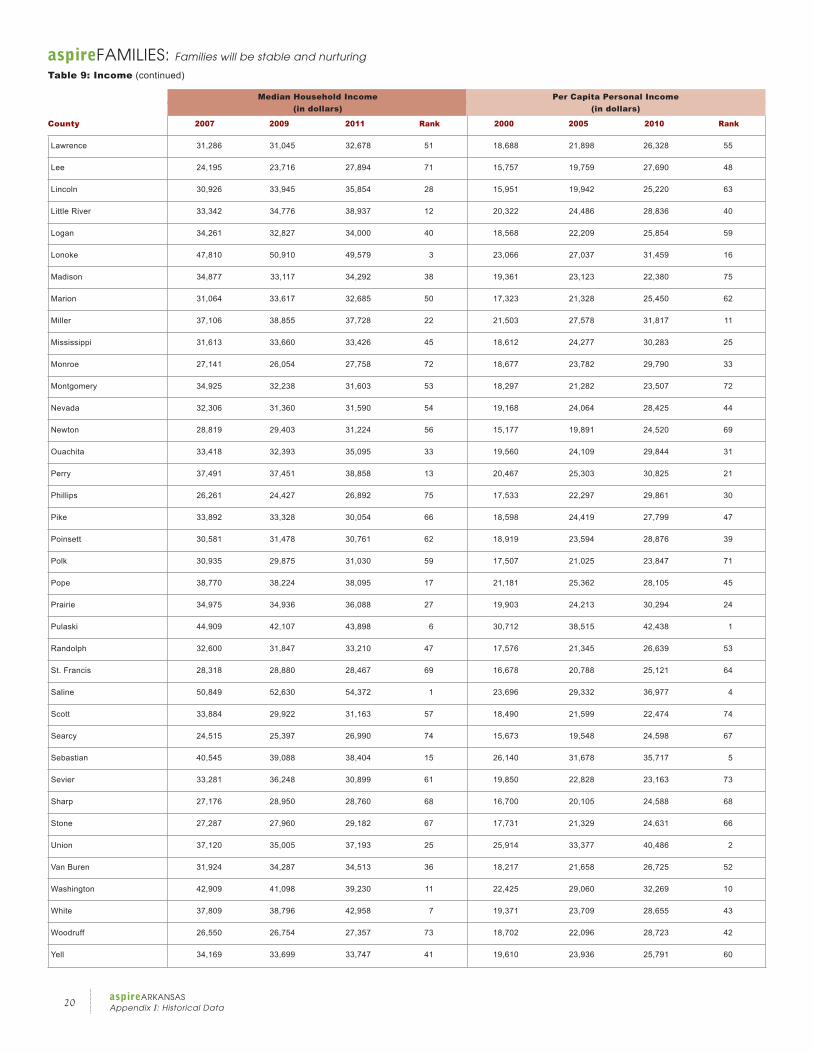
Median Household Income Per Capita Personal Income (in dollars) (in dollars)
County 2007 2009 2011 Rank 2000 2005 2010 Rank
Lawrence 31,286 31,045 32,678 51 18,688 21,898 26,328 55
Lee 24,195 23,716 27,894 71 15,757 19,759 27,690 48
Lincoln 30,926 33,945 35,854 28 15,951 19,942 25,220 63
Little River 33,342 34,776 38,937 12 20,322 24,486 28,836 40
Logan 34,261 32,827 34,000 40 18,568 22,209 25,854 59
Lonoke 47,810 50,910 49,579 3 23,066 27,037 31,459 16
Madison 34,877 33,117 34,292 38 19,361 23,123 22,380 75
Marion 31,064 33,617 32,685 50 17,323 21,328 25,450 62
Miller 37,106 38,855 37,728 22 21,503 27,578 31,817 11
Mississippi 31,613 33,660 33,426 45 18,612 24,277 30,283 25
Monroe 27,141 26,054 27,758 72 18,677 23,782 29,790 33
Montgomery 34,925 32,238 31,603 53 18,297 21,282 23,507 72
Nevada 32,306 31,360 31,590 54 19,168 24,064 28,425 44
Newton 28,819 29,403 31,224 56 15,177 19,891 24,520 69
Ouachita 33,418 32,393 35,095 33 19,560 24,109 29,844 31
Perry 37,491 37,451 38,858 13 20,467 25,303 30,825 21
Phillips 26,261 24,427 26,892 75 17,533 22,297 29,861 30
Pike 33,892 33,328 30,054 66 18,598 24,419 27,799 47
Poinsett 30,581 31,478 30,761 62 18,919 23,594 28,876 39
Polk 30,935 29,875 31,030 59 17,507 21,025 23,847 71
Pope 38,770 38,224 38,095 17 21,181 25,362 28,105 45
Prairie 34,975 34,936 36,088 27 19,903 24,213 30,294 24
Pulaski 44,909 42,107 43,898 6 30,712 38,515 42,438 1
Randolph 32,600 31,847 33,210 47 17,576 21,345 26,639 53
St. Francis 28,318 28,880 28,467 69 16,678 20,788 25,121 64
Saline 50,849 52,630 54,372 1 23,696 29,332 36,977 4
Scott 33,884 29,922 31,163 57 18,490 21,599 22,474 74
Searcy 24,515 25,397 26,990 74 15,673 19,548 24,598 67
Sebastian 40,545 39,088 38,404 15 26,140 31,678 35,717 5
Sevier 33,281 36,248 30,899 61 19,850 22,828 23,163 73
Sharp 27,176 28,950 28,760 68 16,700 20,105 24,588 68
Stone 27,287 27,960 29,182 67 17,731 21,329 24,631 66
Union 37,120 35,005 37,193 25 25,914 33,377 40,486 2
Van Buren 31,924 34,287 34,513 36 18,217 21,658 26,725 52
Washington 42,909 41,098 39,230 11 22,425 29,060 32,269 10
White 37,809 38,796 42,958 7 19,371 23,709 28,655 43
Woodruff 26,550 26,754 27,357 73 18,702 22,096 28,723 42
Yell 34,169 33,699 33,747 41 19,610 23,936 25,791 60
aspireFAMILIES: Families will be stable and nurturing
Table 9: Income (continued)
21aspireARKANSAS
Appendix I: Historical Data
aspireFAMILIES: Families will be stable and nurturing
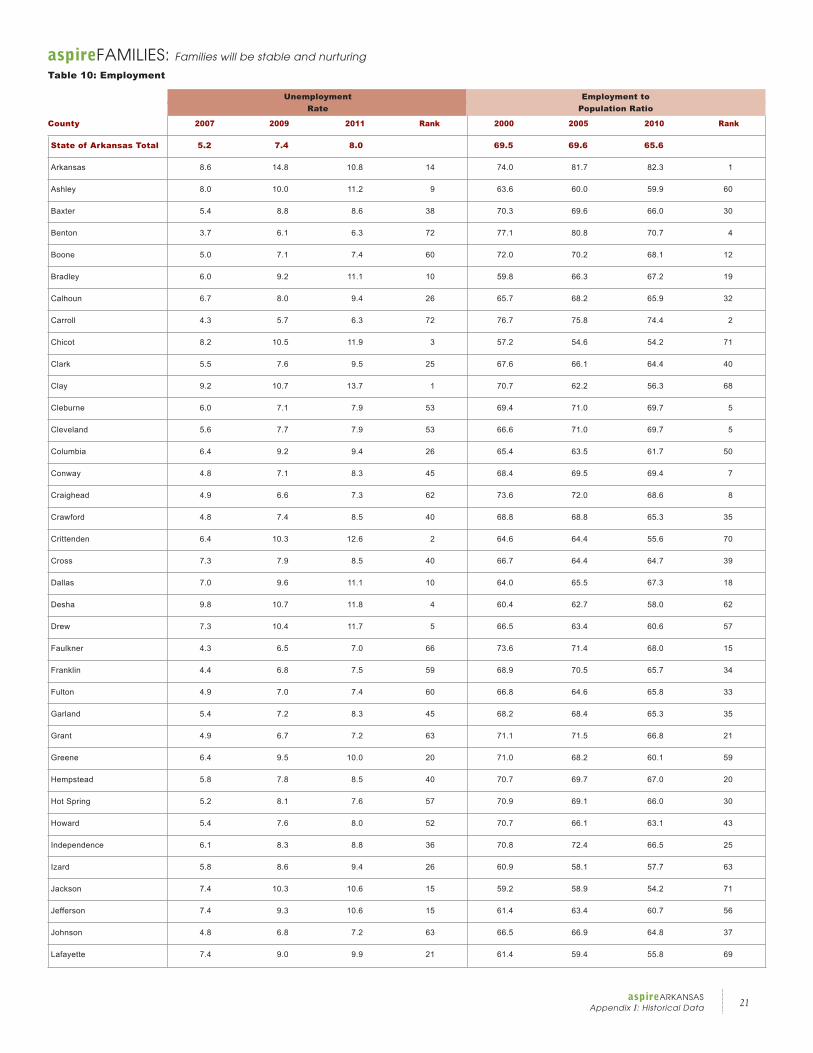
Table 10: Employment
Unemployment Employment to Rate Population Ratio
County 2007 2009 2011 Rank 2000 2005 2010 Rank
State of Arkansas Total 5.2 7.4 8.0 69.5 69.6 65.6
Arkansas 8.6 14.8 10.8 14 74.0 81.7 82.3 1
Ashley 8.0 10.0 11.2 9 63.6 60.0 59.9 60
Baxter 5.4 8.8 8.6 38 70.3 69.6 66.0 30
Benton 3.7 6.1 6.3 72 77.1 80.8 70.7 4
Boone 5.0 7.1 7.4 60 72.0 70.2 68.1 12
Bradley 6.0 9.2 11.1 10 59.8 66.3 67.2 19
Calhoun 6.7 8.0 9.4 26 65.7 68.2 65.9 32
Carroll 4.3 5.7 6.3 72 76.7 75.8 74.4 2
Chicot 8.2 10.5 11.9 3 57.2 54.6 54.2 71
Clark 5.5 7.6 9.5 25 67.6 66.1 64.4 40
Clay 9.2 10.7 13.7 1 70.7 62.2 56.3 68
Cleburne 6.0 7.1 7.9 53 69.4 71.0 69.7 5
Cleveland 5.6 7.7 7.9 53 66.6 71.0 69.7 5
Columbia 6.4 9.2 9.4 26 65.4 63.5 61.7 50
Conway 4.8 7.1 8.3 45 68.4 69.5 69.4 7
Craighead 4.9 6.6 7.3 62 73.6 72.0 68.6 8
Crawford 4.8 7.4 8.5 40 68.8 68.8 65.3 35
Crittenden 6.4 10.3 12.6 2 64.6 64.4 55.6 70
Cross 7.3 7.9 8.5 40 66.7 64.4 64.7 39
Dallas 7.0 9.6 11.1 10 64.0 65.5 67.3 18
Desha 9.8 10.7 11.8 4 60.4 62.7 58.0 62
Drew 7.3 10.4 11.7 5 66.5 63.4 60.6 57
Faulkner 4.3 6.5 7.0 66 73.6 71.4 68.0 15
Franklin 4.4 6.8 7.5 59 68.9 70.5 65.7 34
Fulton 4.9 7.0 7.4 60 66.8 64.6 65.8 33
Garland 5.4 7.2 8.3 45 68.2 68.4 65.3 35
Grant 4.9 6.7 7.2 63 71.1 71.5 66.8 21
Greene 6.4 9.5 10.0 20 71.0 68.2 60.1 59
Hempstead 5.8 7.8 8.5 40 70.7 69.7 67.0 20
Hot Spring 5.2 8.1 7.6 57 70.9 69.1 66.0 30
Howard 5.4 7.6 8.0 52 70.7 66.1 63.1 43
Independence 6.1 8.3 8.8 36 70.8 72.4 66.5 25
Izard 5.8 8.6 9.4 26 60.9 58.1 57.7 63
Jackson 7.4 10.3 10.6 15 59.2 58.9 54.2 71
Jefferson 7.4 9.3 10.6 15 61.4 63.4 60.7 56
Johnson 4.8 6.8 7.2 63 66.5 66.9 64.8 37
Lafayette 7.4 9.0 9.9 21 61.4 59.4 55.8 69
22aspireARKANSASAppendix I: Historical Data
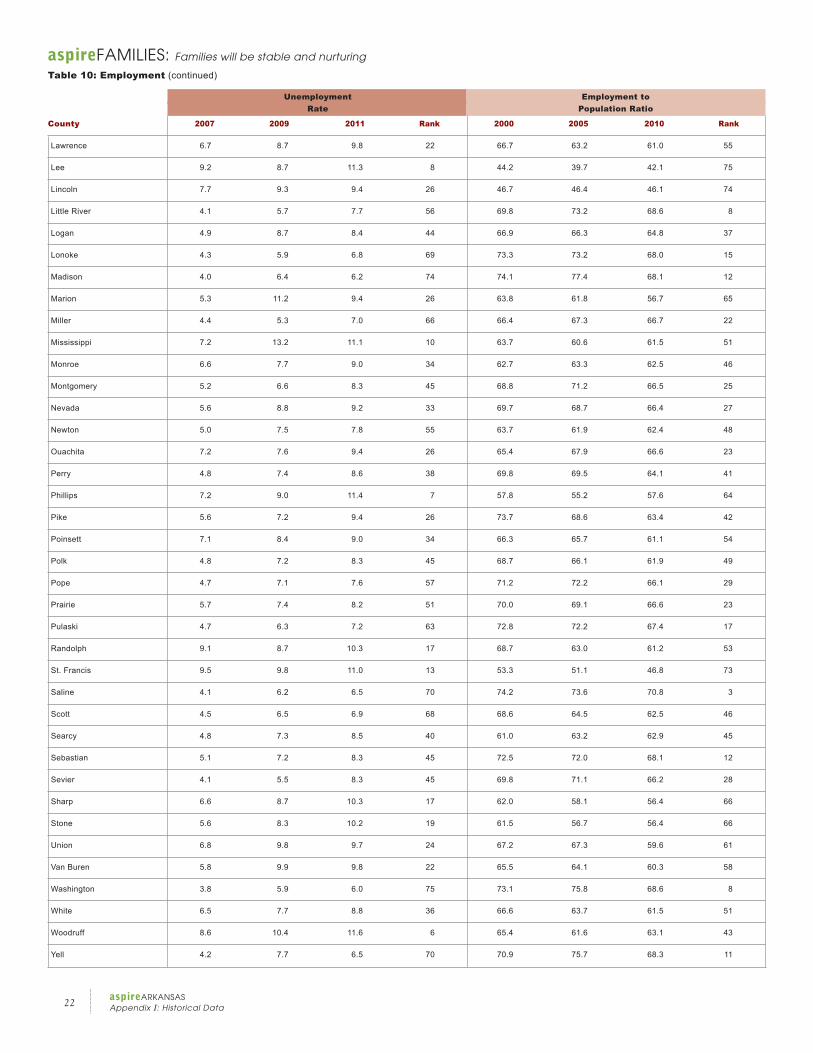
Unemployment Employment to Rate Population Ratio
County 2007 2009 2011 Rank 2000 2005 2010 Rank
Lawrence 6.7 8.7 9.8 22 66.7 63.2 61.0 55
Lee 9.2 8.7 11.3 8 44.2 39.7 42.1 75
Lincoln 7.7 9.3 9.4 26 46.7 46.4 46.1 74
Little River 4.1 5.7 7.7 56 69.8 73.2 68.6 8
Logan 4.9 8.7 8.4 44 66.9 66.3 64.8 37
Lonoke 4.3 5.9 6.8 69 73.3 73.2 68.0 15
Madison 4.0 6.4 6.2 74 74.1 77.4 68.1 12
Marion 5.3 11.2 9.4 26 63.8 61.8 56.7 65
Miller 4.4 5.3 7.0 66 66.4 67.3 66.7 22
Mississippi 7.2 13.2 11.1 10 63.7 60.6 61.5 51
Monroe 6.6 7.7 9.0 34 62.7 63.3 62.5 46
Montgomery 5.2 6.6 8.3 45 68.8 71.2 66.5 25
Nevada 5.6 8.8 9.2 33 69.7 68.7 66.4 27
Newton 5.0 7.5 7.8 55 63.7 61.9 62.4 48
Ouachita 7.2 7.6 9.4 26 65.4 67.9 66.6 23
Perry 4.8 7.4 8.6 38 69.8 69.5 64.1 41
Phillips 7.2 9.0 11.4 7 57.8 55.2 57.6 64
Pike 5.6 7.2 9.4 26 73.7 68.6 63.4 42
Poinsett 7.1 8.4 9.0 34 66.3 65.7 61.1 54
Polk 4.8 7.2 8.3 45 68.7 66.1 61.9 49
Pope 4.7 7.1 7.6 57 71.2 72.2 66.1 29
Prairie 5.7 7.4 8.2 51 70.0 69.1 66.6 23
Pulaski 4.7 6.3 7.2 63 72.8 72.2 67.4 17
Randolph 9.1 8.7 10.3 17 68.7 63.0 61.2 53
St. Francis 9.5 9.8 11.0 13 53.3 51.1 46.8 73
Saline 4.1 6.2 6.5 70 74.2 73.6 70.8 3
Scott 4.5 6.5 6.9 68 68.6 64.5 62.5 46
Searcy 4.8 7.3 8.5 40 61.0 63.2 62.9 45
Sebastian 5.1 7.2 8.3 45 72.5 72.0 68.1 12
Sevier 4.1 5.5 8.3 45 69.8 71.1 66.2 28
Sharp 6.6 8.7 10.3 17 62.0 58.1 56.4 66
Stone 5.6 8.3 10.2 19 61.5 56.7 56.4 66
Union 6.8 9.8 9.7 24 67.2 67.3 59.6 61
Van Buren 5.8 9.9 9.8 22 65.5 64.1 60.3 58
Washington 3.8 5.9 6.0 75 73.1 75.8 68.6 8
White 6.5 7.7 8.8 36 66.6 63.7 61.5 51
Woodruff 8.6 10.4 11.6 6 65.4 61.6 63.1 43
Yell 4.2 7.7 6.5 70 70.9 75.7 68.3 11
aspireFAMILIES: Families will be stable and nurturing
Table 10: Employment (continued)
23aspireARKANSAS
Appendix I: Historical Data
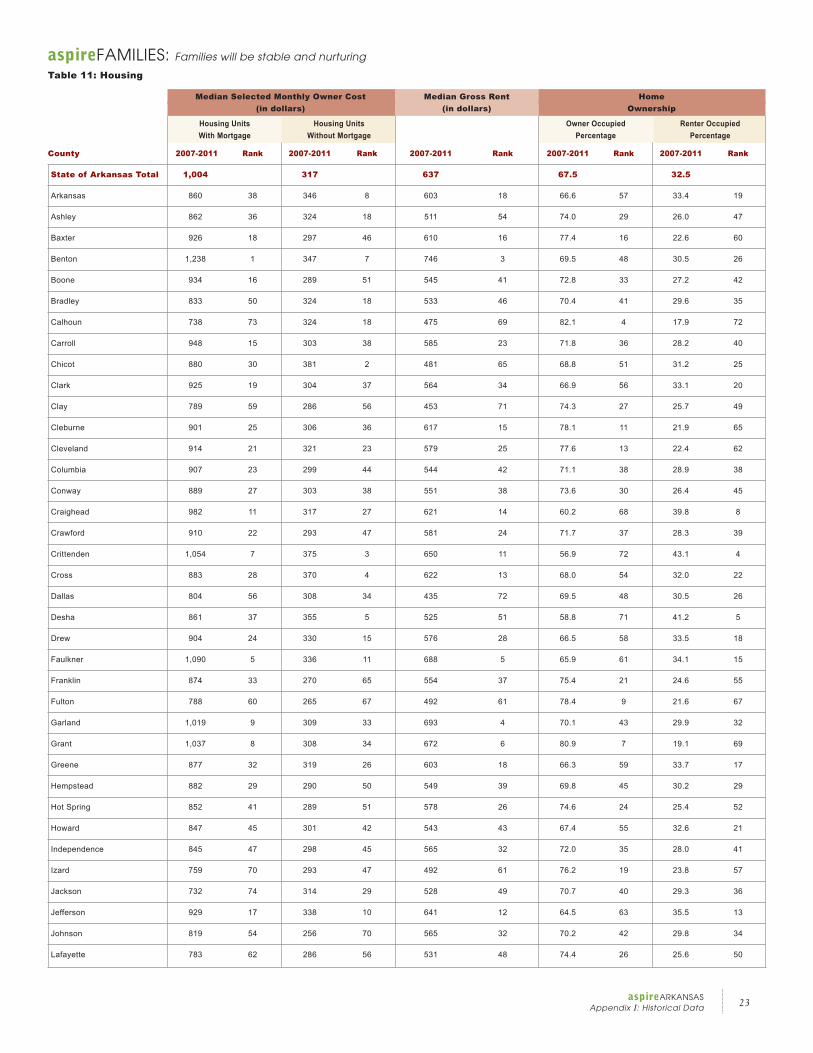
aspireFAMILIES: Families will be stable and nurturing
Table 11: Housing
Median Selected Monthly Owner Cost Median Gross Rent Home (in dollars) (in dollars) Ownership
Housing Units Housing Units Owner Occupied Renter Occupied With Mortgage Without Mortgage Percentage Percentage
County 2007-2011 Rank 2007-2011 Rank 2007-2011 Rank 2007-2011 Rank 2007-2011 Rank
State of Arkansas Total 1,004 317 637 67.5 32.5
Arkansas 860 38 346 8 603 18 66.6 57 33.4 19
Ashley 862 36 324 18 511 54 74.0 29 26.0 47
Baxter 926 18 297 46 610 16 77.4 16 22.6 60
Benton 1,238 1 347 7 746 3 69.5 48 30.5 26
Boone 934 16 289 51 545 41 72.8 33 27.2 42
Bradley 833 50 324 18 533 46 70.4 41 29.6 35
Calhoun 738 73 324 18 475 69 82.1 4 17.9 72
Carroll 948 15 303 38 585 23 71.8 36 28.2 40
Chicot 880 30 381 2 481 65 68.8 51 31.2 25
Clark 925 19 304 37 564 34 66.9 56 33.1 20
Clay 789 59 286 56 453 71 74.3 27 25.7 49
Cleburne 901 25 306 36 617 15 78.1 11 21.9 65
Cleveland 914 21 321 23 579 25 77.6 13 22.4 62
Columbia 907 23 299 44 544 42 71.1 38 28.9 38
Conway 889 27 303 38 551 38 73.6 30 26.4 45
Craighead 982 11 317 27 621 14 60.2 68 39.8 8
Crawford 910 22 293 47 581 24 71.7 37 28.3 39
Crittenden 1,054 7 375 3 650 11 56.9 72 43.1 4
Cross 883 28 370 4 622 13 68.0 54 32.0 22
Dallas 804 56 308 34 435 72 69.5 48 30.5 26
Desha 861 37 355 5 525 51 58.8 71 41.2 5
Drew 904 24 330 15 576 28 66.5 58 33.5 18
Faulkner 1,090 5 336 11 688 5 65.9 61 34.1 15
Franklin 874 33 270 65 554 37 75.4 21 24.6 55
Fulton 788 60 265 67 492 61 78.4 9 21.6 67
Garland 1,019 9 309 33 693 4 70.1 43 29.9 32
Grant 1,037 8 308 34 672 6 80.9 7 19.1 69
Greene 877 32 319 26 603 18 66.3 59 33.7 17
Hempstead 882 29 290 50 549 39 69.8 45 30.2 29
Hot Spring 852 41 289 51 578 26 74.6 24 25.4 52
Howard 847 45 301 42 543 43 67.4 55 32.6 21
Independence 845 47 298 45 565 32 72.0 35 28.0 41
Izard 759 70 293 47 492 61 76.2 19 23.8 57
Jackson 732 74 314 29 528 49 70.7 40 29.3 36
Jefferson 929 17 338 10 641 12 64.5 63 35.5 13
Johnson 819 54 256 70 565 32 70.2 42 29.8 34
Lafayette 783 62 286 56 531 48 74.4 26 25.6 50
24aspireARKANSASAppendix I: Historical Data
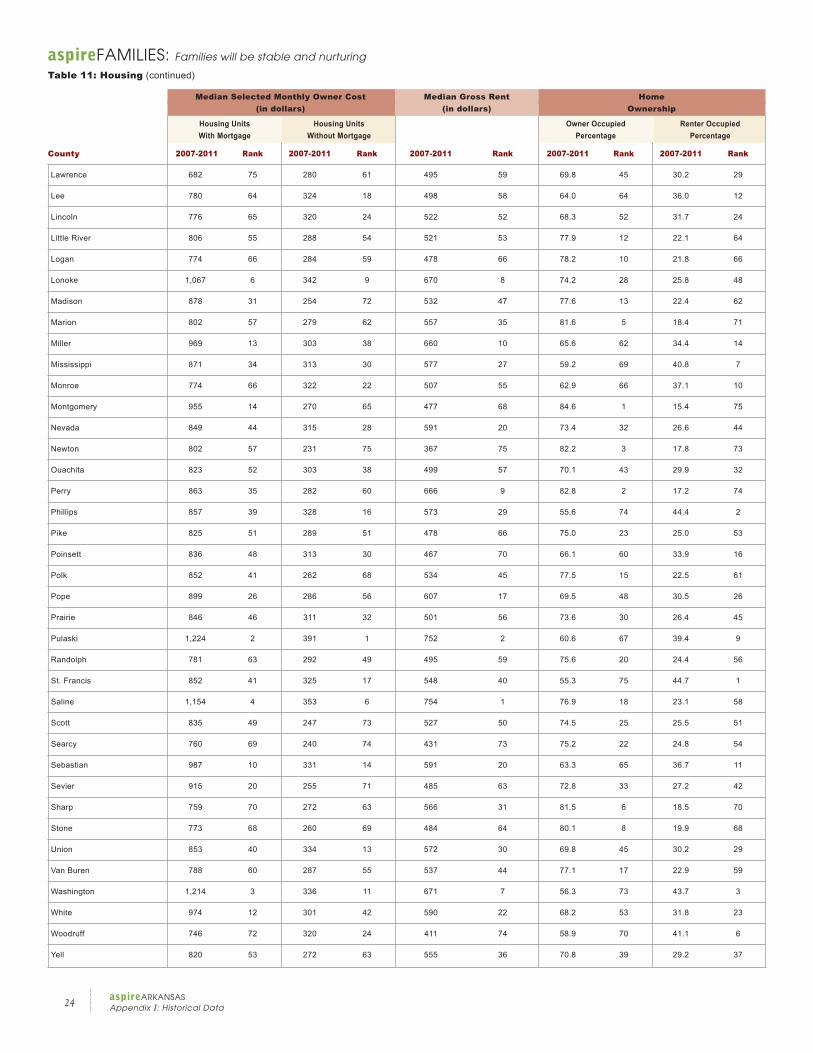
Median Selected Monthly Owner Cost Median Gross Rent Home (in dollars) (in dollars) Ownership
Housing Units Housing Units Owner Occupied Renter Occupied With Mortgage Without Mortgage Percentage Percentage
County 2007-2011 Rank 2007-2011 Rank 2007-2011 Rank 2007-2011 Rank 2007-2011 Rank
Lawrence 682 75 280 61 495 59 69.8 45 30.2 29
Lee 780 64 324 18 498 58 64.0 64 36.0 12
Lincoln 776 65 320 24 522 52 68.3 52 31.7 24
Little River 806 55 288 54 521 53 77.9 12 22.1 64
Logan 774 66 284 59 478 66 78.2 10 21.8 66
Lonoke 1,067 6 342 9 670 8 74.2 28 25.8 48
Madison 878 31 254 72 532 47 77.6 13 22.4 62
Marion 802 57 279 62 557 35 81.6 5 18.4 71
Miller 969 13 303 38 660 10 65.6 62 34.4 14
Mississippi 871 34 313 30 577 27 59.2 69 40.8 7
Monroe 774 66 322 22 507 55 62.9 66 37.1 10
Montgomery 955 14 270 65 477 68 84.6 1 15.4 75
Nevada 849 44 315 28 591 20 73.4 32 26.6 44
Newton 802 57 231 75 367 75 82.2 3 17.8 73
Ouachita 823 52 303 38 499 57 70.1 43 29.9 32
Perry 863 35 282 60 666 9 82.8 2 17.2 74
Phillips 857 39 328 16 573 29 55.6 74 44.4 2
Pike 825 51 289 51 478 66 75.0 23 25.0 53
Poinsett 836 48 313 30 467 70 66.1 60 33.9 16
Polk 852 41 262 68 534 45 77.5 15 22.5 61
Pope 899 26 286 56 607 17 69.5 48 30.5 26
Prairie 846 46 311 32 501 56 73.6 30 26.4 45
Pulaski 1,224 2 391 1 752 2 60.6 67 39.4 9
Randolph 781 63 292 49 495 59 75.6 20 24.4 56
St. Francis 852 41 325 17 548 40 55.3 75 44.7 1
Saline 1,154 4 353 6 754 1 76.9 18 23.1 58
Scott 835 49 247 73 527 50 74.5 25 25.5 51
Searcy 760 69 240 74 431 73 75.2 22 24.8 54
Sebastian 987 10 331 14 591 20 63.3 65 36.7 11
Sevier 915 20 255 71 485 63 72.8 33 27.2 42
Sharp 759 70 272 63 566 31 81.5 6 18.5 70
Stone 773 68 260 69 484 64 80.1 8 19.9 68
Union 853 40 334 13 572 30 69.8 45 30.2 29
Van Buren 788 60 287 55 537 44 77.1 17 22.9 59
Washington 1,214 3 336 11 671 7 56.3 73 43.7 3
White 974 12 301 42 590 22 68.2 53 31.8 23
Woodruff 746 72 320 24 411 74 58.9 70 41.1 6
Yell 820 53 272 63 555 36 70.8 39 29.2 37
aspireFAMILIES: Families will be stable and nurturing
Table 11: Housing (continued)
25aspireARKANSAS
Appendix I: Historical Data
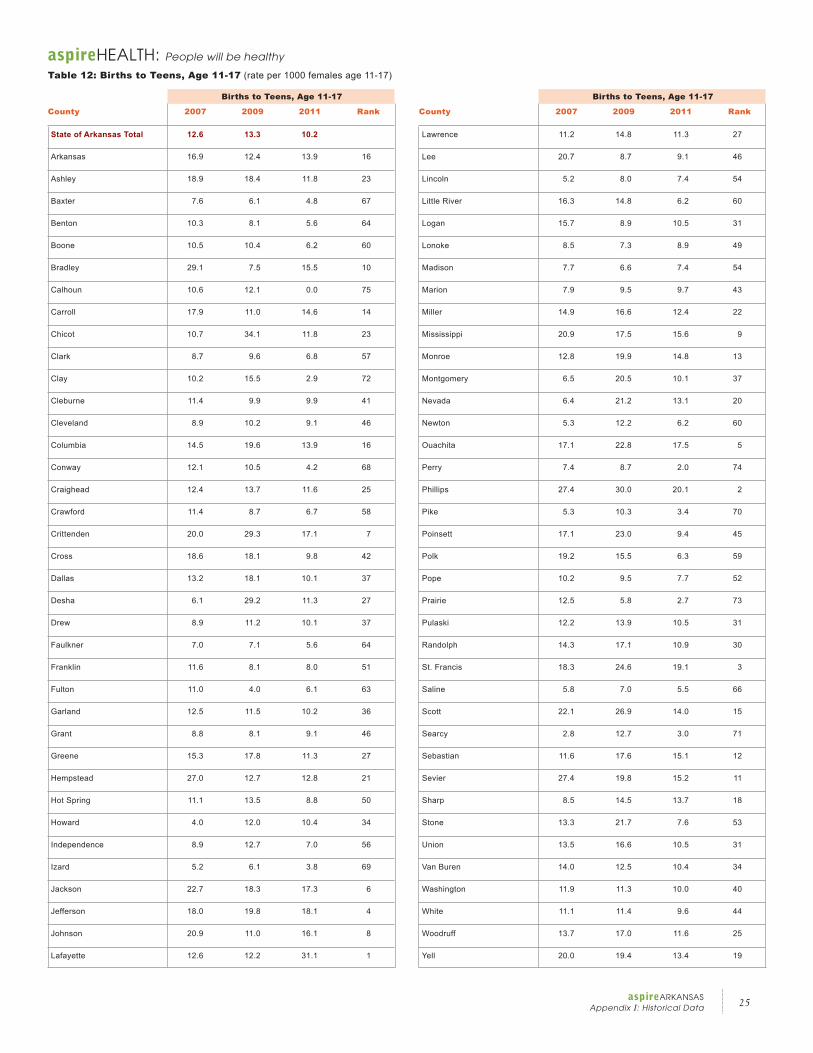
aspireHEALTH: People will be healthy
Table 12: Births to Teens, Age 11-17 (rate per 1000 females age 11-17)
State of Arkansas Total 12.6 13.3 10.2
Arkansas 16.9 12.4 13.9 16
Ashley 18.9 18.4 11.8 23
Baxter 7.6 6.1 4.8 67
Benton 10.3 8.1 5.6 64
Boone 10.5 10.4 6.2 60
Bradley 29.1 7.5 15.5 10
Calhoun 10.6 12.1 0.0 75
Carroll 17.9 11.0 14.6 14
Chicot 10.7 34.1 11.8 23
Clark 8.7 9.6 6.8 57
Clay 10.2 15.5 2.9 72
Cleburne 11.4 9.9 9.9 41
Cleveland 8.9 10.2 9.1 46
Columbia 14.5 19.6 13.9 16
Conway 12.1 10.5 4.2 68
Craighead 12.4 13.7 11.6 25
Crawford 11.4 8.7 6.7 58
Crittenden 20.0 29.3 17.1 7
Cross 18.6 18.1 9.8 42
Dallas 13.2 18.1 10.1 37
Desha 6.1 29.2 11.3 27
Drew 8.9 11.2 10.1 37
Faulkner 7.0 7.1 5.6 64
Franklin 11.6 8.1 8.0 51
Fulton 11.0 4.0 6.1 63
Garland 12.5 11.5 10.2 36
Grant 8.8 8.1 9.1 46
Greene 15.3 17.8 11.3 27
Hempstead 27.0 12.7 12.8 21
Hot Spring 11.1 13.5 8.8 50
Howard 4.0 12.0 10.4 34
Independence 8.9 12.7 7.0 56
Izard 5.2 6.1 3.8 69
Jackson 22.7 18.3 17.3 6
Jefferson 18.0 19.8 18.1 4
Johnson 20.9 11.0 16.1 8
Lafayette 12.6 12.2 31.1 1
Lawrence 11.2 14.8 11.3 27
Lee 20.7 8.7 9.1 46
Lincoln 5.2 8.0 7.4 54
Little River 16.3 14.8 6.2 60
Logan 15.7 8.9 10.5 31
Lonoke 8.5 7.3 8.9 49
Madison 7.7 6.6 7.4 54
Marion 7.9 9.5 9.7 43
Miller 14.9 16.6 12.4 22
Mississippi 20.9 17.5 15.6 9
Monroe 12.8 19.9 14.8 13
Montgomery 6.5 20.5 10.1 37
Nevada 6.4 21.2 13.1 20
Newton 5.3 12.2 6.2 60
Ouachita 17.1 22.8 17.5 5
Perry 7.4 8.7 2.0 74
Phillips 27.4 30.0 20.1 2
Pike 5.3 10.3 3.4 70
Poinsett 17.1 23.0 9.4 45
Polk 19.2 15.5 6.3 59
Pope 10.2 9.5 7.7 52
Prairie 12.5 5.8 2.7 73
Pulaski 12.2 13.9 10.5 31
Randolph 14.3 17.1 10.9 30
St. Francis 18.3 24.6 19.1 3
Saline 5.8 7.0 5.5 66
Scott 22.1 26.9 14.0 15
Searcy 2.8 12.7 3.0 71
Sebastian 11.6 17.6 15.1 12
Sevier 27.4 19.8 15.2 11
Sharp 8.5 14.5 13.7 18
Stone 13.3 21.7 7.6 53
Union 13.5 16.6 10.5 31
Van Buren 14.0 12.5 10.4 34
Washington 11.9 11.3 10.0 40
White 11.1 11.4 9.6 44
Woodruff 13.7 17.0 11.6 25
Yell 20.0 19.4 13.4 19
Births to Teens, Age 11-17
County 2007 2009 2011 Rank
Births to Teens, Age 11-17
County 2007 2009 2011 Rank
26aspireARKANSASAppendix I: Historical Data
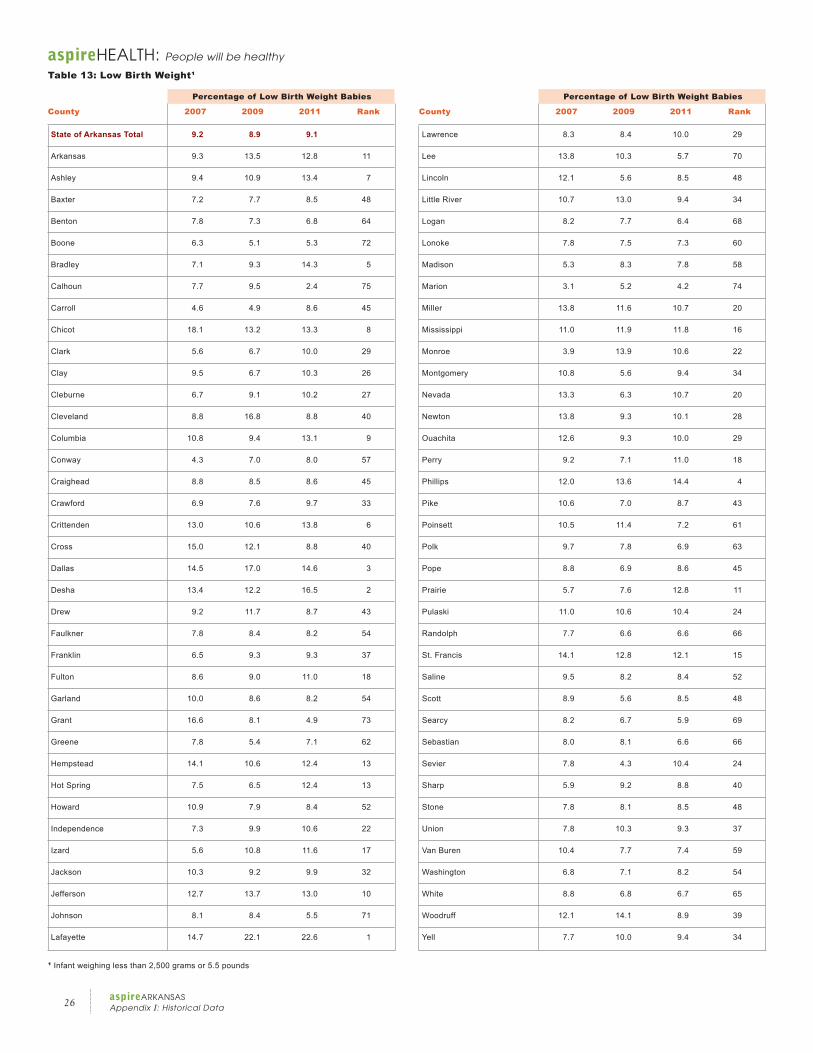
aspireHEALTH: People will be healthy
Table 13: Low Birth Weight¹
1
State of Arkansas Total 9.2 8.9 9.1
Arkansas 9.3 13.5 12.8 11
Ashley 9.4 10.9 13.4 7
Baxter 7.2 7.7 8.5 48
Benton 7.8 7.3 6.8 64
Boone 6.3 5.1 5.3 72
Bradley 7.1 9.3 14.3 5
Calhoun 7.7 9.5 2.4 75
Carroll 4.6 4.9 8.6 45
Chicot 18.1 13.2 13.3 8
Clark 5.6 6.7 10.0 29
Clay 9.5 6.7 10.3 26
Cleburne 6.7 9.1 10.2 27
Cleveland 8.8 16.8 8.8 40
Columbia 10.8 9.4 13.1 9
Conway 4.3 7.0 8.0 57
Craighead 8.8 8.5 8.6 45
Crawford 6.9 7.6 9.7 33
Crittenden 13.0 10.6 13.8 6
Cross 15.0 12.1 8.8 40
Dallas 14.5 17.0 14.6 3
Desha 13.4 12.2 16.5 2
Drew 9.2 11.7 8.7 43
Faulkner 7.8 8.4 8.2 54
Franklin 6.5 9.3 9.3 37
Fulton 8.6 9.0 11.0 18
Garland 10.0 8.6 8.2 54
Grant 16.6 8.1 4.9 73
Greene 7.8 5.4 7.1 62
Hempstead 14.1 10.6 12.4 13
Hot Spring 7.5 6.5 12.4 13
Howard 10.9 7.9 8.4 52
Independence 7.3 9.9 10.6 22
Izard 5.6 10.8 11.6 17
Jackson 10.3 9.2 9.9 32
Jefferson 12.7 13.7 13.0 10
Johnson 8.1 8.4 5.5 71
Lafayette 14.7 22.1 22.6 1
Lawrence 8.3 8.4 10.0 29
Lee 13.8 10.3 5.7 70
Lincoln 12.1 5.6 8.5 48
Little River 10.7 13.0 9.4 34
Logan 8.2 7.7 6.4 68
Lonoke 7.8 7.5 7.3 60
Madison 5.3 8.3 7.8 58
Marion 3.1 5.2 4.2 74
Miller 13.8 11.6 10.7 20
Mississippi 11.0 11.9 11.8 16
Monroe 3.9 13.9 10.6 22
Montgomery 10.8 5.6 9.4 34
Nevada 13.3 6.3 10.7 20
Newton 13.8 9.3 10.1 28
Ouachita 12.6 9.3 10.0 29
Perry 9.2 7.1 11.0 18
Phillips 12.0 13.6 14.4 4
Pike 10.6 7.0 8.7 43
Poinsett 10.5 11.4 7.2 61
Polk 9.7 7.8 6.9 63
Pope 8.8 6.9 8.6 45
Prairie 5.7 7.6 12.8 11
Pulaski 11.0 10.6 10.4 24
Randolph 7.7 6.6 6.6 66
St. Francis 14.1 12.8 12.1 15
Saline 9.5 8.2 8.4 52
Scott 8.9 5.6 8.5 48
Searcy 8.2 6.7 5.9 69
Sebastian 8.0 8.1 6.6 66
Sevier 7.8 4.3 10.4 24
Sharp 5.9 9.2 8.8 40
Stone 7.8 8.1 8.5 48
Union 7.8 10.3 9.3 37
Van Buren 10.4 7.7 7.4 59
Washington 6.8 7.1 8.2 54
White 8.8 6.8 6.7 65
Woodruff 12.1 14.1 8.9 39
Yell 7.7 10.0 9.4 34
Percentage of Low Birth Weight Babies
County 2007 2009 2011 Rank
Percentage of Low Birth Weight Babies
County 2007 2009 2011 Rank
¹ Infant weighing less than 2,500 grams or 5.5 pounds
27aspireARKANSAS
Appendix I: Historical Data
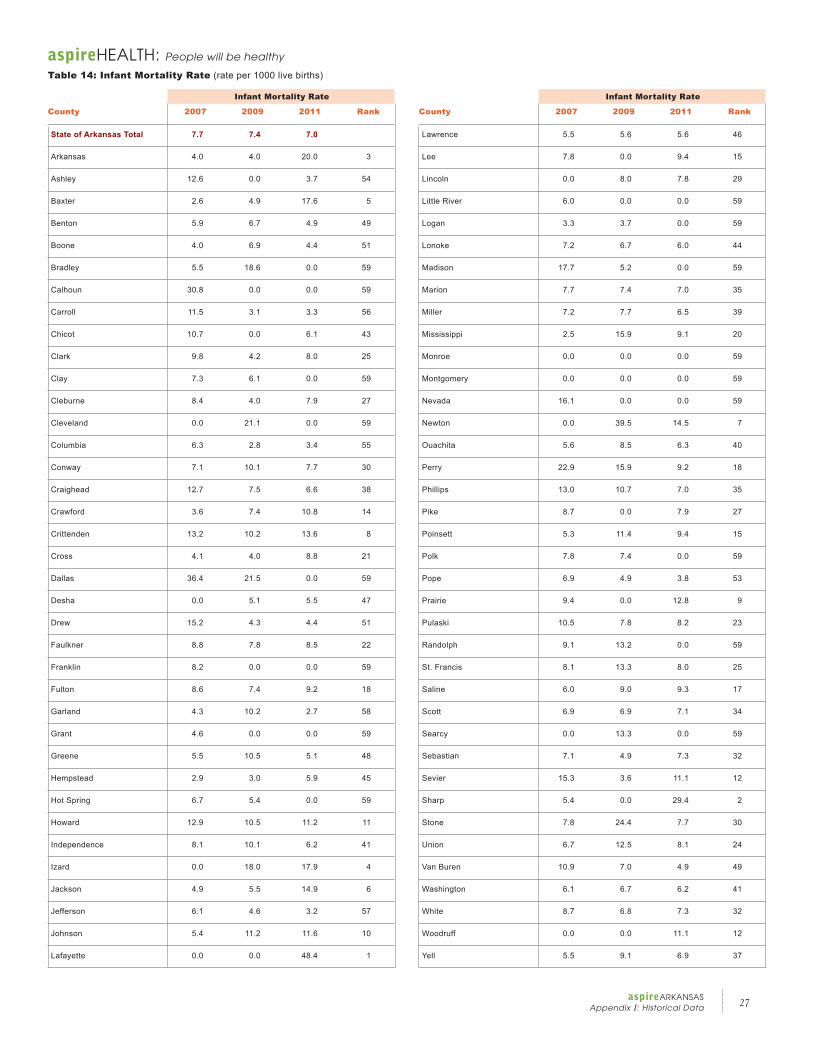
aspireHEALTH: People will be healthy
Table 14: Infant Mortality Rate (rate per 1000 live births)
State of Arkansas Total 7.7 7.4 7.0
Arkansas 4.0 4.0 20.0 3
Ashley 12.6 0.0 3.7 54
Baxter 2.6 4.9 17.6 5
Benton 5.9 6.7 4.9 49
Boone 4.0 6.9 4.4 51
Bradley 5.5 18.6 0.0 59
Calhoun 30.8 0.0 0.0 59
Carroll 11.5 3.1 3.3 56
Chicot 10.7 0.0 6.1 43
Clark 9.8 4.2 8.0 25
Clay 7.3 6.1 0.0 59
Cleburne 8.4 4.0 7.9 27
Cleveland 0.0 21.1 0.0 59
Columbia 6.3 2.8 3.4 55
Conway 7.1 10.1 7.7 30
Craighead 12.7 7.5 6.6 38
Crawford 3.6 7.4 10.8 14
Crittenden 13.2 10.2 13.6 8
Cross 4.1 4.0 8.8 21
Dallas 36.4 21.5 0.0 59
Desha 0.0 5.1 5.5 47
Drew 15.2 4.3 4.4 51
Faulkner 8.8 7.8 8.5 22
Franklin 8.2 0.0 0.0 59
Fulton 8.6 7.4 9.2 18
Garland 4.3 10.2 2.7 58
Grant 4.6 0.0 0.0 59
Greene 5.5 10.5 5.1 48
Hempstead 2.9 3.0 5.9 45
Hot Spring 6.7 5.4 0.0 59
Howard 12.9 10.5 11.2 11
Independence 8.1 10.1 6.2 41
Izard 0.0 18.0 17.9 4
Jackson 4.9 5.5 14.9 6
Jefferson 6.1 4.6 3.2 57
Johnson 5.4 11.2 11.6 10
Lafayette 0.0 0.0 48.4 1
Lawrence 5.5 5.6 5.6 46
Lee 7.8 0.0 9.4 15
Lincoln 0.0 8.0 7.8 29
Little River 6.0 0.0 0.0 59
Logan 3.3 3.7 0.0 59
Lonoke 7.2 6.7 6.0 44
Madison 17.7 5.2 0.0 59
Marion 7.7 7.4 7.0 35
Miller 7.2 7.7 6.5 39
Mississippi 2.5 15.9 9.1 20
Monroe 0.0 0.0 0.0 59
Montgomery 0.0 0.0 0.0 59
Nevada 16.1 0.0 0.0 59
Newton 0.0 39.5 14.5 7
Ouachita 5.6 8.5 6.3 40
Perry 22.9 15.9 9.2 18
Phillips 13.0 10.7 7.0 35
Pike 8.7 0.0 7.9 27
Poinsett 5.3 11.4 9.4 15
Polk 7.8 7.4 0.0 59
Pope 6.9 4.9 3.8 53
Prairie 9.4 0.0 12.8 9
Pulaski 10.5 7.8 8.2 23
Randolph 9.1 13.2 0.0 59
St. Francis 8.1 13.3 8.0 25
Saline 6.0 9.0 9.3 17
Scott 6.9 6.9 7.1 34
Searcy 0.0 13.3 0.0 59
Sebastian 7.1 4.9 7.3 32
Sevier 15.3 3.6 11.1 12
Sharp 5.4 0.0 29.4 2
Stone 7.8 24.4 7.7 30
Union 6.7 12.5 8.1 24
Van Buren 10.9 7.0 4.9 49
Washington 6.1 6.7 6.2 41
White 8.7 6.8 7.3 32
Woodruff 0.0 0.0 11.1 12
Yell 5.5 9.1 6.9 37
Infant Mortality Rate
County 2007 2009 2011 Rank
Infant Mortality Rate
County 2007 2009 2011 Rank
28aspireARKANSASAppendix I: Historical Data
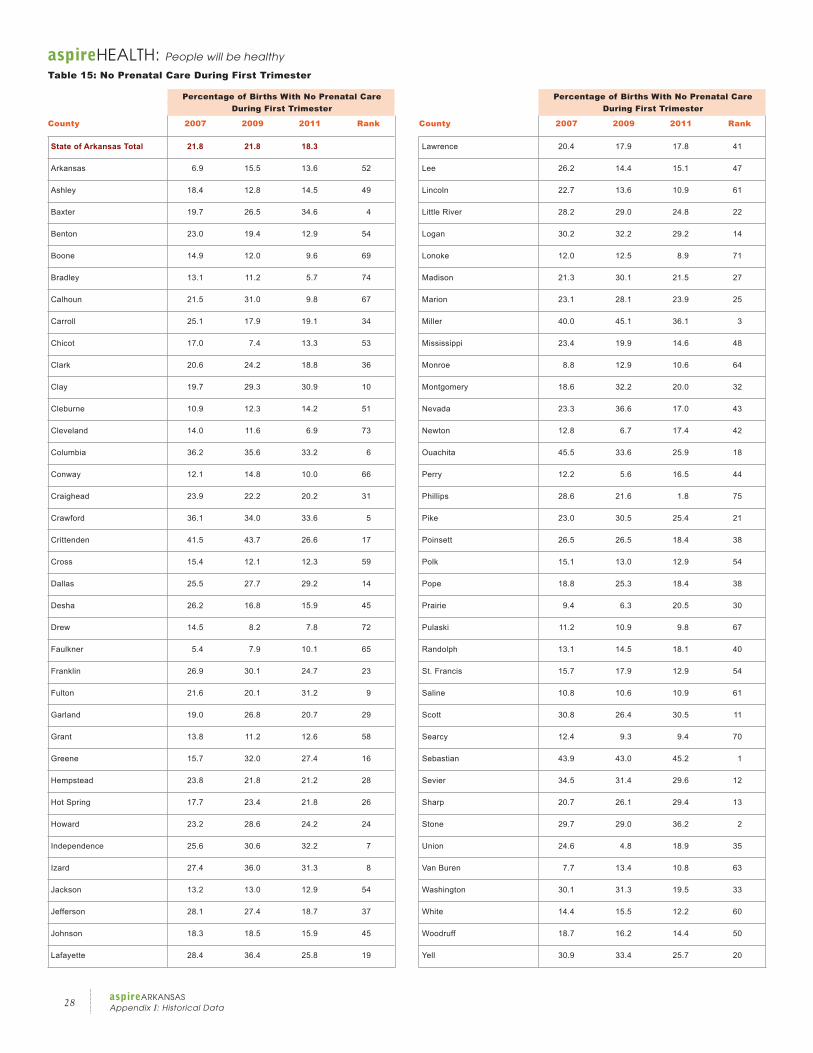
aspireHEALTH: People will be healthy
Table 15: No Prenatal Care During First Trimester
State of Arkansas Total 21.8 21.8 18.3
Arkansas 6.9 15.5 13.6 52
Ashley 18.4 12.8 14.5 49
Baxter 19.7 26.5 34.6 4
Benton 23.0 19.4 12.9 54
Boone 14.9 12.0 9.6 69
Bradley 13.1 11.2 5.7 74
Calhoun 21.5 31.0 9.8 67
Carroll 25.1 17.9 19.1 34
Chicot 17.0 7.4 13.3 53
Clark 20.6 24.2 18.8 36
Clay 19.7 29.3 30.9 10
Cleburne 10.9 12.3 14.2 51
Cleveland 14.0 11.6 6.9 73
Columbia 36.2 35.6 33.2 6
Conway 12.1 14.8 10.0 66
Craighead 23.9 22.2 20.2 31
Crawford 36.1 34.0 33.6 5
Crittenden 41.5 43.7 26.6 17
Cross 15.4 12.1 12.3 59
Dallas 25.5 27.7 29.2 14
Desha 26.2 16.8 15.9 45
Drew 14.5 8.2 7.8 72
Faulkner 5.4 7.9 10.1 65
Franklin 26.9 30.1 24.7 23
Fulton 21.6 20.1 31.2 9
Garland 19.0 26.8 20.7 29
Grant 13.8 11.2 12.6 58
Greene 15.7 32.0 27.4 16
Hempstead 23.8 21.8 21.2 28
Hot Spring 17.7 23.4 21.8 26
Howard 23.2 28.6 24.2 24
Independence 25.6 30.6 32.2 7
Izard 27.4 36.0 31.3 8
Jackson 13.2 13.0 12.9 54
Jefferson 28.1 27.4 18.7 37
Johnson 18.3 18.5 15.9 45
Lafayette 28.4 36.4 25.8 19
Lawrence 20.4 17.9 17.8 41
Lee 26.2 14.4 15.1 47
Lincoln 22.7 13.6 10.9 61
Little River 28.2 29.0 24.8 22
Logan 30.2 32.2 29.2 14
Lonoke 12.0 12.5 8.9 71
Madison 21.3 30.1 21.5 27
Marion 23.1 28.1 23.9 25
Miller 40.0 45.1 36.1 3
Mississippi 23.4 19.9 14.6 48
Monroe 8.8 12.9 10.6 64
Montgomery 18.6 32.2 20.0 32
Nevada 23.3 36.6 17.0 43
Newton 12.8 6.7 17.4 42
Ouachita 45.5 33.6 25.9 18
Perry 12.2 5.6 16.5 44
Phillips 28.6 21.6 1.8 75
Pike 23.0 30.5 25.4 21
Poinsett 26.5 26.5 18.4 38
Polk 15.1 13.0 12.9 54
Pope 18.8 25.3 18.4 38
Prairie 9.4 6.3 20.5 30
Pulaski 11.2 10.9 9.8 67
Randolph 13.1 14.5 18.1 40
St. Francis 15.7 17.9 12.9 54
Saline 10.8 10.6 10.9 61
Scott 30.8 26.4 30.5 11
Searcy 12.4 9.3 9.4 70
Sebastian 43.9 43.0 45.2 1
Sevier 34.5 31.4 29.6 12
Sharp 20.7 26.1 29.4 13
Stone 29.7 29.0 36.2 2
Union 24.6 4.8 18.9 35
Van Buren 7.7 13.4 10.8 63
Washington 30.1 31.3 19.5 33
White 14.4 15.5 12.2 60
Woodruff 18.7 16.2 14.4 50
Yell 30.9 33.4 25.7 20
Percentage of Births With No Prenatal Care During First Trimester
County 2007 2009 2011 Rank
Percentage of Births With No Prenatal Care During First Trimester
County 2007 2009 2011 Rank
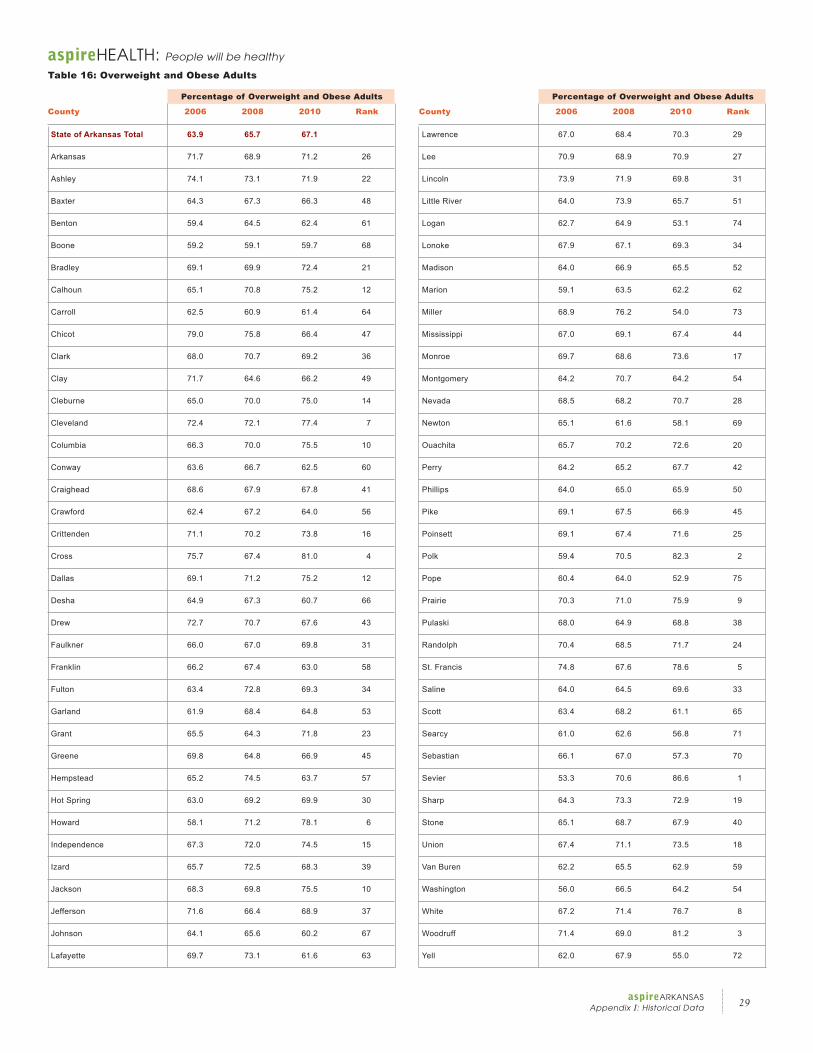
29aspireARKANSAS
Appendix I: Historical Data
aspireHEALTH: People will be healthy
Table 16: Overweight and Obese Adults
State of Arkansas Total 63.9 65.7 67.1
Arkansas 71.7 68.9 71.2 26
Ashley 74.1 73.1 71.9 22
Baxter 64.3 67.3 66.3 48
Benton 59.4 64.5 62.4 61
Boone 59.2 59.1 59.7 68
Bradley 69.1 69.9 72.4 21
Calhoun 65.1 70.8 75.2 12
Carroll 62.5 60.9 61.4 64
Chicot 79.0 75.8 66.4 47
Clark 68.0 70.7 69.2 36
Clay 71.7 64.6 66.2 49
Cleburne 65.0 70.0 75.0 14
Cleveland 72.4 72.1 77.4 7
Columbia 66.3 70.0 75.5 10
Conway 63.6 66.7 62.5 60
Craighead 68.6 67.9 67.8 41
Crawford 62.4 67.2 64.0 56
Crittenden 71.1 70.2 73.8 16
Cross 75.7 67.4 81.0 4
Dallas 69.1 71.2 75.2 12
Desha 64.9 67.3 60.7 66
Drew 72.7 70.7 67.6 43
Faulkner 66.0 67.0 69.8 31
Franklin 66.2 67.4 63.0 58
Fulton 63.4 72.8 69.3 34
Garland 61.9 68.4 64.8 53
Grant 65.5 64.3 71.8 23
Greene 69.8 64.8 66.9 45
Hempstead 65.2 74.5 63.7 57
Hot Spring 63.0 69.2 69.9 30
Howard 58.1 71.2 78.1 6
Independence 67.3 72.0 74.5 15
Izard 65.7 72.5 68.3 39
Jackson 68.3 69.8 75.5 10
Jefferson 71.6 66.4 68.9 37
Johnson 64.1 65.6 60.2 67
Lafayette 69.7 73.1 61.6 63
Lawrence 67.0 68.4 70.3 29
Lee 70.9 68.9 70.9 27
Lincoln 73.9 71.9 69.8 31
Little River 64.0 73.9 65.7 51
Logan 62.7 64.9 53.1 74
Lonoke 67.9 67.1 69.3 34
Madison 64.0 66.9 65.5 52
Marion 59.1 63.5 62.2 62
Miller 68.9 76.2 54.0 73
Mississippi 67.0 69.1 67.4 44
Monroe 69.7 68.6 73.6 17
Montgomery 64.2 70.7 64.2 54
Nevada 68.5 68.2 70.7 28
Newton 65.1 61.6 58.1 69
Ouachita 65.7 70.2 72.6 20
Perry 64.2 65.2 67.7 42
Phillips 64.0 65.0 65.9 50
Pike 69.1 67.5 66.9 45
Poinsett 69.1 67.4 71.6 25
Polk 59.4 70.5 82.3 2
Pope 60.4 64.0 52.9 75
Prairie 70.3 71.0 75.9 9
Pulaski 68.0 64.9 68.8 38
Randolph 70.4 68.5 71.7 24
St. Francis 74.8 67.6 78.6 5
Saline 64.0 64.5 69.6 33
Scott 63.4 68.2 61.1 65
Searcy 61.0 62.6 56.8 71
Sebastian 66.1 67.0 57.3 70
Sevier 53.3 70.6 86.6 1
Sharp 64.3 73.3 72.9 19
Stone 65.1 68.7 67.9 40
Union 67.4 71.1 73.5 18
Van Buren 62.2 65.5 62.9 59
Washington 56.0 66.5 64.2 54
White 67.2 71.4 76.7 8
Woodruff 71.4 69.0 81.2 3
Yell 62.0 67.9 55.0 72
Percentage of Overweight and Obese Adults
County 2006 2008 2010 Rank
Percentage of Overweight and Obese Adults
County 2006 2008 2010 Rank
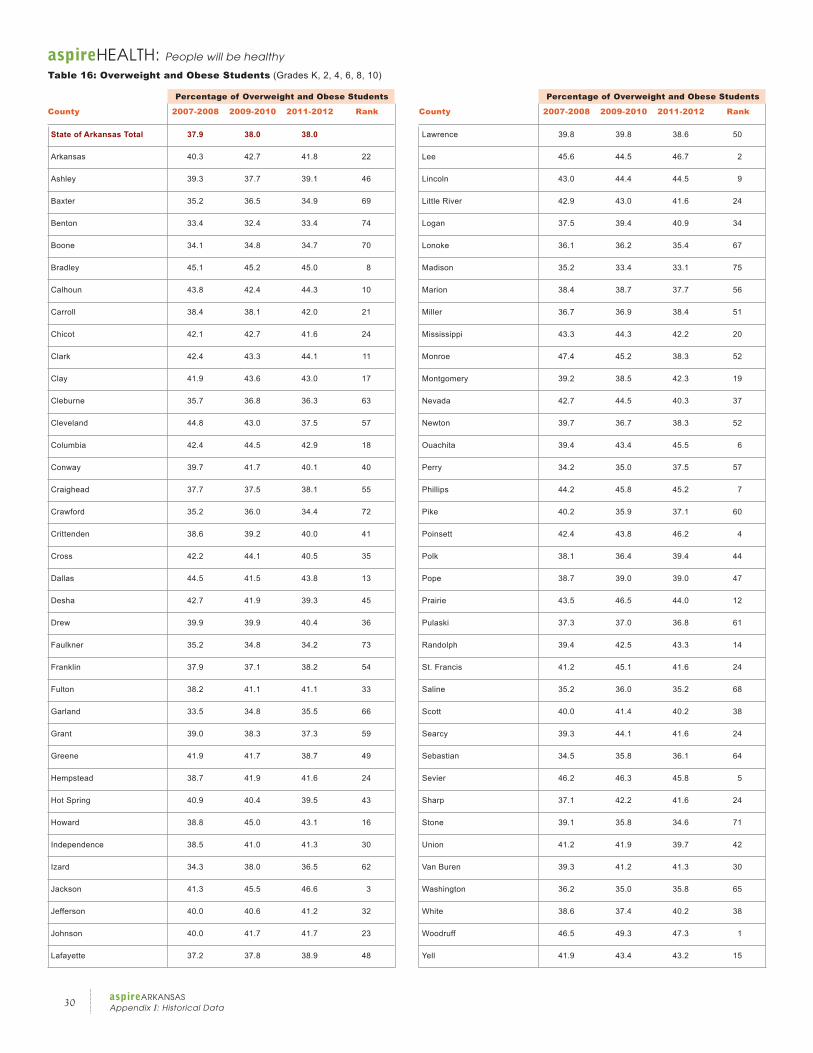
30aspireARKANSASAppendix I: Historical Data
aspireHEALTH: People will be healthy
Table 16: Overweight and Obese Students (Grades K, 2, 4, 6, 8, 10)
Percentage of Overweight and Obese Students
County 2007-2008 2009-2010 2011-2012 Rank
Percentage of Overweight and Obese Students
County 2007-2008 2009-2010 2011-2012 Rank
State of Arkansas Total 37.9 38.0 38.0
Arkansas 40.3 42.7 41.8 22
Ashley 39.3 37.7 39.1 46
Baxter 35.2 36.5 34.9 69
Benton 33.4 32.4 33.4 74
Boone 34.1 34.8 34.7 70
Bradley 45.1 45.2 45.0 8
Calhoun 43.8 42.4 44.3 10
Carroll 38.4 38.1 42.0 21
Chicot 42.1 42.7 41.6 24
Clark 42.4 43.3 44.1 11
Clay 41.9 43.6 43.0 17
Cleburne 35.7 36.8 36.3 63
Cleveland 44.8 43.0 37.5 57
Columbia 42.4 44.5 42.9 18
Conway 39.7 41.7 40.1 40
Craighead 37.7 37.5 38.1 55
Crawford 35.2 36.0 34.4 72
Crittenden 38.6 39.2 40.0 41
Cross 42.2 44.1 40.5 35
Dallas 44.5 41.5 43.8 13
Desha 42.7 41.9 39.3 45
Drew 39.9 39.9 40.4 36
Faulkner 35.2 34.8 34.2 73
Franklin 37.9 37.1 38.2 54
Fulton 38.2 41.1 41.1 33
Garland 33.5 34.8 35.5 66
Grant 39.0 38.3 37.3 59
Greene 41.9 41.7 38.7 49
Hempstead 38.7 41.9 41.6 24
Hot Spring 40.9 40.4 39.5 43
Howard 38.8 45.0 43.1 16
Independence 38.5 41.0 41.3 30
Izard 34.3 38.0 36.5 62
Jackson 41.3 45.5 46.6 3
Jefferson 40.0 40.6 41.2 32
Johnson 40.0 41.7 41.7 23
Lafayette 37.2 37.8 38.9 48
Lawrence 39.8 39.8 38.6 50
Lee 45.6 44.5 46.7 2
Lincoln 43.0 44.4 44.5 9
Little River 42.9 43.0 41.6 24
Logan 37.5 39.4 40.9 34
Lonoke 36.1 36.2 35.4 67
Madison 35.2 33.4 33.1 75
Marion 38.4 38.7 37.7 56
Miller 36.7 36.9 38.4 51
Mississippi 43.3 44.3 42.2 20
Monroe 47.4 45.2 38.3 52
Montgomery 39.2 38.5 42.3 19
Nevada 42.7 44.5 40.3 37
Newton 39.7 36.7 38.3 52
Ouachita 39.4 43.4 45.5 6
Perry 34.2 35.0 37.5 57
Phillips 44.2 45.8 45.2 7
Pike 40.2 35.9 37.1 60
Poinsett 42.4 43.8 46.2 4
Polk 38.1 36.4 39.4 44
Pope 38.7 39.0 39.0 47
Prairie 43.5 46.5 44.0 12
Pulaski 37.3 37.0 36.8 61
Randolph 39.4 42.5 43.3 14
St. Francis 41.2 45.1 41.6 24
Saline 35.2 36.0 35.2 68
Scott 40.0 41.4 40.2 38
Searcy 39.3 44.1 41.6 24
Sebastian 34.5 35.8 36.1 64
Sevier 46.2 46.3 45.8 5
Sharp 37.1 42.2 41.6 24
Stone 39.1 35.8 34.6 71
Union 41.2 41.9 39.7 42
Van Buren 39.3 41.2 41.3 30
Washington 36.2 35.0 35.8 65
White 38.6 37.4 40.2 38
Woodruff 46.5 49.3 47.3 1
Yell 41.9 43.4 43.2 15
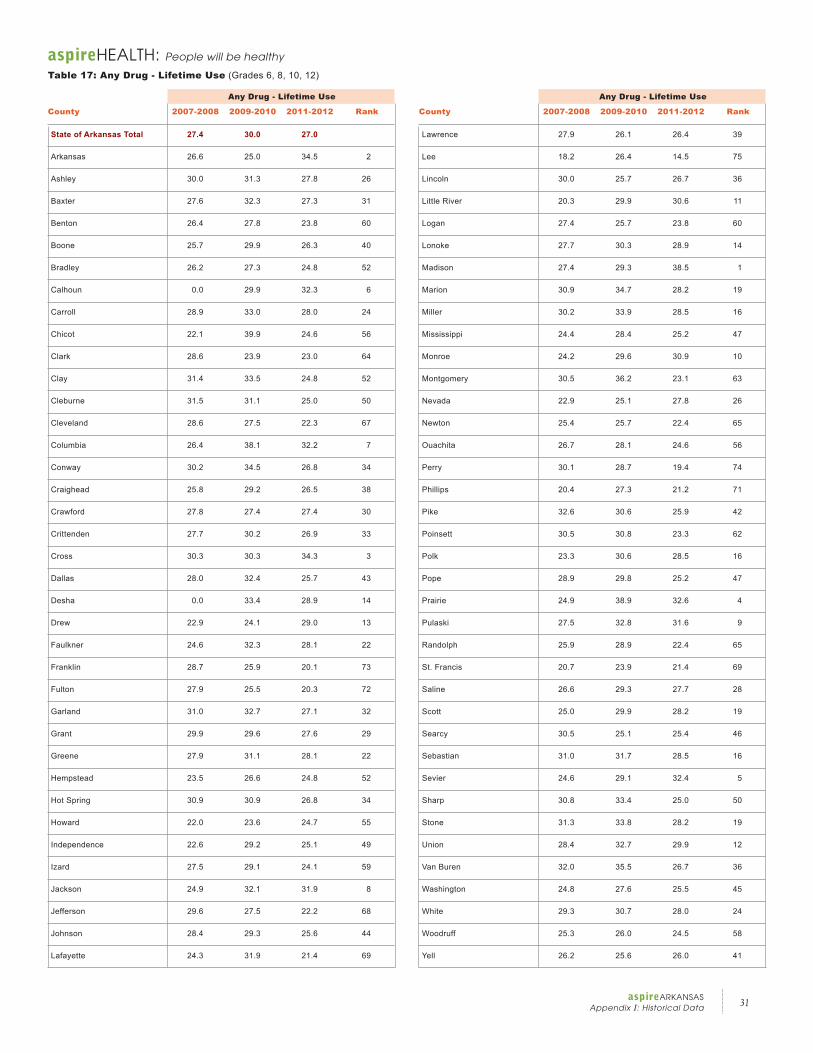
31aspireARKANSAS
Appendix I: Historical Data
aspireHEALTH: People will be healthy
Table 17: Any Drug - Lifetime Use (Grades 6, 8, 10, 12)
Any Drug - Lifetime Use
County 2007-2008 2009-2010 2011-2012 Rank
Any Drug - Lifetime Use
County 2007-2008 2009-2010 2011-2012 Rank
State of Arkansas Total 27.4 30.0 27.0
Arkansas 26.6 25.0 34.5 2
Ashley 30.0 31.3 27.8 26
Baxter 27.6 32.3 27.3 31
Benton 26.4 27.8 23.8 60
Boone 25.7 29.9 26.3 40
Bradley 26.2 27.3 24.8 52
Calhoun 0.0 29.9 32.3 6
Carroll 28.9 33.0 28.0 24
Chicot 22.1 39.9 24.6 56
Clark 28.6 23.9 23.0 64
Clay 31.4 33.5 24.8 52
Cleburne 31.5 31.1 25.0 50
Cleveland 28.6 27.5 22.3 67
Columbia 26.4 38.1 32.2 7
Conway 30.2 34.5 26.8 34
Craighead 25.8 29.2 26.5 38
Crawford 27.8 27.4 27.4 30
Crittenden 27.7 30.2 26.9 33
Cross 30.3 30.3 34.3 3
Dallas 28.0 32.4 25.7 43
Desha 0.0 33.4 28.9 14
Drew 22.9 24.1 29.0 13
Faulkner 24.6 32.3 28.1 22
Franklin 28.7 25.9 20.1 73
Fulton 27.9 25.5 20.3 72
Garland 31.0 32.7 27.1 32
Grant 29.9 29.6 27.6 29
Greene 27.9 31.1 28.1 22
Hempstead 23.5 26.6 24.8 52
Hot Spring 30.9 30.9 26.8 34
Howard 22.0 23.6 24.7 55
Independence 22.6 29.2 25.1 49
Izard 27.5 29.1 24.1 59
Jackson 24.9 32.1 31.9 8
Jefferson 29.6 27.5 22.2 68
Johnson 28.4 29.3 25.6 44
Lafayette 24.3 31.9 21.4 69
Lawrence 27.9 26.1 26.4 39
Lee 18.2 26.4 14.5 75
Lincoln 30.0 25.7 26.7 36
Little River 20.3 29.9 30.6 11
Logan 27.4 25.7 23.8 60
Lonoke 27.7 30.3 28.9 14
Madison 27.4 29.3 38.5 1
Marion 30.9 34.7 28.2 19
Miller 30.2 33.9 28.5 16
Mississippi 24.4 28.4 25.2 47
Monroe 24.2 29.6 30.9 10
Montgomery 30.5 36.2 23.1 63
Nevada 22.9 25.1 27.8 26
Newton 25.4 25.7 22.4 65
Ouachita 26.7 28.1 24.6 56
Perry 30.1 28.7 19.4 74
Phillips 20.4 27.3 21.2 71
Pike 32.6 30.6 25.9 42
Poinsett 30.5 30.8 23.3 62
Polk 23.3 30.6 28.5 16
Pope 28.9 29.8 25.2 47
Prairie 24.9 38.9 32.6 4
Pulaski 27.5 32.8 31.6 9
Randolph 25.9 28.9 22.4 65
St. Francis 20.7 23.9 21.4 69
Saline 26.6 29.3 27.7 28
Scott 25.0 29.9 28.2 19
Searcy 30.5 25.1 25.4 46
Sebastian 31.0 31.7 28.5 16
Sevier 24.6 29.1 32.4 5
Sharp 30.8 33.4 25.0 50
Stone 31.3 33.8 28.2 19
Union 28.4 32.7 29.9 12
Van Buren 32.0 35.5 26.7 36
Washington 24.8 27.6 25.5 45
White 29.3 30.7 28.0 24
Woodruff 25.3 26.0 24.5 58
Yell 26.2 25.6 26.0 41
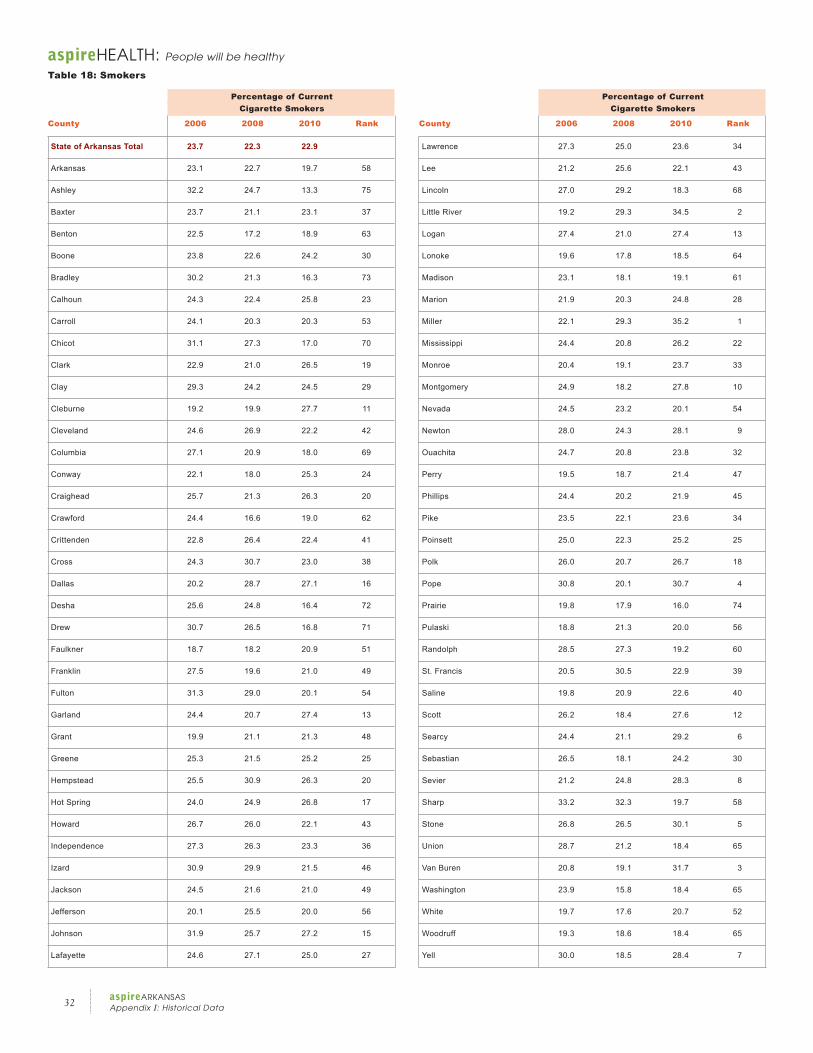
32aspireARKANSASAppendix I: Historical Data
aspireHEALTH: People will be healthy
Table 18: Smokers
Percentage of Current Cigarette Smokers
County 2006 2008 2010 Rank
Percentage of Current Cigarette Smokers
County 2006 2008 2010 Rank
State of Arkansas Total 23.7 22.3 22.9
Arkansas 23.1 22.7 19.7 58
Ashley 32.2 24.7 13.3 75
Baxter 23.7 21.1 23.1 37
Benton 22.5 17.2 18.9 63
Boone 23.8 22.6 24.2 30
Bradley 30.2 21.3 16.3 73
Calhoun 24.3 22.4 25.8 23
Carroll 24.1 20.3 20.3 53
Chicot 31.1 27.3 17.0 70
Clark 22.9 21.0 26.5 19
Clay 29.3 24.2 24.5 29
Cleburne 19.2 19.9 27.7 11
Cleveland 24.6 26.9 22.2 42
Columbia 27.1 20.9 18.0 69
Conway 22.1 18.0 25.3 24
Craighead 25.7 21.3 26.3 20
Crawford 24.4 16.6 19.0 62
Crittenden 22.8 26.4 22.4 41
Cross 24.3 30.7 23.0 38
Dallas 20.2 28.7 27.1 16
Desha 25.6 24.8 16.4 72
Drew 30.7 26.5 16.8 71
Faulkner 18.7 18.2 20.9 51
Franklin 27.5 19.6 21.0 49
Fulton 31.3 29.0 20.1 54
Garland 24.4 20.7 27.4 13
Grant 19.9 21.1 21.3 48
Greene 25.3 21.5 25.2 25
Hempstead 25.5 30.9 26.3 20
Hot Spring 24.0 24.9 26.8 17
Howard 26.7 26.0 22.1 43
Independence 27.3 26.3 23.3 36
Izard 30.9 29.9 21.5 46
Jackson 24.5 21.6 21.0 49
Jefferson 20.1 25.5 20.0 56
Johnson 31.9 25.7 27.2 15
Lafayette 24.6 27.1 25.0 27
Lawrence 27.3 25.0 23.6 34
Lee 21.2 25.6 22.1 43
Lincoln 27.0 29.2 18.3 68
Little River 19.2 29.3 34.5 2
Logan 27.4 21.0 27.4 13
Lonoke 19.6 17.8 18.5 64
Madison 23.1 18.1 19.1 61
Marion 21.9 20.3 24.8 28
Miller 22.1 29.3 35.2 1
Mississippi 24.4 20.8 26.2 22
Monroe 20.4 19.1 23.7 33
Montgomery 24.9 18.2 27.8 10
Nevada 24.5 23.2 20.1 54
Newton 28.0 24.3 28.1 9
Ouachita 24.7 20.8 23.8 32
Perry 19.5 18.7 21.4 47
Phillips 24.4 20.2 21.9 45
Pike 23.5 22.1 23.6 34
Poinsett 25.0 22.3 25.2 25
Polk 26.0 20.7 26.7 18
Pope 30.8 20.1 30.7 4
Prairie 19.8 17.9 16.0 74
Pulaski 18.8 21.3 20.0 56
Randolph 28.5 27.3 19.2 60
St. Francis 20.5 30.5 22.9 39
Saline 19.8 20.9 22.6 40
Scott 26.2 18.4 27.6 12
Searcy 24.4 21.1 29.2 6
Sebastian 26.5 18.1 24.2 30
Sevier 21.2 24.8 28.3 8
Sharp 33.2 32.3 19.7 58
Stone 26.8 26.5 30.1 5
Union 28.7 21.2 18.4 65
Van Buren 20.8 19.1 31.7 3
Washington 23.9 15.8 18.4 65
White 19.7 17.6 20.7 52
Woodruff 19.3 18.6 18.4 65
Yell 30.0 18.5 28.4 7
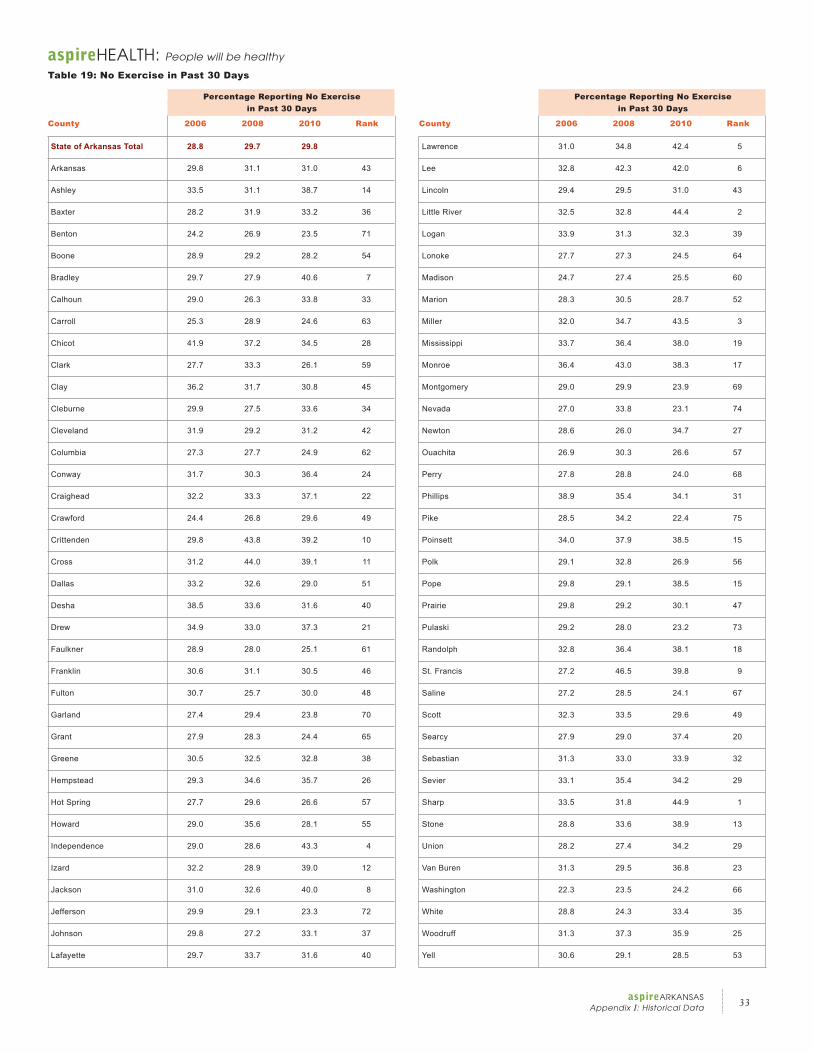
33aspireARKANSAS
Appendix I: Historical Data
aspireHEALTH: People will be healthy
Table 19: No Exercise in Past 30 Days
Percentage Reporting No Exercise in Past 30 Days
County 2006 2008 2010 Rank
Percentage Reporting No Exercise in Past 30 Days
County 2006 2008 2010 Rank
State of Arkansas Total 28.8 29.7 29.8
Arkansas 29.8 31.1 31.0 43
Ashley 33.5 31.1 38.7 14
Baxter 28.2 31.9 33.2 36
Benton 24.2 26.9 23.5 71
Boone 28.9 29.2 28.2 54
Bradley 29.7 27.9 40.6 7
Calhoun 29.0 26.3 33.8 33
Carroll 25.3 28.9 24.6 63
Chicot 41.9 37.2 34.5 28
Clark 27.7 33.3 26.1 59
Clay 36.2 31.7 30.8 45
Cleburne 29.9 27.5 33.6 34
Cleveland 31.9 29.2 31.2 42
Columbia 27.3 27.7 24.9 62
Conway 31.7 30.3 36.4 24
Craighead 32.2 33.3 37.1 22
Crawford 24.4 26.8 29.6 49
Crittenden 29.8 43.8 39.2 10
Cross 31.2 44.0 39.1 11
Dallas 33.2 32.6 29.0 51
Desha 38.5 33.6 31.6 40
Drew 34.9 33.0 37.3 21
Faulkner 28.9 28.0 25.1 61
Franklin 30.6 31.1 30.5 46
Fulton 30.7 25.7 30.0 48
Garland 27.4 29.4 23.8 70
Grant 27.9 28.3 24.4 65
Greene 30.5 32.5 32.8 38
Hempstead 29.3 34.6 35.7 26
Hot Spring 27.7 29.6 26.6 57
Howard 29.0 35.6 28.1 55
Independence 29.0 28.6 43.3 4
Izard 32.2 28.9 39.0 12
Jackson 31.0 32.6 40.0 8
Jefferson 29.9 29.1 23.3 72
Johnson 29.8 27.2 33.1 37
Lafayette 29.7 33.7 31.6 40
Lawrence 31.0 34.8 42.4 5
Lee 32.8 42.3 42.0 6
Lincoln 29.4 29.5 31.0 43
Little River 32.5 32.8 44.4 2
Logan 33.9 31.3 32.3 39
Lonoke 27.7 27.3 24.5 64
Madison 24.7 27.4 25.5 60
Marion 28.3 30.5 28.7 52
Miller 32.0 34.7 43.5 3
Mississippi 33.7 36.4 38.0 19
Monroe 36.4 43.0 38.3 17
Montgomery 29.0 29.9 23.9 69
Nevada 27.0 33.8 23.1 74
Newton 28.6 26.0 34.7 27
Ouachita 26.9 30.3 26.6 57
Perry 27.8 28.8 24.0 68
Phillips 38.9 35.4 34.1 31
Pike 28.5 34.2 22.4 75
Poinsett 34.0 37.9 38.5 15
Polk 29.1 32.8 26.9 56
Pope 29.8 29.1 38.5 15
Prairie 29.8 29.2 30.1 47
Pulaski 29.2 28.0 23.2 73
Randolph 32.8 36.4 38.1 18
St. Francis 27.2 46.5 39.8 9
Saline 27.2 28.5 24.1 67
Scott 32.3 33.5 29.6 49
Searcy 27.9 29.0 37.4 20
Sebastian 31.3 33.0 33.9 32
Sevier 33.1 35.4 34.2 29
Sharp 33.5 31.8 44.9 1
Stone 28.8 33.6 38.9 13
Union 28.2 27.4 34.2 29
Van Buren 31.3 29.5 36.8 23
Washington 22.3 23.5 24.2 66
White 28.8 24.3 33.4 35
Woodruff 31.3 37.3 35.9 25
Yell 30.6 29.1 28.5 53
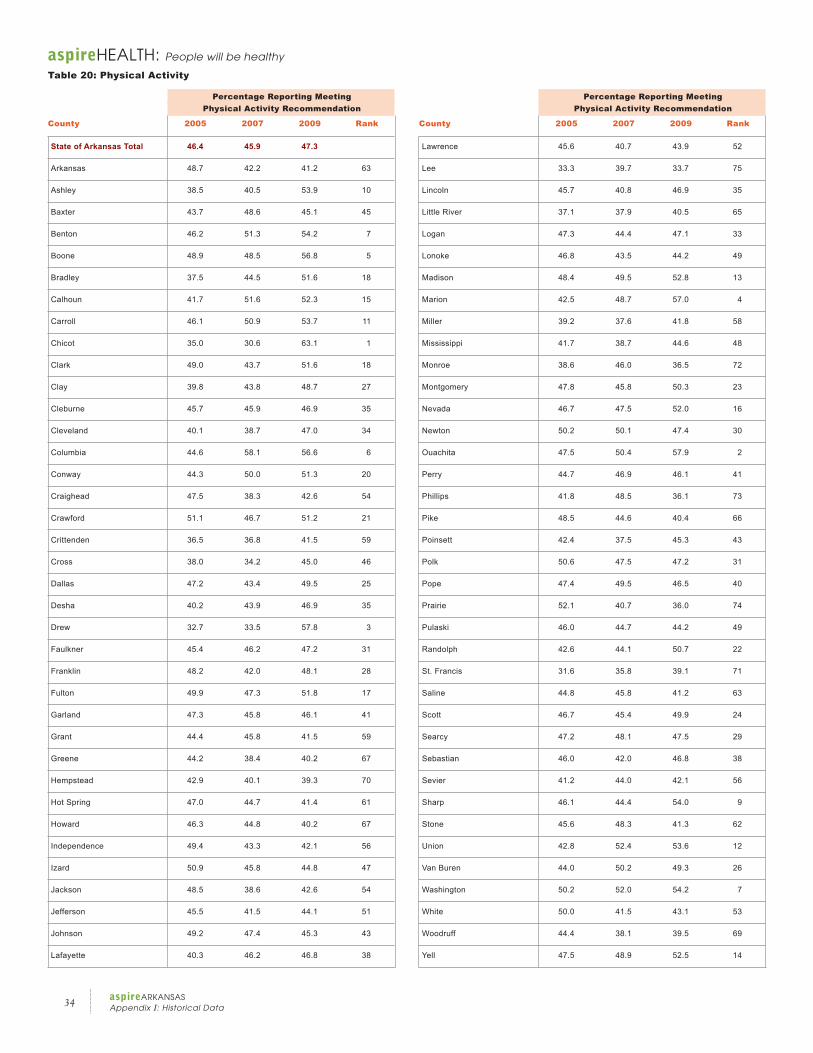
34aspireARKANSASAppendix I: Historical Data
aspireHEALTH: People will be healthy
Table 20: Physical Activity
State of Arkansas Total 46.4 45.9 47.3
Arkansas 48.7 42.2 41.2 63
Ashley 38.5 40.5 53.9 10
Baxter 43.7 48.6 45.1 45
Benton 46.2 51.3 54.2 7
Boone 48.9 48.5 56.8 5
Bradley 37.5 44.5 51.6 18
Calhoun 41.7 51.6 52.3 15
Carroll 46.1 50.9 53.7 11
Chicot 35.0 30.6 63.1 1
Clark 49.0 43.7 51.6 18
Clay 39.8 43.8 48.7 27
Cleburne 45.7 45.9 46.9 35
Cleveland 40.1 38.7 47.0 34
Columbia 44.6 58.1 56.6 6
Conway 44.3 50.0 51.3 20
Craighead 47.5 38.3 42.6 54
Crawford 51.1 46.7 51.2 21
Crittenden 36.5 36.8 41.5 59
Cross 38.0 34.2 45.0 46
Dallas 47.2 43.4 49.5 25
Desha 40.2 43.9 46.9 35
Drew 32.7 33.5 57.8 3
Faulkner 45.4 46.2 47.2 31
Franklin 48.2 42.0 48.1 28
Fulton 49.9 47.3 51.8 17
Garland 47.3 45.8 46.1 41
Grant 44.4 45.8 41.5 59
Greene 44.2 38.4 40.2 67
Hempstead 42.9 40.1 39.3 70
Hot Spring 47.0 44.7 41.4 61
Howard 46.3 44.8 40.2 67
Independence 49.4 43.3 42.1 56
Izard 50.9 45.8 44.8 47
Jackson 48.5 38.6 42.6 54
Jefferson 45.5 41.5 44.1 51
Johnson 49.2 47.4 45.3 43
Lafayette 40.3 46.2 46.8 38
Lawrence 45.6 40.7 43.9 52
Lee 33.3 39.7 33.7 75
Lincoln 45.7 40.8 46.9 35
Little River 37.1 37.9 40.5 65
Logan 47.3 44.4 47.1 33
Lonoke 46.8 43.5 44.2 49
Madison 48.4 49.5 52.8 13
Marion 42.5 48.7 57.0 4
Miller 39.2 37.6 41.8 58
Mississippi 41.7 38.7 44.6 48
Monroe 38.6 46.0 36.5 72
Montgomery 47.8 45.8 50.3 23
Nevada 46.7 47.5 52.0 16
Newton 50.2 50.1 47.4 30
Ouachita 47.5 50.4 57.9 2
Perry 44.7 46.9 46.1 41
Phillips 41.8 48.5 36.1 73
Pike 48.5 44.6 40.4 66
Poinsett 42.4 37.5 45.3 43
Polk 50.6 47.5 47.2 31
Pope 47.4 49.5 46.5 40
Prairie 52.1 40.7 36.0 74
Pulaski 46.0 44.7 44.2 49
Randolph 42.6 44.1 50.7 22
St. Francis 31.6 35.8 39.1 71
Saline 44.8 45.8 41.2 63
Scott 46.7 45.4 49.9 24
Searcy 47.2 48.1 47.5 29
Sebastian 46.0 42.0 46.8 38
Sevier 41.2 44.0 42.1 56
Sharp 46.1 44.4 54.0 9
Stone 45.6 48.3 41.3 62
Union 42.8 52.4 53.6 12
Van Buren 44.0 50.2 49.3 26
Washington 50.2 52.0 54.2 7
White 50.0 41.5 43.1 53
Woodruff 44.4 38.1 39.5 69
Yell 47.5 48.9 52.5 14
Percentage Reporting Meeting Physical Activity Recommendation
County 2005 2007 2009 Rank
Percentage Reporting Meeting Physical Activity Recommendation
County 2005 2007 2009 Rank
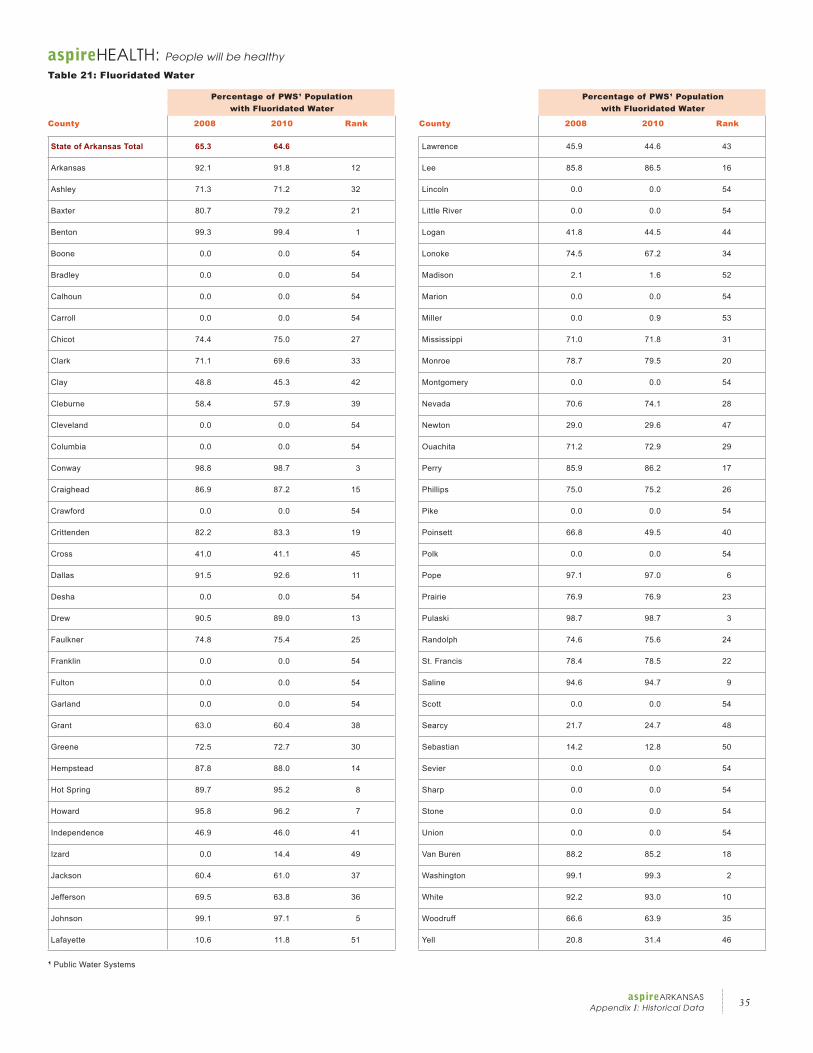
35aspireARKANSAS
Appendix I: Historical Data
¹ Public Water Systems
aspireHEALTH: People will be healthy
Table 21: Fluoridated Water
State of Arkansas Total 65.3 64.6
Arkansas 92.1 91.8 12
Ashley 71.3 71.2 32
Baxter 80.7 79.2 21
Benton 99.3 99.4 1
Boone 0.0 0.0 54
Bradley 0.0 0.0 54
Calhoun 0.0 0.0 54
Carroll 0.0 0.0 54
Chicot 74.4 75.0 27
Clark 71.1 69.6 33
Clay 48.8 45.3 42
Cleburne 58.4 57.9 39
Cleveland 0.0 0.0 54
Columbia 0.0 0.0 54
Conway 98.8 98.7 3
Craighead 86.9 87.2 15
Crawford 0.0 0.0 54
Crittenden 82.2 83.3 19
Cross 41.0 41.1 45
Dallas 91.5 92.6 11
Desha 0.0 0.0 54
Drew 90.5 89.0 13
Faulkner 74.8 75.4 25
Franklin 0.0 0.0 54
Fulton 0.0 0.0 54
Garland 0.0 0.0 54
Grant 63.0 60.4 38
Greene 72.5 72.7 30
Hempstead 87.8 88.0 14
Hot Spring 89.7 95.2 8
Howard 95.8 96.2 7
Independence 46.9 46.0 41
Izard 0.0 14.4 49
Jackson 60.4 61.0 37
Jefferson 69.5 63.8 36
Johnson 99.1 97.1 5
Lafayette 10.6 11.8 51
Lawrence 45.9 44.6 43
Lee 85.8 86.5 16
Lincoln 0.0 0.0 54
Little River 0.0 0.0 54
Logan 41.8 44.5 44
Lonoke 74.5 67.2 34
Madison 2.1 1.6 52
Marion 0.0 0.0 54
Miller 0.0 0.9 53
Mississippi 71.0 71.8 31
Monroe 78.7 79.5 20
Montgomery 0.0 0.0 54
Nevada 70.6 74.1 28
Newton 29.0 29.6 47
Ouachita 71.2 72.9 29
Perry 85.9 86.2 17
Phillips 75.0 75.2 26
Pike 0.0 0.0 54
Poinsett 66.8 49.5 40
Polk 0.0 0.0 54
Pope 97.1 97.0 6
Prairie 76.9 76.9 23
Pulaski 98.7 98.7 3
Randolph 74.6 75.6 24
St. Francis 78.4 78.5 22
Saline 94.6 94.7 9
Scott 0.0 0.0 54
Searcy 21.7 24.7 48
Sebastian 14.2 12.8 50
Sevier 0.0 0.0 54
Sharp 0.0 0.0 54
Stone 0.0 0.0 54
Union 0.0 0.0 54
Van Buren 88.2 85.2 18
Washington 99.1 99.3 2
White 92.2 93.0 10
Woodruff 66.6 63.9 35
Yell 20.8 31.4 46
Percentage of PWS¹ Population with Fluoridated Water
County 2008 2010 Rank
Percentage of PWS¹ Population with Fluoridated Water
County 2008 2010 Rank
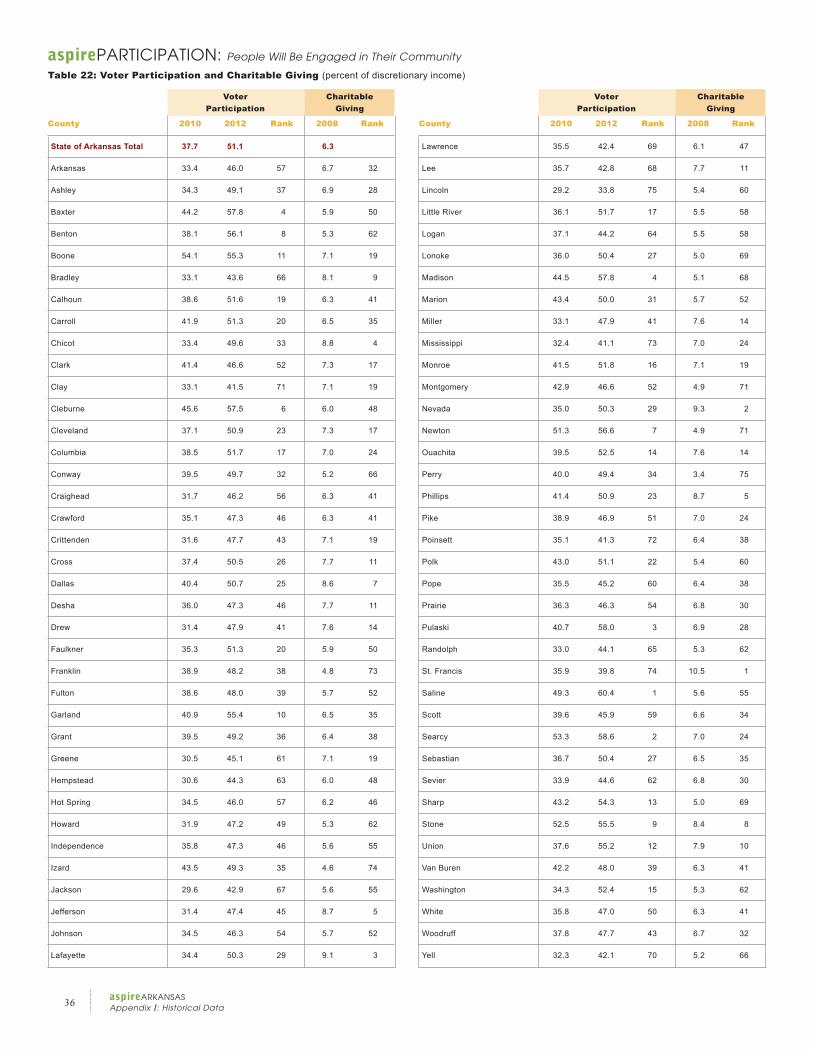
36aspireARKANSASAppendix I: Historical Data
aspirePARTICIPATION: People Will Be Engaged in Their Community
Table 22: Voter Participation and Charitable Giving (percent of discretionary income)
State of Arkansas Total 37.7 51.1 6.3
Arkansas 33.4 46.0 57 6.7 32
Ashley 34.3 49.1 37 6.9 28
Baxter 44.2 57.8 4 5.9 50
Benton 38.1 56.1 8 5.3 62
Boone 54.1 55.3 11 7.1 19
Bradley 33.1 43.6 66 8.1 9
Calhoun 38.6 51.6 19 6.3 41
Carroll 41.9 51.3 20 6.5 35
Chicot 33.4 49.6 33 8.8 4
Clark 41.4 46.6 52 7.3 17
Clay 33.1 41.5 71 7.1 19
Cleburne 45.6 57.5 6 6.0 48
Cleveland 37.1 50.9 23 7.3 17
Columbia 38.5 51.7 17 7.0 24
Conway 39.5 49.7 32 5.2 66
Craighead 31.7 46.2 56 6.3 41
Crawford 35.1 47.3 46 6.3 41
Crittenden 31.6 47.7 43 7.1 19
Cross 37.4 50.5 26 7.7 11
Dallas 40.4 50.7 25 8.6 7
Desha 36.0 47.3 46 7.7 11
Drew 31.4 47.9 41 7.6 14
Faulkner 35.3 51.3 20 5.9 50
Franklin 38.9 48.2 38 4.8 73
Fulton 38.6 48.0 39 5.7 52
Garland 40.9 55.4 10 6.5 35
Grant 39.5 49.2 36 6.4 38
Greene 30.5 45.1 61 7.1 19
Hempstead 30.6 44.3 63 6.0 48
Hot Spring 34.5 46.0 57 6.2 46
Howard 31.9 47.2 49 5.3 62
Independence 35.8 47.3 46 5.6 55
Izard 43.5 49.3 35 4.6 74
Jackson 29.6 42.9 67 5.6 55
Jefferson 31.4 47.4 45 8.7 5
Johnson 34.5 46.3 54 5.7 52
Lafayette 34.4 50.3 29 9.1 3
Lawrence 35.5 42.4 69 6.1 47
Lee 35.7 42.8 68 7.7 11
Lincoln 29.2 33.8 75 5.4 60
Little River 36.1 51.7 17 5.5 58
Logan 37.1 44.2 64 5.5 58
Lonoke 36.0 50.4 27 5.0 69
Madison 44.5 57.8 4 5.1 68
Marion 43.4 50.0 31 5.7 52
Miller 33.1 47.9 41 7.6 14
Mississippi 32.4 41.1 73 7.0 24
Monroe 41.5 51.8 16 7.1 19
Montgomery 42.9 46.6 52 4.9 71
Nevada 35.0 50.3 29 9.3 2
Newton 51.3 56.6 7 4.9 71
Ouachita 39.5 52.5 14 7.6 14
Perry 40.0 49.4 34 3.4 75
Phillips 41.4 50.9 23 8.7 5
Pike 38.9 46.9 51 7.0 24
Poinsett 35.1 41.3 72 6.4 38
Polk 43.0 51.1 22 5.4 60
Pope 35.5 45.2 60 6.4 38
Prairie 36.3 46.3 54 6.8 30
Pulaski 40.7 58.0 3 6.9 28
Randolph 33.0 44.1 65 5.3 62
St. Francis 35.9 39.8 74 10.5 1
Saline 49.3 60.4 1 5.6 55
Scott 39.6 45.9 59 6.6 34
Searcy 53.3 58.6 2 7.0 24
Sebastian 36.7 50.4 27 6.5 35
Sevier 33.9 44.6 62 6.8 30
Sharp 43.2 54.3 13 5.0 69
Stone 52.5 55.5 9 8.4 8
Union 37.6 55.2 12 7.9 10
Van Buren 42.2 48.0 39 6.3 41
Washington 34.3 52.4 15 5.3 62
White 35.8 47.0 50 6.3 41
Woodruff 37.8 47.7 43 6.7 32
Yell 32.3 42.1 70 5.2 66
Voter Charitable Participation Giving
County 2010 2012 Rank 2008 Rank
Voter Charitable Participation Giving
County 2010 2012 Rank 2008 Rank