arpanet host to host access and disengagement measurements · arpanet host to host access and...
TRANSCRIPT

NTIA-REPORT-78-3
ARPAN ET Host to Host Accessand Disengagement Measurements
J.A. Payne
u.s. DEPARTMENT OF COMMERCEJuanita M. Kreps, Secretary
Henry Geller, Assistant Secretary -Designatefor Communications and Information
May 1978


TABLE OF CONTENTS
LIST OF FIGURES
LIST OF TABLES
GLOSSARY AND ACRONYMS
ABSTRACT
1. INTRODUCTION
2. ARPANET .DESCRIPTION
2.1. Protocols
2.2. Architecture
3. NTIA/ITS HOST DESCRIPTION
4. ACCESS AND DISENGAGEMENT PARAMETERS FROM PROPOSED
STANDARD 1033
5. EXPERIMENT DESIGN FOR ACCESS AND DISENGAGEMENT
PARAMETERS
5.1. Network Events
5.2. Telnet Protocols
5.3. Design of Access Time Measurements
5.4. Design of Disengagement Time Measurements
5.5. Sample Size
6 • MEASUREMENT RESULTS
7. ANALYSIS OF RESULTS
7.1. Access and Disengagement
7.2. Associate Parameters
8. SUMMARY AND CONCLUSIONS
9. RECOMMENDATIONS
10. ACKNOWLEDGMENTS
11. REFERENCES
APPENDIX. MEASUREMENT TABLES
iii
Page
iv
v
vi
1
1
2
7
8
11
13
16
16
18
18
23
25
30
34
34
38
39
42
42
43
45

LIST OF FIGURES
Page.
Figure 1.
Figure 2.
Figure 3.
Figure 4.-
Figure 5.
Figure 6.
Figure 7.
Figure 8.
Figure 9.
ARPANET geographic map from the ARPANET 1977
directory.
ARPANET logical map from the ARPANET 1977
directory.
Conceptual design of the ARPANET.
Sketch of the NTIA/ITS Host connection to the
DOCB TIP.
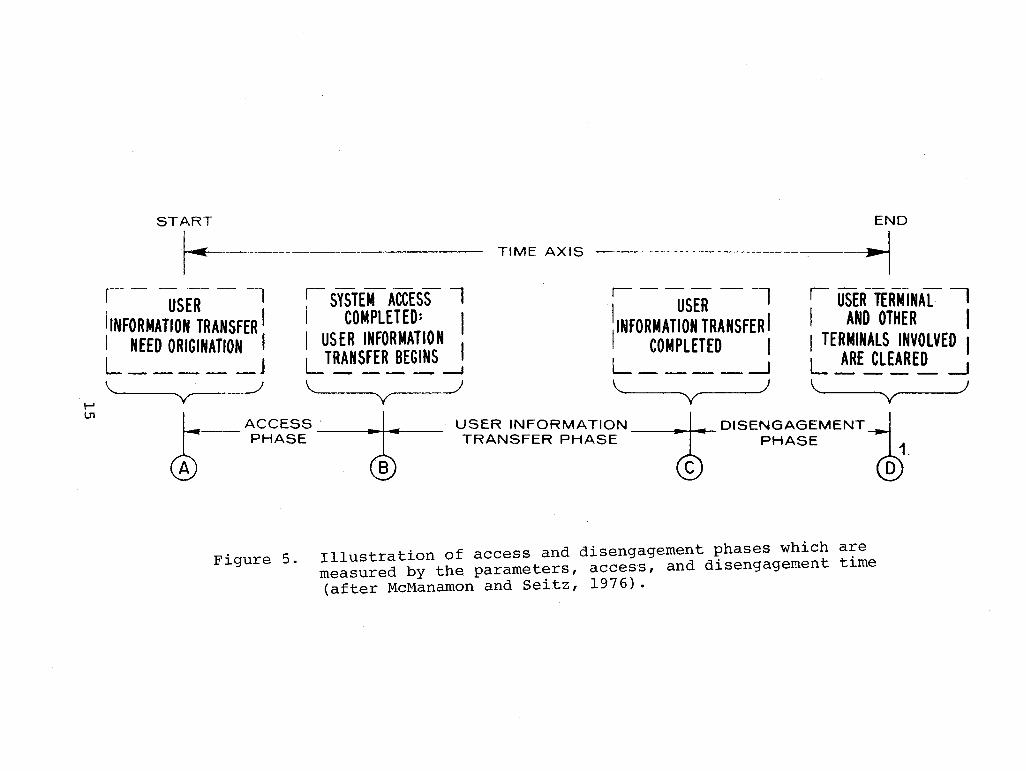
Illustration of access and disengagement phases
which are measured by the parameters, access,
and disengagement time.
Host-to-Host connection via telnet protocol.
Flow diagram for measuring Host-to-Host access
time via telnet protocol.
Flow diagram for measuring Host-to-Host dis
engagement time via telnet protocol.
Frequency histogram for "access time between
NTIA/ITS Host and the Rutgers Host; each class
interval represents 65 milliseconds of time.
iv
4
6
9
12
15
19
21
24
27

32
LIST OF TABLES
Page
Table 1. Measurement Values for Connection-Attempt Time
and Close-Attempt Time in Milliseconds Averaged
from Tables A.l Through A.IO 31
Table 2. Measurement Values for Access Time and Dis
engagement Time Values (in seconds) Derived
fro~ Table 1
Table A.l. Sample Values from Measurements on
August 23, 1977
Table A.2". Sample Values from Measurements on
August 29, 1977
Table A.3. Sample Values from Measurements on
September 2 , 1977
Table A.4. Sample Values from Measurements on
September 6, 1977
Table A.5. Sample Values from Measurements on
September 7, 1977
Table A. 6. Sample Values from Measurements on
September 9, 1977
Table A.7. Sample Values from Measurements on
September 14, 1977
Table A. 8. Sample Values from Measurements on
September 15, 1977
Table A.9. Sample Values from Measurements on
September 20, 1977
Table A.IO. Sample Values from Measurements on
September 21, 1977
46
47
48
49
50
51
52
53
54
55
v

ARPA
Avg
BSC
CR
DEC
DOCB
Elf
EXEC
FTSC
Host
IMP
MHR
modem
NCC
NCP
NTIA/ITS
protocol
Telnet
TIP
VDH
GLOSSARY AND ACRONYMS
Advanced Research Projects Agency
Average of hourly data
Binary synchronous line control pro~ocol
Carriage return
Digital Equipment Corporation
Department of Cormnerce Boulder
Name of PDP-II operating system software
Executive software system
Federal Telecommunications Standards Committee
Computer center
Interface message processor
Minimal hop route
Modulator and demodulator
Network control center
Network control program
National Telecommunications and Information Administra
tion/ Institute for Telecommunication Sciences
In communications, a set of rules governing the
exchange of information
Telnet software system
Terminal interface processor
Very distant Host
vi

ARPANET HOST TO HOST ACCESS AND DISENGAGEMENT MEASUREMENTS
Judd A. Payne*
A set of telecommunications performance parametershave been developed for proposed Federal Standard 1033.The measurement of five of these parameters, access time,incorrect access time, access denial probability, disengagement time and disengagement failure probabilityare the subject of this report. The telnet protocolof the ARPANET is employed to measure the access anddisengagement parameters from a Host to Host connection.
Key words: access, ARPANET, disengagement, Elf operatingsystem, Host, IMP (interface message processor) ,NCP (network control program), performanceparameter, protocol, Telnet, TIP (terminalinterface processor)
1. INTRODUCTION
The National Telecommunications and Information Administra
tion, Institute for Telecommunication Sciences (NTIA/ITS) is
engaged in the development of proposed Federal Standard 1033.
This proposed Standard was published in the Federal Register
(1977). The development of the standard was authorized by the
Federal Telecommunication Standards Committee (FTSC). The
purpose of the Standard is to develop digital communication
performance parameters for telecommunication systems from a user
oriented approach. As revealed by McManamon et ale (1975), a
sampling of commercial and Federal standards. generated a list of
132 engineering-oriented performance parameters for telecommuni
cation systems. The purpose of proposed Standard 10~3 is to
standardize the description of the performance of telecommunica
tion systems, and to present a set of considerably fewer perfor
mance parameters which would enable a user to better understand
the performance of a telecommunication system.
*The author is with the Institute for Telecommunication Sciences,National Telecommunications and Information Administration,U.S. Department of Commerce, Boulder, Colorado 80303.

In order to demonstrate the usefulness of the proposed para
meters in Federal Standard (FS) 1033 an ARPANET measurement
program was established at ITS. Along with the measurement
program, theoretical studies in support of the proposed standard
have been reported (in papers scheduled for future publication)
by Seitz and McManamon and Kimmett and Seitz.
This report is a sequel to two previous memorandums by Payne
entitled "Access Time Measurements of the ARPA Network" (aT Tech.
Memo. 76-229, 1976) and "Host to Host Disengagement Time on the
ARPANET" (aT Tech. Memo 77-237 (1977). (These reports are avail
able from u.S. Dept. of Commerce, Boulder, CO 80303.) These
previous reports were concerned with the measurements of access
time and disengagement time which are two of the proposed perfor
mance parameters in Standard 1033. This report concerns further
measures of access time, disengagement time and initial measures
for incorrect access time, access denial probability and dis-
engagement failure probability.
The measurement of each of the proposed parameters required
designing the experiment, developing the needed hardware and
software, conducting tests and analyz'ing the results.
The contents of the following sections include an ARPANET
description, a description of the NTIA/ITS Host1 , a definition of
measurement parameters, a description of the design and. method of
making the ARPANET measurements, tables of measurement data,
and a discussion of the resul ts of the measurement data..
This report concludes with an assessment of the utility of
the 'proposed performance parameters as applied to· the ARPANET
and some recommendations for further study.
2. ARPANET DESCRIPTION
The ARPANET has been described and studied by many persons
(e.g., Schwartz, 1977; Kleinrock, 1976; Davies and Barber, 1973).
IThe designation "NTIA/ITS Host" is new. The organization namechange to NTIA is recent and all previous literature refers to thesame Host as the "aT/ITS Host." 2

3
Because of the ARPANET's overall success, many computer networks
now or in the future plan to emulate the ARPANET (e.g., TELENET,
AUTODIN II).
This description of the ARPANET will briefly review only
those details necessary for the reader to understand the design
of the experiments discussed in the main body of this report.
The word "ARPANET" refers to the Advanced Research Projects
Agency (ARPA) computer network, which is operated by the u.s.Defense Communications Agency. In textbooks, the ARPANET's topol
ogy is described as a packet-switched, fully distributed computer
network. The ARPANET was proposed by L.G. Roberts (1967).
Figure 1 illustrates the ARPANET geographic map as it
existed in June 1977 (ARPANET Directory, 1977). This,map shows
the interconnected nodes of the ARPANET. The circles represent
an enlarged version of those areas of the u.s. where many nodes
are concentrated in some small geographic area. These nodes
contain mini-computers which, along with their interconnecting
links, form the communications "backbone" of the ARPANET. This
communications backbone or subnet is "described as a "packet
switched" subnet. A packet-switched network is designed to carry
data in the form of packets. A channel is occupied only for the
duration of the packet transmission.
In addition to the subnet, the ARPANET includes a number of
independent computer systems called "Hosts". Each Host is
connected to just one node. The Hosts may vary from a large
computer center to a small (mini-computer) system. Examples of
large systems attached to the networks are Control Data Corpora
tion's model 6600 and 7600 systems 2, IBM's large scale model 360
and 370 systems, Digital Equipment Corporation's PDP-IO and many
others. Arnongthe mini-computer Host systems, the PDP-II is
employed most often because of its available communications
2Certain commercial equipment, instruments, or materials areidentified in this paper to adequately specify the experimentalprocedure. In no case does such identification imply recommendation or endorsement by NTIA, .nordoes it imply that the materialor equipment identified is necessarily the best available for thepurpose.

ARPANET GEOGRAPHIC MAP, JUNE 1977
~IT~"LINCOLN MIT6
RA~ CCA\RCC5
IRCC49
BBN40BBN 30
HARVARD
~ SATELLITE CIRCUITo IMPo TIP6 PLURIBUS IMP
(NOTE: THIS MAP DOES NOT SHOW ARPA'S EXPERIMENTALSATELLITE CONNECTIONS)
NAMES SHOWN ARE IMP NAMES, NOT (NECESSARILY) HOST NAMES
Figure 1. ARPANET geographic map from the ARPANET 1977 directory.

software and hardware interface devices. As of June 1977 the
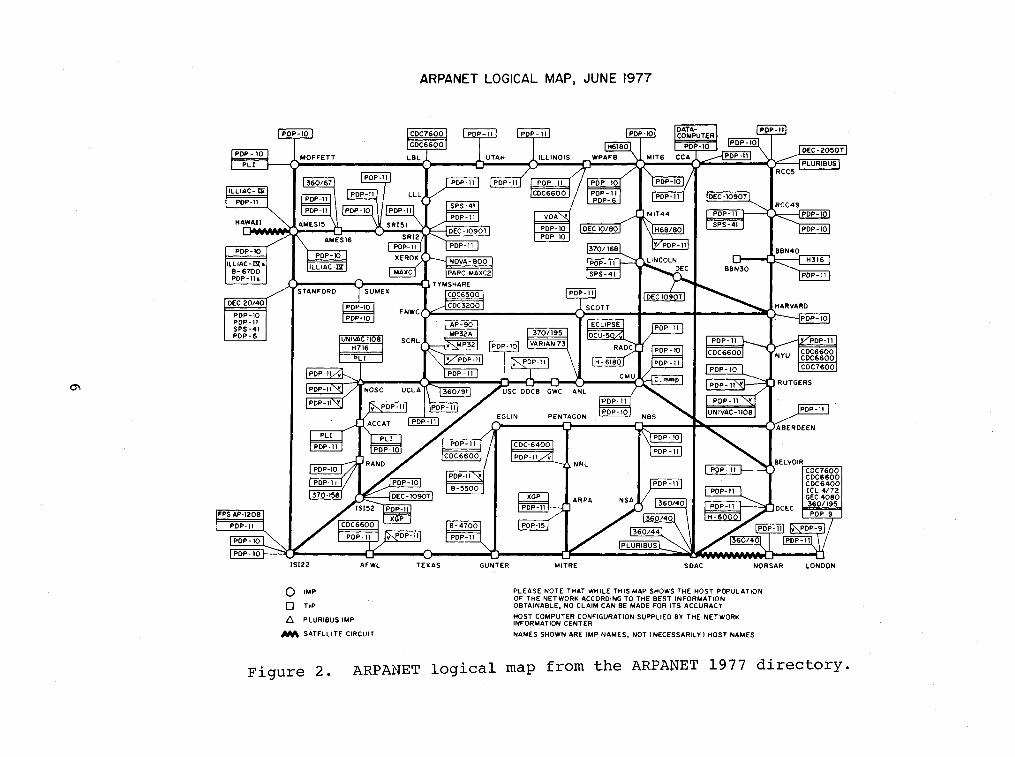
ARPANET network was composed of 57 nodes and 113 Host systems.
Figure 2 is the ARPANET logical map as shown in the ARPANET 1977
Directory. This map identifies all the Host computers on the
ARPANET and their nodal connections.
The network logical map of Figure 2 is called a logical map
because the message paths between the Hosts are not physical con
nections, such as a telephone connection between calling parties.
Physical connections exist between nodes (IMPs and TIPs) and be
tween the nodes and attached Hosts. But a connection between two
Hosts is called a logical connection and it is established by a
message sequence protocol. After a connection has been opened be
tween two Hosts, data messages between the two Hosts flow through
the subnet by packet-switched, store-and-forward techniques.
The communication subnet, composed of nodes, provides the
packet-switch capability for the ARPANET. The nodes are Honeywell
mini-computers and they are interconnected by 50 kilobit per
second (kb/s), full-duplex lines. These lines connect each node
to one or more adjacent nodes so the network is considered to be
fully distributed. The nodes are called Interface Message
Processors (IMPs), pluribus IMPs, or Terminal Interface (Message)
Processors (TIPs) depending on their function. As many as four
Host computers can be attached to each IMP, and more than four
can be attached to a pluribus IMP. The primary function of the
IMP is to accept messages from the attached Hosts, to separate
the message into 1000 bit packets, and to route these messages
through the subnet backbone until the messages reach their desti
nation Hosts. TIPs perform the same function as IMPs but also
permit terminal devices such as teletypes and CRTs to be attached
directly to the TIP. All messages flow through the subnet in the
form of packets of data that are switched from node to node.
As of June 1977, 54 of the 113 Host systems were designated
as server Hosts, which means that these particular Hosts will
accept and respond to messages from any other Host on the/network
(i.e., some Hosts provide limited service). The remaining 59
5
ARPANET LOGICAL MAP, JUNE 1977
LONDON
OEC-2050T
PLURIBUS
BELVOIRi-C~0'"'C"'7"'6"0"0'""'COC6600COC6400ICL 4/72GEC40BO360/195POP-9
NORSARSOAC
POP-Il
MITRE
DEC 20/40
POP-10POP-IlSPS-41POP-6
o IMP
o TIP
D. PLURIBUS IMP
/IlIA SATELLITE CIRCUIT
PLEASE NOTE THAT WHILE THIS MAP SHOWS THE HOST POPULATIONOF THE NETWORK ACCORDING TO THE BEST INFORMATIONOBTAINABLE, NO CLAIM CAN BE MADE FOR 'TS ACCURACY
:;.,';,t~~2~,6~TgNW~F1GURATION SUPPLIED BY THE NETWORK
NAMES SHOWN ARE IMP NAMES. NOT I NECESSARILY) HOST NAMES
Figure 2. ARPANET logical map from the ARPANET 1977 directory.
Hosts are known as user Hosts, and normally they can only com
municate with other server Hosts although there are some exceptions.
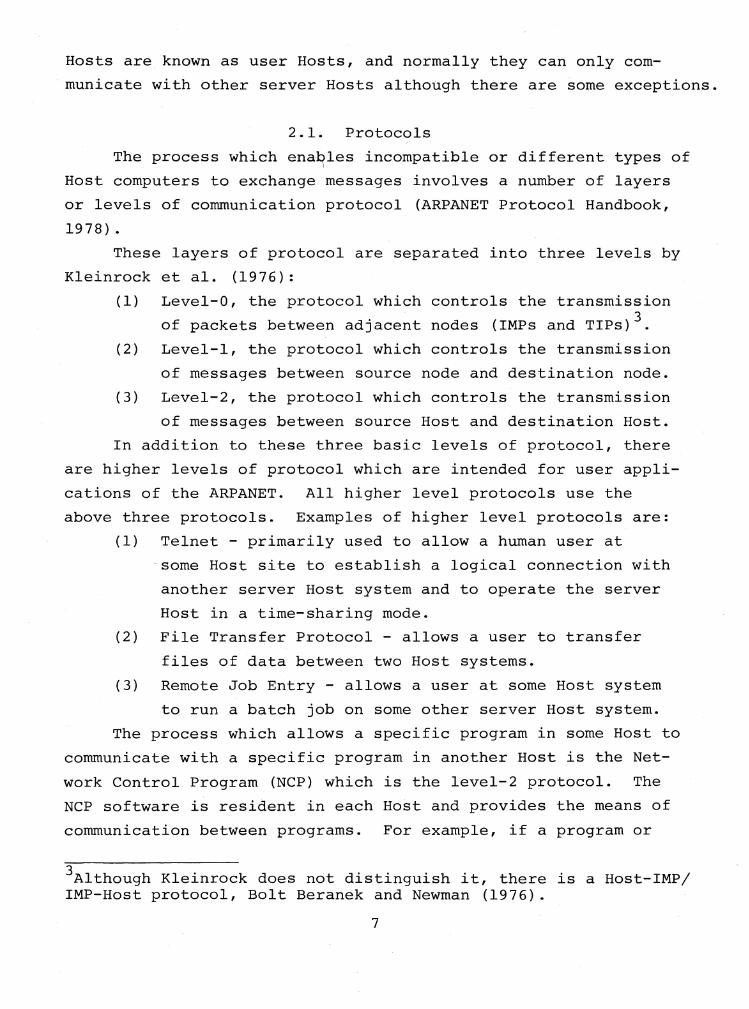
2.1. Protocols
The process which ena~les incompatible or different types of
Host computers to exchange messages involves a number of layers
or levels of communication protocol (ARPANET Protocol Handbook,
1978) .
These layers of protocol are separated into three levels by
Kleinrock et ale (1976):
(1) Level-O, the protocol which controls the transmission
of packets between adjacent nodes (IMPs and TIPS)3.
(2) Level-I, the protocol which controls the transmission
of messages between source node and destination node.
(3) Level-2, the protocol which controls the transmission
of messages between source Host and destination Host.
In addition to these three basic levels of protocol, there
are higher levels of protocol which are intended for user appli
cations of the ARPANET. All higher level protocols use the
above three protocols. Examples of higher level protocols are:
(1) Telnet - primarily used to allow a human user at
-some Host site to establish a logical connection with
another server Host system and to operate the server
Host in a time-sharing mode.
(2) File Transfer Protocol - allows a user to transfer
files of data between two Host systems.
(3) Remote Job Entry - allows a user at some Host system
to run a batch job on some other server Host system.
The process which allows a specific program in some Host to
communicate with a specific program in another Host is the Net
work Control Program (NCP) which is the level-2 protocol. The
NCP software is resident in each Host and provides the means of
communication between programs. For example, if a program or
3Although Kleinrock does not distinguish it, there is a Host-IMP/IMP-Host protocol, Bolt Beranek and Newman (1976).
7

process in the NTIA/ITS Host desires to communicate with another
process in a foreign or distant Host, it does so by calling the
NCP in the NTI~/ITS Host and this NCP then communicates with the
NCP in the foreign Host to establish a logical connection between
the two processes. The NCP acts as the manager for a network
user in arranging and maintaining connections to other Hosts in
the network.
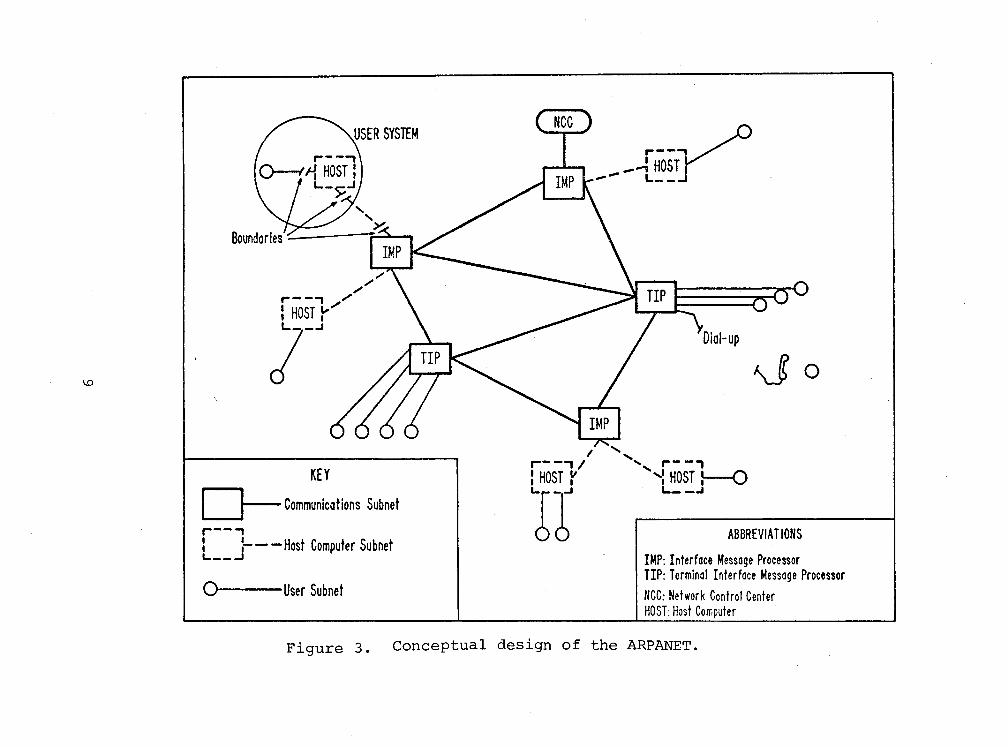
2.2. Architecture
Figure 3, which was obtained from the ARPANET Transition
Plan (1975) and slightly modified, is a conceptual diagram of the
architecture of the ARPANET. This diagram illustrates at least
one approach to defining the architecture of this network. In
this diagram the network is subdivided into three parts: the
communications subnet, the Host computer subnet and the user
subnet. These three subnets are identified in Figure 3 by a
solid line, a dashed line, and a user symbol, respectively.
The communications subnet is composed of the nodes (IMPs and
TIPs) of the network, the Network Control Center (NCC) and the 50
kb/s lines (solid lines) connecting the nodes and the NCC to each
other. The Host subnet consists of the Host computer system and
the communication line connecting the Host to the node. The user
subnet consists of a person, the terminal and the line connecting
the terminal device to the Host computer. In this figure the
user is understood to be a person sending commands to the Host
via a terminal device. The function of the user subnet is to
initiate hardware and software components in the Host subnet
which actually cause the communication subnet to transmit the
data across the network. This three-part separation of the
ARPANET into communications, Hosts, and users subnets;is based on
hardware boundaries or physical objects that can be easily
identified. The boundary separating the communications subnet
from the Host subnet is a special IMP/HOST interface attached to
the IMP, which connects the line from the Host to the IMP. The
boundary between the user subnet and the Host subnet is usually a
8
KEY
D--Communications Subnet
,--,I :-- - Host Computer SubnetL. __ ..J
o User Subnet
I,..--, /
lr
_..rOOST" ./-- L __J
ABBREVIATIONS
IMP: Interface Message ProcessorTIP: Terminal Interface Message ProcessorNCC: Network Control CenterHOST: Host Computer
Figure 3. Conceptual design of the ARPANET.
serial line interface connecting the line from the terminal to
the Host computer system.
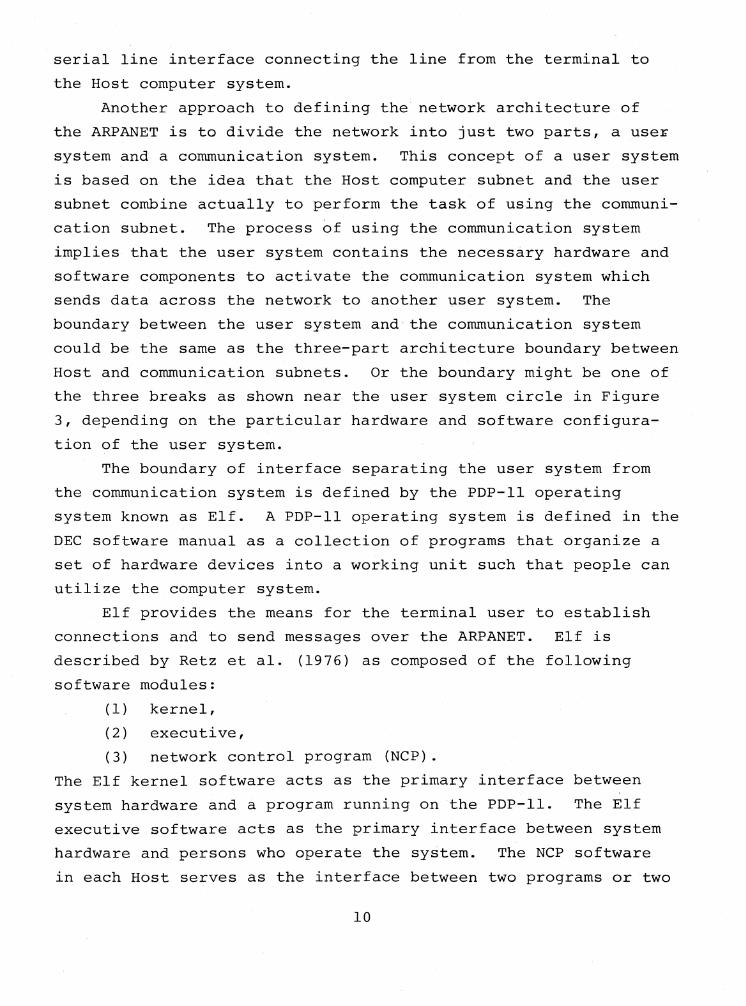
Another approach to defining the network architecture of
the ARPANET is to divide the network into just two parts, a use:r;
system and a communication system. This concept of a user system
is based on the idea that the Host computer subnet and the user
subnet combine actually to perform the task of using the communi
cation subnet. The process of using the communication system
implies that the user system contains the necess~ry hardware and
software components to activate the communication system which
sends data across the network to another ~ser system. The
boundary between the user system and'the communication system
could be the same as the three-part architecture boundary between
Host and communication subnets. Or the boundary might be one of
the three breaks as shown near the user system circle in Figure
3, depending on the particular hardware and software configura
tion of the user system.
The boundary of interface separating the user system from
the communication system is defined by the PDP-II operating
system known as Elf. A PDP-II operating system is defined in the
DEC software manual as a collection of programs that organize a
set of hardware devices into a working unit such that people can
utilize the computer system.
Elf provides the means for the terminal user to establish
connections and to send messages over the ARPANET. Elf is
described by Retz et ale (1976) as composed of the following
software modules:
(1) kernel,
(2) executive,
(3) network control program (NCP).
The Elf kernel software acts as the primary interface between
system hardware and a program running on the PDP-II. The Elf
executive software acts as the primary interface between system
hardware and persons who operate the system. The NCP software
in each Host serves as the interface between two programs or two
10
processes in separate Hosts. The Telnet software (see Protocol
2.1) serves as a high-level protocol utilizing software which can
establish a connection between two Host systems. Telnet employs
the NCP software via system calls during Host-to-Host communica
tions.
In general, PDP-II operating systems are separated into just
two components: monitor and utility programs. The functions
performed by a PDP-II monitor could include all the functions
performed by the Elf ~ernel and executive. The NCP could be
considered a utility program in that its main function is to
establish and maintain a logical connection between programs or
processes in separate Hosts. In th~s report the NCP is
considered the functional interface or boundary between the user
system and communication system while opening and closing con
nections between Hosts under Telnet control.
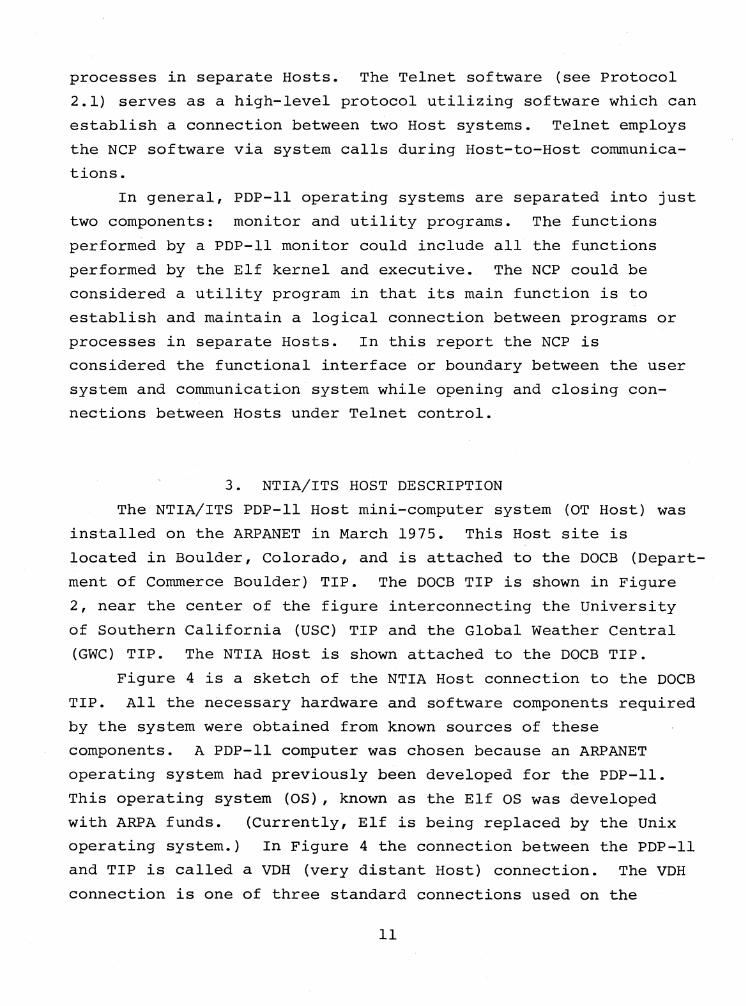
3. NTIA/ITS HOST DESCRIPTION
The NTIA/ITS PDP-II Host mini-computer system (aT Host) was
installed on the ARPANET in March 1975. This Host site is
located in Boulder, Colorado, and is attached to the DOCB (Depart
ment of Commerce Boulder) TIP. The DOCB TIP is shown in Figure
2, near the center of the figure interconnecting the University
of Southern California (USC) TIP and the Global Weather Central
(GWC) TIP. The NTIA Host is shown attached to the DQCB TIP.
Figure 4 is a sketch of the NTIA Host connection to the DOCB
TIP. All the necessary hardware and software components required
by the system were obtaineq from known sources of these
components. A PDP-II computer was chosen because an ARPANET
operating system had previously been developed for the PDP-II.
This operating system (OS), known as the Elf as was developed
with ARPA funds. (Currently, Elf is being replaced by the Unix
operating system.) In Figure 4 the connection between the PDP-II
and TIP is called a VDH (very distant Host) connection. The VDH
connection is one of three standard connections used on the
11

TIP SYSTEM NTIA / ITS HOST SYSTEM,----------------, ,-------------,I I II HONEYWELL 316 I II BELL MINICOMPUTER I I
303I MO DEM (0 node of the I II ARPA network) TIP I II DOCS (Department of INTERFACE I II 30~L Commerce Boulder) (special ~~~L I II MODEM TIP (Terminal Inter- interface) MODEM I_~~~i~o~~~i~:' II face Messa eProcessor) ,-VDH-c~;;cti~; I~om456~adio~lding ~ ~~21~dioBui'ding ~
50 'kilobit lines interconnectingother nodes on the network
Figure 4. Sketch of the NTIA/ITS Host connection to the DOCB TIP.

network between an IMP or TIP and a Host. The VDH connection
provides error detection and retransmission between the Host and
TIP. A VDH connection is implemented by means of the following
components:
(1) a special interface at each end of the connection;
(2) a special software package in the TIP and Host; and
(3) a 50 kb/s full duplex line connecting the two '
special interfaces.
The two special interfaces are attached directly to the TIP
mini-computer and the PDP-II mini-computer, and these interfaces
provide the hardware which generates the synchronization and"
control characters for the binary synchronous line control (BSC)
protocol. In each mini-computer a special software package is
resident to implement the error detection and retransmission
process for the VDH connection. Each interface plugs directly
into a Bell 303 modem at each end of the connection. The Bell
303 modems are connected by means of two twisted pairs of
shielded cable. The cable extends a distance of almost 1800
feet, within the Radio Building at DOCB.
The 50 kb/s lines which connect the DOCB TIP with adjacent
nodes of the subnet are shown in Figure 4, located on the left
side of the TIP system.
The Elf operating system permits several persons at
terminal devices connected to the NTIA Host to use the network
simultaneously. The network control program (NCP) within Elf
will support simultaneously a number of independent connections
or conversations, each involving a program in the NTIA-Host and
another program in any Host on the network.
4. ACCESS AND DISENGAGEMENT PARAMETERS FROM
PROPOSED STANDARD 1033
This section presents the definitions for the access and
disengagement parameters from proposed Federal Standard 1033.
13
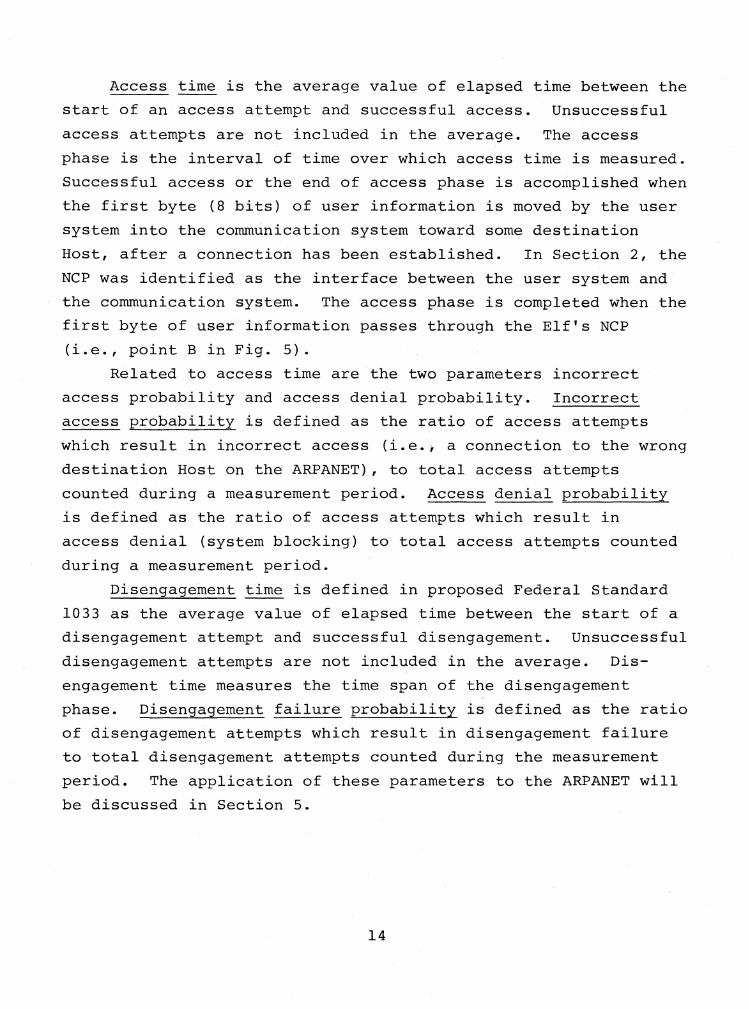
Access time is the average value of elapsed time between the
start of an access attempt and successful access. Unsuccessful
access attempts are not included in the average. The access
phase is the interval of time over which access time is measured.
Successful access or the end of access phase is accomplished when
the first byte (8 bits) of user information is moved by the user
system into the communication system toward some destination
Host, after a connection has been established. In Section 2, the
NCP was identified as the interface between the user system and
the communication system. The access phase is completed when the
first byte of user information passes through the Elf's NCP
(i.e., point B in Fig. 5).
Related to access time are the two parameters incorrect
access probability and access denial probability. Incorrect
access probability is defined as the ratio of access attempts
which result in incorrect access (i.e.; a connection to the wrong
destination Host on the ARPANET), to total access attempts
counted during a measurement period. Access denial probability
is defined as the ratio of access attempts which result in
access denial (system blocking) to total access attempts counted
during a measurement period.
Disengagement time is defined in proposed Federal Standard
1033 as the average value of elapsed time between the start of a
disengagement attempt and successful disengagement. Unsuccessful
disengagement attempts are not included in the average. Dis
engagement time measures the time span of the disengagement
phase. Disengagement failure probability is defined as the ratio
of disengagement attempts which result in disengagement failure
to total disengagement attempts counted during the measurement
period. The application of these parameters to the ARPANET will
be discussed in Section 5.
14
START
~-----TIME AXIS
END
-'~
I - - - - -l I USERlfR~fiNAlI
IIINfORMAT~g:~RANSfERI I AND OTHER ICOMPLETED I I TERMINALS INVOLVED I
L --.J L ~E~EARE~ --.J\.. J \. JV y
USER INFORMATION-tDISENGAGEMENT-&TRANSFER PHASE PHASE 1.
C 08
:- SYSTEM ACCESS II COMPLETED: II USER INfORMATION IL TRANSfER-.!EGINS ---J
\.. ~V
r------iI USERIINFORMATION TRANSfER II NEED ORIGINATION IL J"-------y-_J
I-'
\JI t ACCESS .PHASE
A
Figure 5. Illustration of access and disengagement ~hases which a:emeasured by the parameters, access, and dl.sengagement tl.me(after McManamon and Seitz, 1976).

5. EXPERIMENT DESIGN FOR ACCESS AND
DISENGAGEMENT PARAMETERS
The ARPANET computer network is both experimental and
operational. The ARPANET provides a test bed for experiments
such as the measurements related to proposed Federal" Standard
1033. The five proposed performance parameters, access time,
disengagement time, incorrect access time, access denial prob
ability and disengagement failure probability are suited to
measurement on the ARPANET.
Proposed Standard 1033 was developed for users of Federal
telecommunication systems, where performance between end users
of systems is the measurement objective. For any telecommunica
tion system, one must determine how to apply these performance
parameters to the given system. In the ARPANET case, the Telnet
protocol was selected as a convenient means to demonstrate the
application of the proposed performance parameters. Telnet was
chosen because most persons who,use the ARPANET employ the Telnet
protocol to establish and close connections between Hosts.
Figure 5 delimits the three phases that users of tele
communication systems perceive. Access phase is the interval of
time over which aCcess time is measured. Since the Standard
defines access time to include all of the access phase, one must
initiate a data transfer of user information as the last event to
end access phase. Point B of Figure 5 identifies the end of
access phase as the beginning of user information transfer. User
information is defined as non-overhead information provided by a
user or user system that is transferred into the communication
system. User information excludes all overhead information
generated by both high and low levels of ARPANET protocols. The
disengagement phase is the in~erval of time over which disengage
ment time is measured.
5.1. Network Events
As previously mentioned (Sec. 2) the ARPANET is a packet
switched, fully distributed computer network. Access time and
16
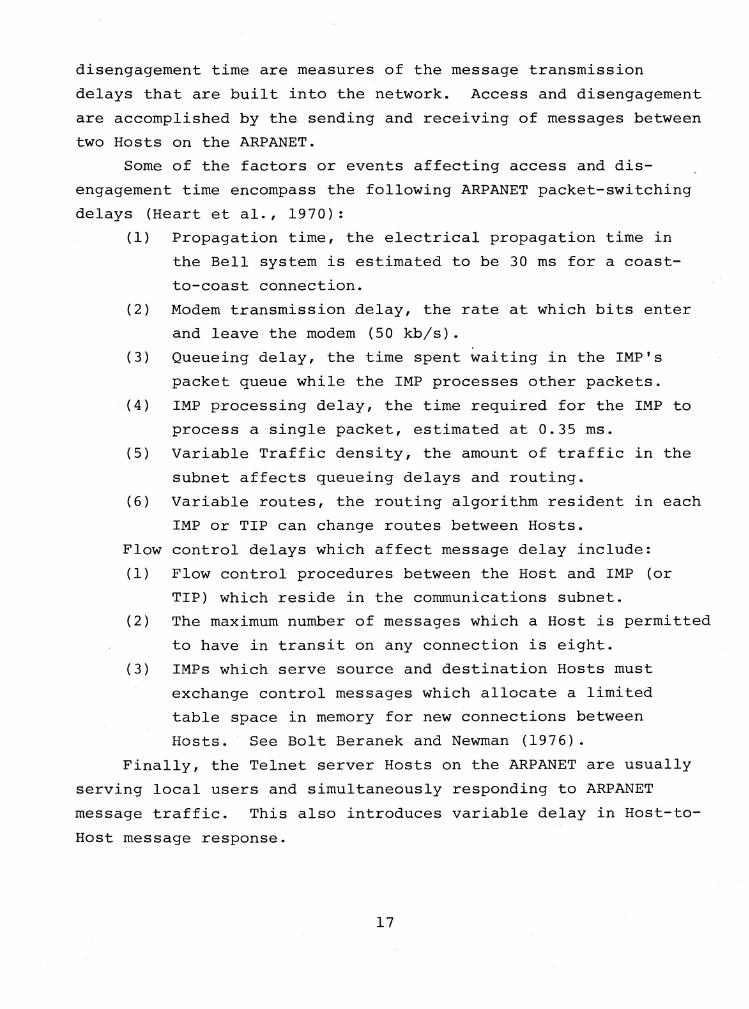
disengagement time are measures of the message transmission
delays that are built into the network. Access and disengagement
are accomplished by the sending and receiving of messages between
two Hosts on the ARPANET.
Some of the factors or events affecting access and dis
engagement time encompass the following ARPANET packet-switching
delays (Heart et al., 1970):
(1) Propagation time, the electrical propagation time in
the Bell system is estimated to be 30 ms for a coast
to-coast connection.
(2) Modem transmission delay, the rate at which bits enter
and leave the modem (50 kb/s).
(3) Queueing delay, the time spent waiting in the IMP's
packet queue while the IMP processes other packets.
(4) IMP processing delay, the time required for the IMP to
process a single packet, estimated at 0.35 ms.
(5) Variable Traffic density, the amount of traffic in the
subnet affects queueing delays and routing.
(6) Variable routes, the routing algorithm resident in each
IMP or TIP can change routes between Hosts.
Flow control delays which affect message delay include:
(1) Flow control procedures between the Host and IMP (or
TIP) which reside in the communications subnet.
(2) The maximum number of messages which a Host is permitted
to have in transit on any connection is eight.
(3) IMPs which serve source and destination Hosts must
exchange control messages which allocate a limited
table space in memory for new connections between
Hosts. See Bolt Beranek and Newman (1976).
Finally, the Telnet server Hosts on the ARPANET are usually
serving local users and simultaneously responding to ARPANET
message traffic. This also introduces variable delay in Host-to
Host message response.
17

5.2. Telnet Protocol
The ARPANET Telnet pro t.oco l, was chosen as the user applica-
tion level protocol for measurement of the performance para
meters. The Telnet protocol within the Elf operating system is
used to support user access to the ARPANET. Telnet allows a
person at a terminal connected to some ARPANET Host to access
(using a Telnet connect command) some other foreign Host as
though his terminal were attached to the foreign Host. After the
terminal user has completed his work on the foreign Host he then
issues a disengagement command, a Telnet close command.
Figure 6 is a simplified sketch of how the Elf operating
system software modules interface under the Telnet protocol.
Figure 6 shows the interaction between the NCP·s Telnet user and
server processes and other processes. Access between two ARPANET
Hosts under Telnet requires that the Telnet user process in some
Host call (via the NCP) a Telnet server process in another Host
and eventually establish with messages a full duplex connection
between the two Telnet processes. A socket is used to couple the
NCP to another process within the same Host,' such as a Telnet
process. Disengagement between two ARPANET Hosts under Telnet
requires that a user process hang-up (close) the previously
established connection to the server process. Sometimes the
server closes the connection for reasons of its own choosing.
The NTIA/ITS Host Telnet software was modified to measure
both access time and disengagement time. Elf system macros
(segments of code) were inserted in the Telnet "connect and
close" subroutine code to perform the time interval measurements
for access and disengagement.
5.3. Design of Access Time Measurements
For the ARPANET, access time can be measured as a perfor
mance variable. The access phase (Fig. 5) is the interval of
time over which access time is measured.
18

Terminal
User Host
Legend:D. - Software
Com municationsSubnet
Server Host
4 ~ - Socket· Connects the NCP with Another Process
4- -... - ELF Software System Calls
Figure 6. Host-to-Host connection via telnet protocol.
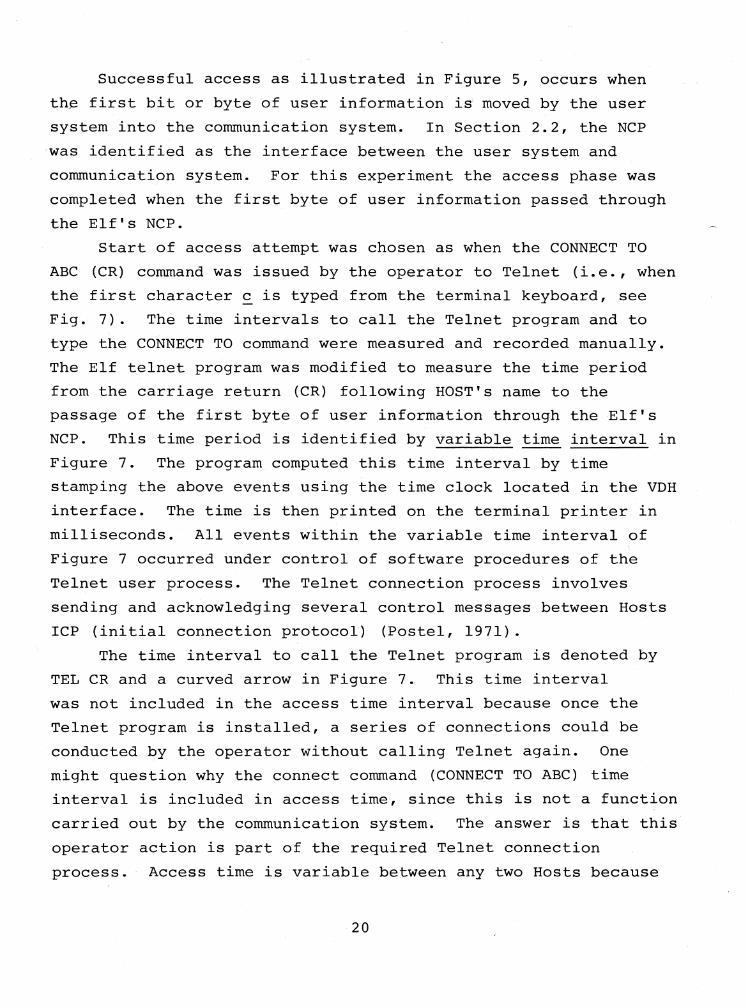
Successful access as illustrated in Figure 5, occurs when
th~ first bit or byte of user information is: moved by the user
system into the communication system. In Section 2.2, the NCP
'was identified as the interface between the user system and
communication system. For this experiment the access phase was
completed when the first byte of user information passed through
the Elf's NCP.
Start of access attempt was chosen as when the CONNECT TO
ABC (CR) command was issued by the operator to Telnet (i.e., when
the first character c is typed from the terminal keyboard, see
Fig. 7). The time intervals to call the Telnet program and to
type the CONNECT TO command were measured and recorded manually.
The Elf telnet program was modified to measure the time period
from the carriage return (CR) following HOST's name to the
passage of the first byte of user information through the -Elf's
NCP. This time period is identified by variable time interval in
Figure 7. The program computed this time interval by time
stamping the above events using the time clock located in the VDH
interface. The time is then printed on the terminal printer in
milliseconds. All events within the variable time interval of
Figure 7 occurred under control of software procedures of the
Telnet user process. The Telnet connection process involves
sending and acknowledging several control messages between Hosts
rcp (initial connection protocol) (Postel, 1971).
The time interval to call the Telnet program is denoted by
TEL CR and a curved arrow in Figure 7. This time inter~al
was not included in the access time interval because once the
Telnet program is installed, a series of connections could be
conducted by the operator without calling Telnet again. One
might question why the connect command (CONNECT TO ABC) time
interval is included in access time, since this is not a function
carried out by the communication system. The answer is that this
operator action is part of the required Telnet connection
process. Access time is variable between any two Hosts because
20

I~I
II User Information
Through the NCPConnectionCompleted
II'" ACCESS TIME------~
IICONNECT TO ABC.)
N..... ~
CALLTEL NET
4.5 Seconds
~
STARTACCESS
ATTEMPT
5.5 Seconds Variable Time Interval
A
CONNECTIONATTEMPT
~
SUCCESSFULACCESS
TIME
) =Carriage Return
Figure 7. Flow diagram for measuring Host-to-Host access time viatelnet protocol.

of the variable traffic load conditions, variable distances or
routes between Hosts, and variable program load at Host sites
(see Sec. 5.1).
The time interval printed on the PDP-ll terminal includes
both the connection process time, which ends at the point labeled
"connection completed" in Figure 7, and the.. time segment
required to transfer a byte of user information from meIr\0ry
through the Elf NCP, which begins as soon as the connection is
completed. These two time segments are referred to as connect
time and transfer time. Connect time is a variable and transfer
time may also be a variable when the local NTIA/ITS Host has more
than one user logged on the system because Elf is a multi-user
system. However, all measurements were conducted in the single
user, single process mode, and transfer time required about 2 ms.
Assuming that the Telnet process is functioning, the steps
performed to measure access time are as follows:
1. Operator types "CONNECT TO ABC (CR)", where ABC
represents some Host name,
2. Connection attempt begins; if successful, the connect
time plus transfer time are printed on terminal
printer.
In the tables of Appendix and later sections of this report, the
combination of connect time plus transfer time is referred to as
connection-attempt time.
The variable time interval in Figure 7 represents the time
required by the local Telnet software to open successfully a
Host-to-Host connection (connect time) and transfer user
information through NCP (transfer time). During this time
interval (connection-attempt time), the NTIA/ITS Host Elf Telnet
process al$o performs required software housekeeping arrange
ments.
In Figure 7, the 5.5 seconds needed to type the connect
command represents the operator's typing speed and is not
necessarily a typical value.
22
A~.
2.
3.
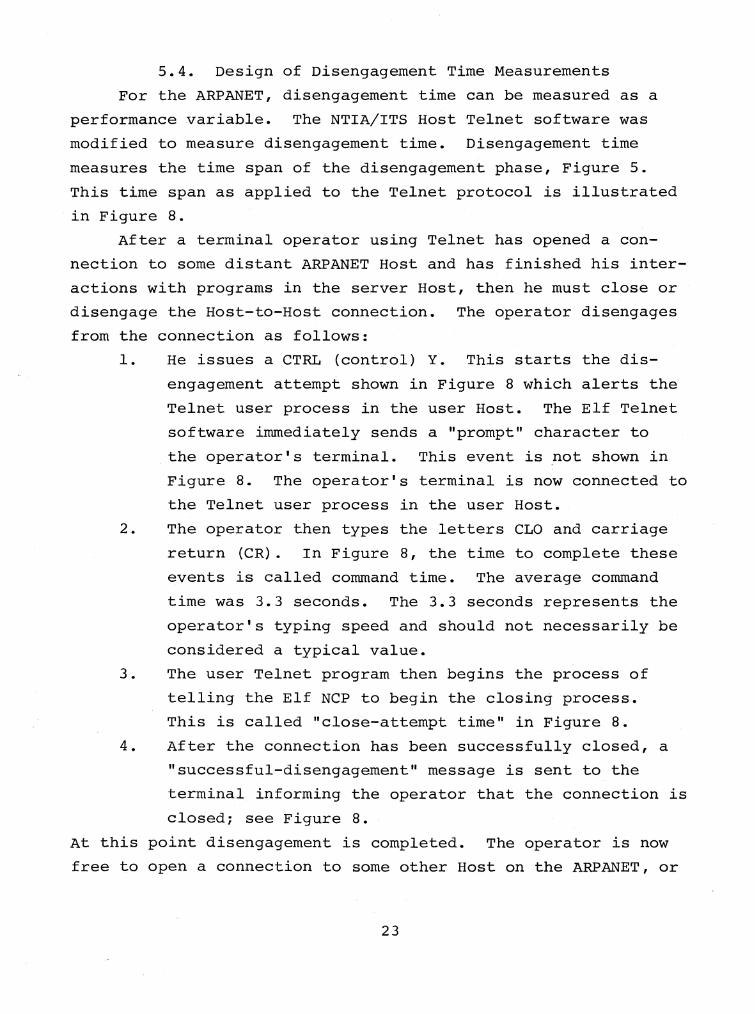
5.4. Design of Disengagement Time Measurements
For the ARPANET, disengagement time can be measured as a
performance variable. The NTIA/ITS Host Telnet software was
modified to measure disengagement time. Disengagement time
measures the time span of the disengagement phase, Figure 5.
This time span as applied to the Telnet protocol is illustrated
in Figure 8.
After a terminal operator using Telnet has opened a con
nection to some distant ARPANET Host and has finished his inter
actions with programs in the server Host, then he must close or
disengage the Host-to-Host connection. The operator disengages
from the connection as follows:
1. He issues a CTRL (control) Y. This starts the dis
engagement attempt shown in Figure 8 which alerts the
Telnet user process in the user Host. The Elf Telnet
software inunediately sends a "prompt" character to
. the operator's terminal. This event is ~ot shown in
Figure 8. The operator's terminal is now connected to
the Telnet user process in the user Host.
The operator then types the letters CLO and carriage
return (CR). In Figure 8, the time to complete these
events is called conunand time. The average conunand
time was 3.3 seconds. The 3.3 seconds represents the
operator's typing speed and should not necessarily be
considered a typical value.
The user Telnet program then begins the process of
telling the Elf NCP to begin the closing process.
This is called "close-attempt time" in Figure 8.
After the connection has been successfully closed, a
"successful-disengagement" message is sent to the
terminal informing the operator that the connection is
closed; see Figure 8.
At this point disengagement is completed. The operator is now
free to open a connection to some other Host on the ARPANET, or
23

II
..-1II
Disengagement Time-------__~
III...
CTRL-Y CL~ ConnectionClosed
OperatorInteractions
3.3 Seconds
Command TimeStart
DisengagementAttempt
Variable Time Interval
Close AttemptTime Successful
Disengagement
Time
) == Carriage Return
Figure 8. Flow diagram for measuring Host-to-Host disengagement timevia telnet protocol.

to call up some process within the user Host or to terminate his
use of the local system.
The variable time interval (close-attempt time) shown in
Figure 8 represents the time required by the user Telnet software
and the server Telnet software to complete the closing of a full
duplex connection between these two software modules. During
this time interval the user Host NCP and server Host NCP exchange
acknowledged close (CLS) commands through the network, and their
respective Telnet software performs housekeeping arrangements,
including a "connection closed" message to, the terminal operator.
This variable time interval was measured by modifying the NTIA/ITS
Telnet software so that it time-stamped the beginning and· end of
"close-attempt time". The difference between the beginning and
end times was calculated and printed on the operator's terminal.
Close-attempt time includes various housekeeping functions that
the Elf Telnet is required to perform and the exchange of two
acknowledged close commands through the network. This time
interval is variable because of the events defined previously in
Section 5.1.
5.5. Sample Size
In Section 4 the definitions of access and disengagement
time specify that these parameters are averages.
From Section 5.1, one observes the various delays present
in the ARPANET which cause these parameters to vary in a random
fashion. The following network events occur during each access
and disengagement attempt: propagation time delay, modem trans
mission delay, IMP or TIP processing delay for each pa6ket,
variable traffic density in the subnet, variable routes for each
packet assigned by the routing algorithm resident in each IMP or
TIP, and flow-control delays and variable response times by Host
computers in message handling or processing. Most of these
network events are ,independent of each other and this introduces
randomness or variability into access and disengagement times.
25

In addition, each successful access and disengagement
'attempt implies that the above network events were repeated
several times, because successful access and disengagement
requires the exchange of several messages between source and
destination Hosts. Access attempts employ the rep (initial
connection protocol) which involves four or more messages and
their acknowledgments (Acks). Disengagement attempts employ two
messages and their Acks. Therefore, one would expect that
measurements of access and disengagement times would be variable
and that these times should be described with probability rela
tions and statistical averages rather than with deterministic
methods or mathematical equations.
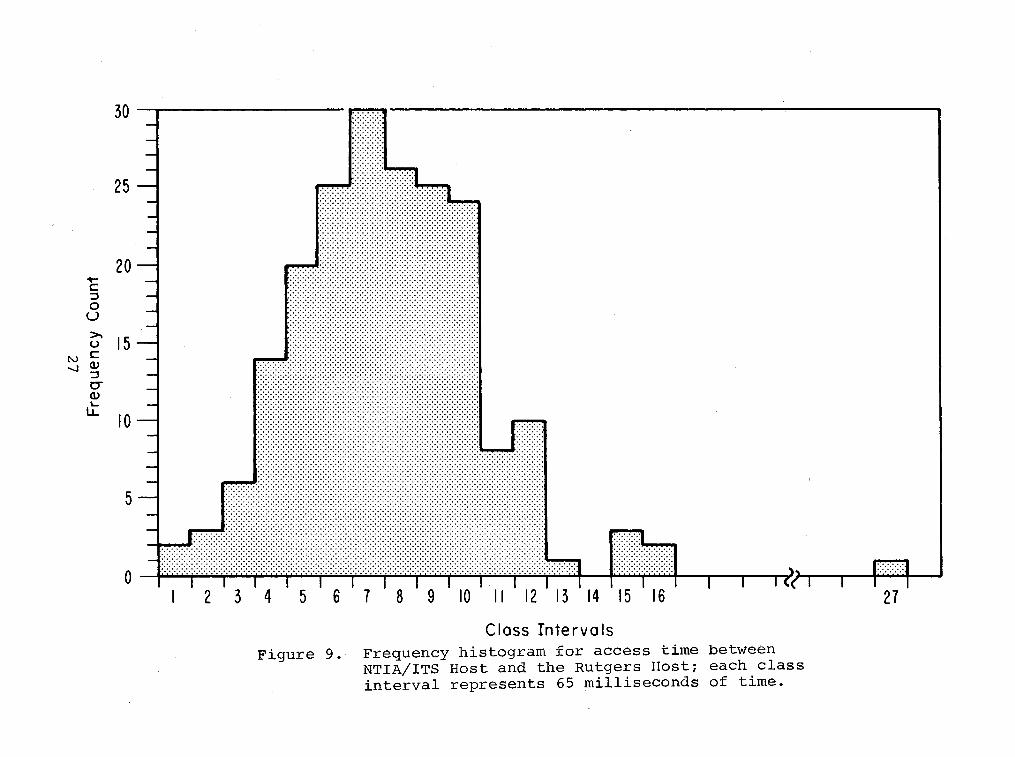
The histogram in Figure 9 was plotted to study to what
extent the above events introduce randomness in measures of
access and disengagement time. The histogram includes the
measurement results of 200 successful access attempts distributed
over an 8-hour interval (8 a.m. to 4 p.m. MDT on June 5, 1976)
from the NTIA/ITS Host to Rutgers-10 Host. These 200 sample
values were placed in ascending order and grouped in 16 equal
class intervals of 65 milliseconds each. All measurement values
were rounded off to the nearest millisecond by the measurement
software. The Y axis displays the frequency count for each class
interval and the X axis displays the equal class intervals of 65
milliseconds. The sample values ranged from 6.479 seconds to
7.513 seconds, with one value in the 27th class interval at 8.229
seconds. The frequency count for each class interval was plotted
in Figure 9. The first class interval represents the time\
interval from 6.450 to 6.515 seconds. The peak and the shape of
the histogram suggests normal or Gaussian distribution properties.
From the above discussion concerning the sum of independent,
variable delay events (Central Limit Theorem), one can assume
that access and disengagement times are normally distributed.
With this assumption of normality, the Student t (Bendat
and Piersal, 1966) distribution was used to establish confidence
26
30
25 ••••••••••••
20ToC='0
U>.
15uN C---.J (l)
='C"(l)~
1.L10
5
o
Figure 9.
Class Inte rva IsFrequency histogram for access ~1me
NTIA/ITS Host and the Rutgers Host;interval represents 65 milliseconds
betweeneach classof time.
intervals which relate to sample size for access and disengage
ment time measurements.
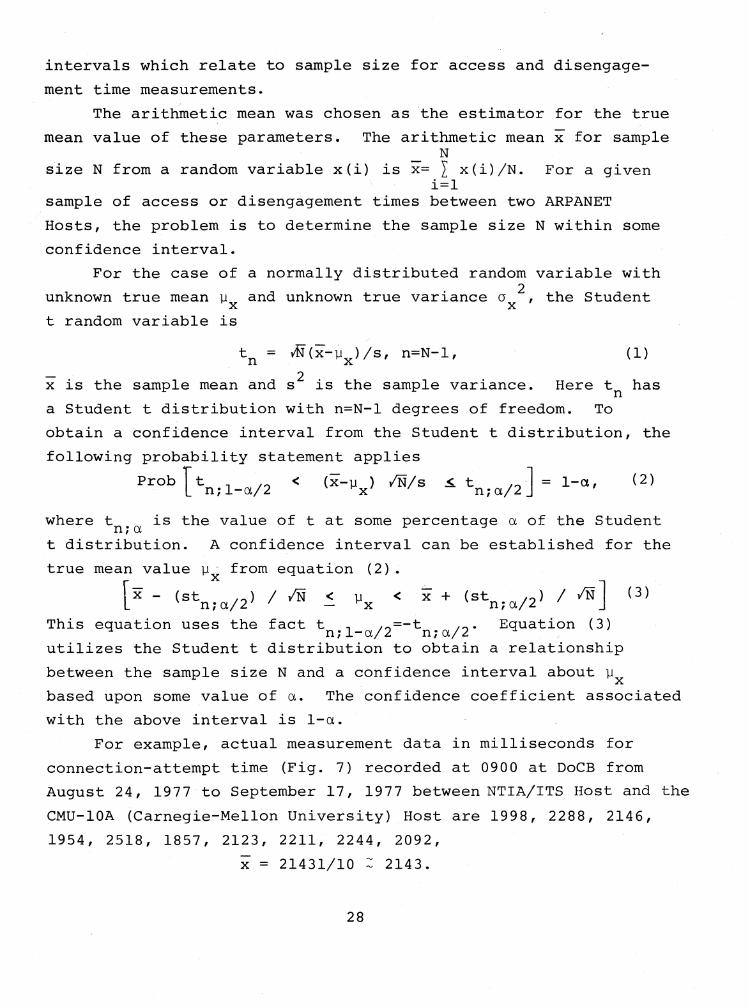
The arithmetic mean was chosen as the estimator for the true
mean value of these parameters. The arithmetic mean x for sampleN
size N from a random variable x(i) is x= L x(i)/N. For a giveni=l
sample of access or disengagement t~mes between two ARPANET
Hosts, the problem is to determine the sample size N within some
confidence interval.
For the case of a normally distributed random variable with
unknown true mean ~x and unknown true variance 0 x2 , the Student
t random variable is
t = M(x-0 lis, n=N-l, (1)n x
x is the sample mean and s2 is the sample variance. Here t hasn
a Student t distribution with n=N-I degrees of freedom. To
obtain a confidence interval from the Student t distribution, the
following probability statement applies
prob Tt 1 /2 < (X-ll) IN/s < t -J = I-a, (2)L ni -a x nia/2 '
where t is the value of t at some ·percentage a of the StudentniCXt distribution. A confidence interval can be established for the
true mean value ~- from equation (2).x[x - (stn i a/2) / IN < ~x -e x + (stn i a/2) / IN] (3)
This equation uses the fact tnil-a/2=-tn;a/2. Equation (3)
utilizes the Student t distribution to obtain a relationship
between the sample size N and a confidence interval about ~xbased upon some value of cx. The confidence coefficient associated
with the above interval is I-a.
For example, actual measurement data in milliseconds for
connection-attempt time (Fig. 7) recorded at 0900 at DoCB from
August 24, 1977 to September 17, 1977 between NTIA!ITS Host and the
CMU-I0A (Carnegie-Mellon University) Host are 1998, 2288, 2146,
1954,2518,1857,2123,2211,2244,2092,
x = 21431/10 : 2143.
28

and
The sample variance of this set of data is
2 N - 2s = l/(N-l) I (X.-x)
i=l 1
s 'V 182 ms.
From the Student t distribution for a=0.05 and N=lO, t /2nia
becomes t9:0.025=2.26. Substituting_ in equation (3)
12143 - (182x2.26)/3.16 < ~x < ~143 + (182x2.26)/3.16]
becomes [2013 ~ ~x < 2273]. (4)
Equation (4) says that the true mean value 11 falls withinx
the .interval of 2013-2273 milliseconds or 260 milliseconds with
a confidence coefficient of (I-a) xlOO or 9,5%. The confidence co
efficient is the degree of trust associated with the confidence
s tra t.ement; of equation (4).
At this point one can only say th~t for a sample size N=lO,
one gets a 95% confidence interval of 260 milliseconds about the
true mean 11 , assuming normally distributed,data. A similar setx
of measurement data from the NTIAiITS Host to eMU-lOA Host for
close-attempt times in milliseconds included in disengagement
time, are: 1773, 1623, 1536, 1800, 1676, 1717, 1636, 1512, 1498,
1633.
x ~ 1641 milliseconds (ms),
s=3l4 m£lliseconds and from equations (3) and (4) with a=0~05
and N=lO, 11 falls within the interval of 1416-1866 ms with axconfidence interval of 450 ms long. These two tests do not
include the values for command time since these values are
constants the confidence intervals are not affected for either
access or disengagement times. Similar confidence intervals were
measured for sample size N=lO and a=0.05 for data recorded
between NTIA/ITS and Harv-lO (Harvard university). The measure
ments were conducted at the same time and dates as the CMU-IOA
measurements. Connection-attempt time yielded an interval of
23l6~11 <3258 in ms, or 942 ms, 95% confidence interval. Dis-x
engagement time yielded an interval of 1643~11 <2047 ms or 404 ms,. x95% confidence interval.
29

In surrrrnary, the values of these four 95% confidence
intervals (260 ms access, 450 ms close, 404 ms close, and 942 ms
access) are not unreasonable when one considers < the magnitude of
the raw data, the small sample size (N=lO) and the value of a.
The author intends to use N=lO as a suitab~e sample size for
measurements of access and disengagement times.
6. MEASUREMENT RESULTS
The sample value measurements are given in the Appendix.
The overall measurement results are shown in Tables land 2.
Column one of each table is the name of the Host computer system
accessed by the NTIA/ITS Host. A list of geographical locations
for the selected Hosts is as follows:
Host Name
USC-ISIB
UCLA-CCN
USC-lSI
CMU-IOA
CMU-IOB
HARV-IO
SU-AI
SUMEX-AIM
NBS-IO
RUTGERS-IO
BB&N
BB&N-B
CCA
SRI-KA
SRI-KL
MIT-DMS
MIT-AJ
LONDON
Location
Marina Del Rey, CA
Los Angeles, CA
Marina Del Rey, CA
Pittsburgh, PA
Pittsburgh, PA
Cambridge, MA
Stanford, CA
Stanford, CA
Gaithersburg, MD
New Brunswick, NJ
Cambr idge , MA
Cambridge, MA
Cambridge, MA
Menlo Park, CA
Menlo Park, CA
Cambridge, MA
Cambridge, MA
London, England
30

Table 1. Measurement Values for_Connection-Attempt Time andClose-Attempt Time in Milliseconds Averaged fromTables A.l Through A.lO
Host
USC-ISIB
UCLA-CCN
USC-lSI
CMU-I0A
CMU-I0B
HARV-10
SU-AI
SUMEX-AIM
NBS-10
AMES-67
RUTGERS
BB&N
BBN&N-B
CCA
SRI-KL
MIT-DMS
MIT-AI
LONDON
0900Connect
MHR* Close
2 28201665
2 18951707
3 37871819
3 22071608
3 20841636
4 26211809
4 31281605
5 37191897
6 29881943
6 38282631
6 .31262012
6 61072313
6 64402045
7 48132215
7 42662095
7 44242092
7 45162005
8 81464112
1000Connect
Close
31521701
19501779
34131691
20861646
21141648
26121883
27991749
40912027
28321949
47222940
27672002
53312094
95632069
48462114
48583688
41521992
43772043
20204060
1100Connect
Close
30741816
19772090
35391781
22901678
21771678
26261881
37812124
31051926
40332406
29912007
53412050
57931975
47282098
49152158
42061970
42052075
76813738
0200Connect
Close
30661679
18951758
33571727
23501646
21391661
27891825
35521742
43871938
29191951
41662842
28951974
54233708
57862192
45511948
57301994
40101969
44612070
78444685
0300Connect
Close
30002861
23501837
45181719
21941691
21761663
28311867
33691666
40462046
28091910
54442823
32792070
52062329
59182396
47812156
51782142
39421940
36761741
82354090
0400Connect
Close
29321698
19821789
38161657
22491657
21741614
26331888
41171692
45442366
27611913
44312474
29851987
50551883
51272116
50011976
46832069
40032042
40572961
76333816
0500ConnectClose
33031695
22862409
35921734
22781636
21991634
27531954
37481741
41682581
28441986
51792696
27051928
53942144
50132075
47102384
52212565
38782156
37581999
76354284
AvgConnect
Close
30491874
20491910
37151723
22361652
21521648
26951872
33291693
41052140
28591940
45432687
29641997
54082360
62342124
47762127
41502128
78854112
*MHR - Minimal Hop Route
**Each Host shown,in the table,above has two lines associated with it. The top lineshows the connectl0n-attempt tlme and the bottom line shows the close-attempt timefor every hour of the day When measurements were made. These measurement valuesare averaged for each Host in the far-right column "Avg".
31

Table 2. Measurement Values for Access Time and Disengagement Time Values (in seconds) Derived fromTable 1
Host
USC-ISIB
UCLA-CCN
USC-ISI
CMU-I0A
C~1U-I0B
HARV-10
SU-AI
SUMEX-AIM
NBS-10
AMES-67
RUTGERS
BB&N
BB&N-B
CCA
SRI-KA
SRI-KL
MIT-DMS
MIT-AI
LONDON
0900Access
MHR* Denga.ge
2 8.35.0
2 7.45.0
3 9.35.1
3 7.74.9
3 7.54.9
4 8.95.1
4 8.64.9
5 9.25.2
6 8.35.2
6 9.35.9
6 8.65.3
6 11. 65.6
6 11. 95.3
7 10.35.5
7 10.15.3
7 9.85.4
7 9.95.3
7 10.05.3
8 13.67.4
1000AccessDen<Jage
8.75.0
7.55.1
8.95.0
7.64.9
7.64.9
8.15.2
8.35.0
9.65.3
8.35.2
10.26.3
7.85.3
10.85.4
15.15.4
10.35.3
10.35.4
9.85.3
9.65.3
9.95.3
13.57.3
nooAccessDengage
8.65.1
7.55.4
9.05.1
7.85.0
7.75.0
8.15.2
8.15.0
9.35.3
8.65.2
9.55.7
8.55.3
10.85.4
11. 35.3
10.25.3
10.56.9
9.75.3
9.75.3
9.75.4
13.27.0
0200AccessDengage
8.65.0
7.45.1
8.95.0
7.94.9
7.65.0
8.35.1
9.15.0
9.95.2
8.45.3
9.66.1
8.45.3
10.97.0
11.35.5
10.15.2
11. 65.0
9.55.3
9.55.3
9.95.4
13.38.0
0300AccessDengage
8.58.4
7.95.1
10.05.0
7.75.0
7.75.0
8.35.2
8.95.0
9.55.3
8.35.2
10.96.1
8.85.4
10.75.6
11.45.7
10.35.3
10.85.8
9.45.3
9.55.3
9.25.0
13.77.4
0400AccessDengage8.45.0
7.55.1
9.35.0
7.75.0
7.74.9
8.15.2
9.65.0
9.95.6
8.35.2
9.95.8
8.55.3
10.65.2
10.65.4
10.55.3
10.25.4
9.55.3
9.55.3
9.65.3
13.17.1
0500AccessDengage8.8
5.07.85.7
10.15.0
7.84.9
7.84.9
8.15.3
9.25.0
9.65.9
8.35.3
10.66.0
8.25.2
10.95.4
10.55.4
10.25.7
10.25.0
9.45.4
9.45.5
9.15.3
13.17.5
AvgAccessDengage8.5
5.27.5
5.29.25.0
7.75.0
7.74.9
8.25.2
8.85.0
9.65.4
8.45.2
10.56.0
8.45.3
10.95.6
11.75.4
10.35.4
10.55.6
9.65.3
9.65.3
9.75.4
13.47.4
*MHR - Minimal Hop Route
**Each Host shown in the table above has two lines associated with it. The top lineshows the access time (in seconds) and the bottom line shows the disengagement time(in seconds) for every hour of the day when measurements were made. These measurements values are averaged for each Host in the far-right column "Avg".
32
All Hosts were selected arbitrarily from the ARPANET directory
on the basis that they were listed as unl{mited server Hosts.
All tables are formatted into lines that contain two rows of
numbers for each Host. The top-row number relates to access and
the bottom-row number relates to disengagement. These sets of
numbers are distributed in seven columns with a time of day as
the heading.
Table 1 ~ derived from Tables A.l through A.lO in the
Appendix. The Appendix contains ten tables of sample data for
connection-attempt time and close-attempt time. From Section
5.3, access time is the sum of connection-attempt time (a vari
able) and operator action time (a constant). From Section 5.4,
disengagement time is the sum of close-attempt time (a variable)
and operator action time (a constant).
Table I was constructed by averaging all values of connec
tion-attempt and close-attempt times for each particular time
slot. There are ten tables so that approximately ten sample
values were used in each sample size as discussed in Section 5.5.
The headings for columns 3 through 8 are the particular times of
the day (Mountain Standard Time) and were chosen arbitrarily.
The samples were measured on dates that ranged from August 23,
1977 to September 21, 1977 (s~e tables). The connection and
close-attempt values were measured and rounded off to the nearest
millisecond. Millisecond accuracy was obtained by using the VDH
timer attached to the PDP-II. This timer or clock is a count
down register which counts at 8 ~s (microsecond) intervals.
The sample values in Table I and the tables in Appendix A
were recorded to the nearest millisecond because of their signif
icance in Host-to-Host network performance. The tables in the
Appendix also record three other events. The letter A denotes
that the access attempt £ailed. This happened when the terminal
operator issued the connect command and the Elf system Telnet
failed to respond. The letter F denotes that the disengagement
attempt failed. This happened when the terminal operator issued
a close command, after a connection was established, and the Elf
33
system Telnet failed to respond. The letter 0 denotes that the
terminal operator issued a connect command to some distant Host
and he received a message from the subnet saying that the
particular Host was not operating on the network. It is not
certain why some of the access and disengagement attempts failed,
but one suspects that there were defects in Elf.
The far-right column headed by the letters "Avg", is the
average for the other seven columns of data. Thesenumbers
represent the average of data in all ten tables in the Appendix
for all hours for each Host.
Tables A.l through A.IO also contain the data needed to
measure the three remaining parameters: incorrect access prob
ability, access denial probability and disengagement failure
probability. These values are obtained from the A, 0, and F
designations explained in Se~tion 7.1.
Table 2 contains the access and disengagement times. These
values were computed from Table 1 with the addition of operator
action times of 5.5 seconds for access and 3.3 seconds for dis
engagement. The values of Table 1 were rounded to the nearest
tenth of a second and added to their respective operator action
time to produce Table 2.
7. ANALYSIS OF RESULTS
This section examines the measurement results presented in
Section 6 and in the Appendix.
7.1. Access and Disengagement
If one examines the measurement values beginning with the
tables in the Appendix, one can make some performance assess
ments about the ARPANET. Section 5.1 discusses the packet switch
and flow control delays that are present in the ARPANET. These
delays along with the telnet connect and telnet close processes
combin~ to produce the valuescin all tables. In all cases, the
34
NTIA/ITS Host was the source Host and the destination Hosts are
listed in column I of all tables.
Column 2 of all tables contains a number for each Host.
This number was derived from Figure I and represents the minimum
number of subnet links or the minimum hop route (MHR) between the
NTIA/ITS Host (source mode) and the destination Host (destination
node) listed in column 1. Each access and disengagement attempt
generates several messages between Hosts (Sec. 5.2). Each message
(i.e., these are single packet messages) may travel a different
route depending on the status of the subnet and the routing
decisions by the subnet (Sec. 5.1). Therefore, the MHR is not
necessarily the subhet route used during all measurements.
However, the MHR does offer some insight to ARPANET Host-to-Host
performance.
For example, if one observes the magnitude of the data in
all tables, the magnitude seems to increase as the MHR increases.
This is not true for all Hosts in column 1, but the trend is
apparent. In Table A.l the value at time 1000 for SKI-KL is
17200 ms for close-attempt time and in Table A.6 the value for
BB&N at 0200 for close-attempt time is 14248 ms. These large
values are assumed to be caused by temporary system blocking.
The large values for London, EngLand were attributed to the very
great length of the satellite path, and to an MHR=8.
Another observation from the tables is that connection
attempt time is almost always larger than close-attempt time.
The reason these times are larger can be attributed to the
following:
(a) New connections between Hosts require the source and
destination IMPs which serve the source and destination
Hosts, to exchange special control messages (Sec. 5.1).
This requirement causes additional delay for initial
connection between Hosts.
(b) The Telnet connection-process requires the exchange of
more messages than the Telnet closing process. These
extra exchanges cause additional delays.
35

(c) Another influencing factor could be the priority within
the destination Host operating system for initial
connections. If priority is low this can cause
additional delay.
(d) The-number of local jobs (i.e." the number of active
terminals logged-on plus the number of active processes
in effect) at some destination Host would also in
fluence the initial connection process. If the desti
nation Host is running near capacity, then more delay
will occur.
In Table 1, one cannot separate the Host operating system
delays from the subnet switching delays within the access and
disengagement measure. The reason is that the processes for
Telnet and NCP in each Host and the subnet processes overlap in
time. One can measure part of the Telnet process: the message
typeout time on the terminal (which requires about 780 ms for
both access and disengagement). All the remaining time for each
measurement value is spent in computer execution and data com
munication systems activity.
Table 2 shows much the same information that Table 1 shows
except that the rounding of Table 1 values tends to simplify
the difference between destination Host access and disengagement
time values.
Although access time and disengagement time values cannot be
separated into Host operating system delays and subnet switching
delays, one can make some assumptions about these functional
delays and relate these assumptions to ARPANET system perfor
mance.
First, assume that the NTIA/ITS system performs ~ts access
or disengagement functions at the same speed each time. This
assumption is valid because the NTIA/ITS system performed all
measurements in single user mode, where all software and hardware
systems performed the same operations for each access or dis
engagement attempt (i.e., same operation repeated under same
source Host conditions) .
36
Second, assume that when MHR values are equal the packet
switching subnet performs its functions within a tenth of a
second for each attempt. The one exception is the case where (a)
above applies, i.e., where special control messages between
source and destination IMPs (for new connections between Hosts)
cause additional delays. A tenth of a second difference allows
for the variable subnet events presented in Section 5.1. This
becomes a reasonable a~sumption because IMPs can process a packet
in 0.35 ms.
Third, assume that destination Host response times are
variable for connection and closing attempts. The variability of
destination Host response time could be attributed to a large or
small number of local users, program jobs and active terminals
attached to that destination Host. These factors in turn
influence priorities of operating system processes on the
destination Host. For example, Telnet server process priority
could vary according to local user load level.
One applies these three assumptions to the last column of
Table 2. This column, headed "Avg", is the average value for all
access measurements (top value) and disengagement measurements
(bottom value) over all days and hours for that particular
destination Host.
First, the values for London, England are the largest, as
one would expect, because of the satellite-link distances.
Next, the access times for Rutgers and NBS-IO are two to three
~econds smaller than other Hosts with the same MHR value. One
could explain this difference in access times as a combination of
reason (a) above and the fact that these two destination Hosts'
are more readily accessible since there are fewer users. Reason
(a) refers to the fact that source and destination IMPs must
exchange control messages. The control messages allocate a
limited table space within the IMP for each new connection.
Conceivably, the more Hosts there are attached to an IMP (four is
maximum), the more ARPANET connections exist and the more likely
37

IMP table space could become a problem and cause delay. In the
ARPANET directory, Rutgers is one of two Hosts attached to the
Rutgers TIP and NBS-IO is one of two Hosts attached to the NBS
TIP. Therefore it appears that Rutgers and NBS~lO are more
readily accessible because they have fewer ARPANET users or
connections and more IMP table space than other Hosts with the
same·MHR values. Another observation is that CMU-IOA, CMU-IOB
and UCLA-CCN all have small MHR values and seem to offer the
fastest access to the NTIA/ITS Host. These three Hosts provide
the fastest access despite the fact that UCLA-CCN is attached to
a 3-Host node (IMP) and both CMU-IOA and eMU-lOB are attached to
a 4-Host node.
Finally, in the Avg column one notes the uniformity of the
disengagement times compared to access times. With the exception
of London (7.4 seconds) and AMES-67 (6.0 seconds), all Hosts. are
in the 5.0 to 5.6 second range for disengagement time. This
implies that once- the initial connection is established, ARPANET
Hosts respond more uniformly to message exchange. Further, the
uniformity of the disengagement times could offer users a
convenient performance tool. Because if disengagement time is
discovered to be outside the range of 5.0 to 5.6 seconds, then
one could suspect abnormal operations somewhere in the system.
7.2. Associated Parameters
The three other parameters associated with access time and
disengagement time are incorrect access probability, access
denial probability and disengagement failure probability.
Incorrect access probability is defined in Section 4. For
the ARPANET, this parameter is interpreted as a connection to the
wrong destination Host during the access phase. During access
attempt, the NTIA/ITS terminal operator receives a herald from
the destination Host proclaiming the Host name and other informa
tion. The herald identif~es the destination Host. In 1221
successful access attempts, the NTIA/ITS operator did not receive
a herald from an incorrect Host. Thus, for incorrect access
38

probability, the measurements yielded an answer of 0/1221=0. An
upper bound probability P for the occurrence of an incorrect
access event can be" computed based on the binomial distribution,
the 1221 independent trials and a confidence coefficient a=0.05.(l-P) 1221 = ex
P = 0.0025.
Access denial probability is d~fined in Section 4. Although
access denial was probably due to Elf timing problems, the
overall system was blocked and all "A" events were counted to
determine access denial probability. The "0" events were not
included because in these cases the system was not operational
(the destination Host was not on the ARPANET). The total number
of A events was 18 and there were 1239 access attempts. Access
denial probability was 18/1239=0.015.
Disengagement failure probability is defined in Section 4.
The "Fit symbol in TablesA.l through A.IO denotes this event.
From these table~ a total of 1221 disengagement attempts resulted
in 40 failures. Disengagement failure probability was
40/1221=0.033. When disengagement failure occurred during a
disengagement attempt, the Telnet close command timed out after
30 seconds and printed a "timed out" message to the terminal
operator. When access failure occurred during access attempt,
the Telnet connect cornmandgenerated a loop in Elf and the system
had to be halted and re-started.
8. SUMMARY AND CONCLUSIONS
NTIA!ITS is engaged in the development of proposed Federal
Standard 1033. This standard contains several proposed perfor
mance parameters, five of which are measured over the ARPANET and
discussed in this report. These five parameters (Sec. 4) are
applied to the ARPANET as follows:
(1) Access time is defined as the average value of
elapsed time between the start of an access attempt and
successful access. For the ARPANET Access time is
39

the time required to complete a Host-to-Host Telnet
connection and call local NTIA/ITS NCP.
(2) Incorrect access probability is defined as the ratio
of access attempts which result in incorrect access
to total access attempts counted during a measurement
period. For the ARPANET Incorrect access probability
is the ratio of access attempts resulting in a con
nection to the wrong ARPANET destination Host to the
total access attempts to all destination Hosts during
the measurement period.
(3) Access denial probability is defined as the ratio of
access attempts which result in access denial to total
access attempts counted during a measurement period.
For the ARPANET Access denial probability is the ratio
of access attempts to destination Hosts which resulted
in access denial to the total access attempts to all
destination Hosts during the measurement period.
(4) Disengagement time is defined as the average value of
elapsed time between the start of a disengagement'
attempt and successful disengagement. For the ARPANET
Disengagement time is the time required to cLose a
Host-to-Host Telnet connection.
(5) Disengagement failure probability is defined as the
ratio of disengagement attempts which result in dis
engagement failure to total disengagement attempts
counted during the measurement period. For the ARPANET
Disengagement failure probability is the ratio of
disengagement attempts to a destination Host which
resulted in disengagement failure to total disengage
ment attempts to all destination Hosts during the
measurement period.
The Elf (operating system) telnet was modified to measure
access time and aisengagmeent time. These two time intervals
include the sum of two sequential time interva+s:
(1) An operator action time is needed to type a connect
(5.5 seconds) or close (3.3 seconds) command to Telnet.40
(2) A yariable connection or closing time interval is
required by the Telnet connect and close commands
between two ARPANET Hoat.s , see Table 1.
Access and disengagement times were measured over ARPANET
paths from the NTIA/ITS Host (source) to 19 destination Telnet
server Hosts (see Sec. 6, Tables 1 and 2) selected arbitrarily
from the ARPANET 1977 directory. Approximately ten sample values
of access time and disengagement time were averaged for each
destination Host for each of seven time slots and recorded in
Table 2 (Sec. 6). The overall average for each destination Host
is contained in the last column in Table 2 headed by Avg. The
values in the column headed by Avg (Table 2) were averaged over
all recorded measurement data (about 70 sample values). These
data revealed that Host-to-Host access time is more variable than
disengagement time. This variability is probably caused by
greater delays during the initial connection process at the
destination Host (see Sec. 7.2) and by the exchange of IMP-to-IMP
control messages required for initial connections (see Sec. 5.1).
The uniformity of disengagement times in Table 2 demonstrates
that after initial Host-to-Host connections are established
(access), Host-to-Host message exchanges function in a uniform
manner.
From 1221 successful access attempts the' incorrect access
probability was determined to be zero for Host-to-Host Telnet
connections. An incorrect access probability of zero in 1221
measurements (Hosts) can be interpreted as good Host-to-Host
operational performance. Access denial probability was computed
from Tables A.l through A.IO (Appendix A). In 1239 access
attempts, access denial probability was found to be 0.015. Dis
engagement failure probability was also computed from Tables A.l
through A.IO (from 1221 disengagement attempts) and found to be
0.033.
The primary conclusion is that the five proposed perfor
mance parameters selected for measurement here were applicable to
the ARPANET and that these parameters were measurable.
41
9. RECOMMENDATIONS
The author recommends that measurement experiments be con
ducte~ which employ many Hosts simultaneously to provide data re
lated to network performance. The network measurements could be
used to test the proposed performance parameters for overall
network performance.
The remaining performance parameters of proposed standard
1033 concerning accuracy, efficiency, and reliability need to be
tested. The author recommends that these parameters be measured
on the ARPANET.
10. ACKNOWLEDGMENTS
The author would like to thank Dr. P.M. McManamon, who
directs the data communication programs at.NTIA/ITS, for his many
helpful comments and Dr. D.L. Retz of the Stanford Research
Institute for his assistance with the measurement software which
runs under Elf. Thanks are also extended to Dr. E.L. Crow of
NTIA/ITS for his helpful comments about statistical matters,
to Mr. Evan Dutton, Mr. Robert Linfield and Evie Gray for their
helpful reviews and to Ms. Pat Sanchez for her superior typing
assistance.
42

11. REFERENCES
ARPANET Directory (1977), prepared for Defense Communications
Agency by Network Information Center, SRI International,
Menlo Park, CA 94025.
ARPANET Protocol Handbook (1978), prepared for Defense Communica
tions Agency by Netrwork Information Center, SRI Inter
national, Menlo Park, CA 94025.
ARPANET Transition Plan (1975), pp. 1-5, prepared by Advanced
Research Projects Agency and the Defense Communications
Agency.
Bendat, J., and A. Piersal (1966), Measurement and Analysis of
Random Data (John Wiley & Sons, Inc., New York, New York).
Bolt Beranek and Newman, Inc. (BB&N) (1976), Interface message
processor, Report No. 1822, Developed for the Advanced
Research Projects Agency by BB&N.
Davies, D., and D. Barber (1973), Communication Networks' for
Computers (John Wiley & Sons, Ltd., London, England).
Federal Register (1977), Telecommunications: Digital communica
tion performance parameters, proposed Federal Standard 1033,
published February 22, 1977, Vol. 42, No. 35, pp. 10353-10375.)
Heart, F., R. Kahn, S. Ornstein, W. Crowther, and D. Walden (1970),
The interface message pro,cessorfor the ARPA computer net
work, Proceedings, 1970 Spring Joint Computer Conference.
Kleinrock, L. (1976), Queueing Systems, Volume 2: Computer
Applications (John Wiley & Sons, Inc., New York, New York).
Kl.e i.nr ock , L., W.c,Naylor, and H. Opderbeck (1976), A study of
line overhead in the ARPANET, Communications of the ACM,
Volume 19, No.1, pp. 3-13, January.
McManamon, P.M., R.K. Rosich, J. Payne, and M. Miles (1975),
Performance criteria for digital data networks, OT Report
75-54. (Available from the National Technical Information
Service, 5285 Port Royal Road, Springfield, VA 22161,
Accession No. COM-75-10779.)
43

Postel, ~. (1971), Official initial connection protocol, Net
work Information Center, document number 7101, ARPANET
Protocol Handbook, Prepared for Defense Communications
Agency, Code 535.
Retz, D., J. Miller, J. McClurg, and B. Schafer (l976), Elf
programmer's guide (Speech Communication Research Lab, Inc.,
Santa Barbara, CA 93109).
Roberts, L.G. (1967), Multiple computer networks and inter
computer communications, Proceedings of the ACM Symposium
on Operating Systems, Gatlinbur~, Tennessee.
Schwartz, M. (1977), Computer-Communication Network Design and
Analysis (Prentice-Hall, Inc., Englewood Cliffs, N.J.).
44

APPENDIX. MEASUREMENT TABLES
This Appendix contains the raw sample values recorded during
the measurement experiment. These sample values are listed in
the 10 tables (A.l through A.IO). Each table denotes the name of
the Host, the approximate time of day when data were recorded,
the MHR (minimal hop route), a value for connection attempt time
(top value) and a value for close attempt time (bottom value).
The tables also show access attempt failures (A), disengagement
attempt failures (F), and whether or not the destination Host was
operational on the ARPANET (0). The MHR is the smallest number
of links connecting the nodes separating the destination Host
server from theNTIA/ITS Host's DOCB TIP located in Boulder,
Colorado. The MHR data were determined from Figure 1.
45

Table A.1. Sample Values from Measurements on August 23, 1977 (EachRectangle Space Contains (top) the Connection AttemptTime (ms ) and (bottom) the Close Attempt Time (ms) )
0900 1000 1100 0200 0300 0400 0500 .Connect Connect Connect Connect Connect Connect Connect
Host MHR Close Close Close Close Close· Close CloseUSC-ISIB 2 2504 4035 2628 3193 4289 3208 3239
1753 1647 1556 1600 1805 F 1670UCLA-CCN 2 2090 2016 1914 2318 1920 1992 1906
1700 1993 4535 1898 1759 1864 1850USC-lSI 3 3173 3643 3353 4881 3792 3762 3451
1705 1783 2143 F 2012 1725 1565CMU-I0A 3 2244 2420 2130 2328 2182 2151 2166
1512 1667 1689 1624 1773 1618 1602CMU-10B 3 2529 2079 2293 2208 2850 2247 2091
1734 1831 1590 1628 1973 1674 1596HARV-I0 4 2672 2444 2679 2659 2812 2622 2674
1611 1882 1846 1819 1797 1932 1770SU-AI 4 2424 3997 2369 3463 2789 2782 2442
1600 1724 1664 1899 1618 1565 1682SUMEX-AIM 5 4006 3784 5336 A 4648 5405 5708
1912 2136 2268 2860 2618 8084NBS-I0 6 3474 3195 2708 3078 2726 2821 2898
2002 F 1775 1993 1984 2053 1998AMES-67 6 3318 4962 2850 3870 5412 4949 4453
3128 3223 1913 5413 3511 2191 4226RUTGERS 6 2993 3277 2825 2455 2984 2776 3261
2016 2092 1998 2259 1911 1847 1874BB&N 6 4876 4642 5853 5383 4492 4328 4534
2180 2259 1905 1985 1917 1941 2380BBN&N-B 6 6581 4748 5975 6058 4920 5018 3913
1852 1998 1997 2345 2077 2037 1802CCA 7 6135 4912 5092 5180 3515 5785 8717
2255 2205 1964 2147 2033 1802 2134SRI-KA 7 4295 4666 4239 3733 5472 4719 4055
2341 2153 1987 2108 2279 2078 1678SRI-KL 7 4133 5200 5484 5209 4328 5528 4·537
2278 17200 1903 1835 2263 2103 2152MIT-DMS 7 4309 3908 4338 5353 3970 5385 390-9
2334 2254 2031 1902 2035 2177 2075MIT-AJ 7 4468 4315 4614 5096 4093 4827 3964
2335 2701 2076 2140 1941 2175 2305LONDON 8 7733 8010 7981 7164 9397 7838 7936
4273 3873 4084 3804 4089 3772 4672
A - Access Attempt FailedF - Disengagement Attempt Failedo - Destination Host Off-netMHR - Minimal Hop Route
46
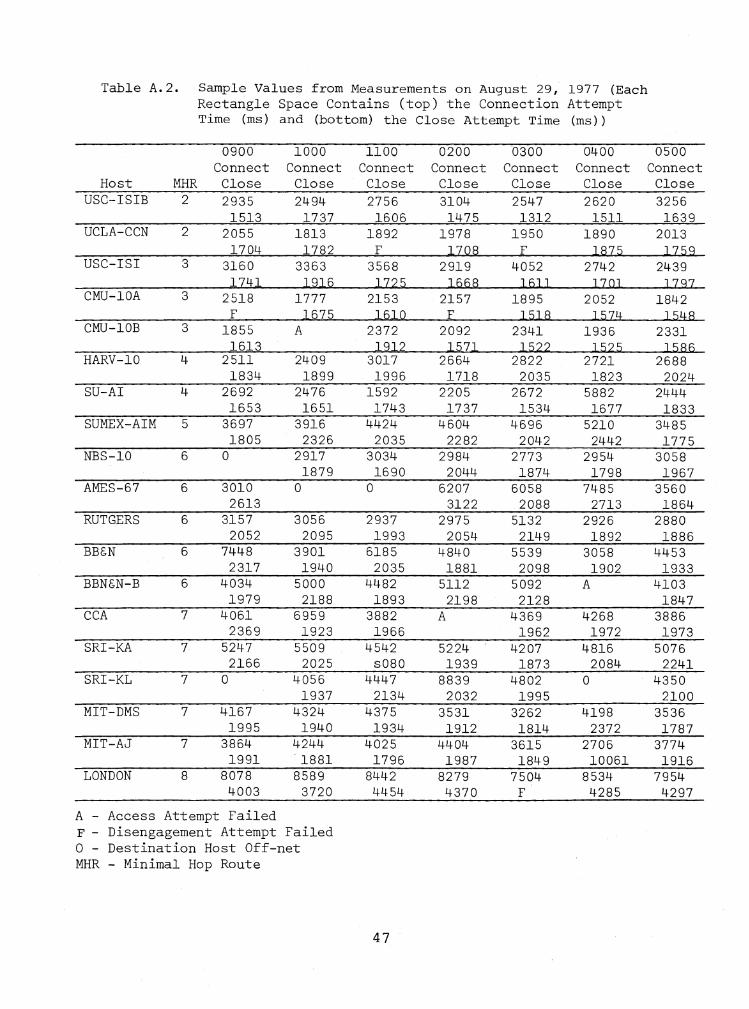
Table A.2. Sample Values from Measurements on August 29, 1977 (EachRectangle Space Contains (top) the Connection AttemptTime (ms) and (bottom) the Close Attempt Time (ms ) )
0900 1000 1100 0200 0300 0400 0500Connect Connect Connect Connect Connect Connect Connect
Host MHR Close Close Close Close Close Close CloseUSC-ISIB 2 2935 2494 2756 3104 2547 2620 3256
1513 1737 1606 1475 1312 1511 1639UCLA-CCN 2 2055 1813 1892 1978 1950 1890 2013
1704 1782 F 1708 F 1875 1759USC-lSI 3 3160 3363 3568 2919 4052 2742 2439
1741 1916 1725 1668 ] 61 ] 1701 1797CMU-I0A 3 2518 1777 2153 2157 1895 2052 1842
F 1675 1610 F 1518 1574 J 548CMU-I0B 3 1855 A 2372 2092 2341 1936 2331
1613 1912 1571 1522 J 525 1586HARV-I0 4 2511 2409 3017 2664 2822 2721 2688
1834 1899 1996 1718 2035 1823 2024SU-AI 4 2692 2476 1592 2205 2672 5882 2444
1653 1651 1743 1737 1534 1677 1833SUMEX-AIM 5 3697 3916 4424 4604 4696 5210 3485
1805 2326 2035 2282 2042 2442 1775NBS-I0 6 0 2917 3034 2984 2773 2954 3058
1879 1690 2044 1874 1798 1967AMES-67 6 3010 0 0 6207 6058 7485 3560
2613 3122 2088 2713 1864RUTGERS 6 3157 3056 2937 2975 5132 2926 2880
2052 2095 1993 2054 2149 1892 1886BB&N 6 7448 3901 6185 4840 5539 3058 4453
2317 1940 2035 1881 2098 1902 1933BBN&N-B 6 4034 5000 4482 5112 5092 A 4103
1979 2188 1893 2198 2128 1847CCA 7 4061 6959 3882 A 4369 4268 3886
2369 1923 1966 1962 1972 1973SRI-KA 7 5247 5509 4542 5224 4207 4816 5076
2166 2025 s080 1939 1873 2084 2241SRI-KL 7 0 4056 4447 8839 4802 0 4350
1937 2134 2032 1995 2100MIT-DMS 7 4167 4324 4375 3531 3262 4198 3536
1995 1940 1934 1912 1814 2372 1787iv1IT-AJ 7 3864 4244 4025 4404 3615 2706 3774
1991 1881 1796 1987 1849 10061 1916LONDON 8 8078 8589 8442 8279 7504 8534 7954
4003 3720 4454 4370 F 4285 4297
A - Access Attempt FailedF - Disengagement Attempt Failedo - Destination Host Off-netMHR - Minimal Hop Route
47
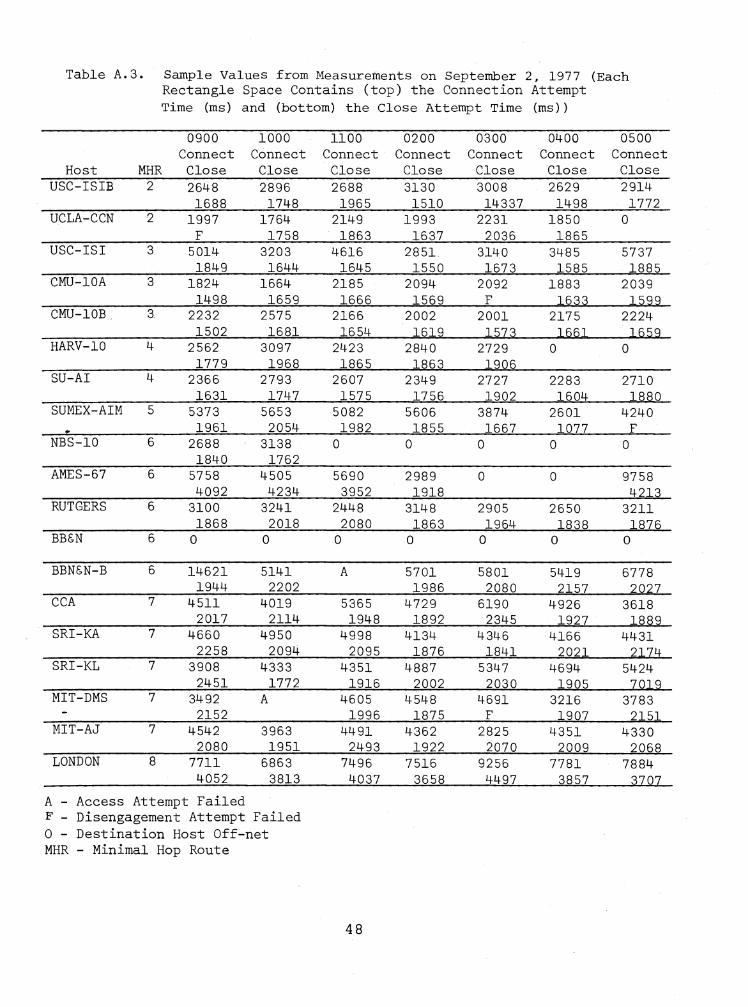
Table A.3. Sample Values from Measurements on September 2, 1977 (EachRectangle Space Contains (top) the Connection AttemptTime (ms) and (bottom) the Close Attempt Time (ms ) )
0900 1000 1100 0200 0300 0400 0500Connect Connect Connect Connect Connect Connect Connect
Host MHR Close Close Close Close Close Close CloseUSC-ISIB 2 2648 2896 2688 3130 3008 2629 2914
1688 1748 1965 1510 14337 1498 1772UCLA-CCN -2 1997 1764 2149 1993 2231 1850 0
F 1758 1863 1637 2036 1865USC-lSI 3 5014 3203 4616 2851 3140 3485 5737
1849 1644 1645 1550 1673 1585 1885CMU-I0A 3 1824 1664 2185 2094 2092 1883 2039
1498 1659 1666 1569 F 1633 1599CMU-I0B_ 3. 2232 2575 2166 2002 2001 2175 2224
1502 1681 1654 1619 1573 1661 1659HARV-I0 4 2562 3097 2423 2840 2729 0 0
1779 1968 1865 1863 1906SU-AI 4 2366 2793 2607 2349 2727 2283 2710
1631 1747 1575 1756 1902 1604 1880SUMEX-AIM 5 5373 5653 5082 5606 3874 2601 4240
.. 1961 2054 1982 1855 1667 1077 FNBS-I0 6 2688 3138 0 0 0 0 0
1840 1762AMES-67 6 5758 4505 5690 2989 0 0 9758
4092 4234 3952 1918 4213RUTGERS 6 3100 3241 2448 3148 2905 2650 3211
1868 2018 2080 1863 1964 1838 1876BB&N 6 0 0 0 0 0 0 0
BBN&N-B 6 14621 5141 A 5701 5801 5419 67781944 2202 1986 2080 2157 2027
CCA 7 4511 4019 5365 4729 6190 4926 36182017 2114 1948 1892 2345 1927 1889
SRI-KA 7 4660 4950 4998 4134 4346 4166 44312258 2094 2095 1876 1841 2021 2174
SRI-KL 7 3908 4333 4351 4887 5347 4694 54242451 1772 1916 2002 2030 1905 7019
MIT-DMS 7 3492 A 4605 4548 4691 3216 37832152 1996 1875 F 1907 2151
MIT-AJ 7 4542 3963 4491 4362 2825 4351 43302080 1951 2493 1922 2070 2009 2068
LONDON 8 7711 6863 7496 7516 9256 7781 78844052 3813 4037 3658 4497 3857 3707
A - Access Attempt FailedF - Disengagement Attempt Failedo - Destination Host Off-netMHR - Minimal Hop Route
48
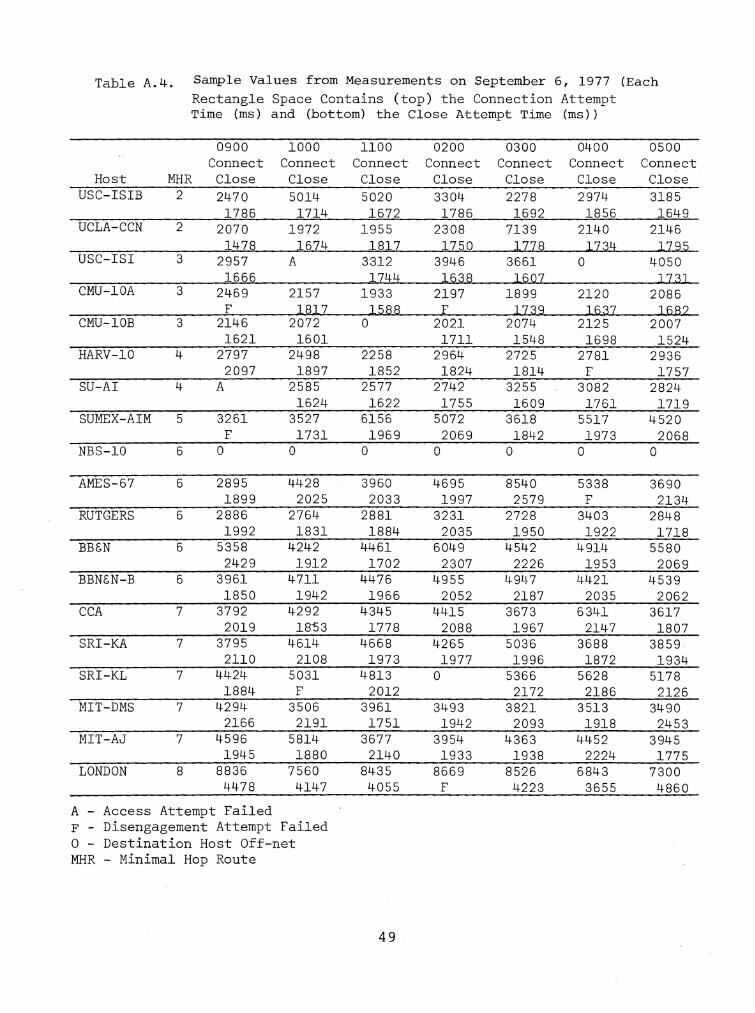
Table A.4. Sample Values from Measurements on September 6, 1977 (EachRectangle Space Contains (top) the Connection AttemptTime (ms) and (bottom) the Close Attempt Time (ms ) )
0900 1000 1100 0200 0300 0400 0500Connect Connect Connect- Connect Connect Connect Connect
Host MHR Close Close Close Close 'Close Close CloseUSC-ISIB 2 2470 5014 5020 3304 2278 2974 3185
1786 1714 1672 1786 1692 1856 1649UCLA-CCN 2 2070 1972 1955 2308 7139 2140 2146
1478 1674 1817 1750 1778 1734 1795USC-lSI 3 2957 A 3312 3946 3661 0 4050
1666 1744 1638 1607 J 731CMU-I0A 3 2469 2157 1933 2197 1899 2120 2086
F 1817 1588 F 1739 1637 J682CMU-I0B 3 2146 2072 0 2021 2074 2125 2007
1621 1601 1711 1548 1698 1524HARV-I0 4 2797 2498 2258 2964 2725 2781 2936
2097 1897 1852 1824 1814 F 1757SU-AI 4 A 2585 2577 2742 3255 3082 2824
1624 1622 1755 1609 1761 1719SUMEX-AIM 5 3261 3527 6156 5072 3618 5517 4520
F 1731 1969 2069 1842 1973 2068NBS-IO 6 0 0 0 f"\ rv 0 0v v
AMES-67 6 2895 4428 3960 4695 8540 5338 36901899 2025 2033 1997 2579 F 2134
RUTGERS 6 2886 2764 2881 3231 2728 3403 28481992 1831 1884 2035 1950 1922 1718
BB&N 6 5358 4242 4461 6049 4542 4914 55802429 1912 1702 2307 2226 1953 2069
BBN&N-B 6 3961 4711 4476 4955 49L~7 4421 45391850 1942 1966 2052 2187 2035 2062
CCA 7 3792 4292 4345 4415 3673 6341 36172019 18-03 1778 2088 1967 2147 1807
SRI-KA 7 3795 4614 4668 4265 5036 3688 3859·2110 2108 1973 1977 1996 1872 1934
SRI-KL 7 4424 5031 4813 0 5366 5628 51781884 F 2012 2172 2186 2126
MIT-DMS 7 4294 3506 3961 3493 3821 3513 34902166 2191 1751 1942 2093 1918 2453
MIT-AJ 7 4596 5814 3677 3954 4363 4452 39451945 1880 2140 1933 1938 2224 1775
LONDON 8 8836 7560 8435 8669 8526 6843 73004478 4147 4055 F 4223 3655 4860
A Access Attempt FailedF - Disengagement Attempt Failedo - Destination Host Off-netMHR - Minimal Hop Route
49

Table A.5. Sample Values from Measurements on September 7, 1977 (EachRectangle Space Contains (top) the Connection AttemptTime (ms) and (bottom) the Close Attempt Time (ms ) )
0900 1000 1100 0200 0300 0400 0500Connect Connect Connect Connect Connect Connect Connect
Host MHR Close Close Close Close Close Close CloseUSC-ISIB 2 3180 3047 3289 A 2657 A 5155
1750 1612 1365 1819 1778UCLA-CCN 2 1904 1897 2014 2035 2673 2064 2050
1522 1682 1799 1675 2189 1782 1859USC-lSI 3 4065 3762 3112 4293 3608 2590 2892
1751 1730 1817 1.800 1513 1679 1905CMU-I0A 3 2211 0 1896 2354 2146 2377 2207
1636 1675 1715 1735 1762 1630CMU-I0B 3 2052 1850 2351 1917 2029 2410 2443
1527 1599 1705 1620 1620 1396 2004HARV-I0 4 2652 2516 2238 2464 4251 2386 2907
1865 1919 1825 1837 1833 1980 1689SU-AI 4 2452 2584 2485 2502 2238 4279 6386
1569 1923 1747 1631 1618 1694 1690SUMEX-AIM 5 3292 3248 4102 3567 3976 6596 3611
1725 2025 1900 1832 2167 2933 2104NBS-I0 6 3042 2683 3154 A 2953 2804 2825
1941 2002 1952 2158 1903 1942AMES-67 6 3751 3778 6199 A 7357 4616 3388
1949 2189 3862 4884 2025 2737RUTGERS 6 A 2821 3156 2918 3201 2867 A
1999 1940 1939 3112 FBB&N 6 5672 7542 4555 4266 7842 A 5486
2304 2167 2131 2481 3240 2014BBN&N-B 6 4178 5048 8511 4799 10268 5480 4001
1921 1913 1989 2098 3736 2027 2012CCA 7 4586 4272 4359 3555 4382 5443 4828
2061 2417 F 1690 1996 1960 2297SR:L-KA 7 4422 4671 5836 6387 7136 4965 4378
1989 2024 1908 1883 1966 1728 1963SRI-KL 7 4127 4839 4109 3929 5707 4642 4491
2210 1925 2342 2093 1891 F 1875MIT-DMS 7 4859 4878 4281 3131 4105 4044 4045
1909 1938 1937 2100 1882 1786 2213MIT-AJ 7 4769 4578 3994 4213 7164 4302 3708
1812 2~31 2089 2301 1975 1994 1933LONDON 8 0 0 0 0 0 0 0
A - Access Attempt FailedF - Disengagement Attempt Failedo - Destination Host Off-netMHR - Minimal Hop Route
50

Table A.6. Sample Values from Measurements on September 9, 1977 (EachRectangle Space Contains (top) the Connection AttemptTime (ms ) and (bottom) the Close Attempt Time (ms ) )
0900 1000 1100 0200 0300 0400 0500Connect Connect Connect Connect Connect Connect Connect
Host MHR Close Close Close Close Close Close CloseUSC-ISIB 2 3225 2387 2794 3438 3620 2802 3038
1624 1685 F 1665 1399 1824 1685UCLA-CCN 2 1681 2000 1833 2150 1952 1819 1960
1993 1841 1681 1571 1708 1674 1797USC-ISI 3 2865 3470 3967 3799 4938 6335 3612
1824 1671 1689 1602 1708 1714 1610CMU-I0A 3 2123 2166 2800 2021 2113 1883 2148
1717 1518 1670 1673 1615 1562 1684CMU-I0B 3 2143 1745 1856 2151 2015 2086 2344
1691 1652 1559 1581 1548 1572 1612HARV-I0 4 0 2590 2444 3156 2447 2411 2477
1955 1688 1881 1767 1712 2443SU-AI 4 2430 2535 3098 2533 2472 2456 2537
1576 1860 1640 1650 1548 1854 1848SUMEX-AIM 5 0 0 0 4341 3609 3059 3956
2035 1922 2275 1767NBS-10 6 2717 2344 2563 2752 2716 2723 2664
F 2032 1730 1899 1939 1861 1940AMES-67 6 5310 5726 4440 0 6226 3982 10393
2942 4356 1850 2603 2475 2772RUTGERS 6 32.34 2939 2740 2339 2917 2973 2915
1915 1837 2027 2042 1893 F 2055BB&N 6 5840 5530 5239 4783 5458 5691 5512
2185 1921 2050 14248 2151 2068 2375BBN&N-B 6 6720 4295 4508 5521 5316 3393 6051
1929 1961 2129 1976 2071 1890 2249CCA 7 4691 4203 4596 3962 4390 3406 5002
2071 1935 1951 1920 2166 1968 2144SRI-KA 7 4756 4551 5234 6347 6125 3670 4482
1893 2254 1979 2067 2103 2215 1915SRI-KL 7 4200 5429 4378 5544 5253 4407 5445
1956 2017 2160 1814 2306 2045 2015MIT-DMS 7 4647 3581 4128 3769 3833 3412 3325
1991 1692 2159 1910 2046 1855 2645MIT-AJ 7 5049 4012 4754 5102 4034 3677 3508
2102 1923 2250 1918 2029 2141 1900LONDON 8 9941 10507 8618 0 0 0 0
4214 5287 4786
A - Access Attempt FailedF - Disengagement Attempt Failedo - Destination Host Off-netMHR - Minimal Hop Route
51

Table A.7. Sample Values from Measurements on September 14" 1977 (Each
Rectangle Space Contains (top) the Connection AttemptTime (ms ) and (bottom) the Close Attempt Time (ms ) )
0900 1000 1100 0200 0300 0400 0500Connect Connect Connect Connect Connect Connect Connect
Host MHR Close Close Close Close Close- Close CloseUSC-ISIB 2 2352 3677 3129 2889 2494 3408 3361
1592 1652 1820 1446 1672 2155 1716UCLA-CCN 2 1757 2069 2092 1911 1790 2273 1861
1702 F 1784 1732 1436 1697 1779USC-lSI 3 2757 2964 3606 3097 3255 3780 3933
1607 1727 1641 1827 1746 1447 1882CMU-I0A 3 2332 1529 1858 1686 1924 2085 2124
1587 1446 1682 1585 1583 1560 1514CMU-I0B 3 2082 2315 2283 0 1861 2111 2008
1865 1656 1685 1627 1677 1593HARV-I0 4 2534 2422 2477 2867 2615 2628 2858
1670 1660 1794 1620 1707 2090 2022SU-AI 4 2449 2986 2543 1878 6627 5075 6373
1586 1668 1568 1753 1877 1763 ] 565SUMEX-AIM 5 3042 3792 3091 4446 4099 4182 3695
.1746 1973 2551 1714 1847 1930 ]735NBS-I0 6 3245 3210 3376 2551 2529 2762 2653
2059 2208 2232 F 1860 1828 2094AMES-67 6 3701 5820 2851 4144 A 2843 5587
1688 3075 1845 3335 2319 2233RUTGERS 6 2987 3011 3349 2910 3591 A 3029
2124 2028 F 1781 1779 1878BB&N 6 5015 4572 5891 5939 4767 5774 4760
2267 2157 2281 2908 2834 2224 2130BBN&N-B 6 5925 5391 4367 11626 4603 0 0
2105 2133 1756 3343 2101CCA 7 4256 6084 5124 4927 4405 3640 3719
2134 2335 2332 2024 2151 F 2092SRI-KA 7 3453 4167 5678 11592 4675 4672 3927
1852 1971 20289 1881 1922 1913 1810SRI-KL 7 4407 5197 4705 A 4597 4281 4792
1942 1972 1958 2023 2287 2127MIT-DMS 7 0 4287 3626 4280 4019 4697 3665
2208 F 2018 1700 1858 1908MIT-AJ 7 4120 4562 3564 4030 3456 3780 3370
1861 2008 1808 1931 2056 1891 1734LONDON 8 0 7522 0 7849 0 0 0
3933 4020
A ~ Access Attempt FailedF - Disengagement Attempt Failedo - Destination Host Off-netMHR - Minimal Hop Route
52

Table A.8. Sample Values from Measurements on September 15, 1977 (EachRectangle Space Contains (top) the Connection AttemptTime (ms) and (bottom) the Close Attempt Time (ms ) )
0900 1000 1100 0200 0300 0400 0500Connect Connect Connect Connect Connect Connect Connect
Host MHR Close Close Close Close Close Close CloseUSC-ISIB 2 2940 2719 2594 2718 2683 3350 3442
1814 1746 2830 1535 1299 1611 1696UCLA-CCN 2 1840 2070 A 2088 1842 1951 1858
1672 1725 1779 1862 1719 1828USC-lSI 3 3118 3082 4269 4670 3664 3359 3268
1933 1427 1861 1930 1635 1870 1742CMU-I0A 3 0 0 0 2097 1857 2052 2561
1633 1678 1881 1856eMU-lOB 3 1848 2082 1993 2473 1838 2203 2119
1591 1795 1653 1656 1582 1634 1602HARV-I0 4 0 2592 2717 2996 0 0 0
1834 2248 1871SU-AI 4 2767 2432 2390 6487 4170 8474 5587
1638 1793 1633 1743 1629 1634 1765SUMEX-AIM 5 3515 5627 3291 3801 3168 5101 4244
1731 2085 1829 1800 17.34 1794 2022NBS-I0 6 2797 2699 3868 3297 2632 2691 3000
1819 1885 2239 2103 1647 1695 1963AMES-67 6 3076 4151 3481 3468 2802 3156 2306
2984 2853 2034 1852 2160 2187 2472RUTGERS 6 3136 3216 3172 3197 3097 2762 3218
1861 2006 1847 1904 1994 2128 2200BB&N 6 6578 5745 5041 6418 5355 5327 6423
2007 2468 2070 2024 1938 2517 2366BBN&N-B 6 5041 5336 5245 4676 8317 5884 4482
1796 2026 2015 1976 3369 1808 2008CCA 7 4972 4479 5393 5306 4727 5342 5138
2089 2342 2179 1964 1912 1937 2055SRI-KA 7 4529 4826 5528 7487 5030 6535 4873
2029 2242 2208 2110 7668 2504 1978SRI-KL 7 4319 4361 6087 0 4165 3572 4054
1940 1837 2508 2662 1911 2175MIT-DMS 7 4756 4243 4220 3915 3776 3978 4128
2078 1941 1912 2085 1785 2078 2022MIT-AJ 7 4402 4600 4673 4268 3282 4102 3668
F 2063 2076 2280 1811 1936 2018LONDON 8 7527 0 0 0 7347 7279 7323
3758 3910 3450 4386
A - Access Attempt FailedF - Disengagement Attempt Failedo - Destination Host Off-netMHR - Minimal Hop Route
53

Table A.9. Sample Values from Measurements on September 20, 1977 (EachRectangle Space Contains (top) the Connection AttemptTime (ms) and (bottom) the Close Attempt Time (ms) )
0900 1000 1100 0200 0300 0400 0500Connect Connect Connect Connect Connect Connect Connect
Host MHR Close Close Close Close Close Close CloseUSC-ISIB 2 3173 2382 2769 2935 2837 2926 2955
1625 1799 1712 1513 1615 1568 1799UCLA-CCN 2 1717 2061 1965 2097 1896 2151 1913
1893 1757 1663 2043 1936 2024 1723USC-lSI 3 4265 3774 2992 3160 3107 4557 2901
2267 1647 1531 1741 1968 1707 1700CMU-10A 3 2146 1954 2092 1990 2021 2241 2030
1536 1800. 1552 1715 1723 1597 1622CMU-10B 3 1750 0 0 2343 2228 2131 2113
1630 1857 1759 1545 1500HARV-10 4 0 2943 3195 2511 2591 2546 2734
1930 2014 1834 1871 1808 1977SU-AI 4 7652 0 3417 0 0 0 0
1558 1684SUMEX-AIM 5 3869 0 3441 3405 4002 4532 4681
2253 2574 2085 2204 4825 1849NBS-10 6 2904 2621 3048 2904 3461 2581 2559
1856 1951 1952 1881 F 1987 2024AMES-67 6 0 4889 4357 3632 3495 4090 4609
2124 2069 3051 1952 2069 2285RUTGERS 6 3007 2935 3126 3069 3024 2976 3267
1954 214r2 2245 1943 1876 2135 1958BB&N 6 6240 4871 5727 5232 5470 6705 4443
2546 2097 2158 2127 2499 2364 1895BBN&N-B 6 4885 4988 5147 4034 4172 6721 5106
2294 2087 1915 1979 2048 3297 2327CCA 7 5390 4705 2741 3944 4587 4243 4263
2427 2034 2161 2029 2891 1836 2054SRI-KA 7 5652 5199 5421 5247 6356 5492 7072
1857 2433 1678 2166 2432 2052 2217SRI-KL 7 4746 5405 4684 0 3307 4709 4671
2099 2332 2126 2066 2044 2270MIT-DMS 7 4045 4042 4306 4166 3667 4326 4467
2114 1657 2066 1937 2071 2194 2266MIT-AJ 7 4832 3611 4056 4723 4283 4316 3557
1910 1849 1949 2217 F 2215 2339LONDON 8 7673 7510 4904 8078 7791 7730 7239
4008 3757 4751 4003 3719 3925 4016
A - Access Attempt FailedF - Disengagement Attempt Failedo - Destination Host Off-netMHR - Minimal Hop Route
54
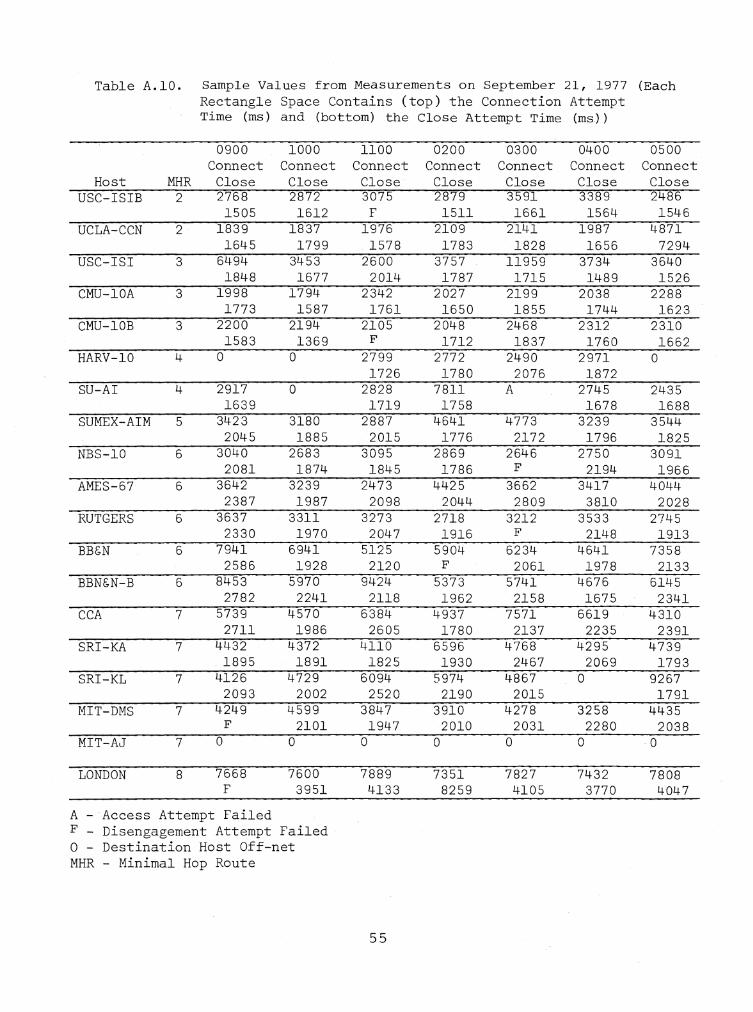
Table A.I0. Sample Values from Measurements on September 21, 1977 (EachRectangle Space Contains (top) the Connection AttemptTime (ms) and (bottom) the Close Attempt Time (ms.) )
0900 1000 1100 0200 0300 0400 0500Connect Connect Connect Connect Connect Connect Connect
Host MHR Close Close Close Close Close Close CloseUSC-ISIB 2 2768 2872 3075 2879 3591 3389 2486
1505 1612 F 1511 1661 1564 1546UCLA-CCN 2 1839 1837 1976 2109 2141 1987 4871
1645 1799 1578 1783 1828 1656 7294USC-lSI 3 6494 3453 2600 3757 11959 3734 3640
1848 1677 2014 1787 1715 1489 1526CMU-I0A 3 1998 1794 2342 2027 2199 2038 2288
1773 1587 1761 1650 1855 1744 1623CMU-I0B 3 2200 2194 2105 2048 2468 2312 2310
1583 1369 F 1712 1837 1760 1662HARV-I0 4 0 0 2799 2772 2490 2971 0
1726 1780 2076 1872SU-AI 4 2917 0 2828 7811 A 2745 2435
1639 1719 1758 1678 1688SUMEX-AIM 5 3423 3180 2887 4641 4773 3239 3544
2045 1885 2015 1776 2172 1796 1825l{BS-IO 6 3040 r"'If"'f""lro. 3095 2869 2646 2"150 3091LOO0
2081 1874 1845 1786 F 2194 1966AMES-67 6 3642 3239 2473 4425 3662 3417 4044
2387 1987 2098 2044 2809 3810 2028RUTGERS 6 3637 3311 3273 2718 3212 3533 2745
2330 1970 2047 1916 F 2148 1913BB&N 6 7941 6941 5125 5904 6234 4641 7358
2586 1928 2120 F 2061 1978 2133BBN&N-B 6 8453 5970 9424 5373 5741 4676 6145
2782 2241 2118 1962 2158 1675 2341CCA 7 5739 4570 6384 4937 7571 6619 4310
2711 1986 2605 1780 2137 2235 2391SRI-KA 7 4432 4372 4110 6596 4768 4295 4739
- 1895 1891 1825 1930 2467 2069 1793SRI-KL 7 4126 4729 6094 5974 4867 0 9267
2093 2002 2520 2190 2015 1791MIT-DMS 7 4249 4599 3847 3910 4278 3258 4435
F 2101 1947 2010 2031 2280 2038MIT-AJ 7 0 0 0 0 ('\ () f"\
v V "v
LONDON 8 7668 7600 7889 7351 7827 7432 7808F 3951 4133 8259 4105 3770 4047
A - Access Attempt FailedF _ Disengagement Attempt Failedo - Destination Host Off-netMHR - Minimal Hop Route
55

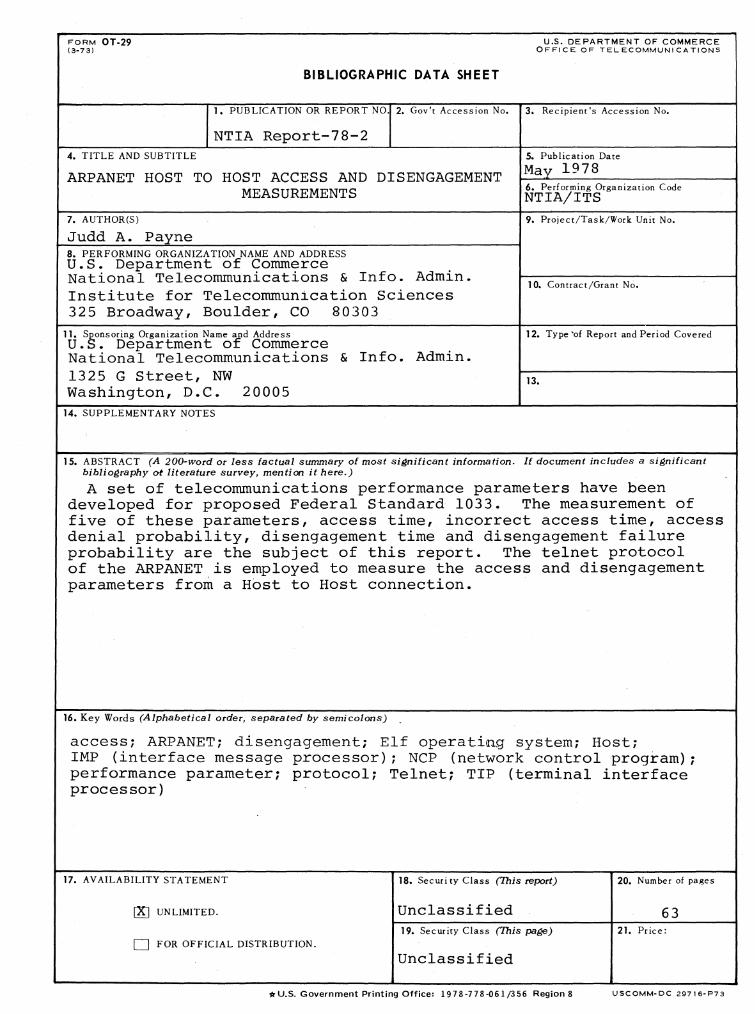
FORM OT-29(3-73)
U.S. DEPARTMENT OF COMMERCEOFFICE OF TELECOMMUNICATIONS
BIBLIOGRAPHIC DATA SHEET
1. PUBLICATION OR REPORT NO.2. Gov't Accession No.3. Recipient's Accession No.
NTIA Report-78-24. TITLE AND SUBTITLE
ARPANET HOST TO HOST ACCESS AND DISENGAGEMENTMEASUREMENTS
7. AUTHOR(S)
Judd A. Payne8. PERFORMING ORGANIZATION NAME AND ADDRESSU.S. Department of CommerceNational Telecommunications & Info. Admin.Institute for Telecommunication Sciences325 Broadway, Boulder, CO 80303
11. Sponsoring Organization Name and AddressU.S. Department of CommerceNational Telecommunications & Info. Admin.1325 G Street, NWWashington, D.C. 20005
14. SUPPLEMENTARY NOTES
5. Publication Date
May 19786. Performing Organization CodeNTIA/ITS9. Project/Task/Work Unit No.
10. Contract/Grant No.
12. Type 'of Report and Period Covered
13.
15. ABSTRACT (A 200-wordor less factual summary of most significant information. If document includes a significantbibli ogrephy ot literature survey, men ti on it here.)
A set of telecommunications performance parameters have beendeveloped for proposed Federal Standard 1033. The measurement offive of these parameters, access time, incorrect access time, accessdenial probability, disengagement time and disengagement failureprobability are the subject of this report. The telnet protocolof the ARPANET is employed to measure the access and disengagementparameters from a Host to Host connection.
16. Key Words (Alphabetical order, separated by semicolons)
access; ARPANET; disengagement; Elf operating system; Host;IMP (interface message processor); NCP (network control ·program);performance parameter; protocol; Telnet; TIP (terminal interfaceprocessor)
17. AVAILABILITY STATEMENT
[K] UNLIMITED.
D FOR OFFICIAL DISTRIBUTION.
18. Securi ty Class (This report)
Unclassified19. Security Class (This page)
Unclassified
20. Number of pages
6321. Price:
1rU.S. Government Printing Office: 1978-778-061/356 Region 8 USCOMM-DC 29716-P73
