arkansas state highway and transportation department nlrrotary.pdf · arkansas state highway and...
TRANSCRIPT
Arkansas State
Highway and Transportation
Department
Riverside Rotary Club
North Little Rock Monday, March 16, 2015

Arkansas Highway Commission
Ark
an
sa
s H
igh
wa
y &
Tra
nsp
ort
atio
n
Robert S. Moore Jr.
Arkansas CIty
Dick Trammel
Rogers
Tom Shueck
Little Rock
Frank Scott
Little Rock
Alec Farmer
Jonesboro
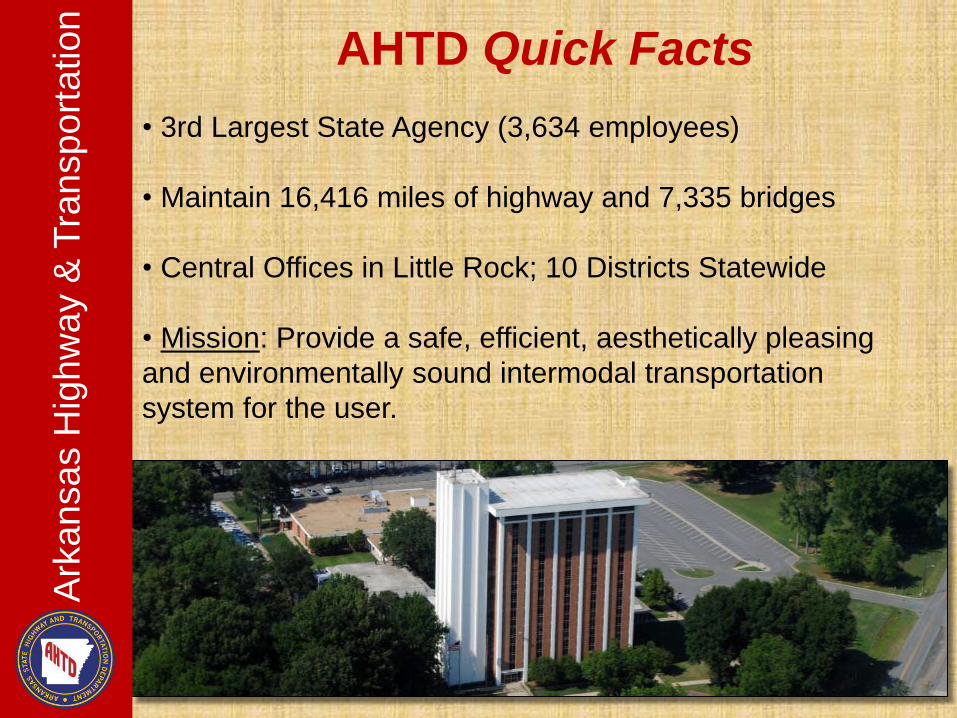
AHTD Quick Facts
• 3rd Largest State Agency (3,634 employees)
• Maintain 16,416 miles of highway and 7,335 bridges
• Central Offices in Little Rock; 10 Districts Statewide
• Mission: Provide a safe, efficient, aesthetically pleasing
and environmentally sound intermodal transportation
system for the user.
Ark
an
sa
s H
igh
wa
y &
Tra
nsp
ort
atio
n
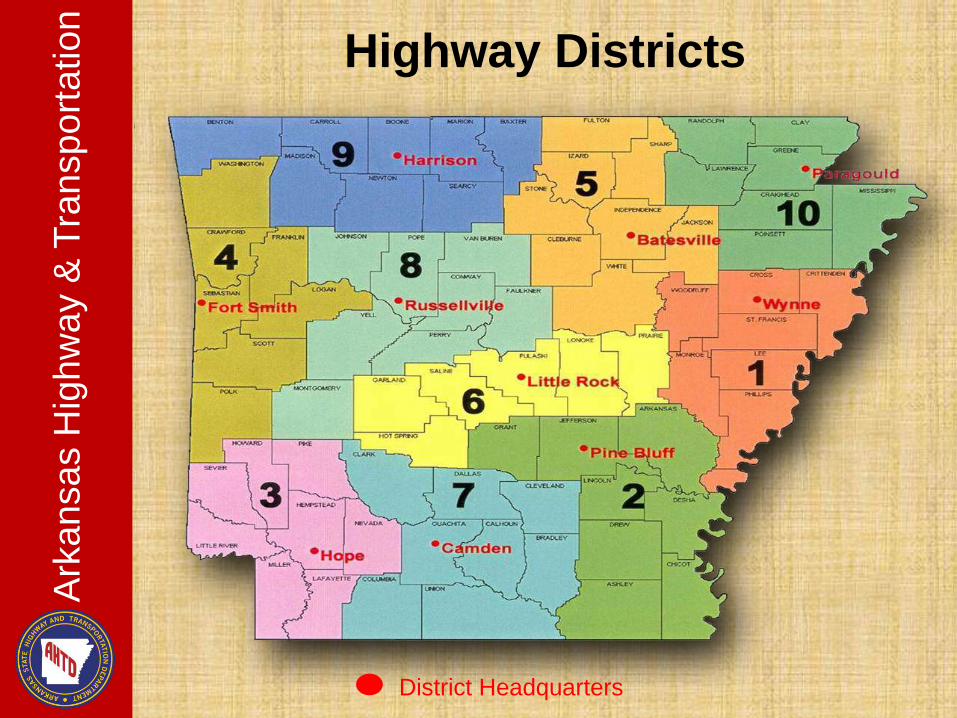
Highway Districts
District Headquarters
Ark
an
sa
s H
igh
wa
y &
Tra
nsp
ort
atio
n
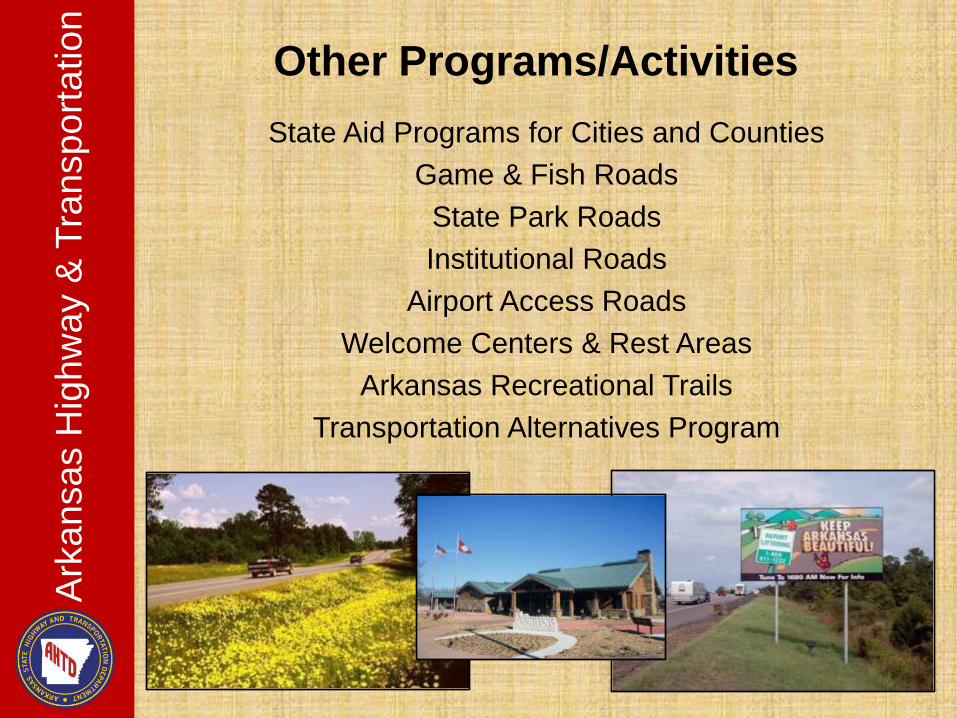
Other Programs/Activities
State Aid Programs for Cities and Counties
Game & Fish Roads
State Park Roads
Institutional Roads
Airport Access Roads
Welcome Centers & Rest Areas
Arkansas Recreational Trails
Transportation Alternatives Program
Ark
ansas H
ighw
ay &
Tra
nspo
rta
tio
n
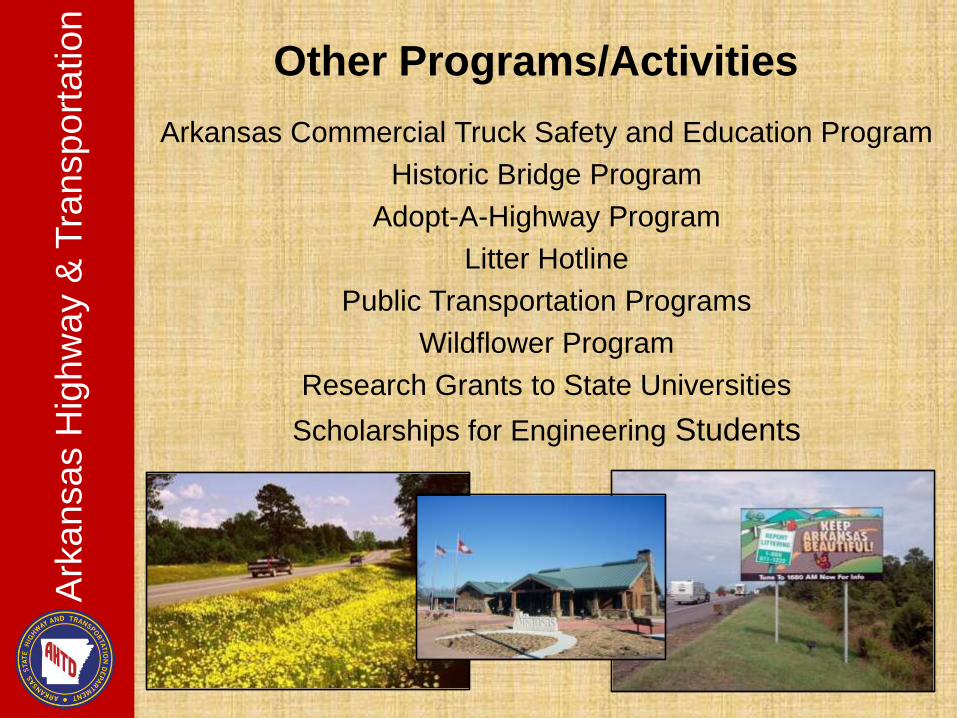
Arkansas Commercial Truck Safety and Education Program
Historic Bridge Program
Adopt-A-Highway Program
Litter Hotline
Public Transportation Programs
Wildflower Program
Research Grants to State Universities
Scholarships for Engineering Students
Ark
ansas H
ighw
ay &
Tra
nspo
rta
tio
n
Other Programs/Activities
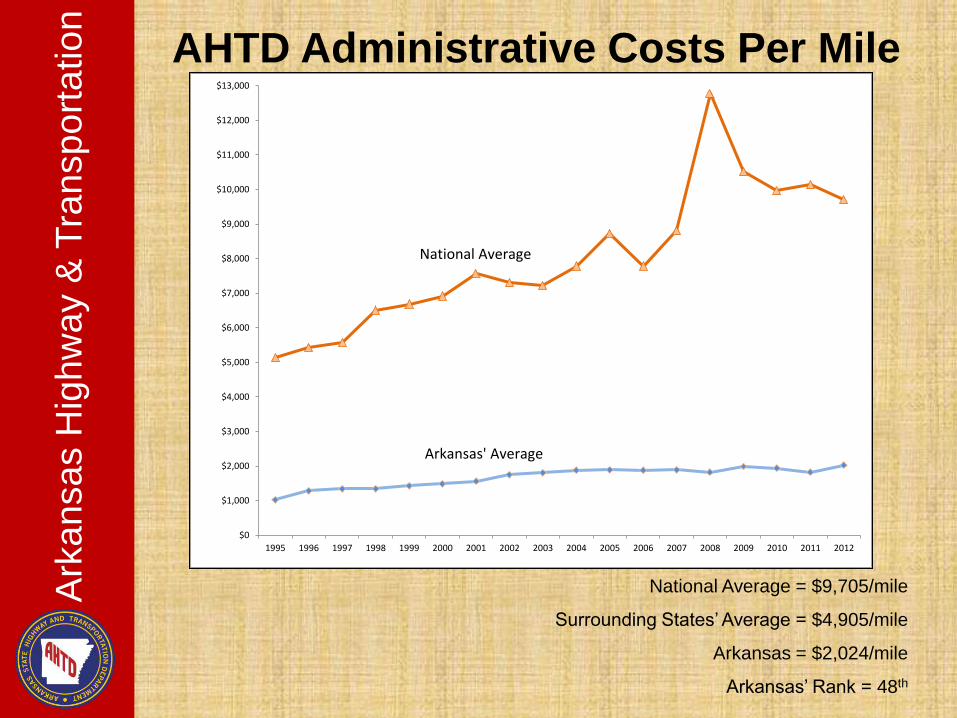
AHTD Administrative Costs Per Mile
National Average = $9,705/mile
Surrounding States’ Average = $4,905/mile
Arkansas = $2,024/mile
Arkansas’ Rank = 48th
$0
$1,000
$2,000
$3,000
$4,000
$5,000
$6,000
$7,000
$8,000
$9,000
$10,000
$11,000
$12,000
$13,000
1995 1996 1997 1998 1999 2000 2001 2002 2003 2004 2005 2006 2007 2008 2009 2010 2011 2012
National Average
Arkansas' Average
Ark
ansas H
ighw
ay &
Tra
nspo
rta
tio
n
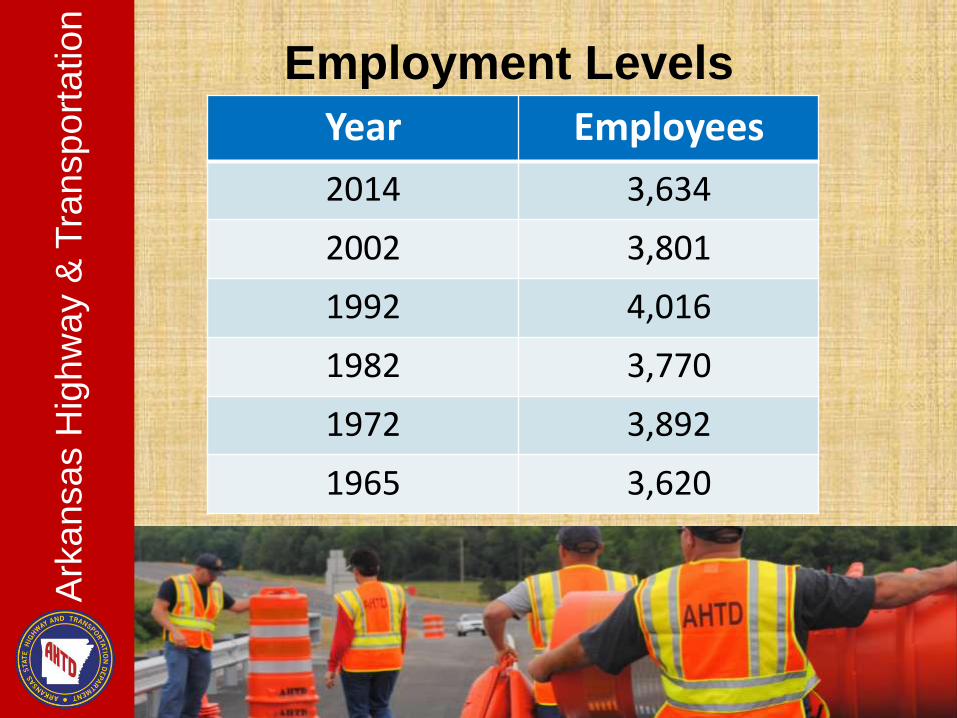
Employment Levels
Year Employees
2014 3,634
2002 3,801
1992 4,016
1982 3,770
1972 3,892
1965 3,620
Ark
ansas H
ighw
ay &
Tra
nspo
rta
tio
n
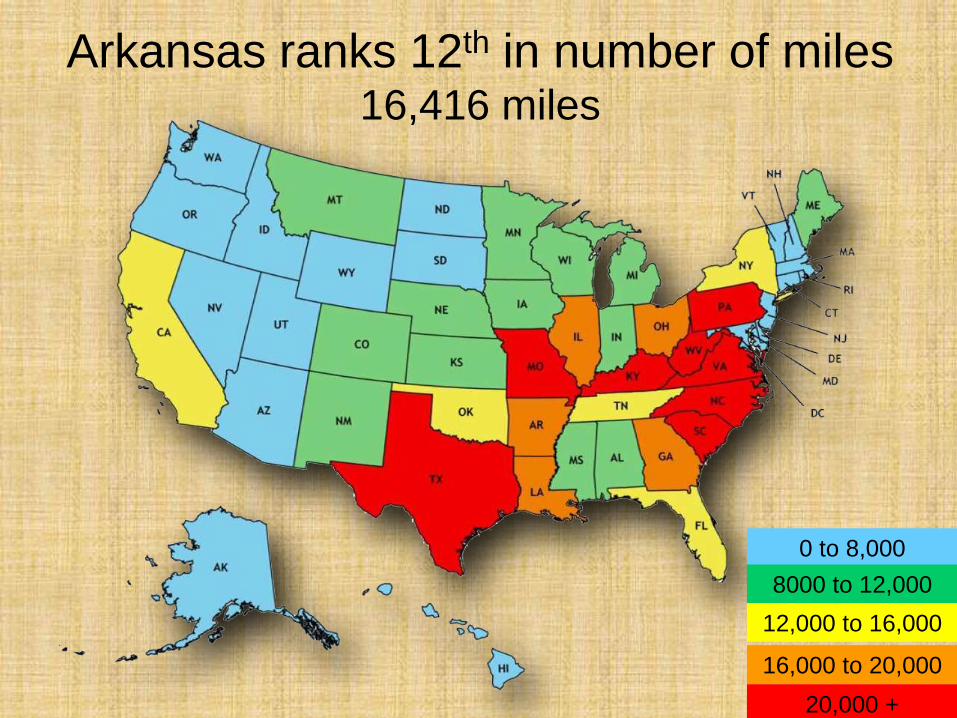
0 to 8,000
8000 to 12,000
12,000 to 16,000
16,000 to 20,000
20,000 +
Arkansas ranks 12th in number of miles 16,416 miles
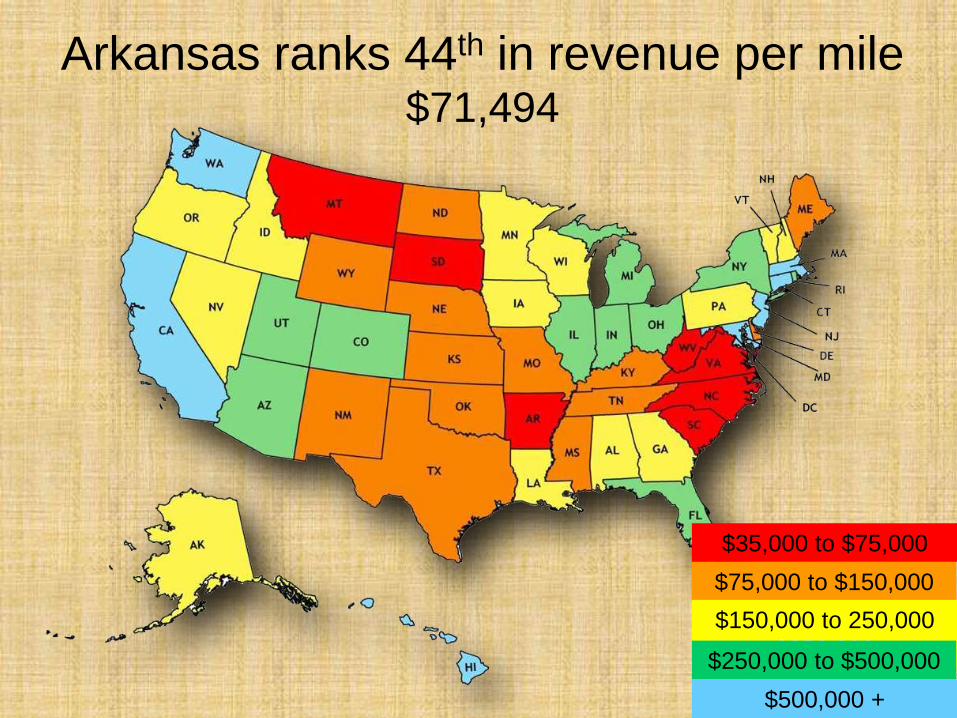
$35,000 to $75,000
$75,000 to $150,000
$150,000 to 250,000
$250,000 $250,000 to $500,000
$500,000 +
Arkansas ranks 44th in revenue per mile $71,494
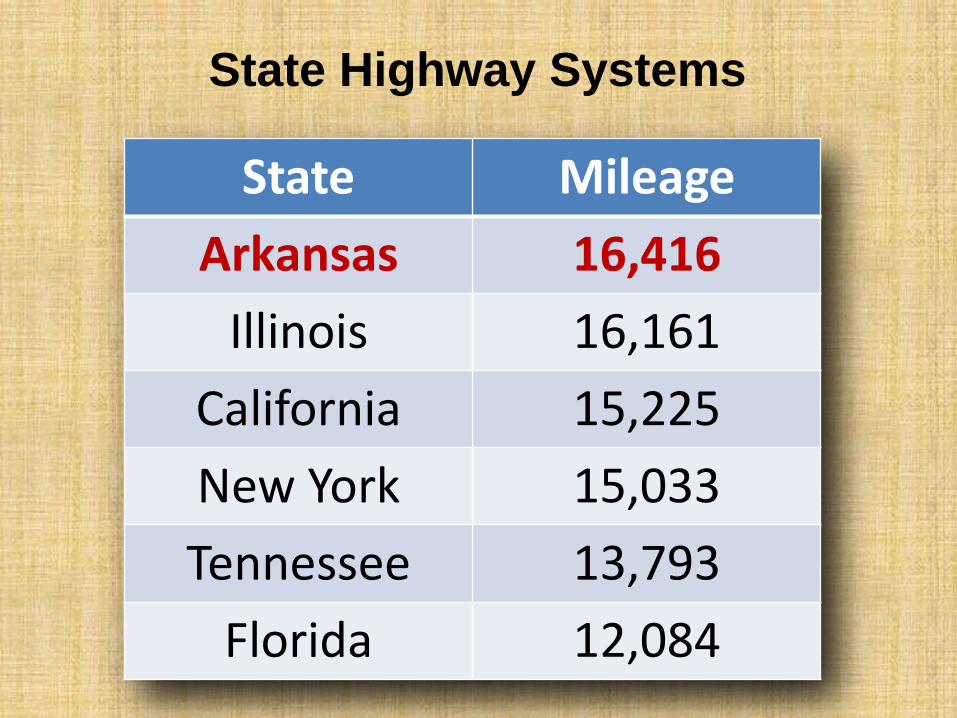
State Highway Systems
State Mileage
Arkansas 16,416
Illinois 16,161
California 15,225
New York 15,033
Tennessee 13,793
Florida 12,084
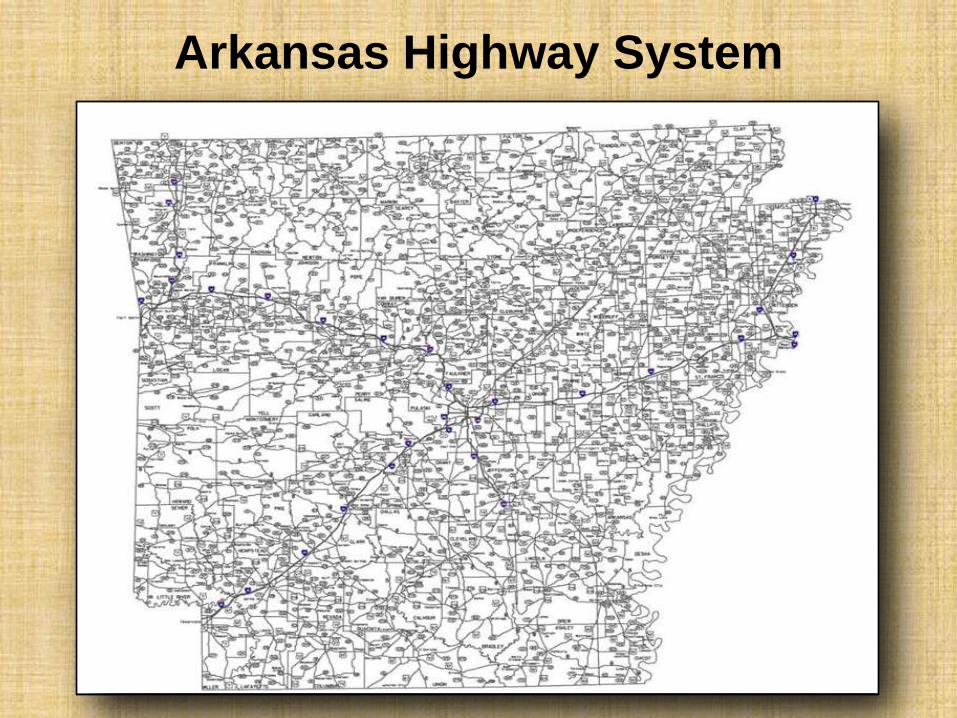
Arkansas Highway System
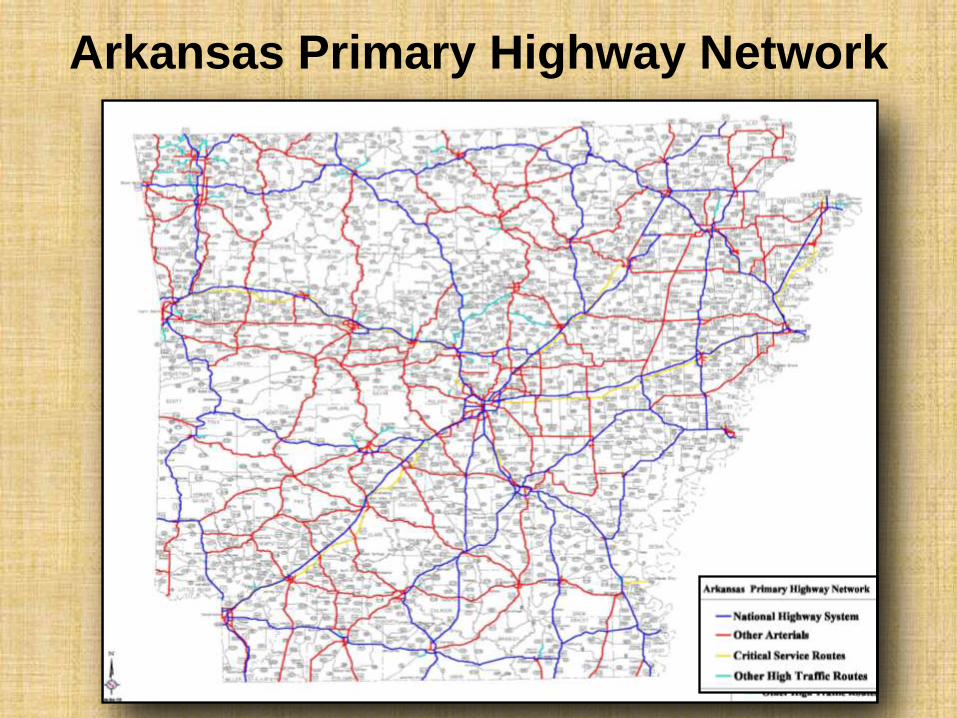
Arkansas Primary Highway Network
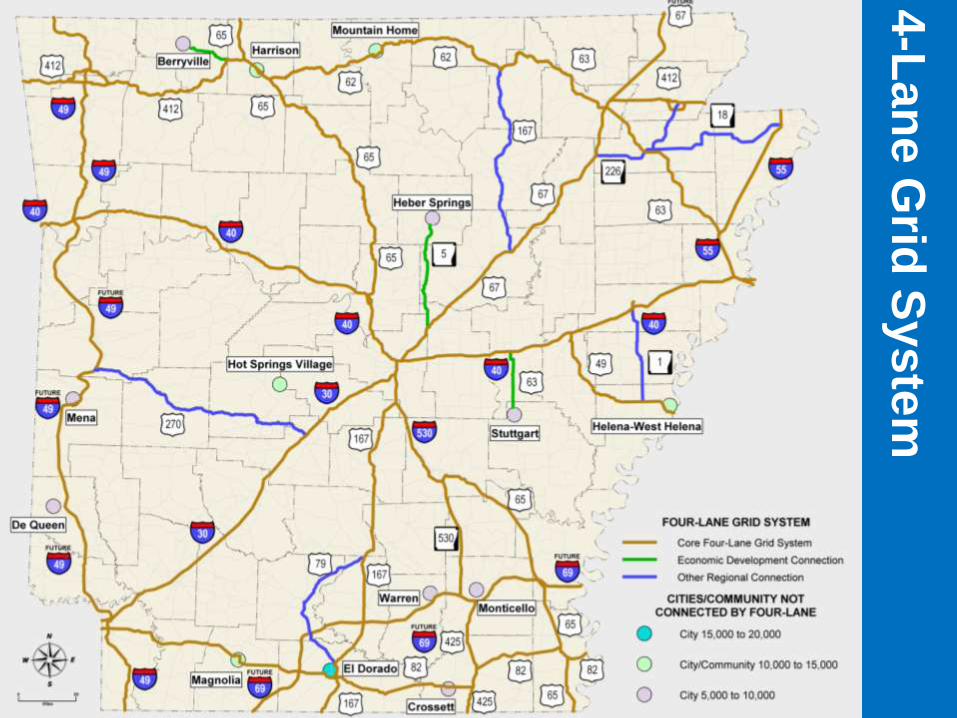
4-L
an
e G
rid S
yste
m
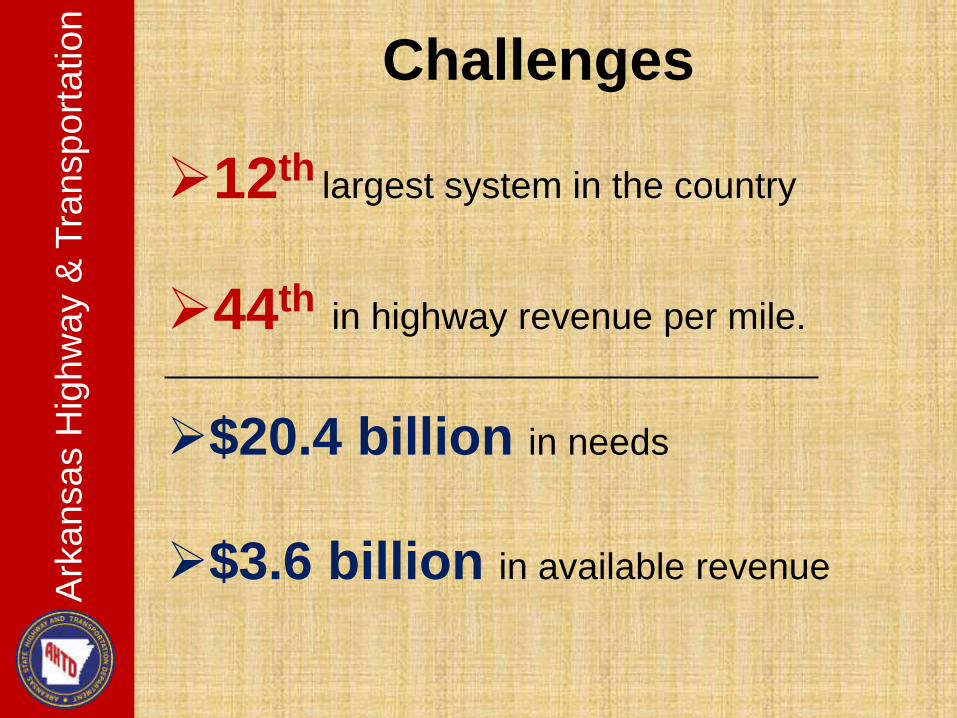
12th largest system in the country
44th in highway revenue per mile.
$20.4 billion in needs
$3.6 billion in available revenue
Challenges
Ark
ansas H
ighw
ay &
Tra
nspo
rta
tio
n
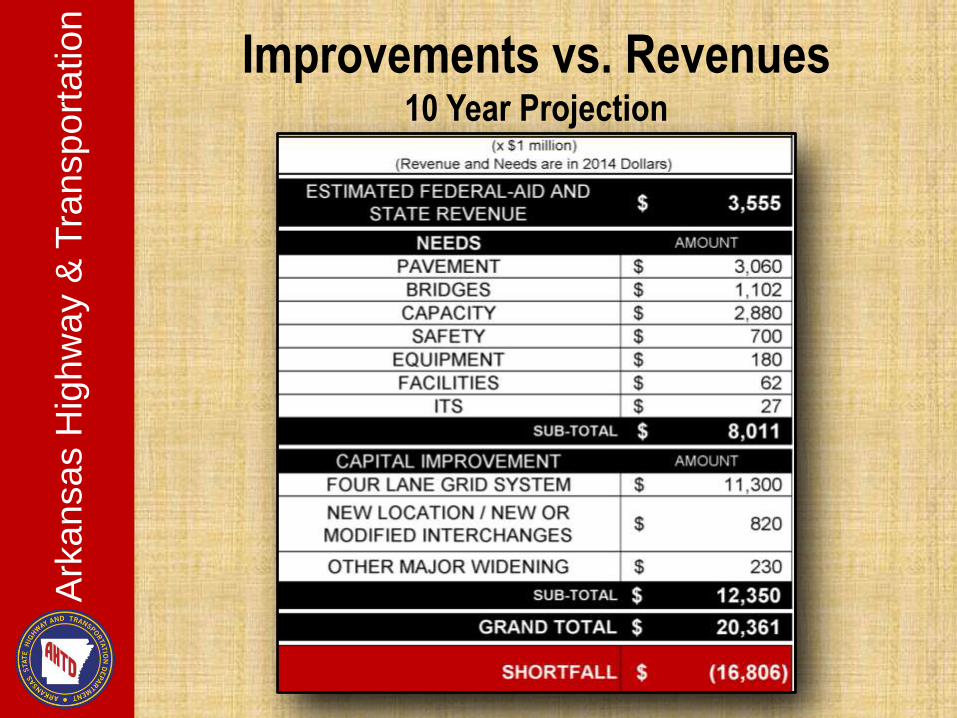
Improvements vs. Revenues 10 Year Projection
Ark
ansas H
ighw
ay &
Tra
nspo
rta
tio
n
Ark
ansas H
ighw
ay &
Tra
nspo
rta
tio
n
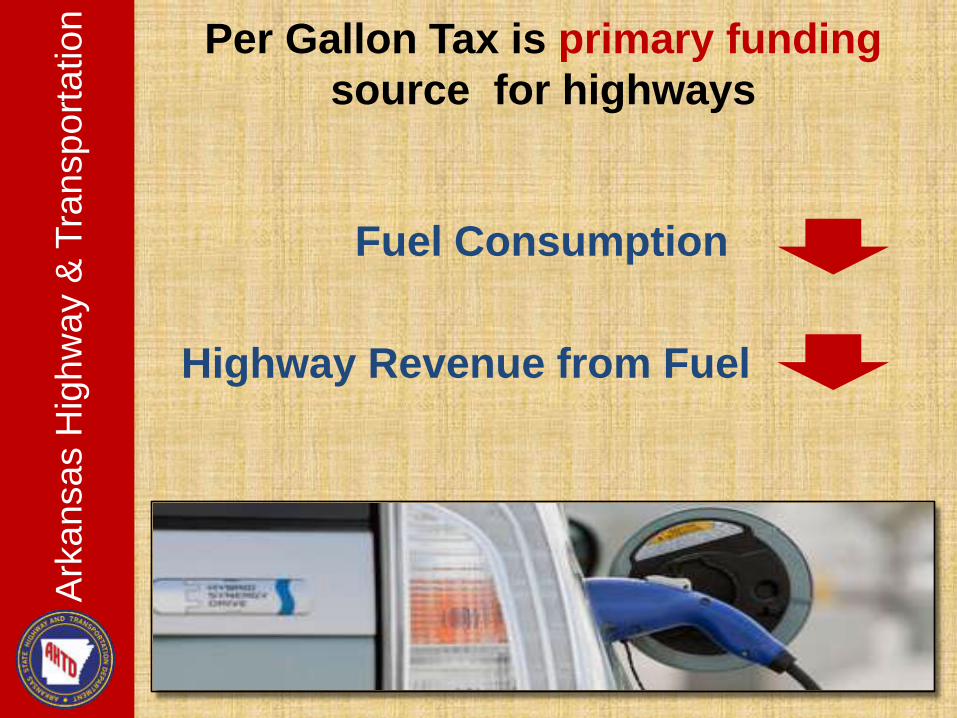
Per Gallon Tax is primary funding
source for highways
Fuel Consumption
Highway Revenue from Fuel
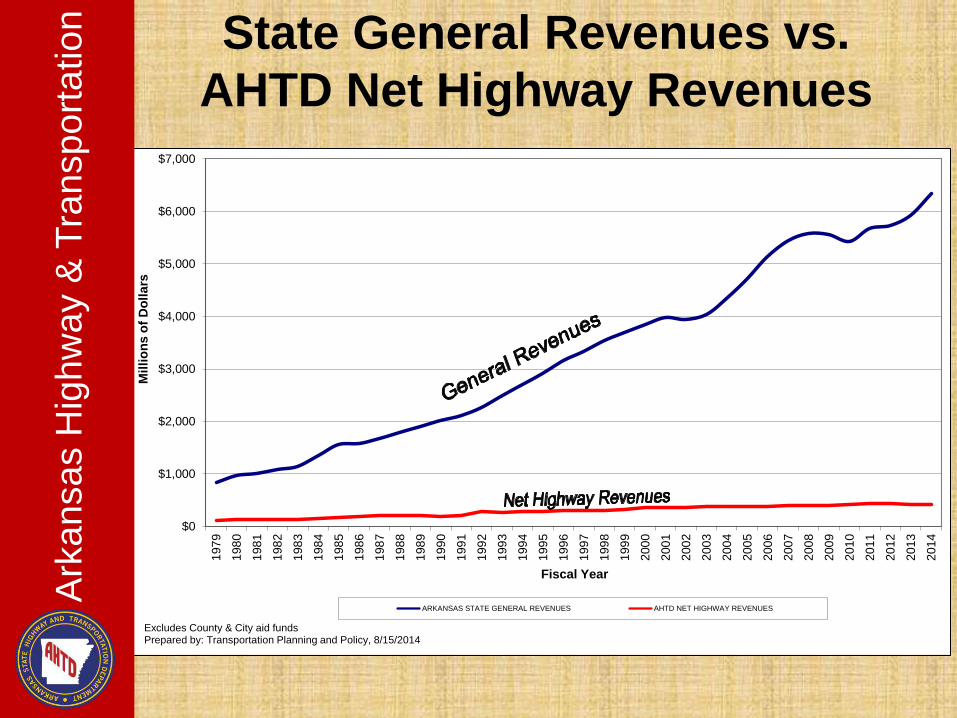
State General Revenues vs.
AHTD Net Highway Revenues
$0
$1,000
$2,000
$3,000
$4,000
$5,000
$6,000
$7,000
1979
1980
1981
1982
1983
1984
1985
198
6
1987
1988
1989
1990
1991
1992
1993
199
4
1995
1996
1997
1998
1999
2000
2001
200
2
2003
2004
2005
2006
2007
2008
2009
201
0
2011
2012
2013
2014
Mil
lio
ns
of
Do
lla
rs
Fiscal Year
Arkansas State General Revenuesvs
AHTD Net Highway Revenues
ARKANSAS STATE GENERAL REVENUES AHTD NET HIGHWAY REVENUES
Excludes County & City aid fundsPrepared by: Transportation Planning and Policy, 8/15/2014
Ark
ansas H
ighw
ay &
Tra
nspo
rta
tio
n
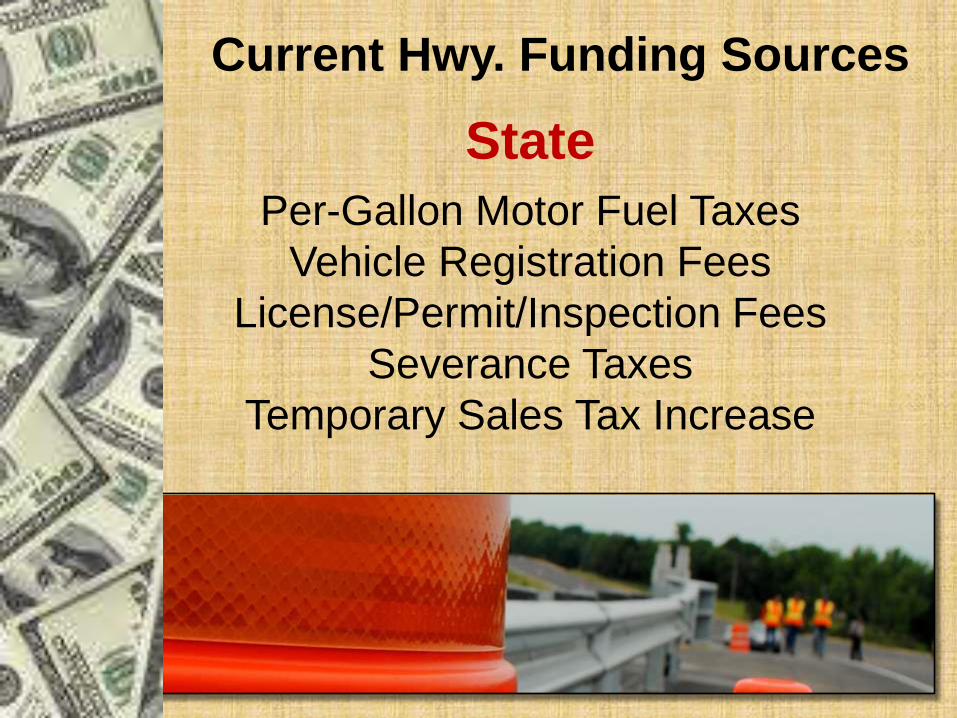
State
Per-Gallon Motor Fuel Taxes
Vehicle Registration Fees
License/Permit/Inspection Fees
Severance Taxes
Temporary Sales Tax Increase
Current Hwy. Funding Sources

Arkansas
Travel Trends 2007-2014
2007 2014 Difference
Gas & diesel Consumption
2.095 billion
1.980 billion
115 million
Gas & diesel Revenue
$454 million
$392 million
$62 million
Miles Traveled
32.4 billion
33.8 billion
1.4 billion
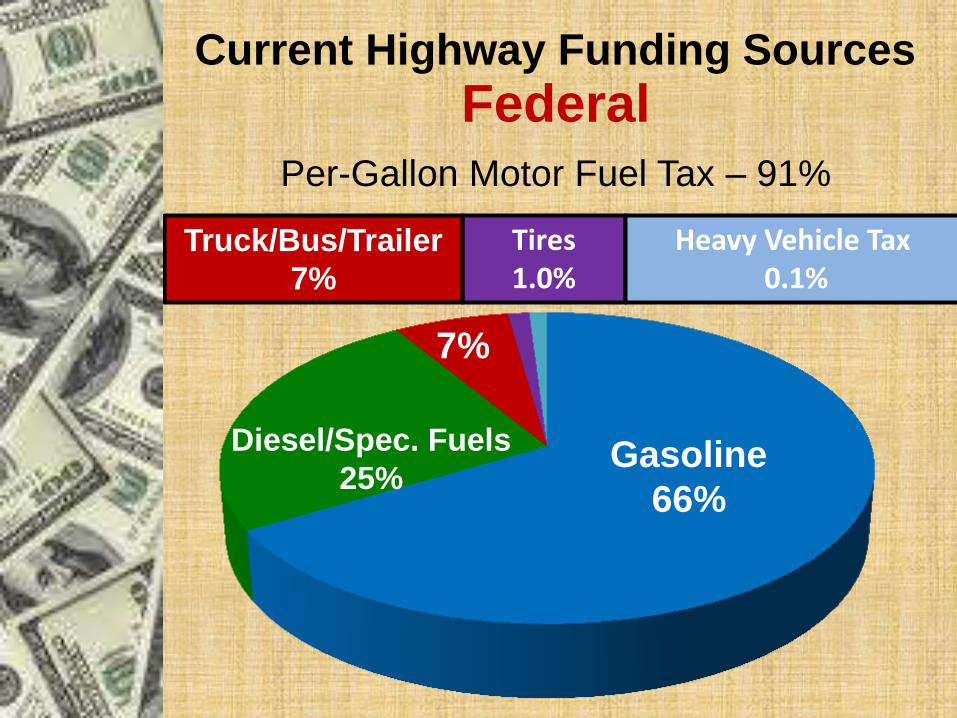
Current Highway Funding Sources
Tires 1.0%
Gasoline
66%
Diesel/Spec. Fuels
25%
7%
Truck/Bus/Trailer
7%
Heavy Vehicle Tax 0.1%
Federal
Per-Gallon Motor Fuel Tax – 91%
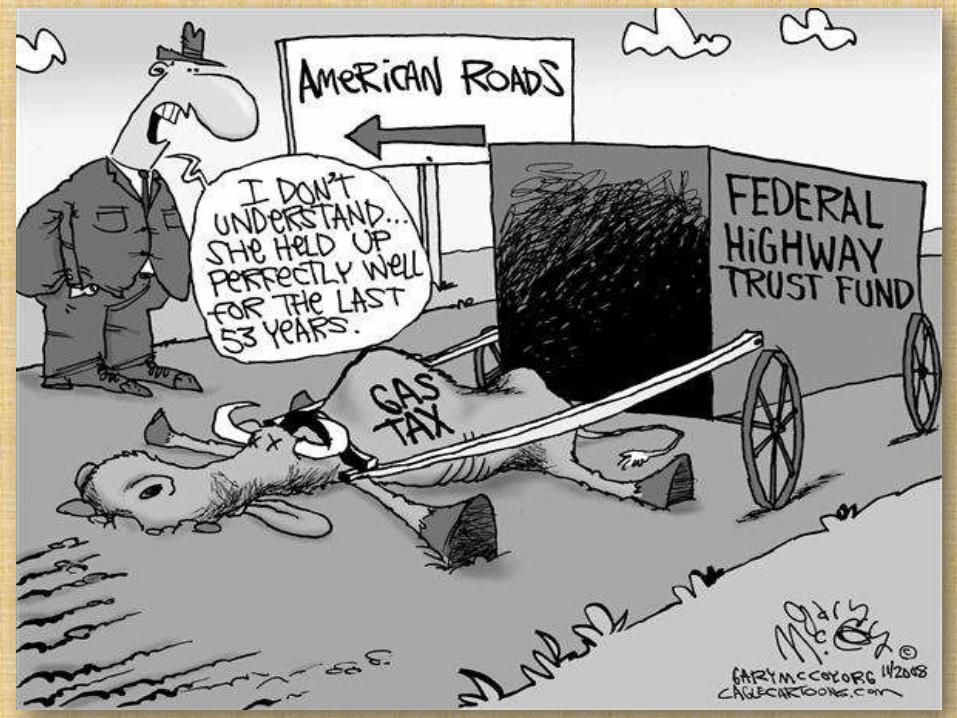
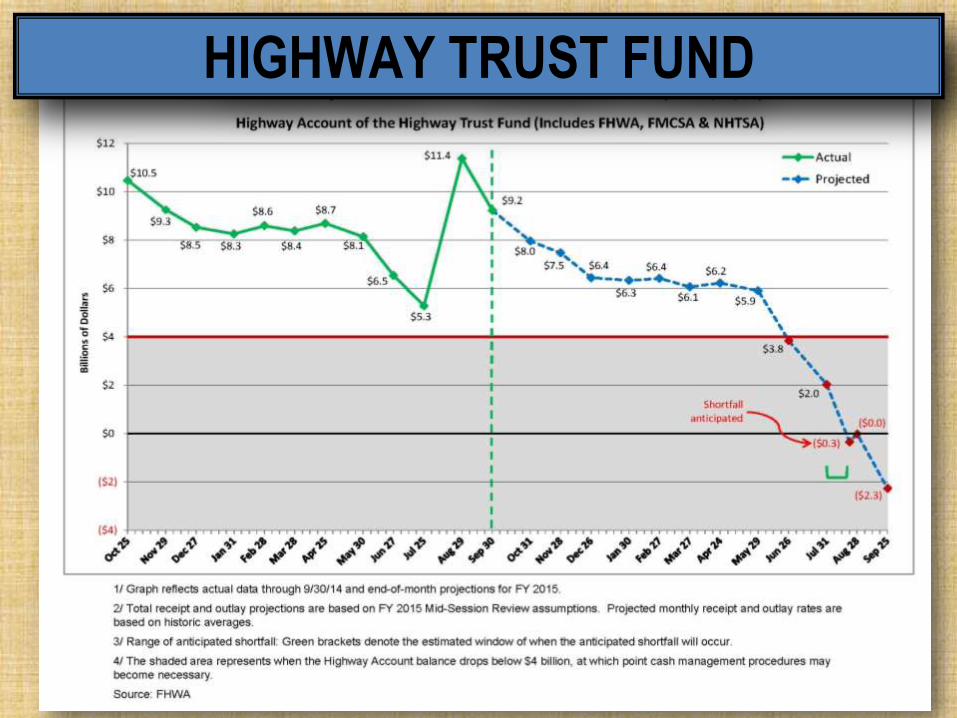
HIGHWAY TRUST FUND
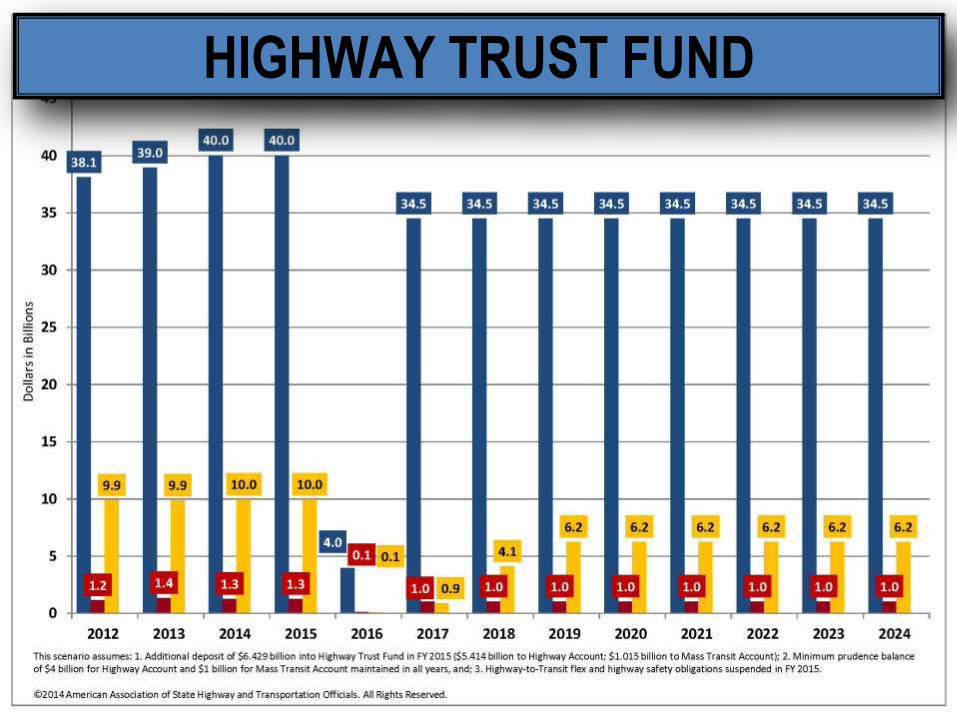
HIGHWAY TRUST FUND
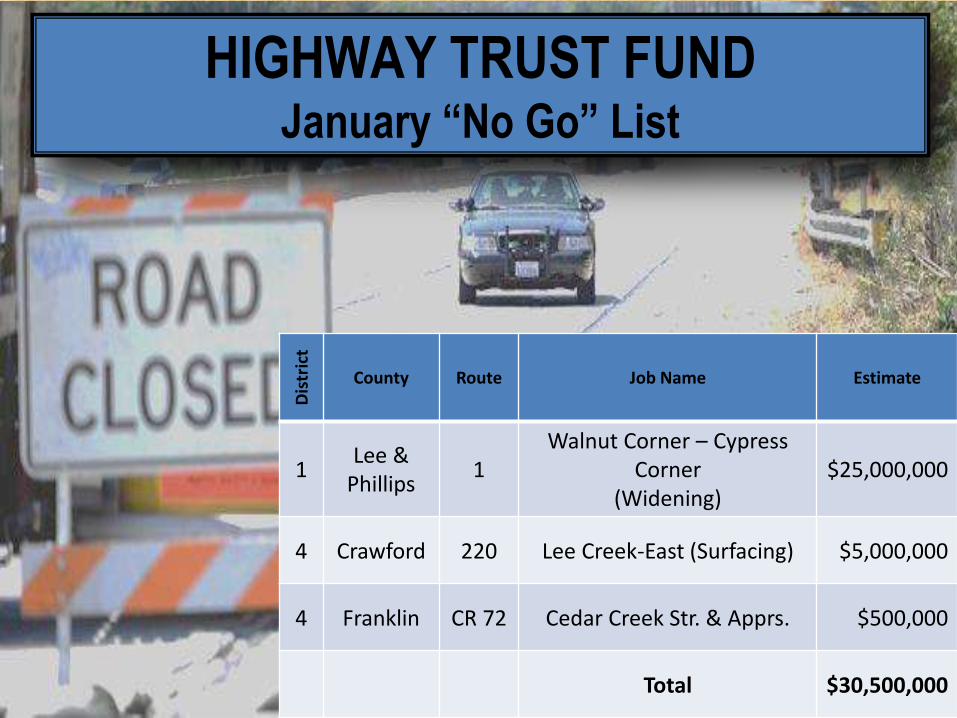
HIGHWAY TRUST FUND January “No Go” List
Dis
tric
t
County Route Job Name Estimate
1 Lee &
Phillips 1
Walnut Corner – Cypress Corner
(Widening) $25,000,000
4 Crawford 220 Lee Creek-East (Surfacing) $5,000,000
4 Franklin CR 72 Cedar Creek Str. & Apprs. $500,000
Total $30,500,000
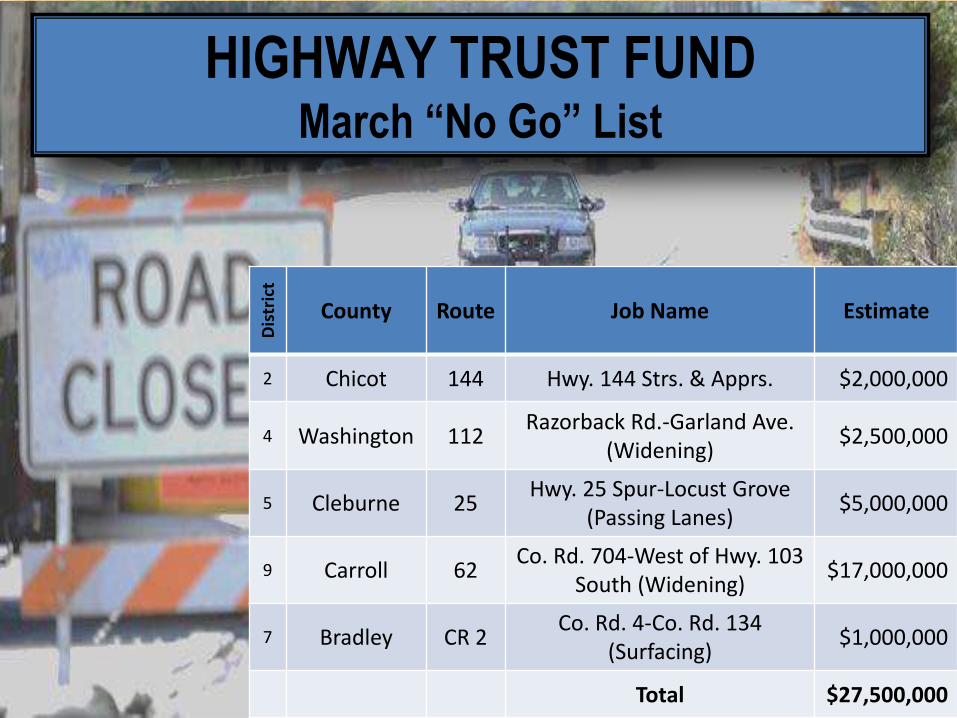
HIGHWAY TRUST FUND March “No Go” List
Dis
tric
t
County Route Job Name Estimate
2 Chicot 144 Hwy. 144 Strs. & Apprs. $2,000,000
4 Washington 112 Razorback Rd.-Garland Ave.
(Widening) $2,500,000
5 Cleburne 25 Hwy. 25 Spur-Locust Grove
(Passing Lanes) $5,000,000
9 Carroll 62 Co. Rd. 704-West of Hwy. 103
South (Widening) $17,000,000
7 Bradley CR 2 Co. Rd. 4-Co. Rd. 134
(Surfacing) $1,000,000
Total $27,500,000
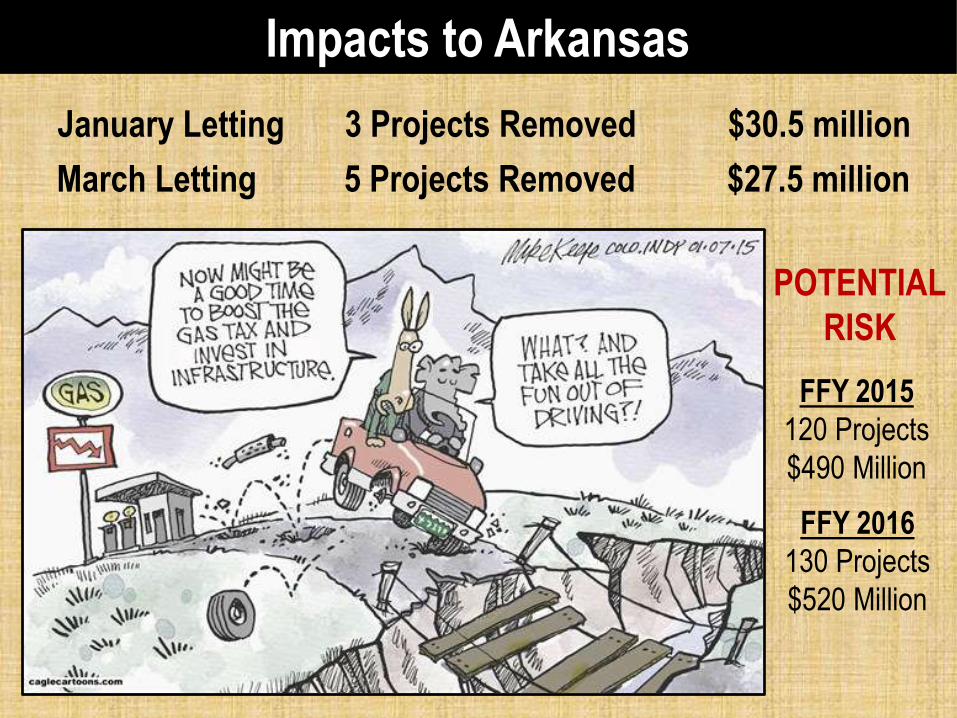
Impacts to Arkansas
January Letting 3 Projects Removed $30.5 million
March Letting 5 Projects Removed $27.5 million
FFY 2015
120 Projects
$490 Million
FFY 2016
130 Projects
$520 Million
POTENTIAL
RISK
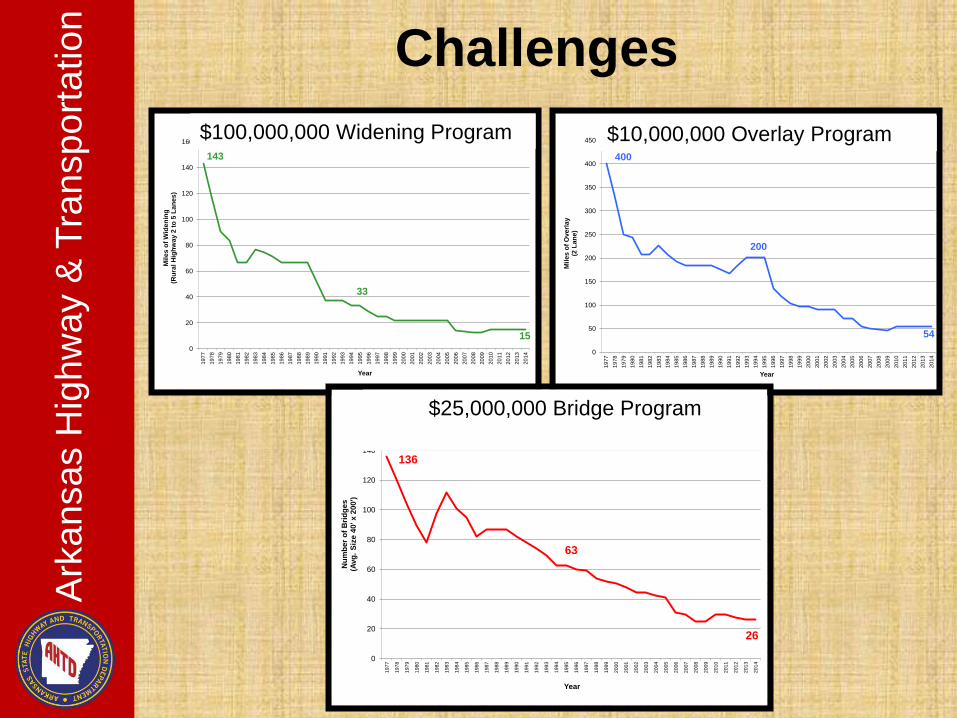
Challenges
0
20
40
60
80
100
120
140
160
19
77
19
78
19
79
19
80
19
81
19
82
19
83
19
84
19
85
19
86
19
87
19
88
19
89
19
90
19
91
19
92
19
93
19
94
19
95
19
96
19
97
19
98
19
99
20
00
20
01
20
02
20
03
20
04
20
05
20
06
20
07
20
08
20
09
20
10
20
11
20
12
20
13
20
14
Mil
es
of
Wid
en
ing
(Ru
ral
Hig
hw
ay 2
to
5 L
an
es
)
Year
$100,000,000 Widening Program
143
33
15
0
50
100
150
200
250
300
350
400
450
19
77
19
78
19
79
19
80
19
81
19
82
19
83
19
84
19
85
19
86
19
87
19
88
19
89
19
90
19
91
19
92
19
93
19
94
19
95
19
96
19
97
19
98
19
99
20
00
20
01
20
02
20
03
20
04
20
05
20
06
20
07
20
08
20
09
20
10
20
11
20
12
20
13
20
14
Mil
es
of
Ove
rla
y(2
La
ne
)
Year
$10,000,000 Overlay Program
400
200
54
$100,000,000 Widening Program $10,000,000 Overlay Program
0
20
40
60
80
100
120
140
160
1977
1978
1979
1980
1981
1982
1983
1984
1985
1986
1987
1988
1989
1990
1991
1992
1993
1994
1995
1996
1997
1998
1999
2000
2001
2002
2003
2004
2005
2006
2007
2008
2009
2010
2011
2012
2013
2014
Nu
mb
er
of
Bri
dg
es
(Avg
. S
ize
40
' x
20
0')
Year
$25,000,000 Bridge Program
136
63
26
$25,000,000 Bridge Program
Ark
ansas H
ighw
ay &
Tra
nspo
rta
tio
n
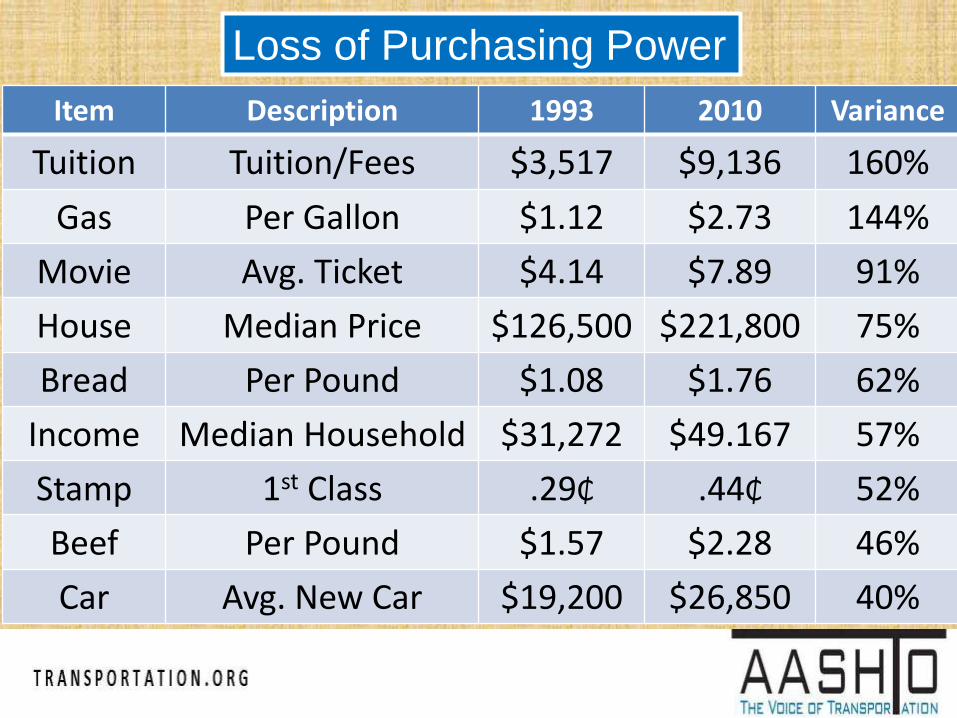
Item Description 1993 2010 Variance
Tuition Tuition/Fees $3,517 $9,136 160%
Gas Per Gallon $1.12 $2.73 144%
Movie Avg. Ticket $4.14 $7.89 91%
House Median Price $126,500 $221,800 75%
Bread Per Pound $1.08 $1.76 62%
Income Median Household $31,272 $49.167 57%
Stamp 1st Class .29₵ .44₵ 52%
Beef Per Pound $1.57 $2.28 46%
Car Avg. New Car $19,200 $26,850 40%
Loss of Purchasing Power
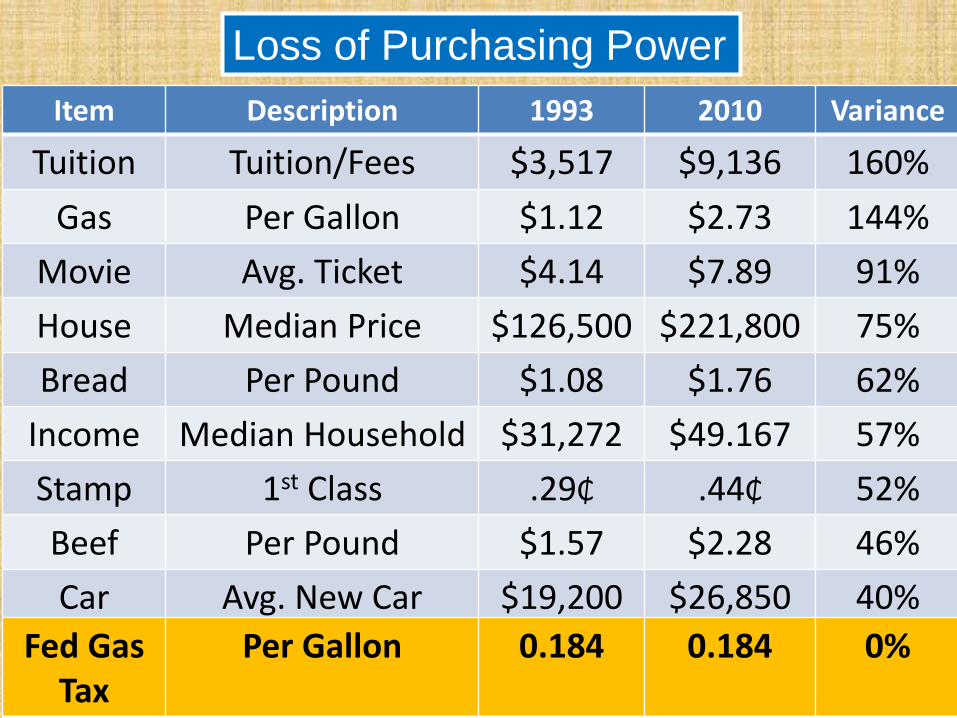
Fed Gas Tax
Per Gallon 0.184 0.184 0%
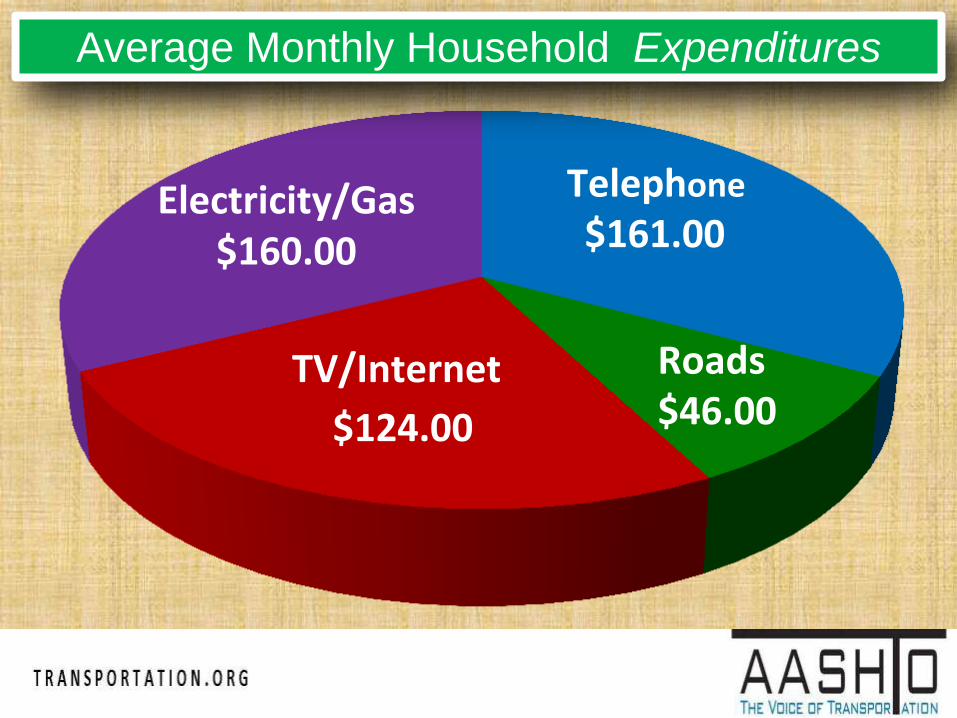
Electricity/Gas $160.00
TV/Internet Roads
Telephone
$161.00
$124.00 $46.00
Average Monthly Household Expenditures
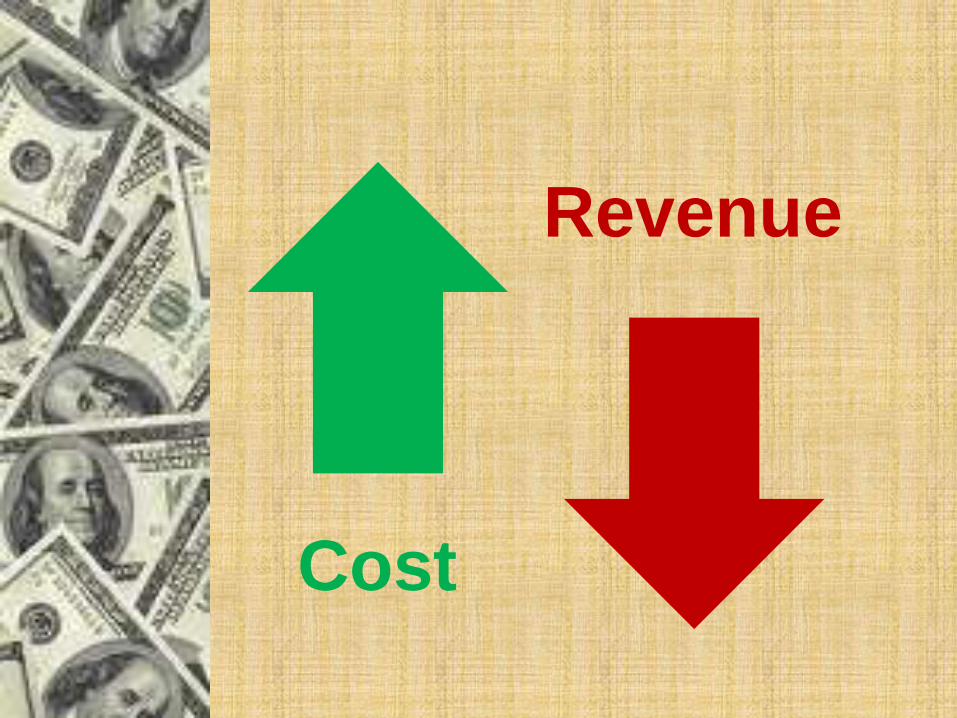
Cost
Revenue
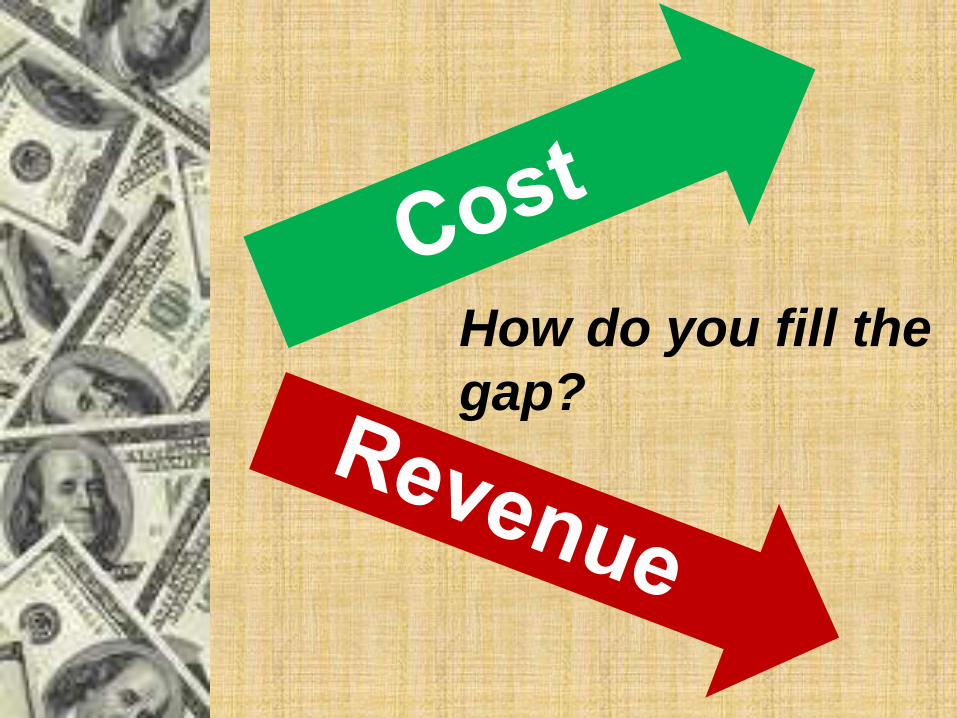
How do you fill the
gap?
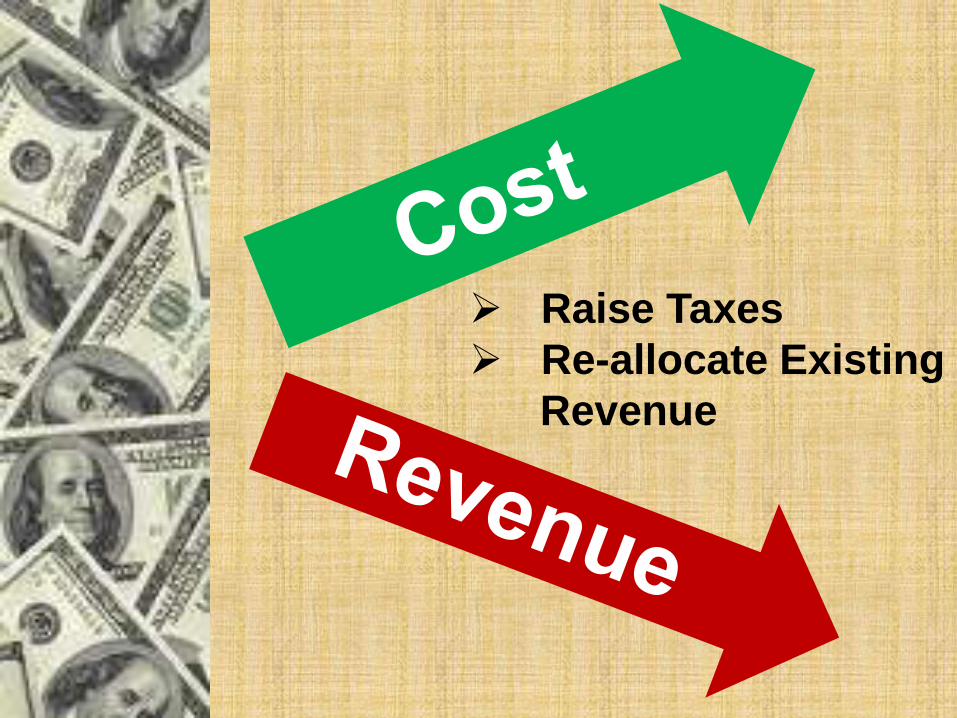
Raise Taxes
Re-allocate Existing
Revenue
Blu
e R
ibb
on
Co
mm
itte
e
“….70% of our highway, road and
street funding comes from a
consumption based tax, while it is a
national goal to reduce consumption.
The trend… is simply a losing
proposition.
We’re moving backward.”
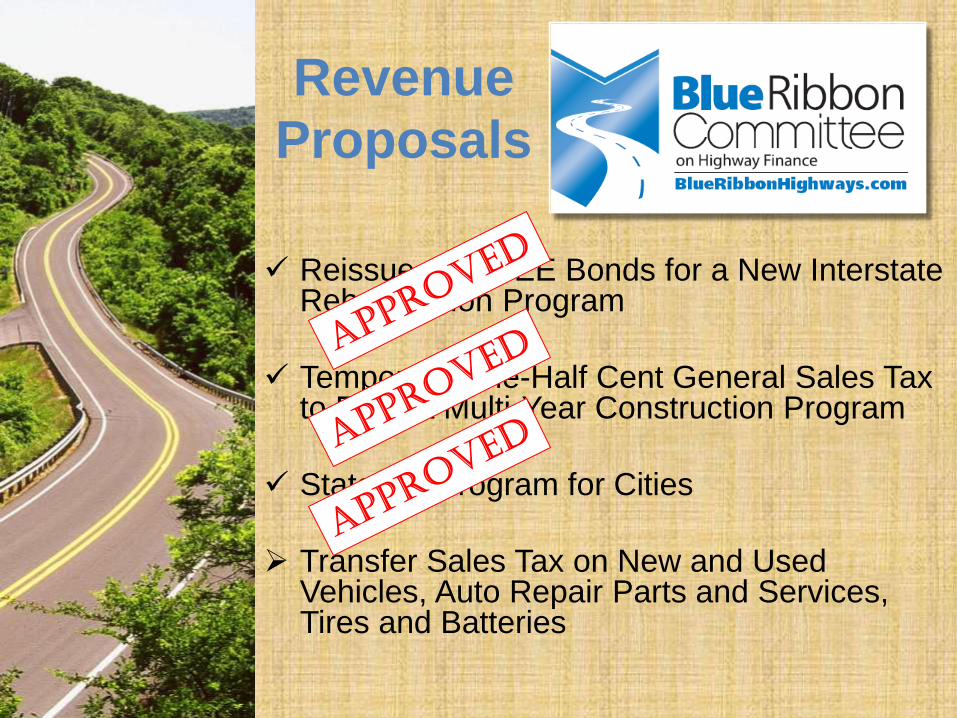
Reissue GARVEE Bonds for a New Interstate Rehabilitation Program
Temporary One-Half Cent General Sales Tax to Fund a Multi-Year Construction Program
State Aid Program for Cities
Transfer Sales Tax on New and Used Vehicles, Auto Repair Parts and Services, Tires and Batteries
Revenue
Proposals
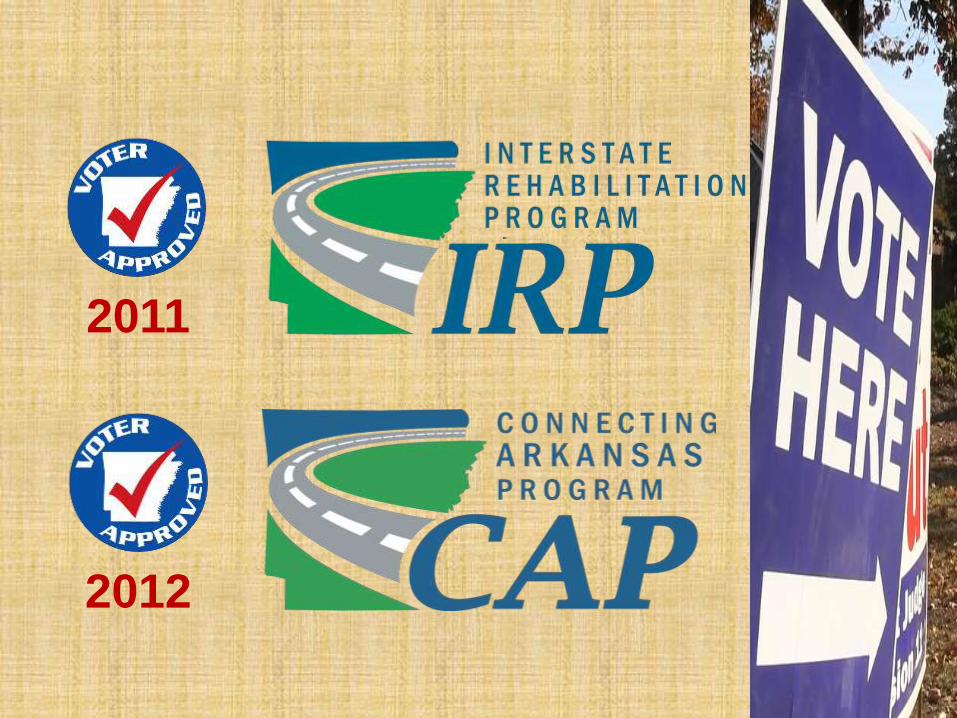
2011
2012
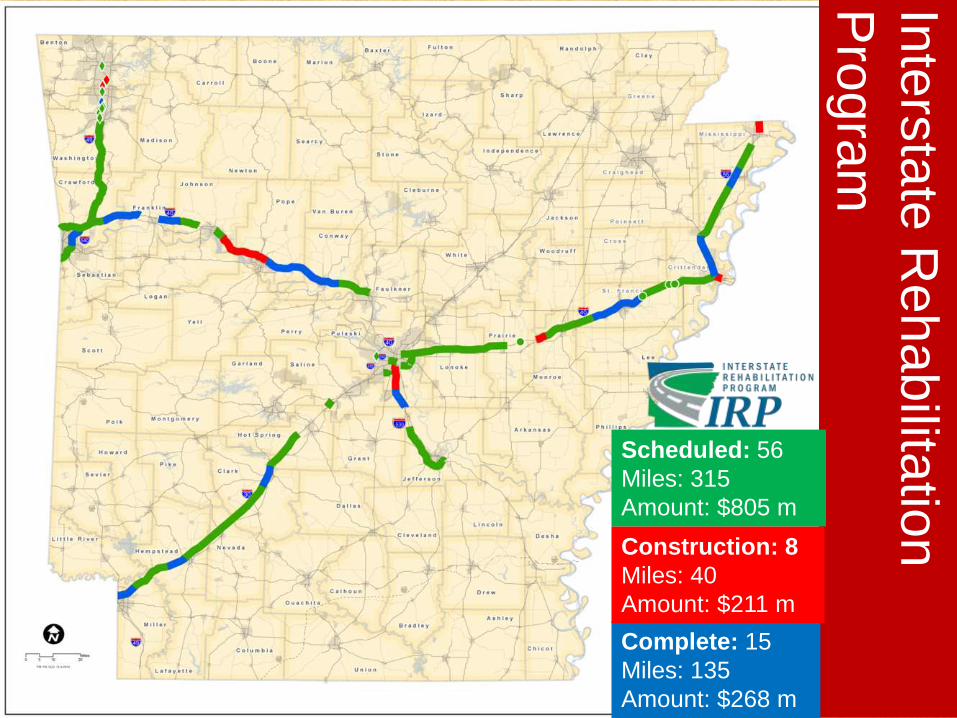
Inte
rsta
te R
ehabilita
tion
Pro
gra
m
Scheduled
Under Const.
Complete Complete: 15
Miles: 135
Amount: $268 m
Construction: 8
Miles: 40
Amount: $211 m
Scheduled: 56
Miles: 315
Amount: $805 m
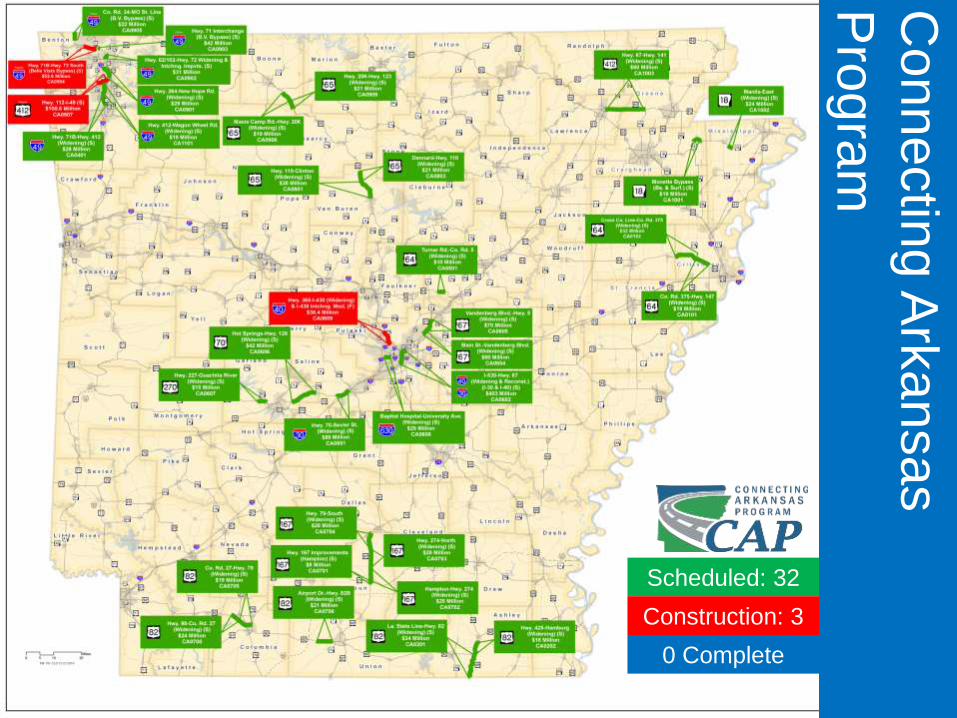
Connectin
g A
rkansas
Pro
gra
m
Scheduled: 32
Construction: 3
0 Complete
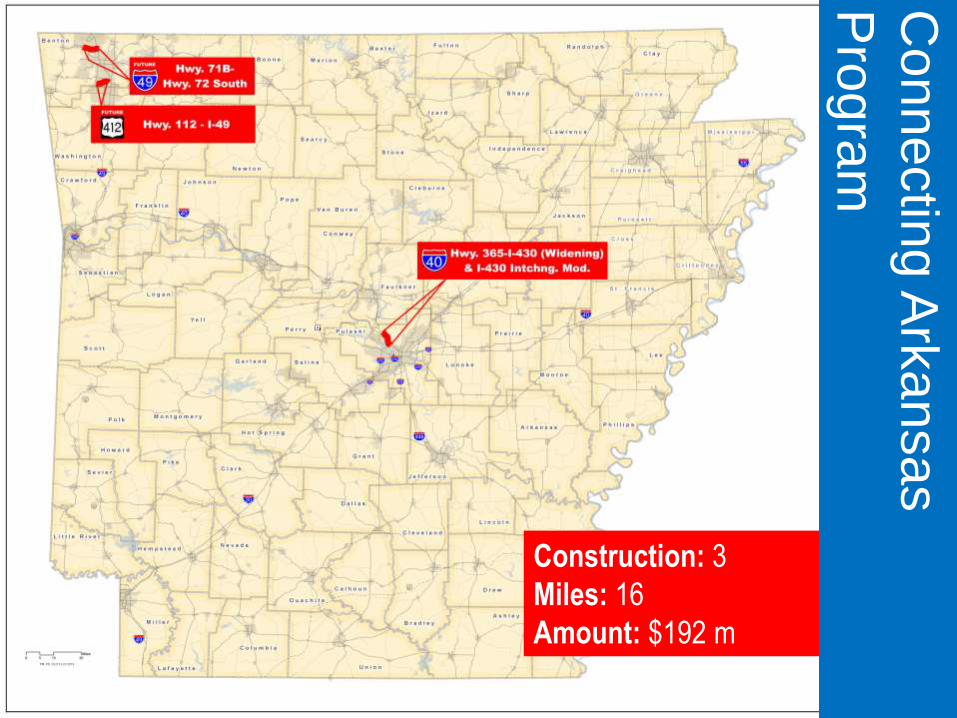
Construction: 3
Miles: 16
Amount: $192 m
Connectin
g A
rkansas
Pro
gra
m
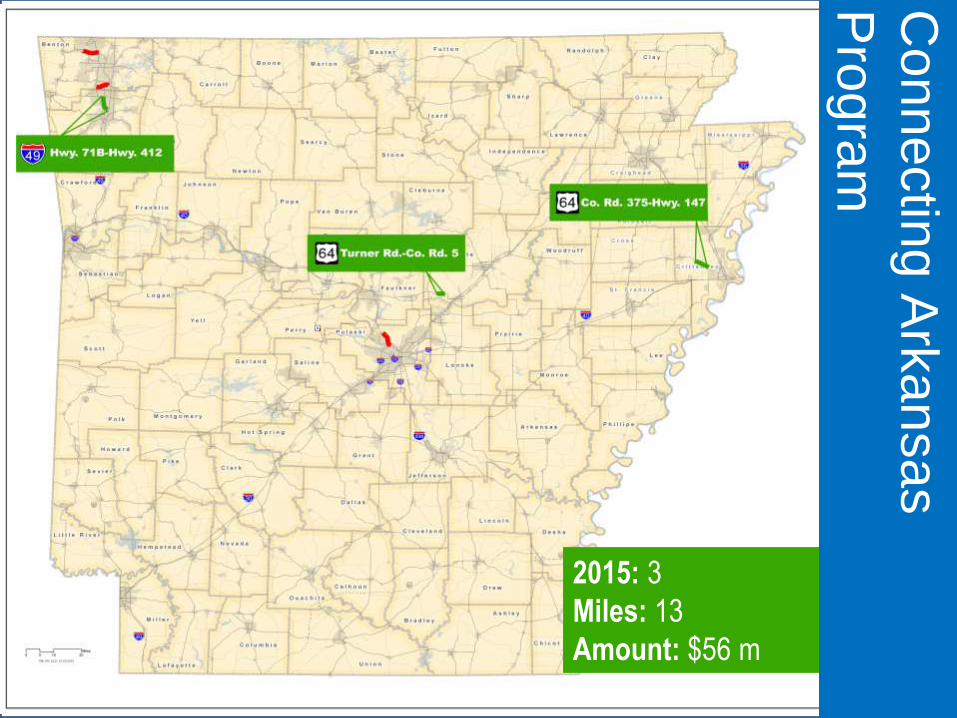
2015: 3
Miles: 13
Amount: $56 m
Connectin
g A
rkansas
Pro
gra
m
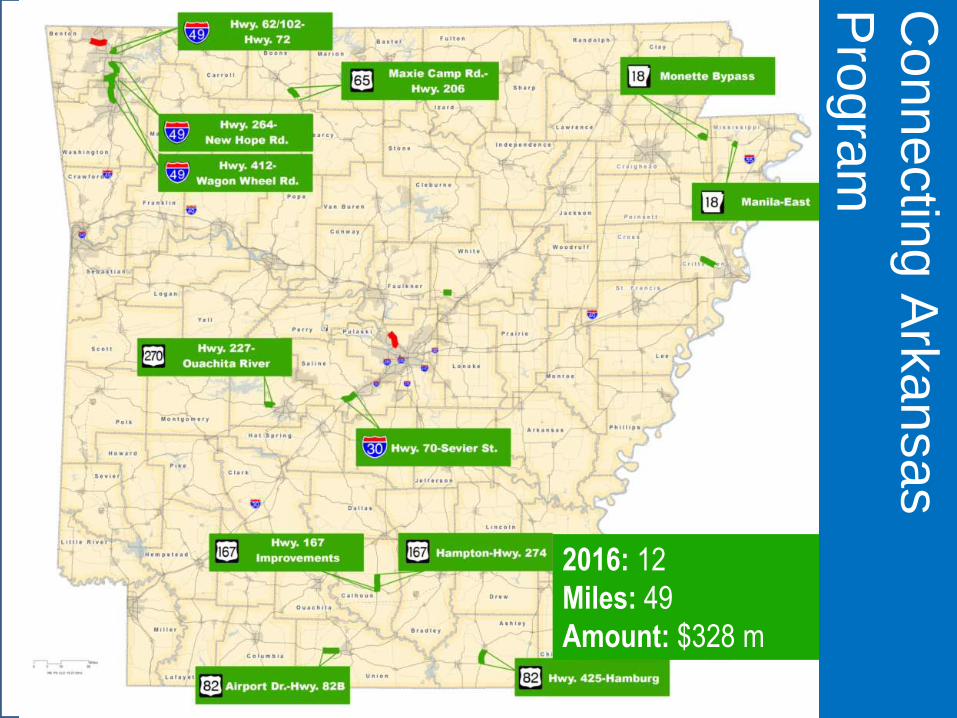
2016: 12
Miles: 49
Amount: $328 m
Connectin
g A
rkansas
Pro
gra
m
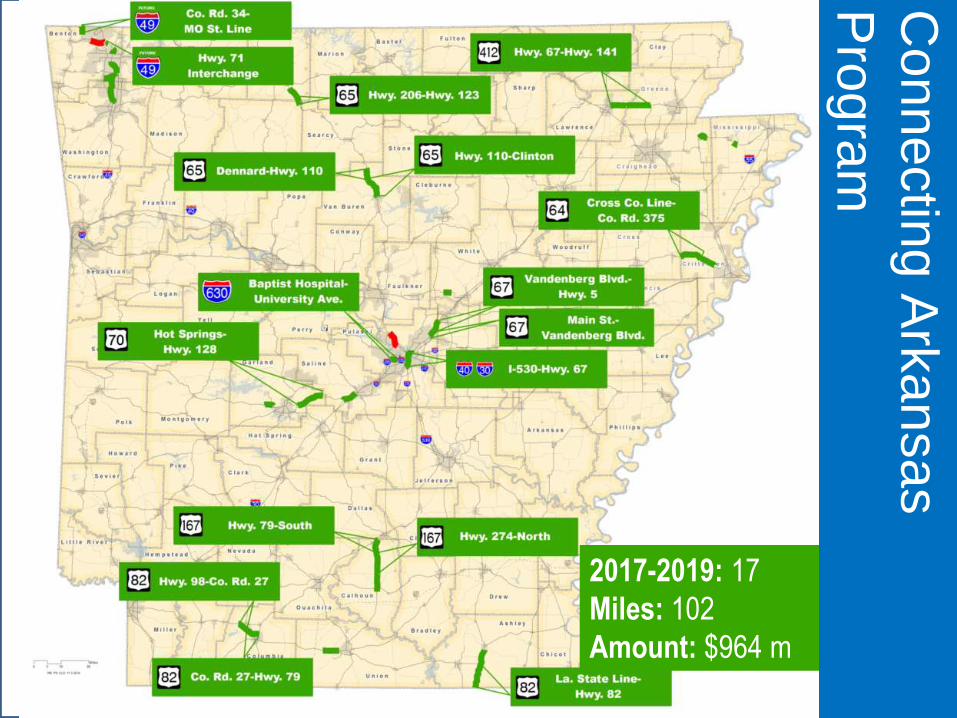
2017-2019: 17
Miles: 102
Amount: $964 m
Connectin
g A
rkansas
Pro
gra
m
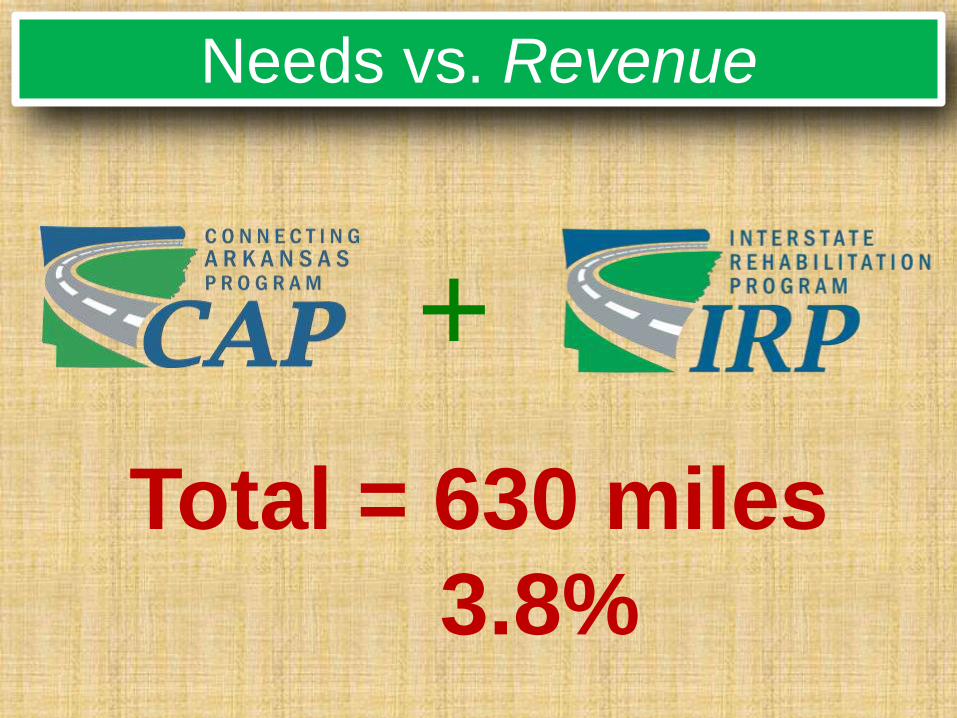
Needs vs. Revenue
Total = 630 miles
3.8%
+
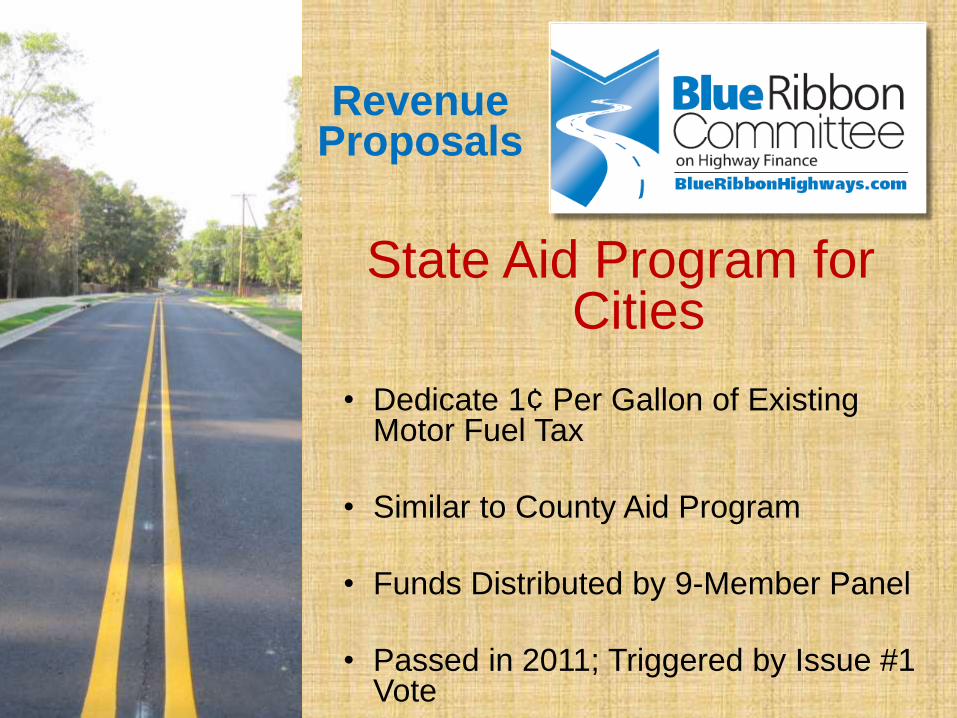
State Aid Program for Cities
• Dedicate 1¢ Per Gallon of Existing Motor Fuel Tax
• Similar to County Aid Program
• Funds Distributed by 9-Member Panel
• Passed in 2011; Triggered by Issue #1 Vote
Revenue Proposals
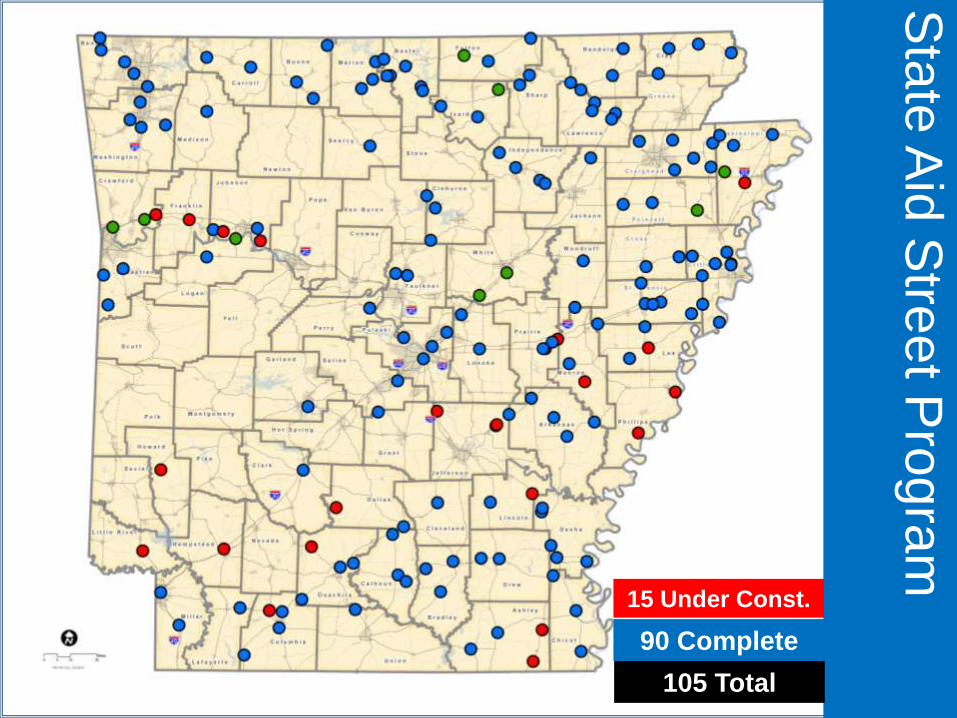
Sta
te A
id S
tree
t Pro
gra
m
15 Under Const.
90 Complete
105 Total
48
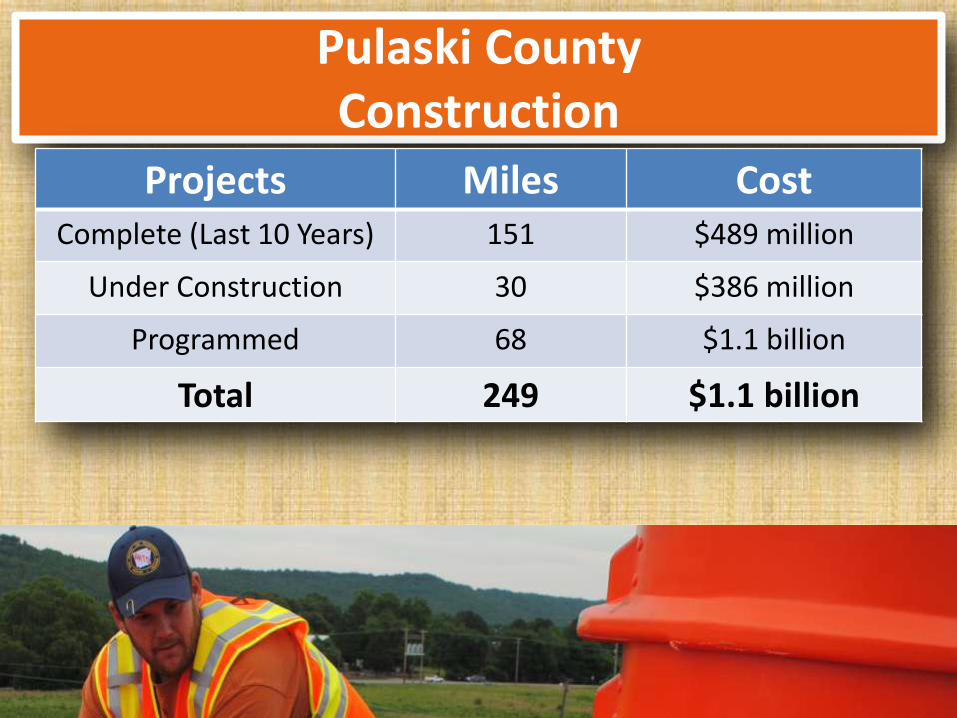
Pulaski County Construction
Projects Miles Cost Complete (Last 10 Years) 151 $489 million
Under Construction 30 $386 million
Programmed 68 $1.1 billion
Total 249 $1.1 billion
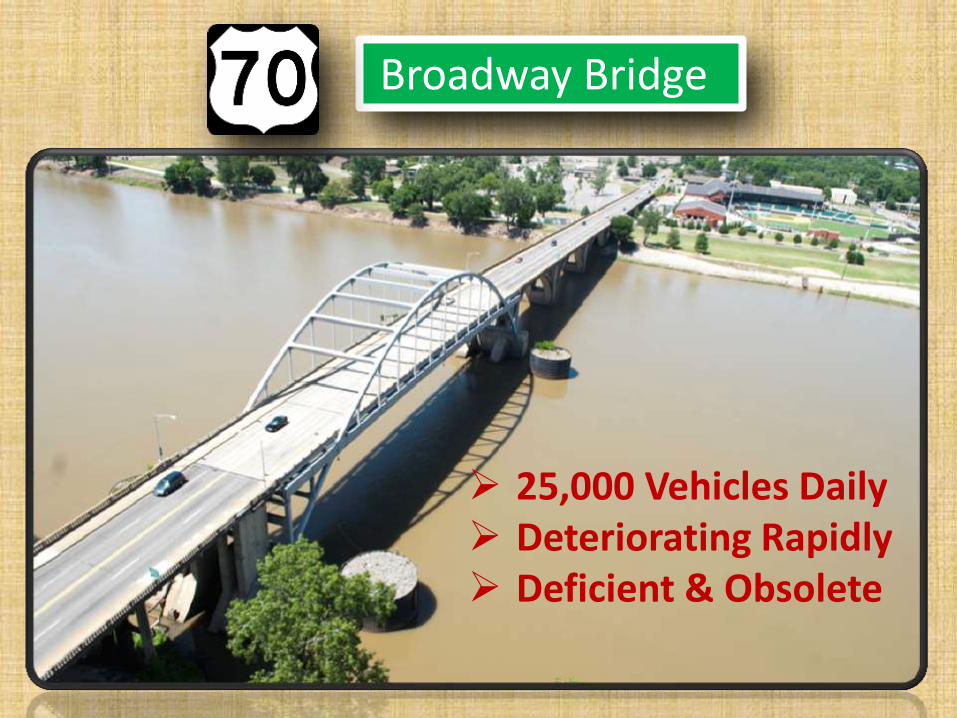
Broadway Bridge
25,000 Vehicles Daily Deteriorating Rapidly Deficient & Obsolete
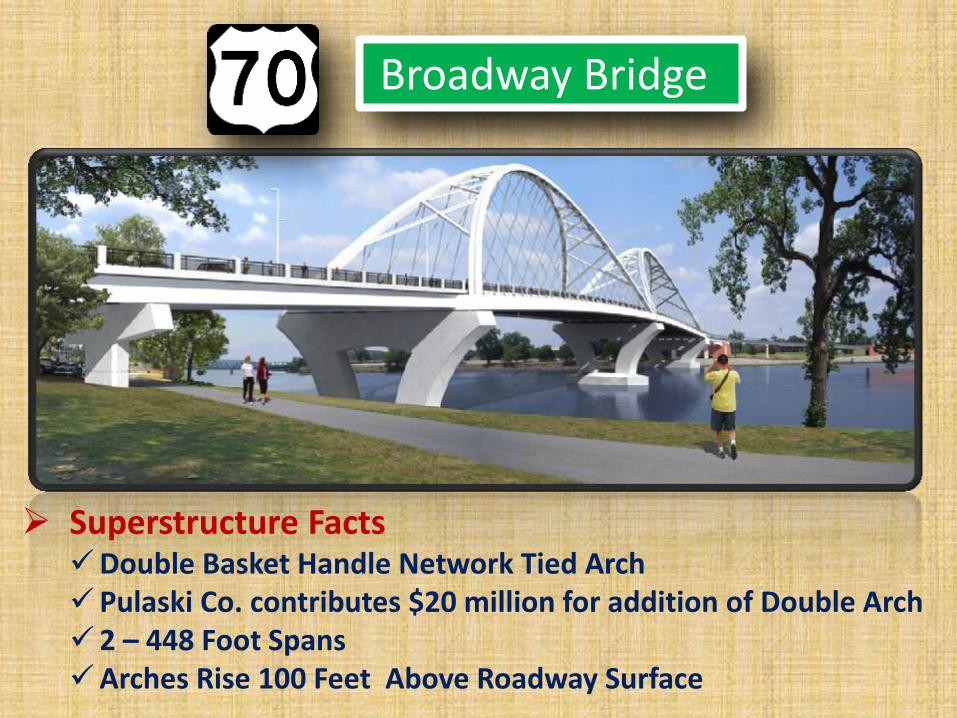
Superstructure Facts Double Basket Handle Network Tied Arch Pulaski Co. contributes $20 million for addition of Double Arch 2 – 448 Foot Spans Arches Rise 100 Feet Above Roadway Surface
Broadway Bridge
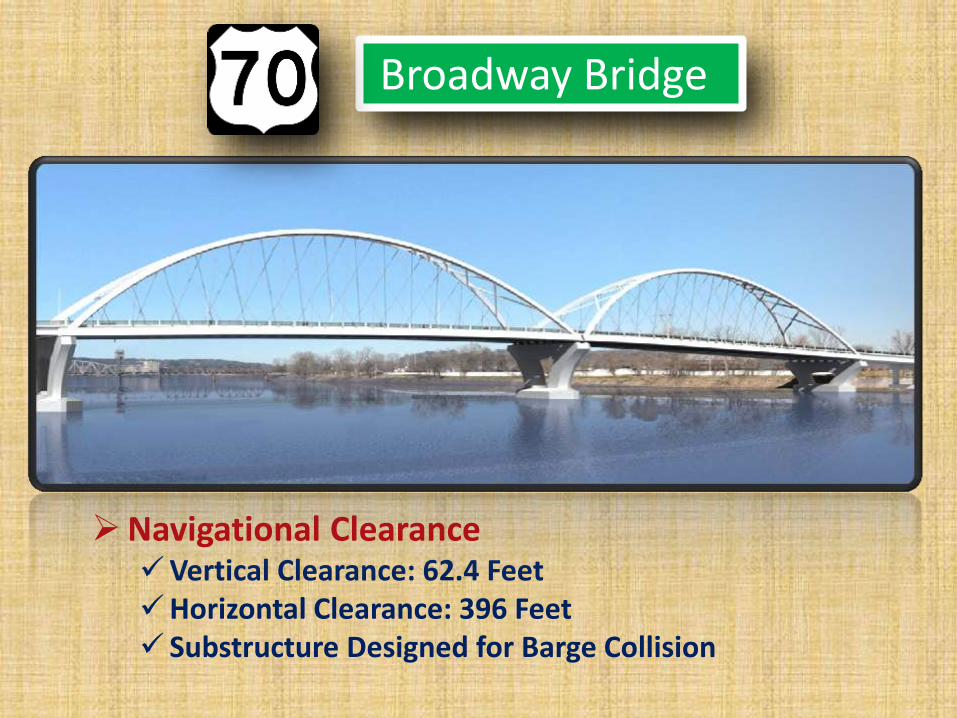
Navigational Clearance Vertical Clearance: 62.4 Feet Horizontal Clearance: 396 Feet Substructure Designed for Barge Collision
Broadway Bridge
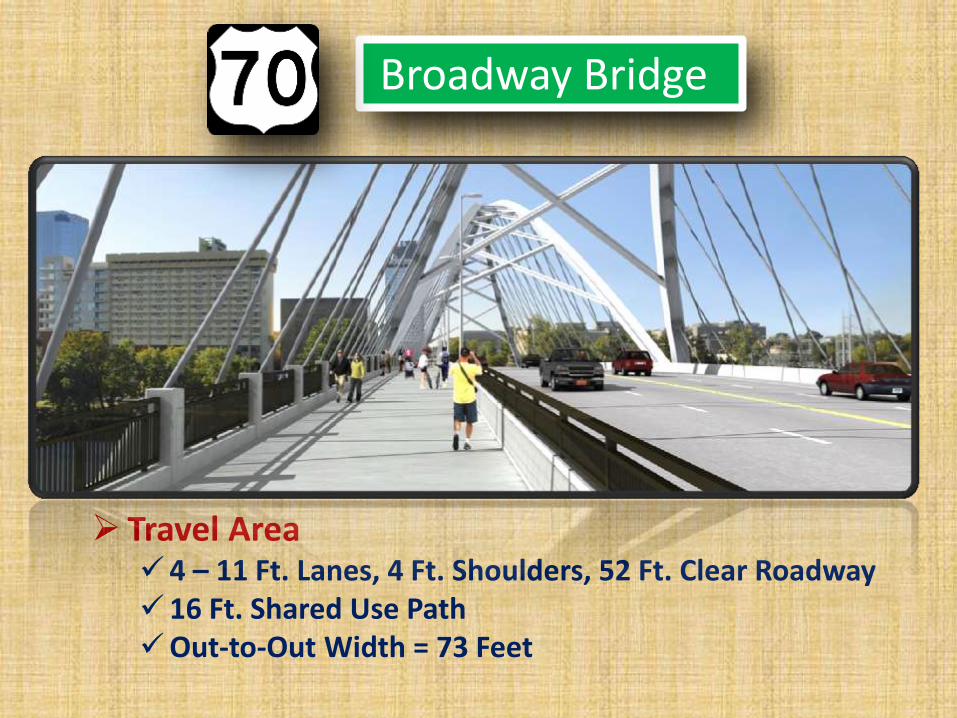
Travel Area 4 – 11 Ft. Lanes, 4 Ft. Shoulders, 52 Ft. Clear Roadway 16 Ft. Shared Use Path Out-to-Out Width = 73 Feet
Broadway Bridge
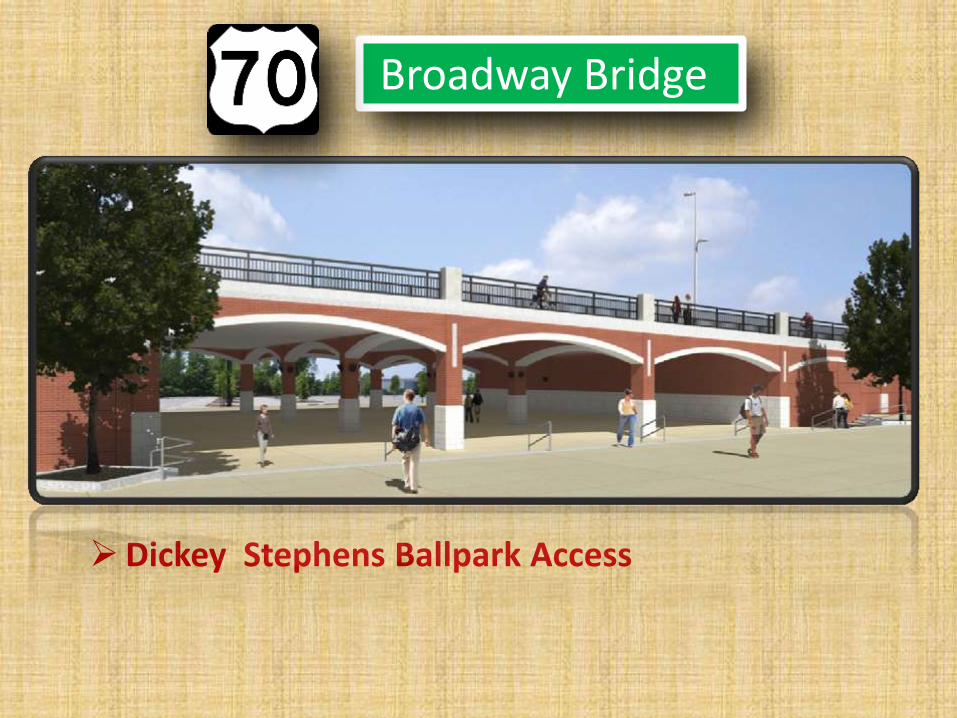
Dickey Stephens Ballpark Access
Broadway Bridge
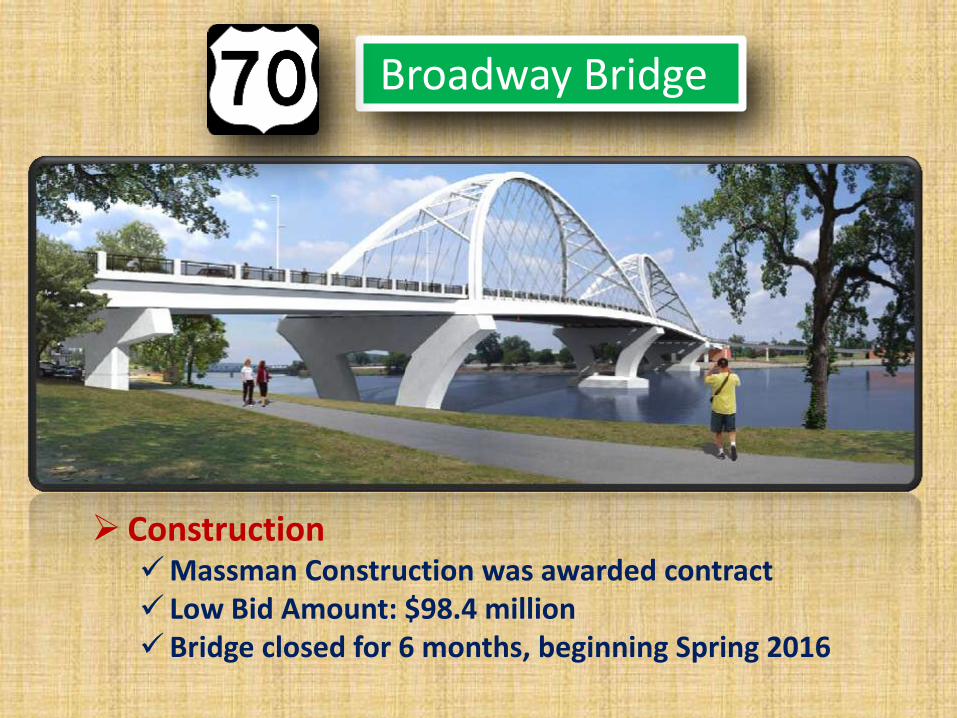
Construction Massman Construction was awarded contract Low Bid Amount: $98.4 million Bridge closed for 6 months, beginning Spring 2016
Broadway Bridge
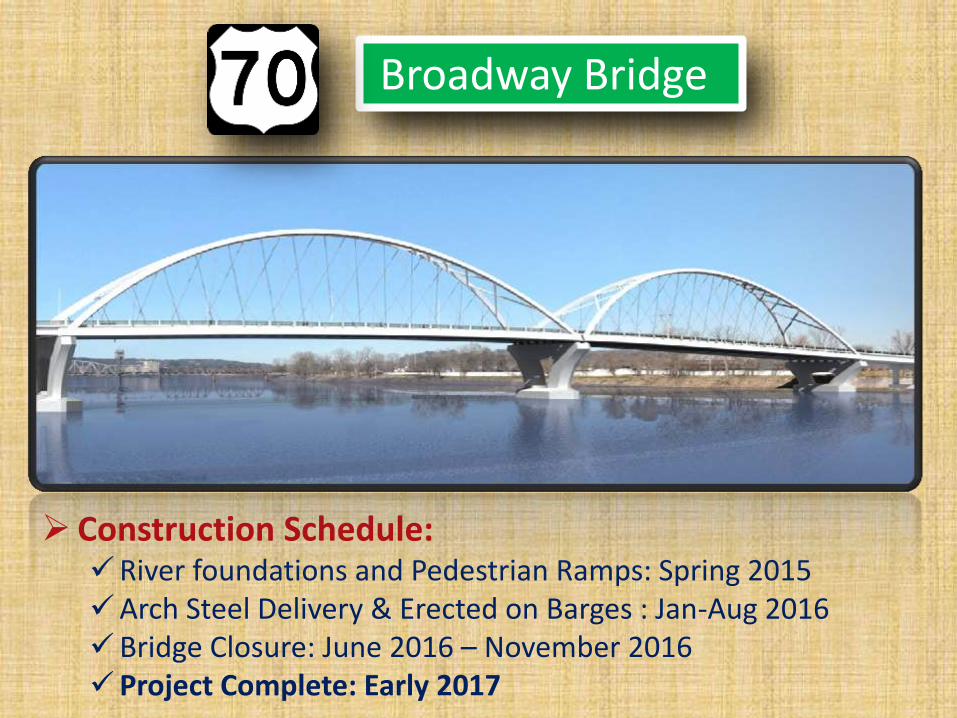
Construction Schedule: River foundations and Pedestrian Ramps: Spring 2015 Arch Steel Delivery & Erected on Barges : Jan-Aug 2016 Bridge Closure: June 2016 – November 2016 Project Complete: Early 2017
Broadway Bridge
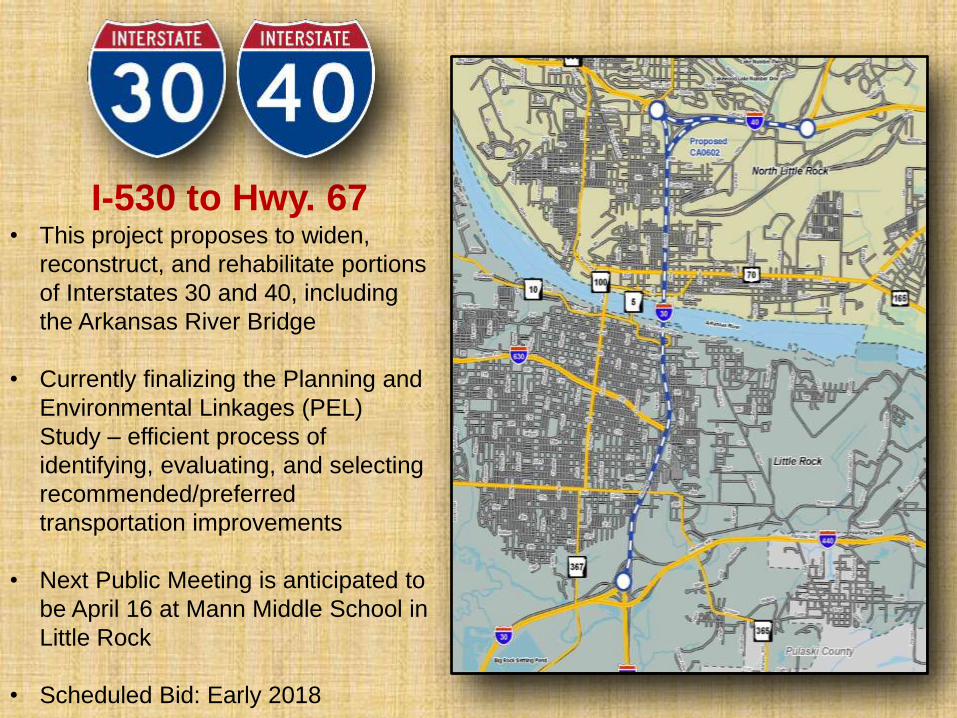
I-530 to Hwy. 67 • This project proposes to widen,
reconstruct, and rehabilitate portions
of Interstates 30 and 40, including
the Arkansas River Bridge
• Currently finalizing the Planning and
Environmental Linkages (PEL)
Study – efficient process of
identifying, evaluating, and selecting
recommended/preferred
transportation improvements
• Next Public Meeting is anticipated to
be April 16 at Mann Middle School in
Little Rock
• Scheduled Bid: Early 2018
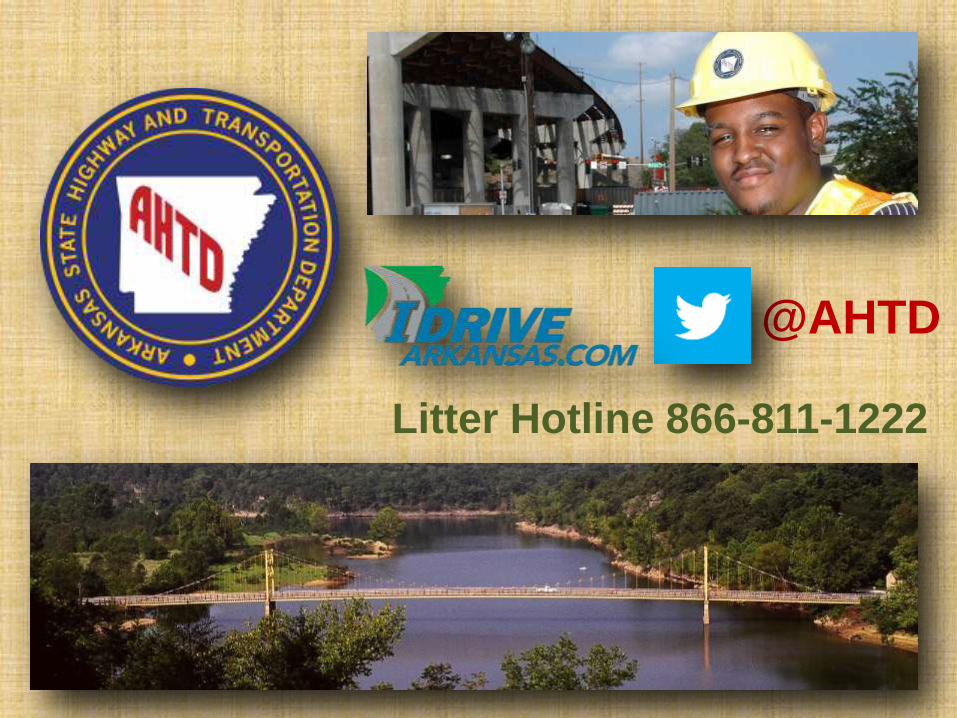
Litter Hotline 866-811-1222
@AHTD