ares i and ares i-x stage separation aerodynamic … · ares i and ares i-x stage separation...
TRANSCRIPT
Ares I and Ares I-X Stage Separation Aerodynamic Testing∗
Jeremy T. Pinier† and Charles J. Niskey‡
NASA Langley Research Center, Hampton, VA, 23681-2199
Notice to ReviewersThe Ares I and Ares I-X launch vehicles, including their predicted performance and certain other features and
characteristics, have been defined by the U.S. Government tobe Sensitive But Unclassified (SBU). Information deemedto be SBU requires special protection and may not be disclosed to an international audience, such as the audience sureto be present at the 2011 Aerospace Sciences Meeting. To comply with SBU restrictions, details have been removedfrom some plots and figures in this abstract. It is the opinionof the authors that despite these alterations, there isno loss of meaningful technical content. Analytical methodologies and capabilities are discussed; significant andinteresting technical results are obvious and still present; and meaningful conclusions are still present.
The aerodynamics of the Ares I crew launch vehicle (CLV) and Ares I-X flight test vehicle (FTV) duringstage separation was characterized by testing 1%-scale models at the Arnold Engineering Development Cen-ter’s (AEDC) von Karman Gas Dynamics Facility (VKF) Tunnel A at Mach numbers of 4.5 and 5.5. To fill alarge matrix of data points in an efficient manner, an injection system supported the upper stage and a captivetrajectory system (CTS) was utilized as a support system forthe first stage located downstream of the upperstage. In an overall extremely successful test, this complex experimental setup associated with advanced post-processing of the wind tunnel data has enabled the construction of a multi-dimensional aerodynamic databasefor the analysis and simulation of the critical phase of stage separation at high supersonic Mach numbers.Additionally, an extensive set of data from repeated wind tunnel runs was gathered purposefully to ensure thatthe experimental uncertainty would be accurately quantified in this type of flow where few historical data isavailable for comparison on this type of vehicle and where Reynolds-averaged Navier-Stokes (RANS) compu-tational simulations remain far from being a reliable source of static aerodynamic data.
Nomenclature
Symbols
α upper stage angle of attack,degβ upper stage sideslip angle,deg∆α relative angle of attack between the upper and first stage,deg∆β relative sideslip angle between the upper and first stage,degΦ azimuthal position of the first stage separation relative tothe upper stageD reference diameter, diameter of the first stage solid rocketbooster,in.L length of the vehicle, model scale,in.M Mach numberP pressure,lb/in.2
Q freestream dynamic pressure,lb/ft2
Re Reynolds number based on first stage diameter.x distance along model centerline, zero at tip of the launch abort tower,in.Xsep/D downstream separation distance between the first and upper stagesYsep/D lateral separation distance between the first and upper stagesZsep/D vertical separation distance between the first and upper stagesRsep/D radial separation distance between the first and upper stages
∗Submitted to the ARES invited session†Research Aerospace Engineer, Configuration Aerodynamics Branch, MS 499, Senior Member AIAA.‡Aerospace Engineer, Black Ram Engineering, Senior Member AIAA.
1 of 17
American Institute of Aeronautics and Astronautics
https://ntrs.nasa.gov/search.jsp?R=20110004207 2018-09-12T14:32:46+00:00Z
Acronyms
AEDC Arnold Engineering Development CenterAMS angle measurement systemBDM booster decelerator motorBMC balance moment centerBTM booster tumbling motorCFD computational fluid dynamicsCLV crew launch vehicleCTS captive trajectory systemDOF degrees of freedomFS first stageFTV flight test vehicleGNC guidance, navigation and controlLAS launch abort systemOML outer mold lineRANS Reynolds averaged Navier-StokesRoCS roll control systemSRB solid rocket boosterSRP separation planeUS upper stage
Forces and Moments
CAF axial force coefficient,CA
CRM rolling moment coefficient,Cl
CSF side force coefficient,CY
CYM yawing moment coefficient,Cn
CNF normal force coefficient,CN
CPM pitching moment coefficient,Cm
I. Introduction
The Ares I crew launch vehicle is an in-line, two-stage vehicle, with a solid rocket booster (SRB) as a first stageinherited from the Space Shuttle boosters and modified with an added fifth segment. The upper stage consists ofthe launch abort system (LAS), the crew module (CM), the service module (SM), the spacecraft adapter (SA), andthe liquid oxygen (LOX) and liquid hydrogen (LH2) tanks that provide oxidizer and fuel for the J2-X main engine.The first and upper stages are connected by the interstage, characterized by a diameter change from the large upperstage to the smaller first stage solid rocket booster diameter. One of the most critical and dynamic phases of the AresI flight is the stage separation event at aroundM = 5.5, where the first stage (FS) separates from the upper stage(US) using booster decelerator motors (BDM) until it reaches a safe separation distance where the booster tumblingmotors (BTM) fire to force the FS to tumble in its descent for a greater deceleration. Stage separation aerodynamicspresents many challenges for its characterization and modeling. Indeed, the physics of the flow are very complex andpresent a harsh environment for steady measurements. It is characterized by a high supersonic flow, a turbulent wakebehind the US, bow shock interactions and impingements on the FS, as well as high angles of attack and sideslip. Thiscombination of flow physics makes for an extremely challenging computational simulation using codes that employReynolds-averaged Navier-Stokes (RANS) solvers. RANS is indeed not suited for highly unsteady separated and wakeflows. Wind tunnel testing is therefore indispensable to gather aerodynamic data in great quantities on such vehiclesand test conditions. The aerodynamic testing was completedat the AEDC VKF Tunnel A that is equipped with acaptive trajectory system (CTS), capable of autonomously and efficiently acquiring a large matrix of data points. Themain points of concern during stage separation are: 1) the possibility of re-contact between the separated stages, 2) onAres I, the FS front end “open-cup” geometry clearing the US main engine nozzle, and 3) accurately predicting the FSsteady forces and moments while in the turbulent wake of the upper stage. The present paper describes the test setup,a selected sample of results, a description of the data post-processing for creating a complete and consistent aerody-
2 of 17
American Institute of Aeronautics and Astronautics
namic database and the uncertainty analysis methods that were used to capture all variations in the measurements, aswell as general lessons learned related to stage separationtesting for this type of launch vehicle.
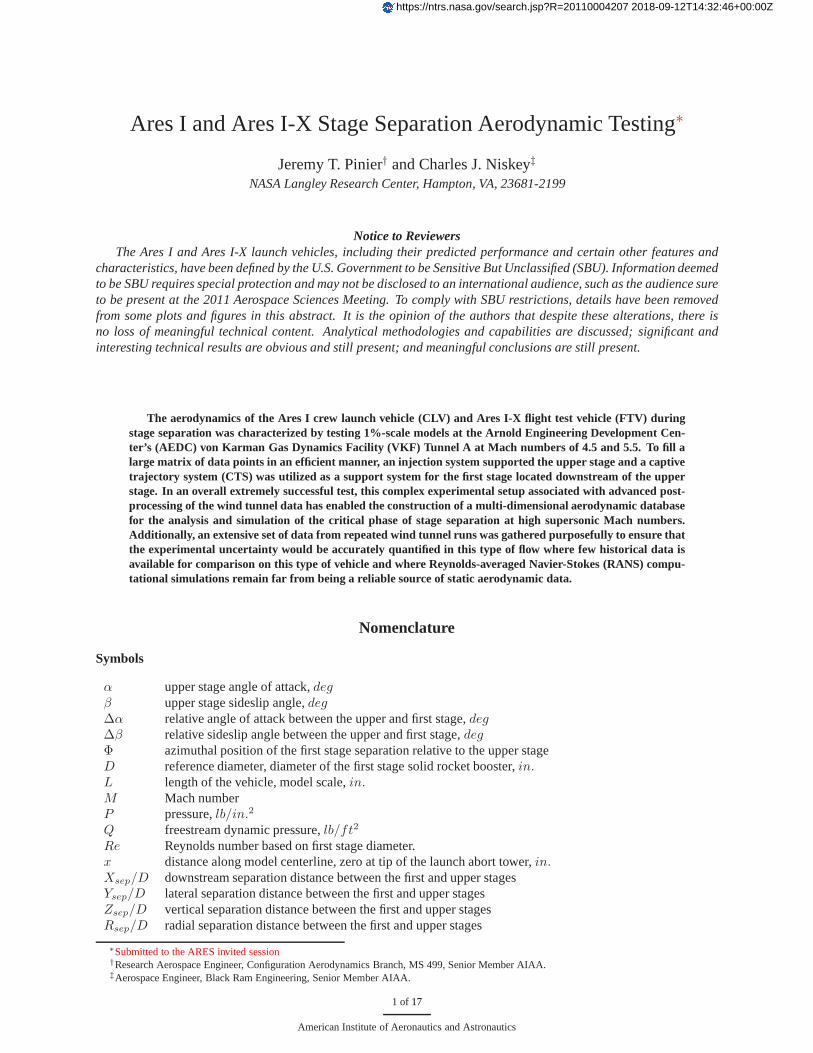
A. The Ares I crew launch vehicle and Ares I-X flight test vehicle
ARES I-X
ARES I
Figure 1. Ares I-X flight test vehicle and Ares I crew launch vehicle, illustrating the different stage separation planes, drawing not to scale.
The geometry and outer mold line (OML) of the Ares I-X FTV had to be fixed early-on in the development ofthe Ares I vehicle to enable design, fabrication, and testing of the equipment as part of the Ares I-X flight test thatoccurred on October 28, 2009 at the Kennedy Space Center. Ares I has seen significant geometry changes over thelast design cycles, primarily driven by aeroacoustics and subsystems placement. The most striking OML changes are:1) Ares I has a modified ogive shape crew module fairing as opposed to the bi-conical shaped crew module fairingon Ares I-X, 2) the separation plane is located upstream of the interstage for Ares I, rather than behind the frustumarea, at the top of the first stage booster for Ares I-X, 3) there are 10 BDMs on Ares I compared to 8 on Ares I-X,and 4) the BTMs are located on the frustum on Ares I and on the aft skirt on Ares I-X. Figure1 illustrates the mainaforementioned geometrical differences between the Ares Iand Ares I-X geometries.
B. The AEDC VKF Tunnel A
The AEDC VKF Tunnel A is a closed circuit continuous flow variable pressure supersonic facility. The tunnel con-tains three test sections with Mach numbers ranging from 1.5to 10. Tunnel A has a 40-inch square test section and asymmetric, computer controlled, continuous-curvature nozzle that can vary Mach number from 1.5 to 5.5. Tunnel Bhas a 50-inch test section and hypersonic capabilities ofM = 6 andM = 8. Tunnel C has a hypersonic test sectionwith Mach numbers of 4, 6 and 10 and offers the capability of providing aerothermal environments of up to 1440°F.A detailed report about tunnel performance and operationalcharacteristics was elaborated by Boudreau1
II. Captive trajectory force and moment test setup
A. Model and support system description
Both Ares I and Ares I-X models were 1% of full scale size for a total length of around 40 inches and the diameterof the first stage was used as a reference length,D, measuring around 1.5 inches. This size was large enough to beable to manufacture the small protuberances on the outside of the model, and small enough to be able to get highfidelity data in a 40-inch test section wind tunnel, avoidingany significant blockage and wall interference effects. Themodels were primarily built from aluminum to limit the weight and therefore minimize the effects of oscillations andvibrations when subject to the flow. Stainless steel was usedfor the high-precision parts like the balance blocks, bywhich the models are mounted to the balance. The dynamics of the models were monitored during testing to preventany overloading of the balance gages. Every external protuberance was removable (except for any axisymmetric stiff-ener ring or local diameter change) to enable testing of the clean configuration (i.e. axisymmetric, no protuberance
3 of 17
American Institute of Aeronautics and Astronautics
installed). The majority of testing was completed on the clean configuration to take advantage of symmetry and filla larger database by appropriately mirroring the data. Thispost-processing method is described in SectionIII. Theclean configuration was assumed axisymmetric, even though the LAS tower exhibits four launch abort motor nozzles.Discrepancies due to non-axisymetry were measured and included in the uncertainty analysis.
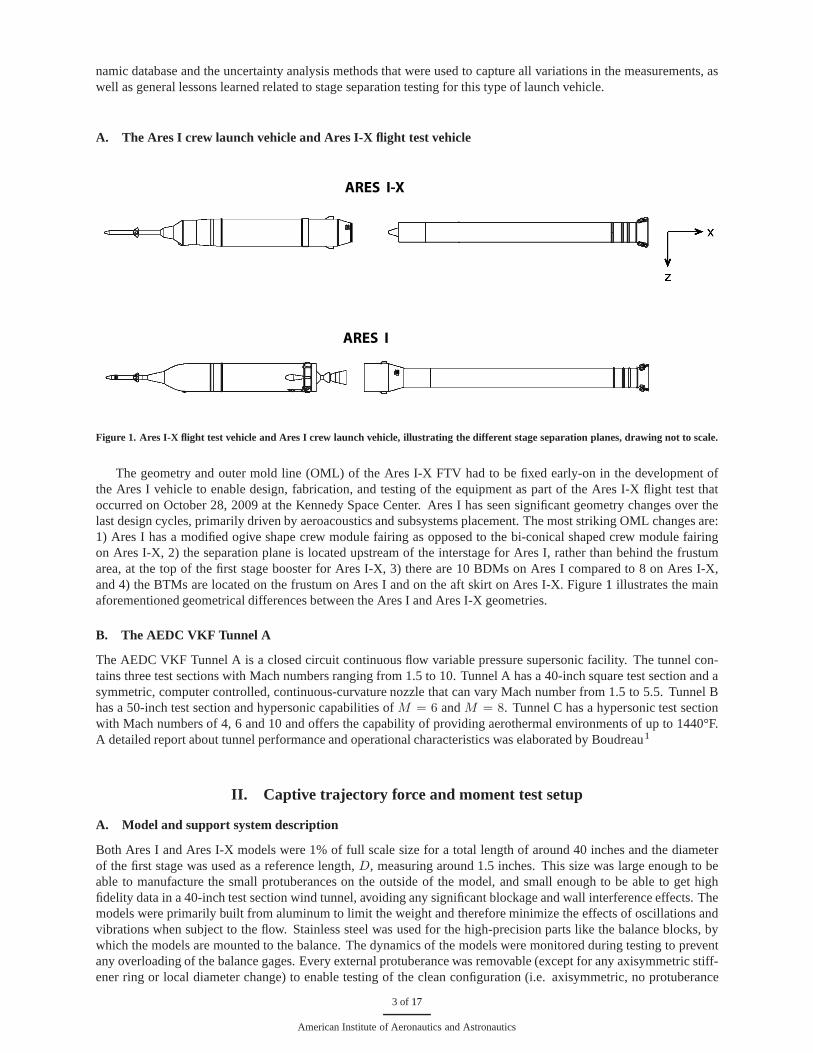
+α
+Δα
+Xsep
+Zsep
CrewHeads Up
SPUS
SPFS
Crew
Right
+β
+Δβ
SPUS
SPFS
+Xsep
-Ysep
TOP VIEW
SIDE VIEW
Figure 2. Angle and separation distance definitions.
Figure2 shows a schematic defining the angles and separation distances between the US and FS. The conditionsand ranges of attitudes tested are described in TableA.
The Reynolds numbers tested were on the same order of magnitude as flight Reynolds numbers, however bound-ary layer trips were still used to ensure early transition toturbulence. Finding the most effective way of tripping theboundary layer is a challenge on slender bodies of revolution. After an investigation into that matter2 and using var-ious transition grit patterns and qualitative diagnostic techniques such as sublimation, it was concluded that severalcircumferential grit strips with heights tailored to the Mach number range and applied to the upper portion of the mod-els would be sufficient to force transition to turbulence on the surface of the vehicle. However this topic remains anopen question and deserves further in-depth investigations if transition to turbulence showed up as a large factor in themeasurement uncertainties. None of the data collected thusfar has shown significant sensitivity to the gritting strategy.
The VKF Tunnel at AEDC is equipped with a 6-DOF captive trajectory system (CTS) that traditionally enablestesting of store separation on military aircraft. In the present case the CTS was used to support the first stage anddisplace and/or rotate it with respect to the upper stage. Table A shows the range of motion of the upper stage, whichwas only pitched at fixed increments (0°, 2°, 5°, and 10°). Since the models are mounted in an inverted position in thetunnel, a positive pitch angleα means the nose of the upper stage pitches down. The table alsoshows the range ofdisplacement and rotation of the first stage with respect to the upper stage, with∆α and∆β being the relative anglesof attack and sideslip of the FS. Each run was performed with the upper stage at a static attitudeα and the first stageperforming a longitudinal sweep downstream of the upper stage, parallel to the upper stage longitudinal axis at a givencombination ofXsep/D, Rsep, ∆α and∆β. Over the course of the test, over 4,400 such runs were performed for atotal of nearly 35,000 data points.
4 of 17
American Institute of Aeronautics and Astronautics
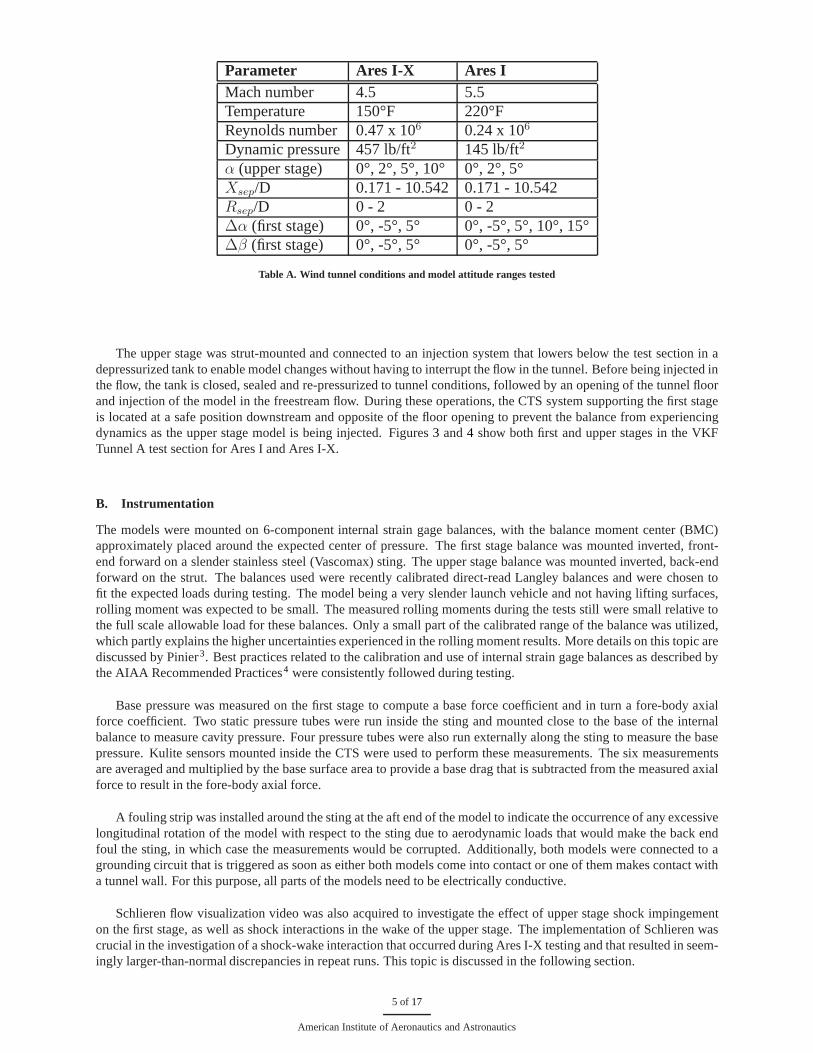
Parameter Ares I-X Ares IMach number 4.5 5.5Temperature 150°F 220°FReynolds number 0.47 x 10⁶ 0.24 x 10⁶
Dynamic pressure 457 lb/ft2 145 lb/ft2
α (upper stage) 0°, 2°, 5°, 10° 0°, 2°, 5°Xsep/D 0.171 - 10.542 0.171 - 10.542Rsep/D 0 - 2 0 - 2∆α (first stage) 0°, -5°, 5° 0°, -5°, 5°, 10°, 15°∆β (first stage) 0°, -5°, 5° 0°, -5°, 5°
Table A. Wind tunnel conditions and model attitude ranges tested
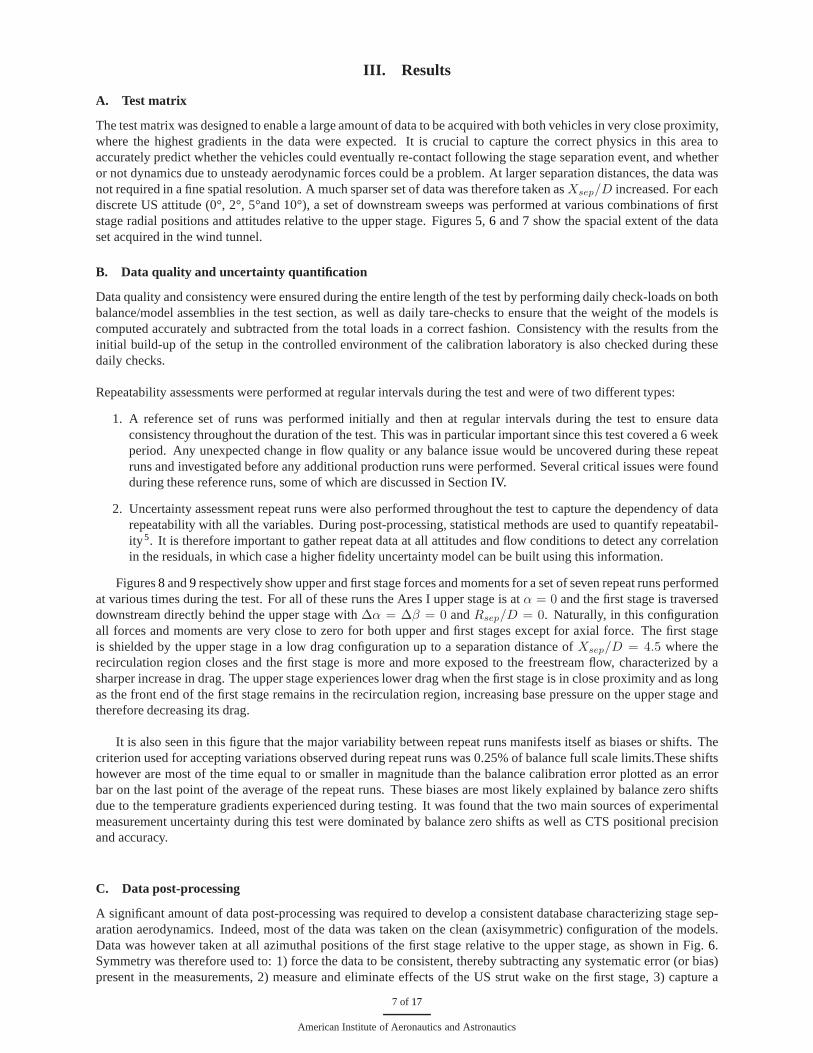
The upper stage was strut-mounted and connected to an injection system that lowers below the test section in adepressurized tank to enable model changes without having to interrupt the flow in the tunnel. Before being injected inthe flow, the tank is closed, sealed and re-pressurized to tunnel conditions, followed by an opening of the tunnel floorand injection of the model in the freestream flow. During these operations, the CTS system supporting the first stageis located at a safe position downstream and opposite of the floor opening to prevent the balance from experiencingdynamics as the upper stage model is being injected. Figures3 and4 show both first and upper stages in the VKFTunnel A test section for Ares I and Ares I-X.
B. Instrumentation
The models were mounted on 6-component internal strain gagebalances, with the balance moment center (BMC)approximately placed around the expected center of pressure. The first stage balance was mounted inverted, front-end forward on a slender stainless steel (Vascomax) sting. The upper stage balance was mounted inverted, back-endforward on the strut. The balances used were recently calibrated direct-read Langley balances and were chosen tofit the expected loads during testing. The model being a very slender launch vehicle and not having lifting surfaces,rolling moment was expected to be small. The measured rolling moments during the tests still were small relative tothe full scale allowable load for these balances. Only a small part of the calibrated range of the balance was utilized,which partly explains the higher uncertainties experienced in the rolling moment results. More details on this topic arediscussed by Pinier3. Best practices related to the calibration and use of internal strain gage balances as described bythe AIAA Recommended Practices4 were consistently followed during testing.
Base pressure was measured on the first stage to compute a baseforce coefficient and in turn a fore-body axialforce coefficient. Two static pressure tubes were run insidethe sting and mounted close to the base of the internalbalance to measure cavity pressure. Four pressure tubes were also run externally along the sting to measure the basepressure. Kulite sensors mounted inside the CTS were used toperform these measurements. The six measurementsare averaged and multiplied by the base surface area to provide a base drag that is subtracted from the measured axialforce to result in the fore-body axial force.
A fouling strip was installed around the sting at the aft end of the model to indicate the occurrence of any excessivelongitudinal rotation of the model with respect to the stingdue to aerodynamic loads that would make the back endfoul the sting, in which case the measurements would be corrupted. Additionally, both models were connected to agrounding circuit that is triggered as soon as either both models come into contact or one of them makes contact witha tunnel wall. For this purpose, all parts of the models need to be electrically conductive.
Schlieren flow visualization video was also acquired to investigate the effect of upper stage shock impingementon the first stage, as well as shock interactions in the wake ofthe upper stage. The implementation of Schlieren wascrucial in the investigation of a shock-wake interaction that occurred during Ares I-X testing and that resulted in seem-ingly larger-than-normal discrepancies in repeat runs. This topic is discussed in the following section.
5 of 17
American Institute of Aeronautics and Astronautics
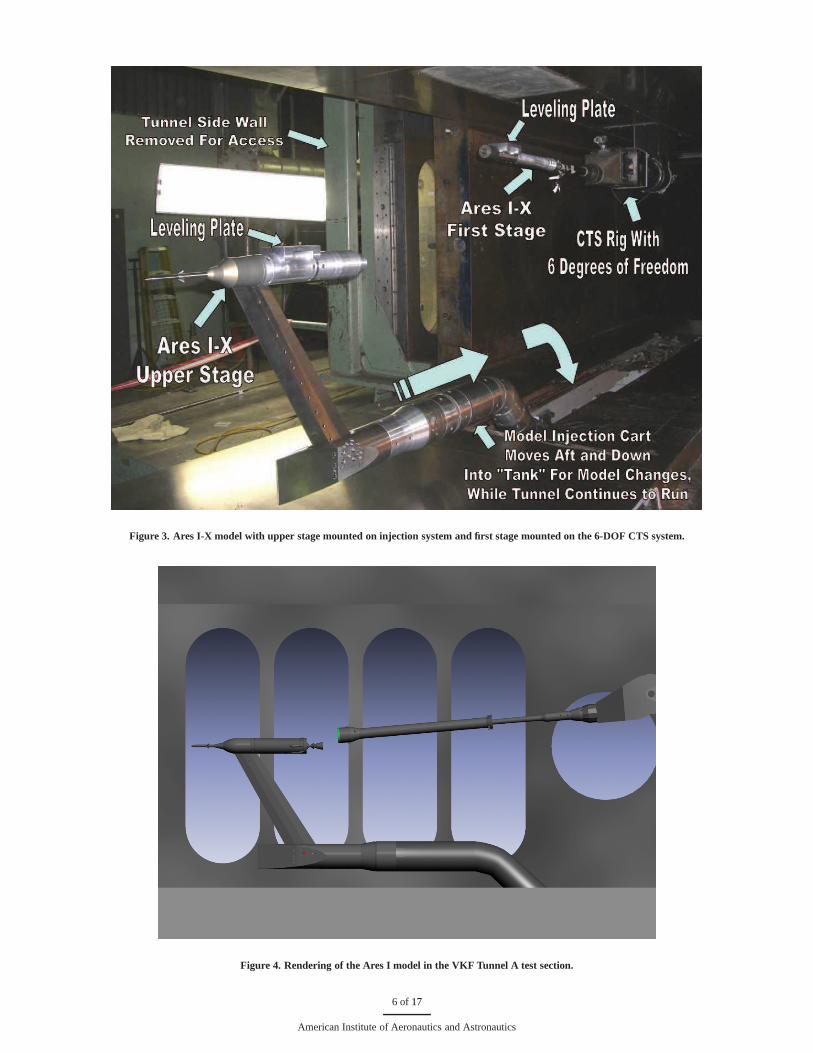
Figure 3. Ares I-X model with upper stage mounted on injection system and first stage mounted on the 6-DOF CTS system.
Figure 4. Rendering of the Ares I model in the VKF Tunnel A testsection.
6 of 17
American Institute of Aeronautics and Astronautics
III. Results
A. Test matrix
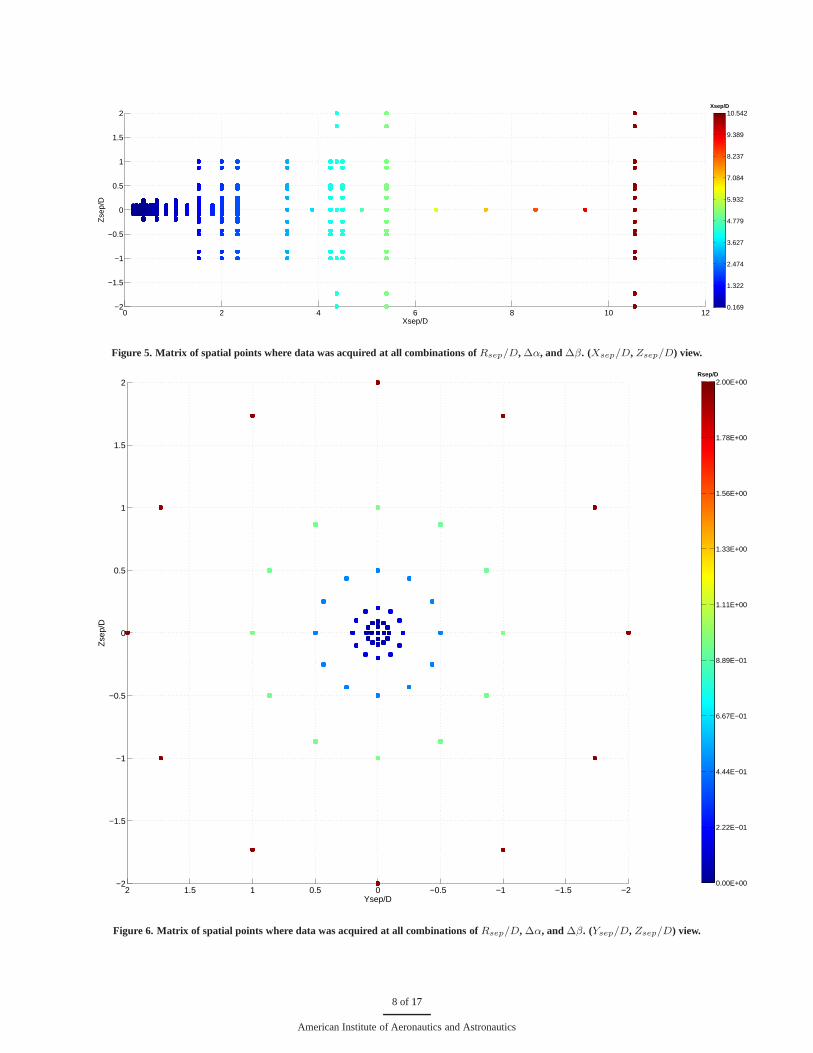
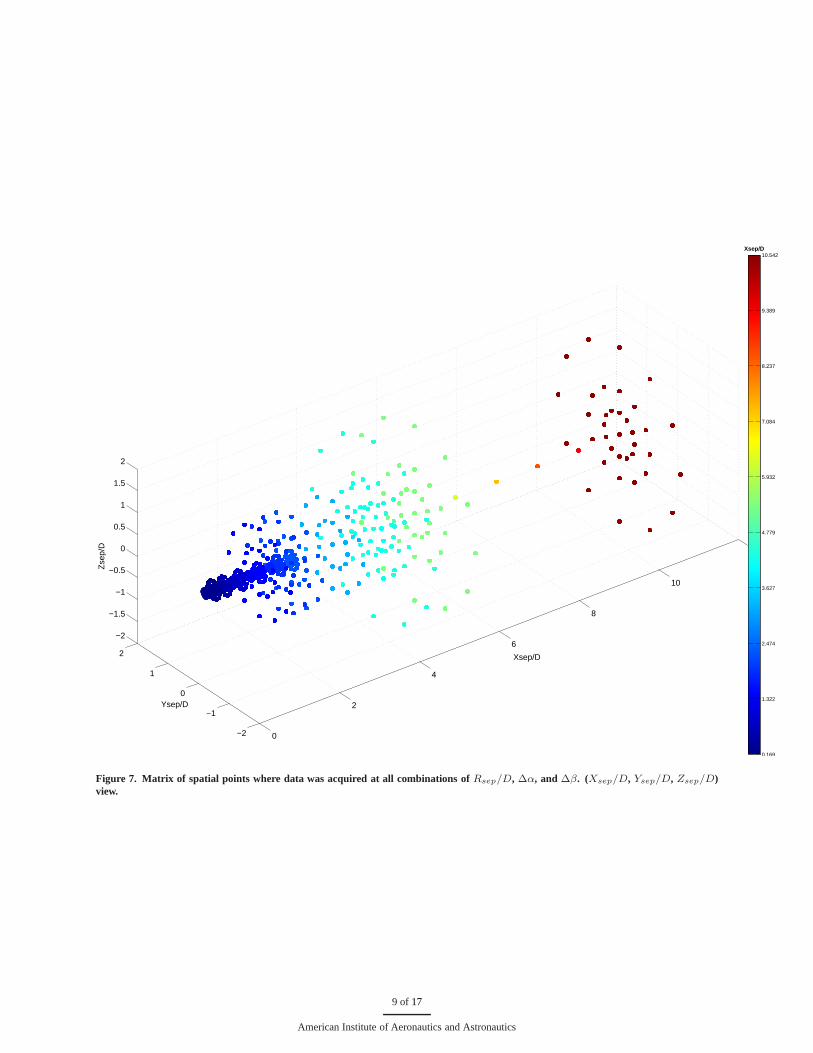
The test matrix was designed to enable a large amount of data to be acquired with both vehicles in very close proximity,where the highest gradients in the data were expected. It is crucial to capture the correct physics in this area toaccurately predict whether the vehicles could eventually re-contact following the stage separation event, and whetheror not dynamics due to unsteady aerodynamic forces could be aproblem. At larger separation distances, the data wasnot required in a fine spatial resolution. A much sparser set of data was therefore taken asXsep/D increased. For eachdiscrete US attitude (0°, 2°, 5°and 10°), a set of downstreamsweeps was performed at various combinations of firststage radial positions and attitudes relative to the upper stage. Figures5, 6 and7 show the spacial extent of the dataset acquired in the wind tunnel.
B. Data quality and uncertainty quantification
Data quality and consistency were ensured during the entirelength of the test by performing daily check-loads on bothbalance/model assemblies in the test section, as well as daily tare-checks to ensure that the weight of the models iscomputed accurately and subtracted from the total loads in acorrect fashion. Consistency with the results from theinitial build-up of the setup in the controlled environmentof the calibration laboratory is also checked during thesedaily checks.
Repeatability assessments were performed at regular intervals during the test and were of two different types:
1. A reference set of runs was performed initially and then atregular intervals during the test to ensure dataconsistency throughout the duration of the test. This was inparticular important since this test covered a 6 weekperiod. Any unexpected change in flow quality or any balance issue would be uncovered during these repeatruns and investigated before any additional production runs were performed. Several critical issues were foundduring these reference runs, some of which are discussed in SectionIV.
2. Uncertainty assessment repeat runs were also performed throughout the test to capture the dependency of datarepeatability with all the variables. During post-processing, statistical methods are used to quantify repeatabil-ity 5. It is therefore important to gather repeat data at all attitudes and flow conditions to detect any correlationin the residuals, in which case a higher fidelity uncertaintymodel can be built using this information.
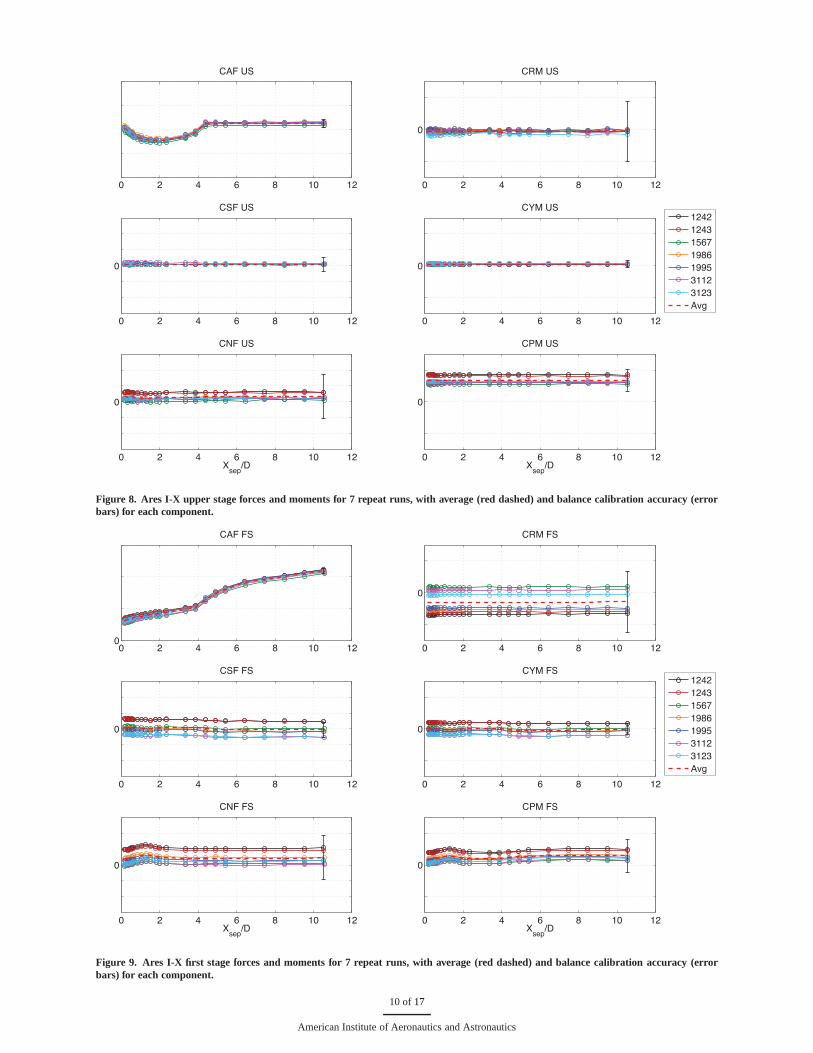
Figures8 and9 respectively show upper and first stage forces and moments for a set of seven repeat runs performedat various times during the test. For all of these runs the Ares I upper stage is atα = 0 and the first stage is traverseddownstream directly behind the upper stage with∆α = ∆β = 0 andRsep/D = 0. Naturally, in this configurationall forces and moments are very close to zero for both upper and first stages except for axial force. The first stageis shielded by the upper stage in a low drag configuration up toa separation distance ofXsep/D = 4.5 where therecirculation region closes and the first stage is more and more exposed to the freestream flow, characterized by asharper increase in drag. The upper stage experiences lowerdrag when the first stage is in close proximity and as longas the front end of the first stage remains in the recirculation region, increasing base pressure on the upper stage andtherefore decreasing its drag.
It is also seen in this figure that the major variability between repeat runs manifests itself as biases or shifts. Thecriterion used for accepting variations observed during repeat runs was 0.25% of balance full scale limits.These shiftshowever are most of the time equal to or smaller in magnitude than the balance calibration error plotted as an errorbar on the last point of the average of the repeat runs. These biases are most likely explained by balance zero shiftsdue to the temperature gradients experienced during testing. It was found that the two main sources of experimentalmeasurement uncertainty during this test were dominated bybalance zero shifts as well as CTS positional precisionand accuracy.
C. Data post-processing
A significant amount of data post-processing was required todevelop a consistent database characterizing stage sep-aration aerodynamics. Indeed, most of the data was taken on the clean (axisymmetric) configuration of the models.Data was however taken at all azimuthal positions of the firststage relative to the upper stage, as shown in Fig.6.Symmetry was therefore used to: 1) force the data to be consistent, thereby subtracting any systematic error (or bias)present in the measurements, 2) measure and eliminate effects of the US strut wake on the first stage, 3) capture a
7 of 17
American Institute of Aeronautics and Astronautics
0 2 4 6 8 10 12−2
−1.5
−1
−0.5
0
0.5
1
1.5
2
Zse
p/D
Xsep/D
Xsep/D
0.169
1.322
2.474
3.627
4.779
5.932
7.084
8.237
9.389
10.542
Figure 5. Matrix of spatial points where data was acquired atall combinations ofRsep/D, ∆α, and∆β. (Xsep/D, Zsep/D) view.
−2−1.5−1−0.500.511.52−2
−1.5
−1
−0.5
0
0.5
1
1.5
2
Zse
p/D
Ysep/D
Rsep/D
0.00E+00
2.22E−01
4.44E−01
6.67E−01
8.89E−01
1.11E+00
1.33E+00
1.56E+00
1.78E+00
2.00E+00
Figure 6. Matrix of spatial points where data was acquired atall combinations ofRsep/D, ∆α, and∆β. (Ysep/D, Zsep/D) view.
8 of 17
American Institute of Aeronautics and Astronautics
0
2
4
6
8
10
12
−2
−1
0
1
2
−2
−1.5
−1
−0.5
0
0.5
1
1.5
2
Zse
p/D
Ysep/D
Xsep/D
Xsep/D
0.169
1.322
2.474
3.627
4.779
5.932
7.084
8.237
9.389
10.542
Figure 7. Matrix of spatial points where data was acquired atall combinations of Rsep/D, ∆α, and ∆β. (Xsep/D, Ysep/D, Zsep/D)view.
9 of 17
American Institute of Aeronautics and Astronautics
0 2 4 6 8 10 12
CAF US
0 2 4 6 8 10 12
0
CRM US
0 2 4 6 8 10 12
0
CSF US
0 2 4 6 8 10 12
0
CYM US
0 2 4 6 8 10 12
0
CNF US
Xsep
/D0 2 4 6 8 10 12
0
CPM US
Xsep
/D
1242
1243
1567
1986
1995
3112
3123
Avg
Figure 8. Ares I-X upper stage forces and moments for 7 repeatruns, with average (red dashed) and balance calibration accuracy (errorbars) for each component.
0 2 4 6 8 10 120
CAF FS
0 2 4 6 8 10 12
0
CRM FS
0 2 4 6 8 10 12
0
CSF FS
0 2 4 6 8 10 12
0
CYM FS
0 2 4 6 8 10 12
0
CNF FS
Xsep
/D0 2 4 6 8 10 12
0
CPM FS
Xsep
/D
1242
1243
1567
1986
1995
3112
3123
Avg
Figure 9. Ares I-X first stage forces and moments for 7 repeat runs, with average (red dashed) and balance calibration accuracy (errorbars) for each component.
10 of 17
American Institute of Aeronautics and Astronautics
0 2 4 6 8 10 120
CAF FS
0 2 4 6 8 10 12
0
CRM FS
0 2 4 6 8 10 12
0
CSF FS
0 2 4 6 8 10 12
0
CYM FS
0 2 4 6 8 10 12
0
CNF FS
Xsep
/D0 2 4 6 8 10 12
0
CPM FS
Xsep
/D
3848
3919
3982
4069
3856
3915
3978
4065
Figure 10. Ares I first stage force and moment data in the vertical-plane axis system.
0 2 4 6 8 10 120
CAF FS
0 2 4 6 8 10 12
0
CRM FS
0 2 4 6 8 10 12
0
CSF FS
0 2 4 6 8 10 12
0
CYM FS
0 2 4 6 8 10 12
0
CNF FS
Xsep
/D0 2 4 6 8 10 12
0
CPM FS
Xsep
/D
3848
3919
3982
4069
3856
3915
3978
4065
Figure 11. Ares I first stage force and moment data in the polaraxis system as defined in Eq. 1.
11 of 17
American Institute of Aeronautics and Astronautics
0 2 4 6 8 10 120
CAF FS
0 2 4 6 8 10 12
0
CRM FS
0 2 4 6 8 10 12
0
CSF FS
0 2 4 6 8 10 12
0
CYM FS
0 2 4 6 8 10 12
0
CNF FS
Xsep
/D0 2 4 6 8 10 12
0
CPM FS
Xsep
/D
3848
3919
3982
4069
3856
3915
3978
4065
Figure 12. Ares I first stage force and moment data in the polaraxis system, mirrored to collapse, and averaged (red dashedline).
0 2 4 6 8 10 120
CAF FS
0 2 4 6 8 10 12
0
CRM FS
0 2 4 6 8 10 12
0
CSF FS
0 2 4 6 8 10 12
0
CYM FS
0 2 4 6 8 10 12
0
CNF FS
Xsep
/D0 2 4 6 8 10 12
0
CPM FS
Xsep
/D
3848
3919
3982
4069
3856
3915
3978
4065
Figure 13. Ares I first stage force and moment data in the vertical-plane axis system, at nominal conditions.
12 of 17
American Institute of Aeronautics and Astronautics
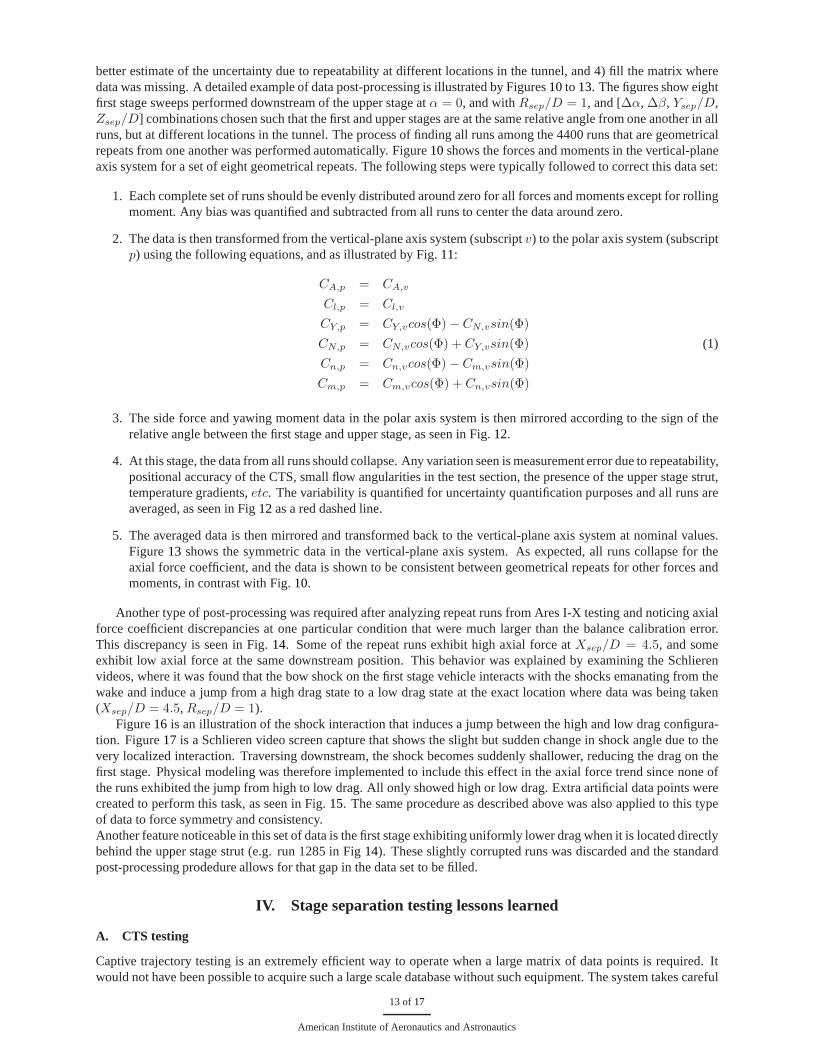
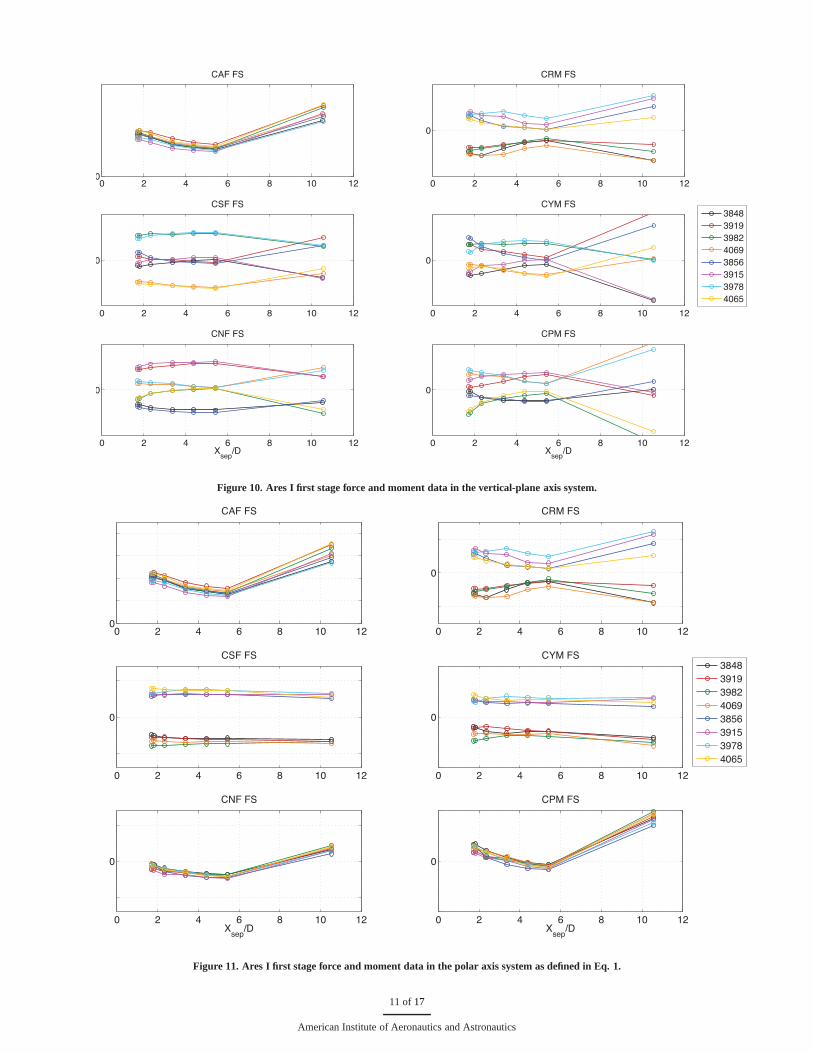
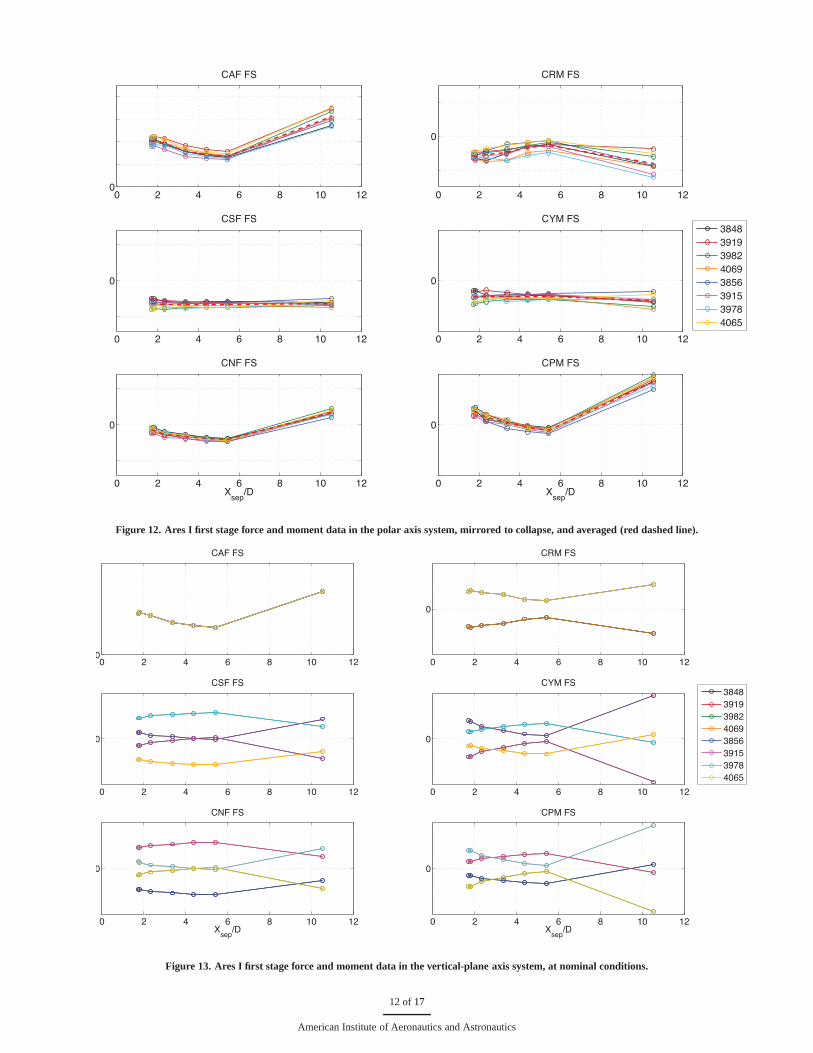
better estimate of the uncertainty due to repeatability at different locations in the tunnel, and 4) fill the matrix wheredata was missing. A detailed example of data post-processing is illustrated by Figures10to 13. The figures show eightfirst stage sweeps performed downstream of the upper stage atα = 0, and withRsep/D = 1, and [∆α, ∆β, Ysep/D,Zsep/D] combinations chosen such that the first and upper stages areat the same relative angle from one another in allruns, but at different locations in the tunnel. The process of finding all runs among the 4400 runs that are geometricalrepeats from one another was performed automatically. Figure10shows the forces and moments in the vertical-planeaxis system for a set of eight geometrical repeats. The following steps were typically followed to correct this data set:
1. Each complete set of runs should be evenly distributed around zero for all forces and moments except for rollingmoment. Any bias was quantified and subtracted from all runs to center the data around zero.
2. The data is then transformed from the vertical-plane axissystem (subscriptv) to the polar axis system (subscriptp) using the following equations, and as illustrated by Fig.11:
CA,p = CA,v
Cl,p = Cl,v
CY,p = CY,vcos(Φ)− CN,vsin(Φ)
CN,p = CN,vcos(Φ) + CY,vsin(Φ) (1)
Cn,p = Cn,vcos(Φ)− Cm,vsin(Φ)
Cm,p = Cm,vcos(Φ) + Cn,vsin(Φ)
3. The side force and yawing moment data in the polar axis system is then mirrored according to the sign of therelative angle between the first stage and upper stage, as seen in Fig.12.
4. At this stage, the data from all runs should collapse. Any variation seen is measurement error due to repeatability,positional accuracy of the CTS, small flow angularities in the test section, the presence of the upper stage strut,temperature gradients,etc. The variability is quantified for uncertainty quantification purposes and all runs areaveraged, as seen in Fig12as a red dashed line.
5. The averaged data is then mirrored and transformed back tothe vertical-plane axis system at nominal values.Figure13 shows the symmetric data in the vertical-plane axis system.As expected, all runs collapse for theaxial force coefficient, and the data is shown to be consistent between geometrical repeats for other forces andmoments, in contrast with Fig.10.
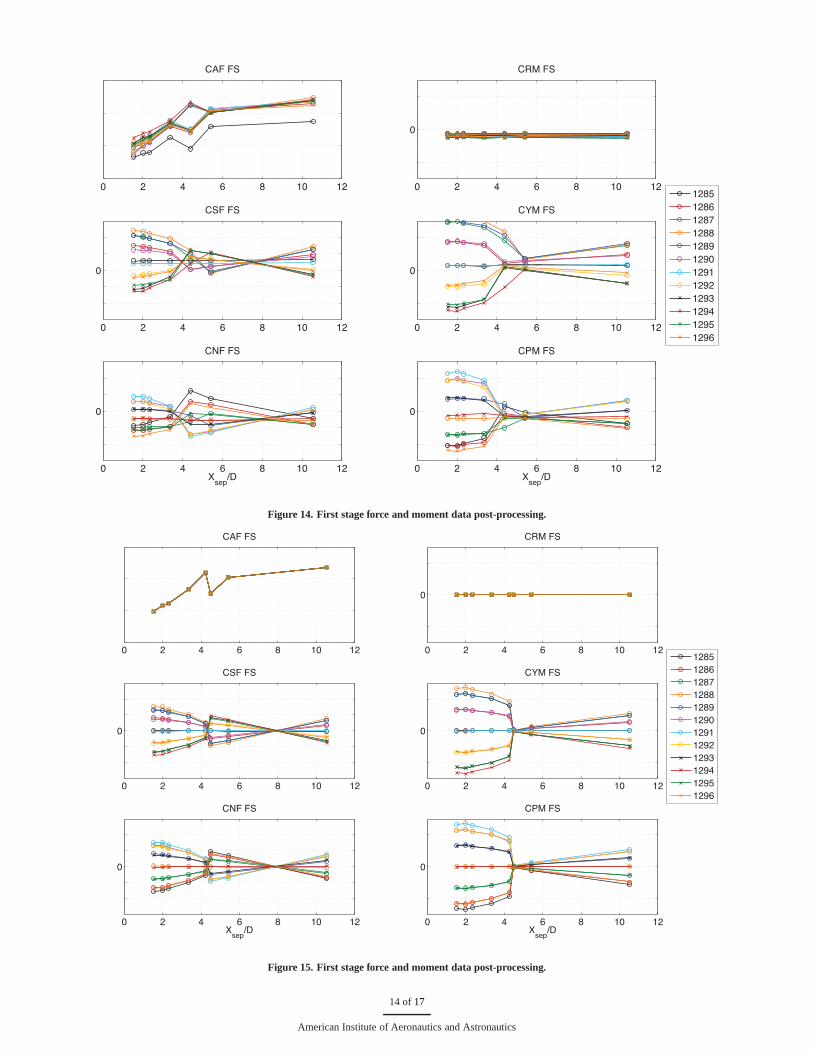
Another type of post-processing was required after analyzing repeat runs from Ares I-X testing and noticing axialforce coefficient discrepancies at one particular condition that were much larger than the balance calibration error.This discrepancy is seen in Fig.14. Some of the repeat runs exhibit high axial force atXsep/D = 4.5, and someexhibit low axial force at the same downstream position. This behavior was explained by examining the Schlierenvideos, where it was found that the bow shock on the first stagevehicle interacts with the shocks emanating from thewake and induce a jump from a high drag state to a low drag stateat the exact location where data was being taken(Xsep/D = 4.5, Rsep/D = 1).
Figure16 is an illustration of the shock interaction that induces a jump between the high and low drag configura-tion. Figure17 is a Schlieren video screen capture that shows the slight butsudden change in shock angle due to thevery localized interaction. Traversing downstream, the shock becomes suddenly shallower, reducing the drag on thefirst stage. Physical modeling was therefore implemented toinclude this effect in the axial force trend since none ofthe runs exhibited the jump from high to low drag. All only showed high or low drag. Extra artificial data points werecreated to perform this task, as seen in Fig.15. The same procedure as described above was also applied to this typeof data to force symmetry and consistency.Another feature noticeable in this set of data is the first stage exhibiting uniformly lower drag when it is located directlybehind the upper stage strut (e.g. run 1285 in Fig14). These slightly corrupted runs was discarded and the standardpost-processing prodedure allows for that gap in the data set to be filled.
IV. Stage separation testing lessons learned
A. CTS testing
Captive trajectory testing is an extremely efficient way to operate when a large matrix of data points is required. Itwould not have been possible to acquire such a large scale database without such equipment. The system takes careful
13 of 17
American Institute of Aeronautics and Astronautics
0 2 4 6 8 10 12
CAF FS
0 2 4 6 8 10 12
0
CRM FS
0 2 4 6 8 10 12
0
CSF FS
0 2 4 6 8 10 12
0
CYM FS
0 2 4 6 8 10 12
0
CNF FS
Xsep
/D0 2 4 6 8 10 12
0
CPM FS
Xsep
/D
1285
1286
1287
1288
1289
1290
1291
1292
1293
1294
1295
1296
Figure 14. First stage force and moment data post-processing.
0 2 4 6 8 10 12
CAF FS
0 2 4 6 8 10 12
0
CRM FS
0 2 4 6 8 10 12
0
CSF FS
0 2 4 6 8 10 12
0
CYM FS
0 2 4 6 8 10 12
0
CNF FS
Xsep
/D0 2 4 6 8 10 12
0
CPM FS
Xsep
/D
1285
1286
1287
1288
1289
1290
1291
1292
1293
1294
1295
1296
Figure 15. First stage force and moment data post-processing.
14 of 17
American Institute of Aeronautics and Astronautics
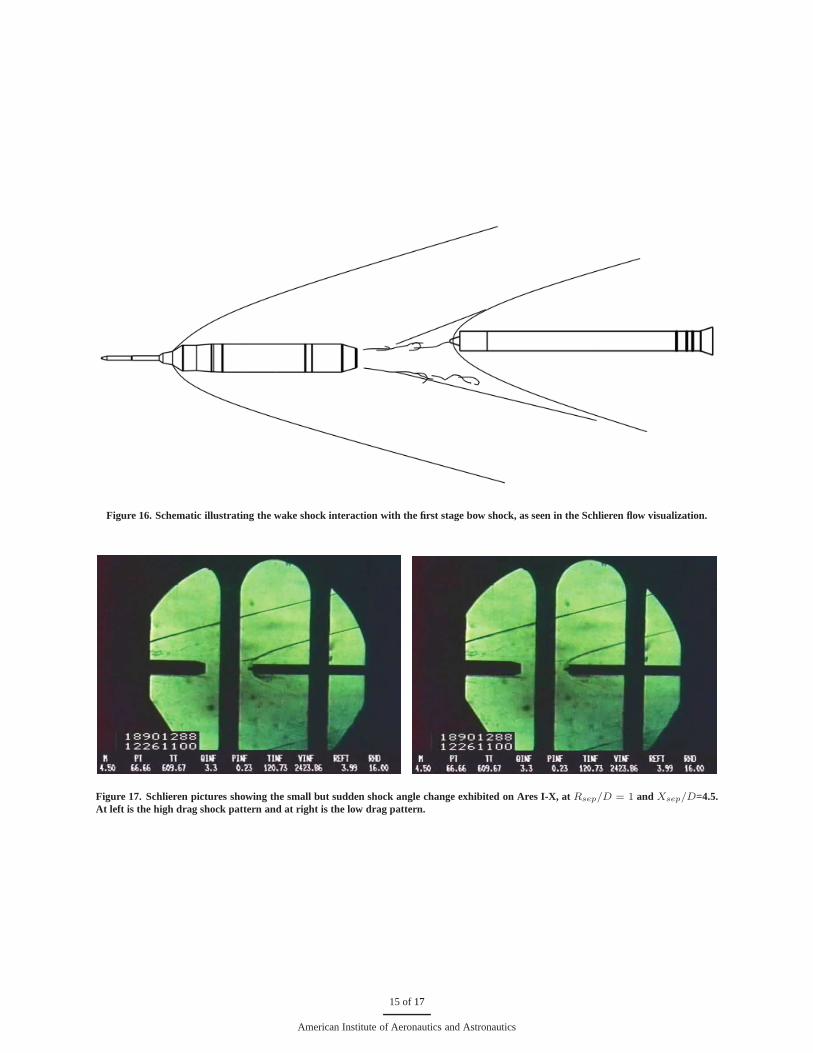
Figure 16. Schematic illustrating the wake shock interaction with the first stage bow shock, as seen in the Schlieren flow visualization.
Figure 17. Schlieren pictures showing the small but sudden shock angle change exhibited on Ares I-X, atRsep/D = 1 and Xsep/D=4.5.At left is the high drag shock pattern and at right is the low drag pattern.
15 of 17
American Institute of Aeronautics and Astronautics
and lengthy calibration and troubleshooting initially, however it is well worth the time invested. Since the system isautomatically controlled is is important to have a very effective fouling system that prevents overloading of the bal-ances in case of an erroneous displacement that could provoke a collision between the two models. The fouling systemin place at the VKF Tunnel A is very efficient and, although several contacts occurred between the models during thetest, the integrity of the balances was never in jeopardy andmaximum loads were never reached in a steady sense.
B. Pressure lag
At the high supersonic Mach numbers where static pressure inthe tunnel is very low, significant pressure lags can beexperienced in the tubing when the length from the tap to the sensor (ESP or Kulite) is greater than 2 to 3 feet. Thegage of the tubing also plays an important role, the smaller the tube diameter the larger the lag. This effect can be aproblem when the data is taken continuously without leavingtime for the pressure to propagate along the tubes andwill induce a corrupted pressure reading. During a force andmoment test, if the base and cavity pressures are lagging,then the base force correction will be corrupted as well, resulting in erroneous corrected axial force coefficients. It isthen extremely difficult and impractical to correct for these kinds of errorsa posteriori. Therefore much care needsto be taken when designing the experiment in estimating the potential lag induced by the length of the tubing. Thesolution to this problem is either to slow the pitching or rolling rate during runs or to shorten the tube length by movingthe sensors as close as possible to the tap location. The ideal is to have the pressure sensors inside the model, howeverthis was not an option with the small scale and little room inside the model. To investigate whether there is lag inthe tubing, one can perform a continuous positive pitch run (e.g. -10° to +10° angle of attack) followed by a contin-uous negative pitch run (e.g. +10° to -10° angle of attack). When plotting axial force coefficient corrected for baseforce as a function of angle of attack, if no lag is present, both curves should be equal, within measurement uncertainty.
C. Temperature variations
Temperatures in the tunnel can reach 200°F, in which case thebalance temperature can surpass 150°F, which is arelatively large variation compared to ambient temperature where balance zeros are taken. An uncertainty is thereforeintroduced by the fact that the balance calibration is sensitive to temperature. Even though Langley balances are tem-perature compensated, the compensation method is only effective for small differences in temperature relative to thetemperatures that are experienced in Tunnel A at the higher Mach numbers. Where possible it is always preferableto take balance zeros when the balance is hot. During this test, the first stage was mounted on the CTS system andremained in the test section during the whole time, it was therefore difficult to take balance zeros at regular intervalssince bringing the flow down and back up can be very expensive and risky at certain conditions. However, data pointswere taken at regular intervals at a safe position when the upper stage was retracted in the injection tank to monitorany shift in balance zeros, which could, if present, corruptthe data. The upper stage was retracted at regular intervals,it was therefore more practical to take balance zeros very regularly and monitor balance zero shifts. In designing theexperiment, great care should be taken to ensure that balance monitoring data points and zeros will be taken very often.
D. Fine resolution sweep investigation
A short amount of time at the beginning of the test should be spent performing fine resolution sweeps to detect anysharp gradients in the trends before deciding on the final increments chosen to be performed for the rest of the test.A sharp gradient was noticed during post-processing on the Ares I-X model at one particular condition, where datahappened to be taken. Without taking data at the exact condition, the dynamic event would have been missed. Whenthe time permits, such an initial investigation would ensure that this kind of phenomena is not overlooked.
E. Tunnel operations
Initially, two shifts per day were dedicated to running the test. Most of the first shift and part of the second werespent performing system and instrumentation checks and getting the tunnel to conditions, which showed to be a veryinefficient mode of operations. It was therefore decided to revert to three-shift operations where the data could betaken continuously without interruption once the tunnel was brought online. A great amount of time and funds weresaved by running the tunnel in a 3-shift rather than 2-shift operation mode.
16 of 17
American Institute of Aeronautics and Astronautics

V. Conclusion
The AEDC VKF Tunnel A facility and the unique capabilities itoffers in terms of advanced testing techniques wascrucial in obtaining the high quality data that is used to create a high fidelity stage separation aerodynamic databasesfor the Ares I-X flight test vehicle and the Ares I crew launch vehicle. The success of the Ares I-X flight test stageseparation event can be in part attributed to the quality andamount of aerodynamic data that was gathered during thiswind tunnel test. Many lessons were learned in accomplishing this work and precious expertise in the area of captivetrajectory testing was gained. Although the RoCS, BDM and BTM nozzle flows were not simulated during the test,many questions have been left unanswered as to the effect of jet interactions on the aerodynamics of the vehicle andRANS-type CFD has not provided validated results to addressthese issues. The experience gained during this power-off stage separation test will be an advantage when investigating the effects of powered flight in a wind tunnel test.
Acknowledgments
The authors would like to recognize the whole test and project personnel at the AEDC VKF Tunnel A for theirdedication to completing such a complex task with success. The data gathered at this facility has provided criticalaerodynamic information to the Constellation program and in particular to the Ares I crew launch vehicle and AresI-X flight test projects.
References1Boudreau, A. H., “Performance and Operational Characteristics of AEDC/VKF Tunnels A, B, and C,”AEDC-TR-80-48, 1981.2Erickson, G. E., “0.01-Scale CLV DAC-2A Force and Moment Model Testing in the NASA Langley Research Center Unitary Plan Wind
Tunnel, UPWT Tests 1968/1813,”Ares-AD-TA-0004, 2007.3Pinier, J. T., “Ares I Aerodynamic Testing at the Boeing Polysonic Wind Tunnel,”49th AIAA Aerospace Sciences Meeting, Orlando, Florida,
2011.4“Calibration and Use of Internal Strain-Gage Balances withApplication to Wind Tunnel Testing,”AIAA Recommended Practice, AIAA R-
091-2003, 2003.5Hemsch, M. J., Hanke, J. L., and Houlden, H. P., “Quality Assurance and Uncertainty Quantification for Ares I A103 Ascent Aero Data Base,”
Ares-AD-TA-0011, 2008.
17 of 17
American Institute of Aeronautics and Astronautics