area method for a biased relay feedback system
TRANSCRIPT
Area Method for a Biased Relay Feedback System
Jietae Lee* and Su Whan Sung
Department of Chemical Engineering, Kyungpook National UniVersity, Taegu 702-701, Korea
Thomas F. Edgar
Department of Chemical Engineering, UniVersity of Texas, Austin, Texas 78712
The relay feedback system often shows an asymmetric response because of initial transient states, disturbances,and process nonlinearity. To restore a symmetric response of the relay feedback system, an iterative adjustmentof input or output bias is required. Instead of trying to obtain a symmetric response, the asymmetric responsecan be analyzed to estimate the ultimate data or a parametric model of process. However, the asymmetricresponse causes additional errors in estimating the ultimate properties of the process. An area method isproposed to reduce these errors. Because integrals (areas) of the relay responses reduce the effects of thehigh-order harmonic terms significantly, the proposed method shows better accuracy in obtaining frequencyresponse data and parametric models compared with previous approaches.
Introduction
Since Astrom and Hagglund1 introduced an autotuningmethod that uses the relay feedback test, many researchesand applications have been reported.2,3 Many commerciallyavailable controllers have this feature and use the symmetricoscillation of a relay feedback system. However, some relayfeedback systems show asymmetric oscillation due to thetransient initial states, disturbances, and processes nonlin-earities. Conventional simple analysis of the symmetric relayoscillation which is based on ignoring the higher harmonicterms has errors in estimating the ultimate gain and periodof a process to tune controllers. The asymmetric responsecauses additional errors. Methods to reject sources ofasymmetric responses and restore symmetric relay oscillationshave been available.4-6 These methods use iterative adjust-ments of input and/or output bias.
The asymmetric response has additional information aboutthe process steady state gain in addition to the ultimateinformation when the relay feedback test is started from theinitial steady state condition. Sometimes, the asymmetricresponse is intentionally used instead of the symmetricresponses for this steady state information of the process.5,7
The process steady state gain information can be used toobtain a first order plus time delay (FOPTD) model. Wanget al.7 derived exact expressions relating the parameters ofthe FOPTD process to the measured point data of the relayresponse and presented a method to extract the modelparameters of the FOPTD model.
Some simple single loop controllers can employ thisasymmetric response with their own correlation rules. Theirtuning results are somewhat poor because the estimatedultimate gain and period can be very poor and theircorrelation rules have limited performance. For FOPTDprocesses, the ultimate period errors can be over 50%.5 Here,to reduce these errors, the area method that shows consider-able improvements in estimating the ultimate gain and periodfor the symmetric relay response8 is applied. Four charac-teristic areas are used to find a frequency response and theultimate gain/period of process. When the relay feedback test
is started from the initial steady state, the asymmetricresponse also provides the process steady state gain. Withthis process information at zero frequency, we can obtainthe FOPTD model. Simulations show that the proposedmethod provides a better estimation of ultimate informationand FOPTD models. Considering that relay feedback testsin industry often result in asymmetric responses, the proposedmethod can be effectively applied to improve commercialrelay feedback autotuning systems.
Discussion
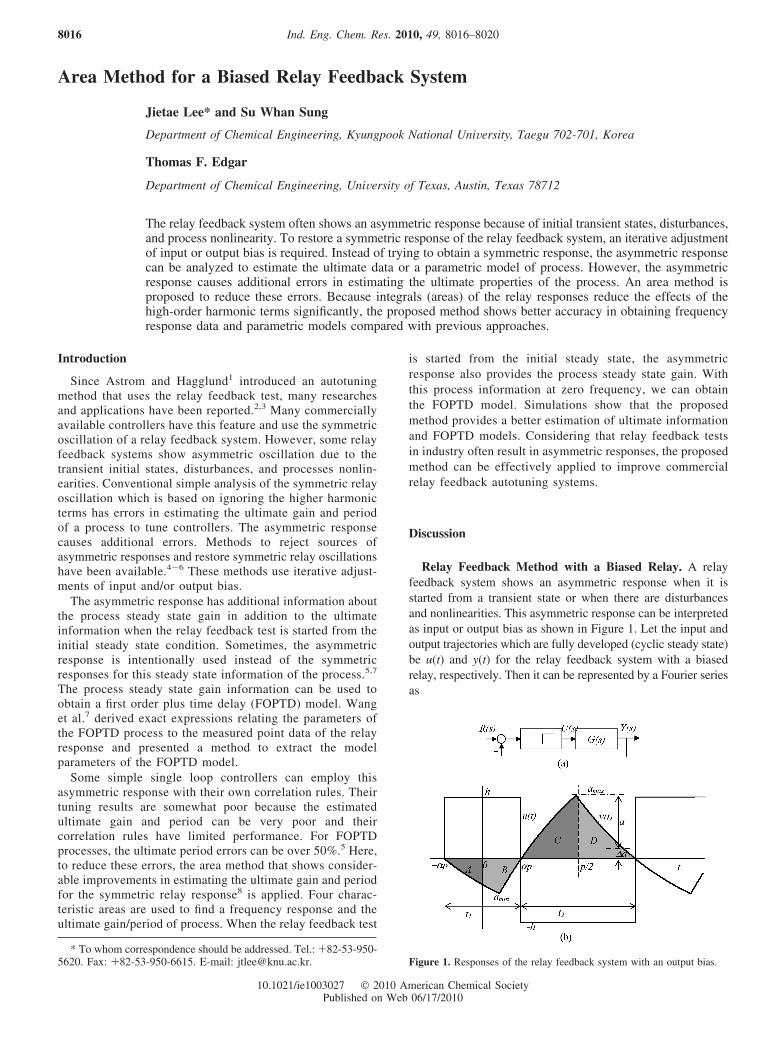
Relay Feedback Method with a Biased Relay. A relayfeedback system shows an asymmetric response when it isstarted from a transient state or when there are disturbancesand nonlinearities. This asymmetric response can be interpretedas input or output bias as shown in Figure 1. Let the input andoutput trajectories which are fully developed (cyclic steady state)be u(t) and y(t) for the relay feedback system with a biasedrelay, respectively. Then it can be represented by a Fourier seriesas
* To whom correspondence should be addressed. Tel.: +82-53-950-5620. Fax: +82-53-950-6615. E-mail: [email protected]. Figure 1. Responses of the relay feedback system with an output bias.
Ind. Eng. Chem. Res. 2010, 49, 8016–80208016
10.1021/ie1003027 2010 American Chemical SocietyPublished on Web 06/17/2010
Here h is the relay amplitude, t1 and t2 are the times of relay onand relay off, respectively; the oscillation period is p ) t1 + t2and ω ) 2π/p is the angular frequency of the relay feedbackoscillation.
For R ) 1/4, the response is symmetric and the asymmetrybecomes more severe as R decreases. The output correspondingto u(t) is
where G(s) is the process transfer function. Neglecting the highharmonic terms and assuming that ∠G(jω) ≈ -π and R ≈ 1/4,we obtain y(t) ≈ y0 - 4h|G(jω)| cos(ωt)/π. Then, the resultingapproximate ultimate period Pu and ultimate gain Kcu are
where amax and amin are the maximum and minimum value ofy(t) as shown in Figure 1, respectively. It should be noted thatthe estimated ultimate period and gain are approximate becausethe high harmonic terms are neglected. As a result, the ultimatedata of eq 3 contain errors.
It is shown5 that for a FOPTD process the ultimate gain erroris relatively constant for a change of R. On the other hand theultimate period error increases considerably as R decreases. Forexample, the ultimate period error is more than 20% forR ) 1/7. These errors may not be acceptable. To reduce theseerrors, a method using the integrals of responses has beenproposed recently for the symmetric response.8 Here this methodis further extended to the asymmetric response.
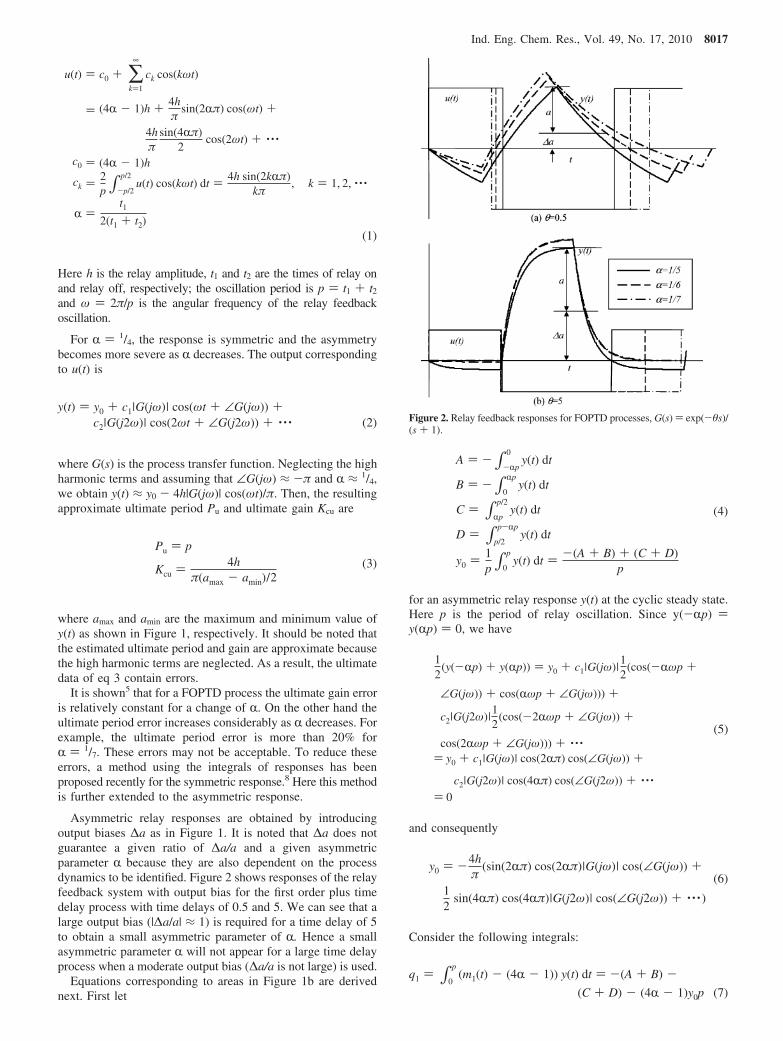
Asymmetric relay responses are obtained by introducingoutput biases ∆a as in Figure 1. It is noted that ∆a does notguarantee a given ratio of ∆a/a and a given asymmetricparameter R because they are also dependent on the processdynamics to be identified. Figure 2 shows responses of the relayfeedback system with output bias for the first order plus timedelay process with time delays of 0.5 and 5. We can see that alarge output bias (|∆a/a| ≈ 1) is required for a time delay of 5to obtain a small asymmetric parameter of R. Hence a smallasymmetric parameter R will not appear for a large time delayprocess when a moderate output bias (∆a/a is not large) is used.
Equations corresponding to areas in Figure 1b are derivednext. First let
for an asymmetric relay response y(t) at the cyclic steady state.Here p is the period of relay oscillation. Since y(-Rp) )y(Rp) ) 0, we have
and consequently
Consider the following integrals:
u(t) ) c0 + ∑k)1
∞
ck cos(kωt)
) (4R - 1)h + 4hπ
sin(2Rπ) cos(ωt) +
4hπ
sin(4Rπ)2
cos(2ωt) + · · ·
c0 ) (4R - 1)h
ck )2p ∫-p/2
p/2u(t) cos(kωt) dt ) 4h sin(2kRπ)
kπ, k ) 1, 2, · · ·
R )t1
2(t1 + t2)(1)
y(t) ) y0 + c1|G(jω)| cos(ωt + ∠G(jω)) +c2|G(j2ω)| cos(2ωt + ∠G(j2ω)) + · · · (2)
Pu ) p
Kcu ) 4hπ(amax - amin)/2
(3)
Figure 2. Relay feedback responses for FOPTD processes, G(s) ) exp(-θs)/(s + 1).
A ) -∫-Rp
0y(t) dt
B ) -∫0
Rpy(t) dt
C ) ∫Rp
p/2y(t) dt
D ) ∫p/2
p-Rpy(t) dt
y0 ) 1p ∫0
py(t) dt ) -(A + B) + (C + D)
p
(4)
12
(y(-Rp) + y(Rp)) ) y0 + c1|G(jω)|12
(cos(-Rωp +
∠G(jω)) + cos(Rωp + ∠G(jω))) +
c2|G(j2ω)|12
(cos(-2Rωp + ∠G(jω)) +
cos(2Rωp + ∠G(jω))) + · · ·) y0 + c1|G(jω)| cos(2Rπ) cos(∠G(jω)) +
c2|G(j2ω)| cos(4Rπ) cos(∠G(j2ω)) + · · ·) 0
(5)
y0 ) -4hπ
(sin(2Rπ) cos(2Rπ)|G(jω)| cos(∠G(jω)) +
12
sin(4Rπ) cos(4Rπ)|G(j2ω)| cos(∠G(j2ω)) + · · · )(6)
q1 ) ∫0
p(m1(t) - (4R - 1)) y(t) dt ) -(A + B) -
(C + D) - (4R - 1)y0p (7)
Ind. Eng. Chem. Res., Vol. 49, No. 17, 2010 8017
where (see Table 1)
Fourier series of the above weighting functions m1(t) and m2(t)are10
Applying the orthogonal characteristics of sinusoidal functions(Appendix A), we have
Estimation of G(jω). From eqs 6 and 13, a quantity that hasno second harmonic term,
can be obtained. From eqs 14 and 15,
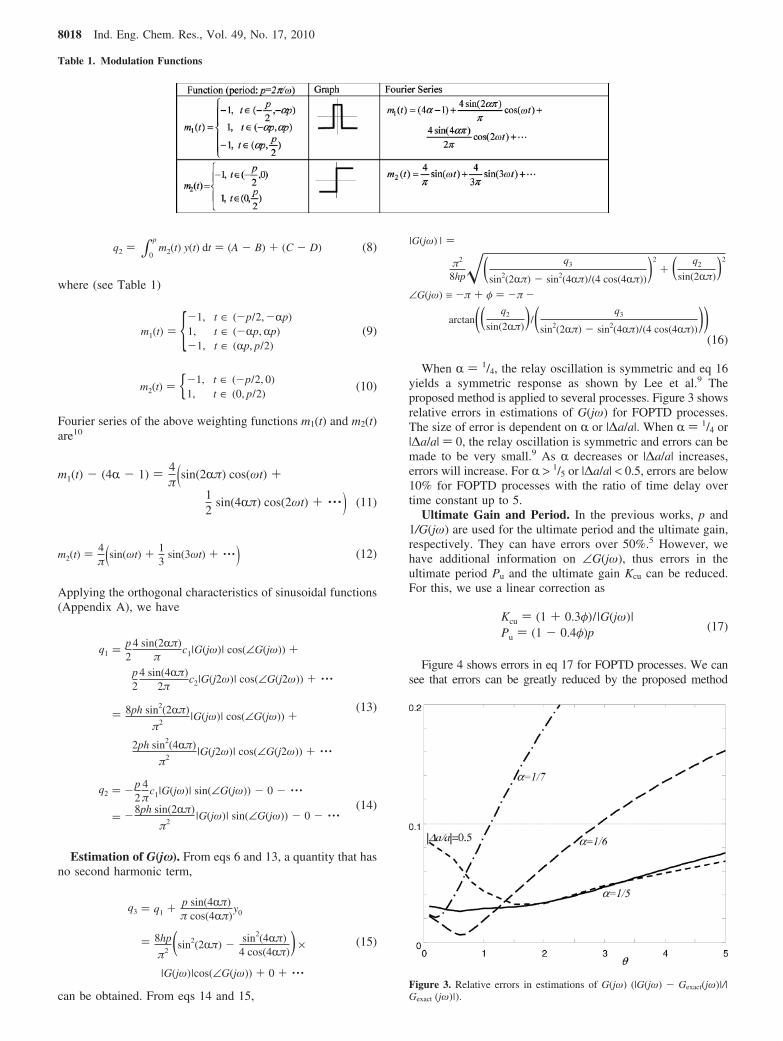
When R ) 1/4, the relay oscillation is symmetric and eq 16yields a symmetric response as shown by Lee et al.9 Theproposed method is applied to several processes. Figure 3 showsrelative errors in estimations of G(jω) for FOPTD processes.The size of error is dependent on R or |∆a/a|. When R ) 1/4 or|∆a/a| ) 0, the relay oscillation is symmetric and errors can bemade to be very small.9 As R decreases or |∆a/a| increases,errors will increase. For R > 1/5 or |∆a/a| < 0.5, errors are below10% for FOPTD processes with the ratio of time delay overtime constant up to 5.
Ultimate Gain and Period. In the previous works, p and1/G(jω) are used for the ultimate period and the ultimate gain,respectively. They can have errors over 50%.5 However, wehave additional information on ∠G(jω), thus errors in theultimate period Pu and the ultimate gain Kcu can be reduced.For this, we use a linear correction as
Figure 4 shows errors in eq 17 for FOPTD processes. We cansee that errors can be greatly reduced by the proposed method
Table 1. Modulation Functions
q2 ) ∫0
pm2(t) y(t) dt ) (A - B) + (C - D) (8)
m1(t) ) {-1, t ∈ (-p/2,-Rp)1, t ∈ (-Rp,Rp)-1, t ∈ (Rp, p/2)
(9)
m2(t) ) {-1, t ∈ (-p/2, 0)1, t ∈ (0, p/2)
(10)
m1(t) - (4R - 1) ) 4π(sin(2Rπ) cos(ωt) +
12
sin(4Rπ) cos(2ωt) + · · · ) (11)
m2(t) )4π(sin(ωt) + 1
3sin(3ωt) + · · · ) (12)
q1 )p2
4 sin(2Rπ)π
c1|G(jω)| cos(∠G(jω)) +
p2
4 sin(4Rπ)2π
c2|G(j2ω)| cos(∠G(j2ω)) + · · ·
) 8ph sin2(2Rπ)
π2|G(jω)| cos(∠G(jω)) +
2ph sin2(4Rπ)
π2|G(j2ω)| cos(∠G(j2ω)) + · · ·
(13)
q2 ) -p2
4π
c1|G(jω)| sin(∠G(jω)) - 0 - · · ·
) -8ph sin(2Rπ)
π2|G(jω)| sin(∠G(jω)) - 0 - · · ·
(14)
q3 ) q1 + p sin(4Rπ)π cos(4Rπ)
y0
) 8hp
π2 (sin2(2Rπ) - sin2(4Rπ)4 cos(4Rπ)) ×
|G(jω)|cos(∠G(jω)) + 0 + · · ·
(15)
|G(jω) | )
π2
8hp�( q3
sin2(2Rπ) - sin2(4Rπ)/(4 cos(4Rπ)))2
+ ( q2
sin(2Rπ))2
∠G(jω) ≡ -π + φ ) -π -
arctan(( q2
sin(2Rπ))/( q3
sin2(2Rπ) - sin2(4Rπ)/(4 cos(4Rπ))))(16)
Figure 3. Relative errors in estimations of G(jω) (|G(jω) - Gexact(jω)|/|Gexact (jω)|).
Kcu ) (1 + 0.3φ)/ |G(jω)|Pu ) (1 - 0.4φ)p (17)
8018 Ind. Eng. Chem. Res., Vol. 49, No. 17, 2010
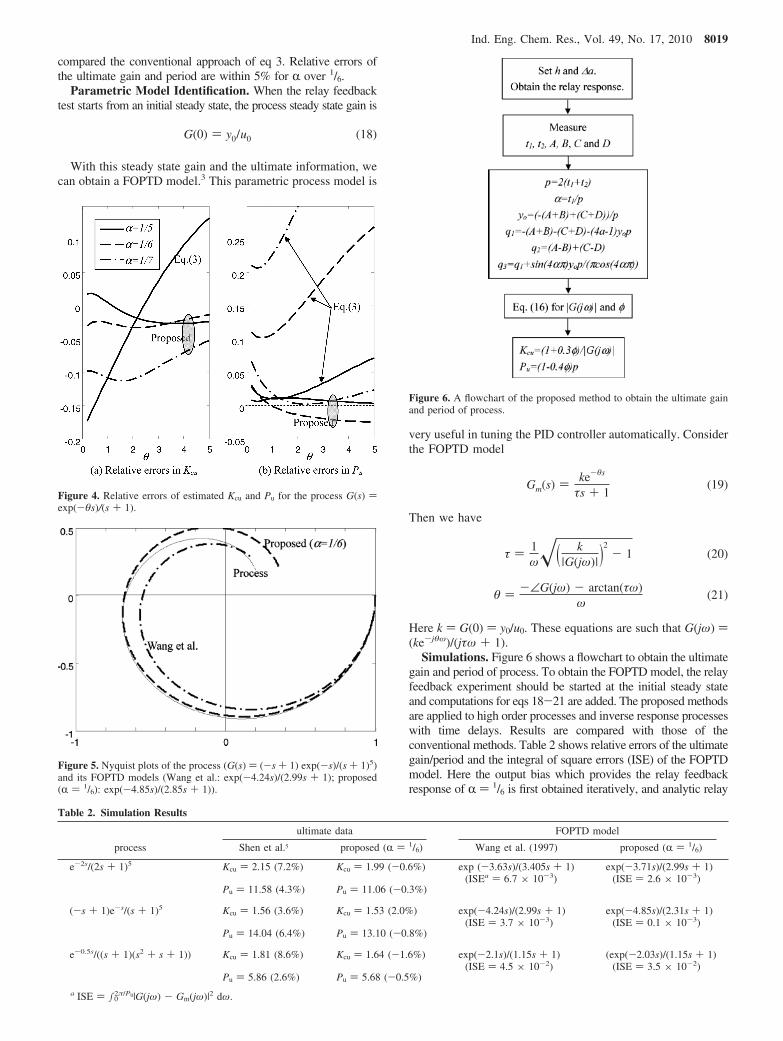
compared the conventional approach of eq 3. Relative errors ofthe ultimate gain and period are within 5% for R over 1/6.
Parametric Model Identification. When the relay feedbacktest starts from an initial steady state, the process steady state gain is
With this steady state gain and the ultimate information, wecan obtain a FOPTD model.3 This parametric process model is
very useful in tuning the PID controller automatically. Considerthe FOPTD model
Then we have
Here k ) G(0) ) y0/u0. These equations are such that G(jω) )(ke-jθω)/(jτω + 1).
Simulations. Figure 6 shows a flowchart to obtain the ultimategain and period of process. To obtain the FOPTD model, the relayfeedback experiment should be started at the initial steady stateand computations for eqs 18-21 are added. The proposed methodsare applied to high order processes and inverse response processeswith time delays. Results are compared with those of theconventional methods. Table 2 shows relative errors of the ultimategain/period and the integral of square errors (ISE) of the FOPTDmodel. Here the output bias which provides the relay feedbackresponse of R ) 1/6 is first obtained iteratively, and analytic relay
Figure 4. Relative errors of estimated Kcu and Pu for the process G(s) )exp(-θs)/(s + 1).
Figure 5. Nyquist plots of the process (G(s) ) (-s + 1) exp(-s)/(s + 1)5)and its FOPTD models (Wang et al.: exp(-4.24s)/(2.99s + 1); proposed(R ) 1/6): exp(-4.85s)/(2.85s + 1)).
Table 2. Simulation Results
ultimate data FOPTD model
process Shen et al.5 proposed (R ) 1/6) Wang et al. (1997) proposed (R ) 1/6)
e-2s/(2s + 1)5 Kcu ) 2.15 (7.2%) Kcu ) 1.99 (-0.6%) exp (-3.63s)/(3.405s + 1)(ISEa ) 6.7 × 10⁻³)
exp(-3.71s)/(2.99s + 1)(ISE ) 2.6 × 10⁻³)
Pu ) 11.58 (4.3%) Pu ) 11.06 (-0.3%)
(-s + 1)e-s/(s + 1)5 Kcu ) 1.56 (3.6%) Kcu ) 1.53 (2.0%) exp(-4.24s)/(2.99s + 1)(ISE ) 3.7 × 10⁻³)
exp(-4.85s)/(2.31s + 1)(ISE ) 0.1 × 10⁻³)
Pu ) 14.04 (6.4%) Pu ) 13.10 (-0.8%)
e-0.5s/((s + 1)(s2 + s + 1)) Kcu ) 1.81 (8.6%) Kcu ) 1.64 (-1.6%) exp(-2.1s)/(1.15s + 1)(ISE ) 4.5 × 10⁻²)
(exp(-2.03s)/(1.15s + 1)(ISE ) 3.5 × 10⁻²)
Pu ) 5.86 (2.6%) Pu ) 5.68 (-0.5%)
a ISE ) ∫02π/Pu|G(jω) - Gm(jω)|2 dω.
G(0) ) y0/u0 (18)
Figure 6. A flowchart of the proposed method to obtain the ultimate gainand period of process.
Gm(s) ) ke-θs
τs + 1(19)
τ ) 1ω�( k
|G(jω)| )2- 1 (20)
θ ) -∠G(jω) - arctan(τω)ω
(21)
Ind. Eng. Chem. Res., Vol. 49, No. 17, 2010 8019
responses3 are used for implementation errors such as errors dueto the sampling time. Figure 5 shows Nyquist plots for FOPTDmodels and the process, G(s) ) (-s + 1) exp(-s)/(s + 1).5 Wecan see that the proposed method provides an excellent FOPTDmodel.
Conclusions
A method to reduce errors in estimating the ultimate gain/periodand the FOPTD model from a biased relay feedback response isproposed, which uses four area measurements of the biased relayfeedback response. By removing the effect of the second harmonicterm and reducing the effects of higher harmonic terms withintegration, errors in estimating the frequency response can bereduced considerably. The method can be implemented in com-mercial PID controllers because computations are very simple.
Appendix A: Orthogonality of Trigonometric Functions(Kreyszig, 1999)
For a set of trigonometric functions, {1, cos (ωt), cos(2ωt), ..., sin (ωt), sin (2ωt), ...}, we have
for p ) 2π/ω. Applying these, we can obtain simple equationsfor integrals such as
for functions of f(t) ) R0 + R1 cos (ωt) + �1 sin (ωt) + R2 cos(2ωt) + �2 sin (2ωt) + · · · and g(t) ) �a cos(mωt) +�b sin(mωt).
Literature Cited
(1) Astrom, K. J.; Hagglund, T. Automatic tuning of simple regulatorswith specifications on phase and amplitude margins. Automatica 1984, 20,645.
(2) Astrom, K. J.; Hagglund, T. PID Controllers; Instrument Societyof America: Research Triangle Park, NC, 1995.
(3) Yu, C. C. Autotuning of PID Controllers: A Relay FeedbackApproach; Springer: London, 2006.
(4) Hang, C. C.; Astrom, K. J.; Ho, W. K. Relay auto-tuning in thepresence of static load disturbance. Automatica 1993, 29, 563.
(5) Shen, S. H.; Wu, J. S.; Yu, C. C. Use of biased relay feedback methodfor system identification. AIChE J. 1996, 42, 1174.
(6) Sung, S. W.; Lee, J. Relay feedback method under large staticdisturbances. Automatica 2006, 42, 353.
(7) Wang, Q. G.; Hang, C. C.; Zou, B. Low-order modeling from relayfeedback. Ind. Eng. Chem. Res. 1997, 36, 375–381.
(8) Lee, J.; Sung, S. W.; Edgar, T. F. Integrals of relay feedbackresponses for extracting process information. AIChE J. 2007, 53, 2329–2338.
(9) Lee, J.; Sung, S. W.; Edgar, T. F. Area methods with relay feedbackresponses. Ind. Eng. Chem Res., published online November 20, 2009, http://dx.doi.org/10.1021/ie901546j.
(10) Kreyszig, E. AdVanced Engineering Mathematics; Wiley: NewYork, 1999.
ReceiVed for reView February 7, 2010ReVised manuscript receiVed April 25, 2010
Accepted June 1, 2010
IE1003027
∫0
psin(nωt) sin(mωt) dt ) {0, n * m
p/2, n ) m∫0
psin(nωt) cos(mωt) dt ) 0
∫0
pcos(nωt) cos(mωt) dt ) {0, n * m
p/2, n ) m * 0p, n ) m ) 0
(A1)
∫0
pf(t) g(t) dt ) p
2Rm�a +
p2
�m�b (A2)
8020 Ind. Eng. Chem. Res., Vol. 49, No. 17, 2010