are we integrating biologic advances in multiple …aihemato.cluster013.ovh.net/aih/documents/des...
TRANSCRIPT

Xavier Leleu
Are We Integrating Biologic Advances in Multiple
Myeloma Into Clinical Practice?
Minimal Residual Disease: A Measurable and Relevant Endpoint
in Treatment
Service d’Hématologie et Thérapie cellulaire Hôpital de la Milètrie, CHU, Poitiers, France

MRD: A Measurable and Relevant Endpoint in Treatment
➢ Depth of response in Myeloma
Are all CR the same
➢ What is MRD
Techniques: NGF vs NGS
Is it just about prolongation of PFS as a surrogate for OS
➢ Prognostic role of MRD
MRD impacts OS
➢ MRD Rate and relevance in current treatment options and strategies
MRD in NDMM
MRD in RRMM
MRD Including high risk MM
➢ Depth of MRD matters
➢Work to do
➢ Conclusion
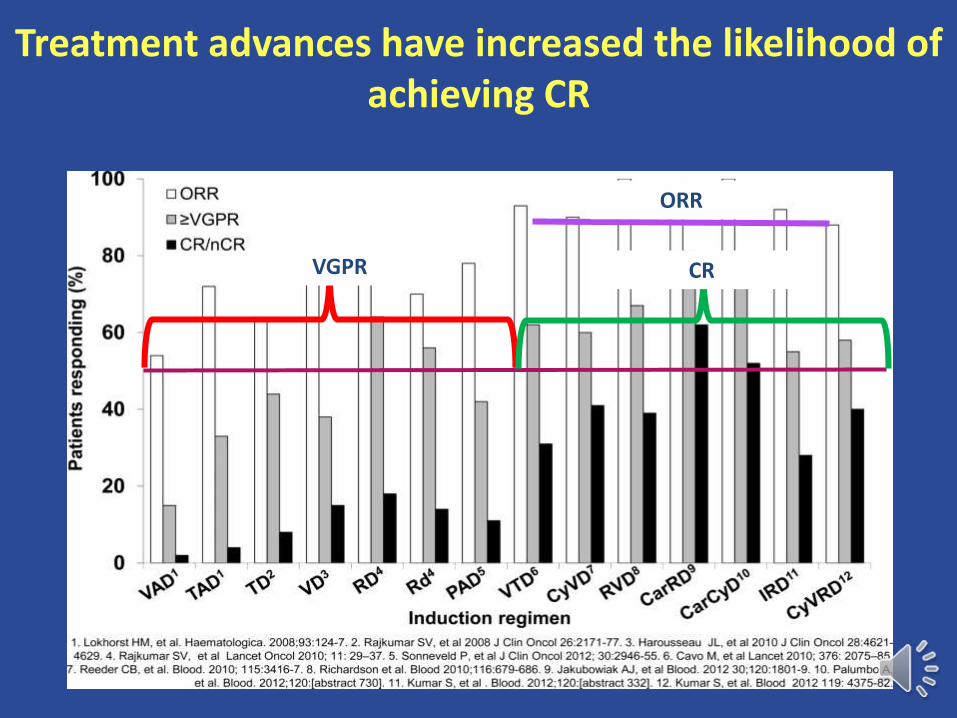
Treatment advances have increased the likelihood of achieving CR
ORR
VGPR CR
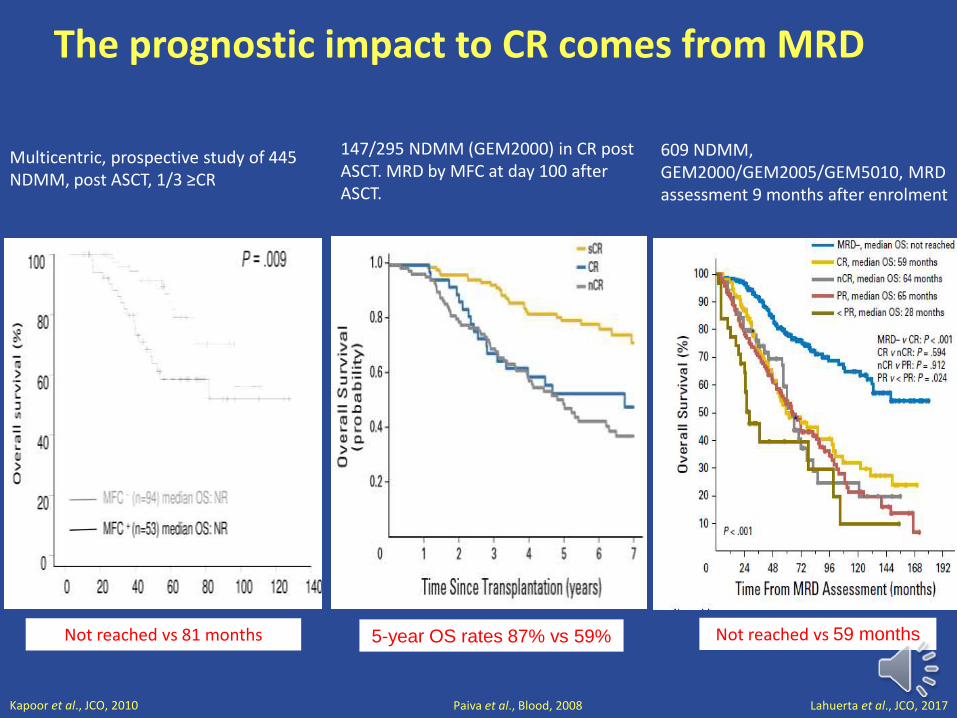
The prognostic impact to CR comes from MRD
Kapoor et al., JCO, 2010 Paiva et al., Blood, 2008
Multicentric, prospective study of 445 NDMM, post ASCT, 1/3 ≥CR
Not reached vs 81 months
P< 0,001
147/295 NDMM (GEM2000) in CR post ASCT. MRD by MFC at day 100 afterASCT.
5-year OS rates 87% vs 59%
Lahuerta et al., JCO, 2017
609 NDMM, GEM2000/GEM2005/GEM5010, MRD assessment 9 months after enrolment
Not reached vs 59 months
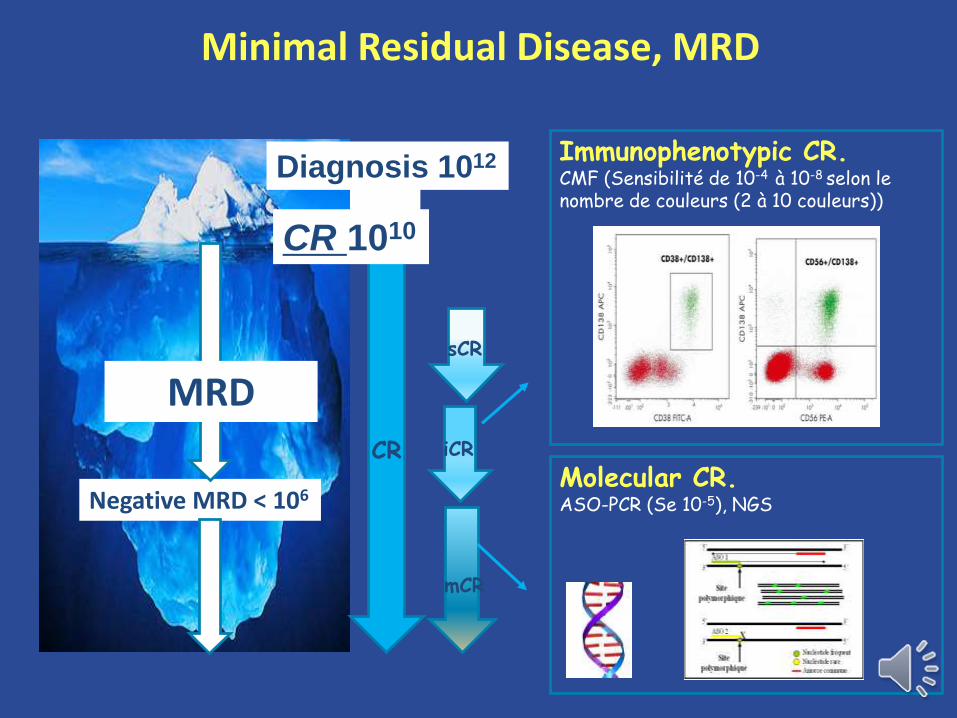
Minimal Residual Disease, MRD
Immunophenotypic CR.CMF (Sensibilité de 10-4 à 10-8 selon le nombre de couleurs (2 à 10 couleurs))
Molecular CR.ASO-PCR (Se 10-5), NGSNegative MRD < 106
sCR
iCR
mCR
CR
Diagnosis 1012
CR 1010
MRD
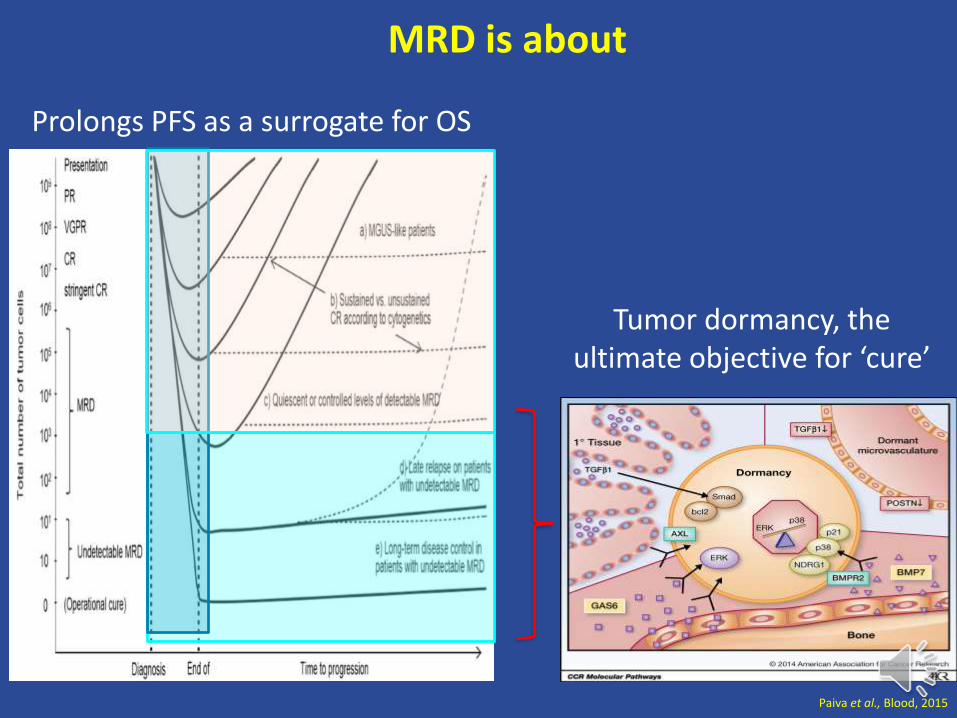
Paiva et al., Blood, 2015
MRD is about
Prolongs PFS as a surrogate for OS
Tumor dormancy, the ultimate objective for ‘cure’
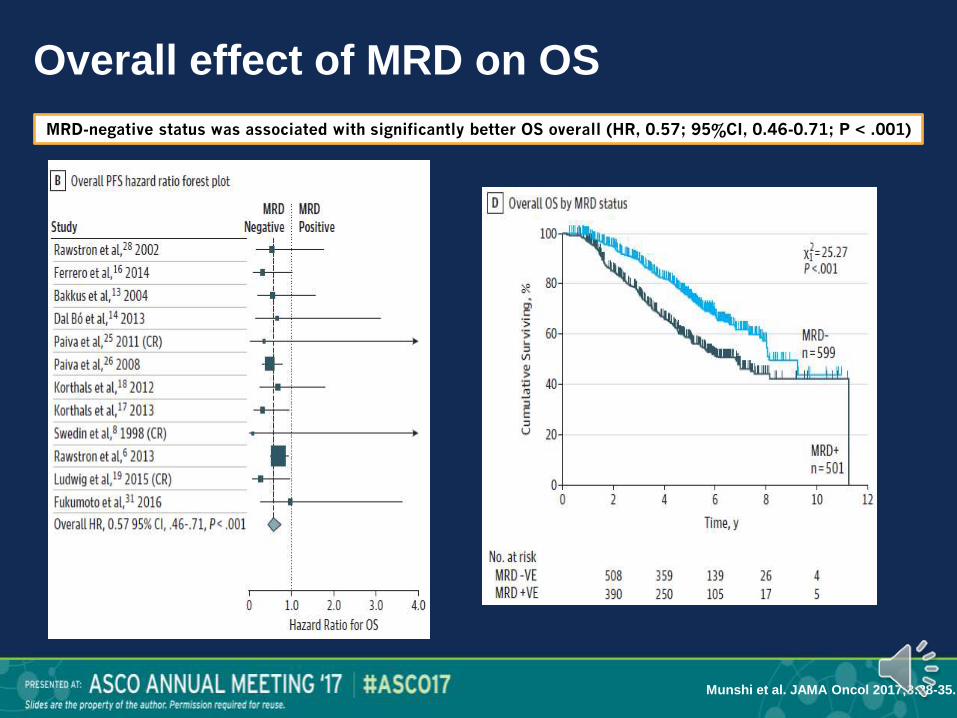
Overall effect of MRD on OS
Munshi et al. JAMA Oncol 2017;3:28-35.
MRD-negative status was associated with significantly better OS overall (HR, 0.57; 95%CI, 0.46-0.71; P < .001)
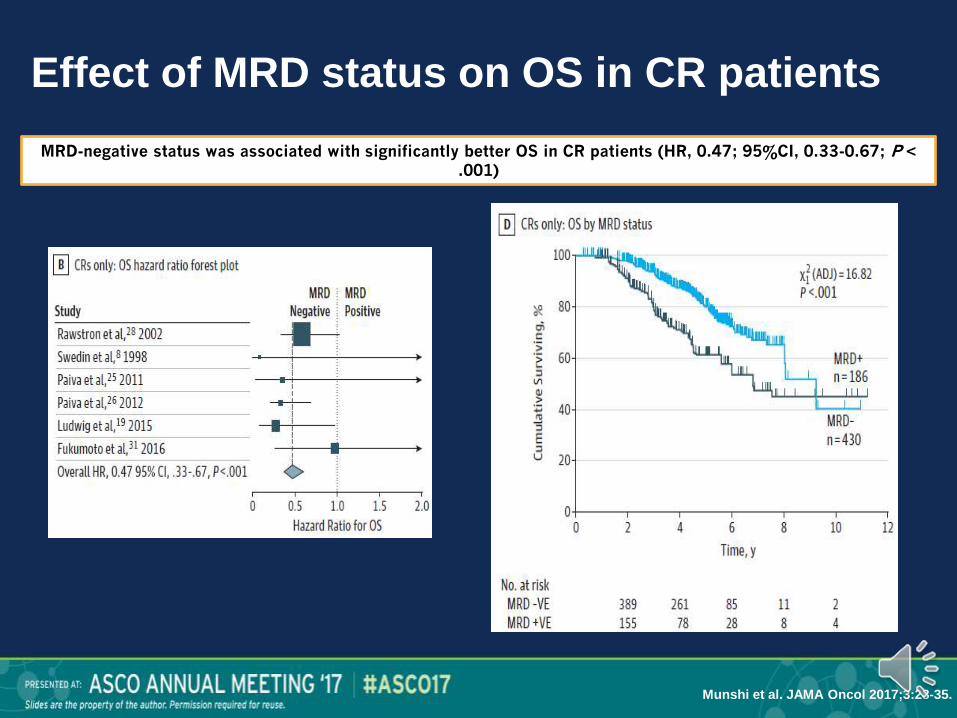
Effect of MRD status on OS in CR patients
MRD-negative status was associated with significantly better OS in CR patients (HR, 0.47; 95%CI, 0.33-0.67; P < .001)
Munshi et al. JAMA Oncol 2017;3:28-35.

IFM 2008
After
induction After ASCT
After
consolidation
Completed
Therapy
n (%) n=31 n=31 n=31 n=31
Negative MRD 4/25 (16) 14/26 (54) 15/26 (58) 21/30 (70)
sCR + CR 7 (23) 14 (45) 15 (48) 18 (58)
≥ VGPR 18 (58) 21 (68) 26 (84) 26 (84)
Roussel et al. JCO 2014
Phase 2. 31 NDMM, VRD x 3 - Transplant - VRD x 2 - Rev 1 year
MRD at 10-4-10-5
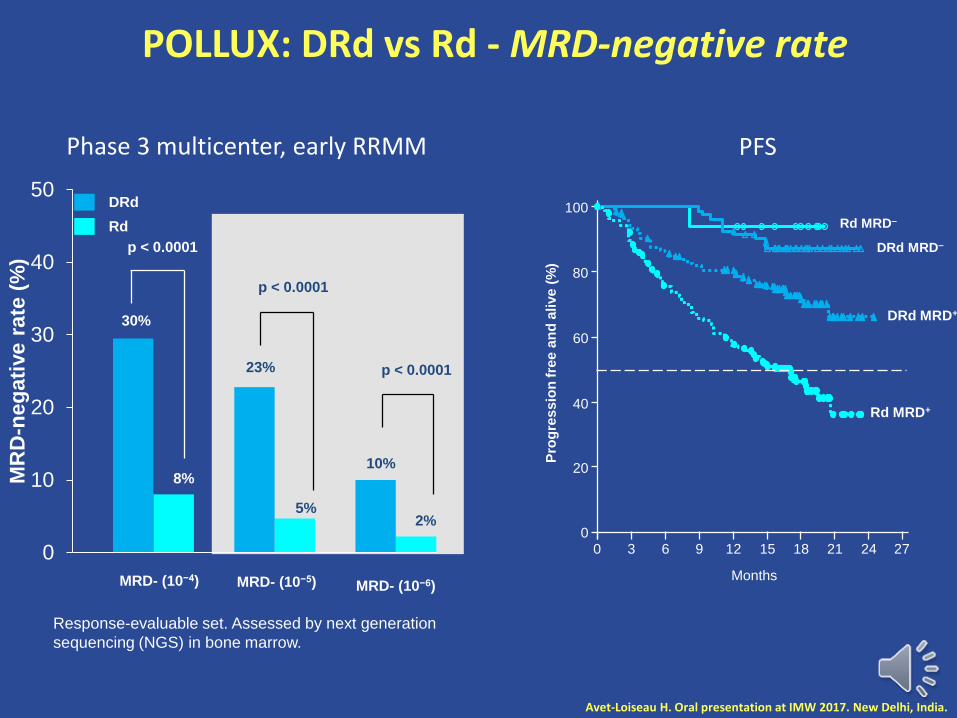
Response-evaluable set. Assessed by next generation
sequencing (NGS) in bone marrow.
Avet-Loiseau H. Oral presentation at IMW 2017. New Delhi, India.
POLLUX: DRd vs Rd - MRD-negative rate
DRd
Rd
0
10
20
30
40
50
MR
D-n
eg
ati
ve
ra
te (
%)
MRD- (10−4) MRD- (10−5) MRD- (10−6)
30%
8%
p < 0.0001
23%
5%
p < 0.0001
10%
2%
p < 0.0001
Pro
gre
ss
ion
fre
e a
nd
alive
(%
)
0
20
40
60
80
100
0 3 6 9 12 15 21 27
Months
2418
Rd MRD–
DRd MRD–
DRd MRD+
Rd MRD+
Phase 3 multicenter, early RRMM PFS
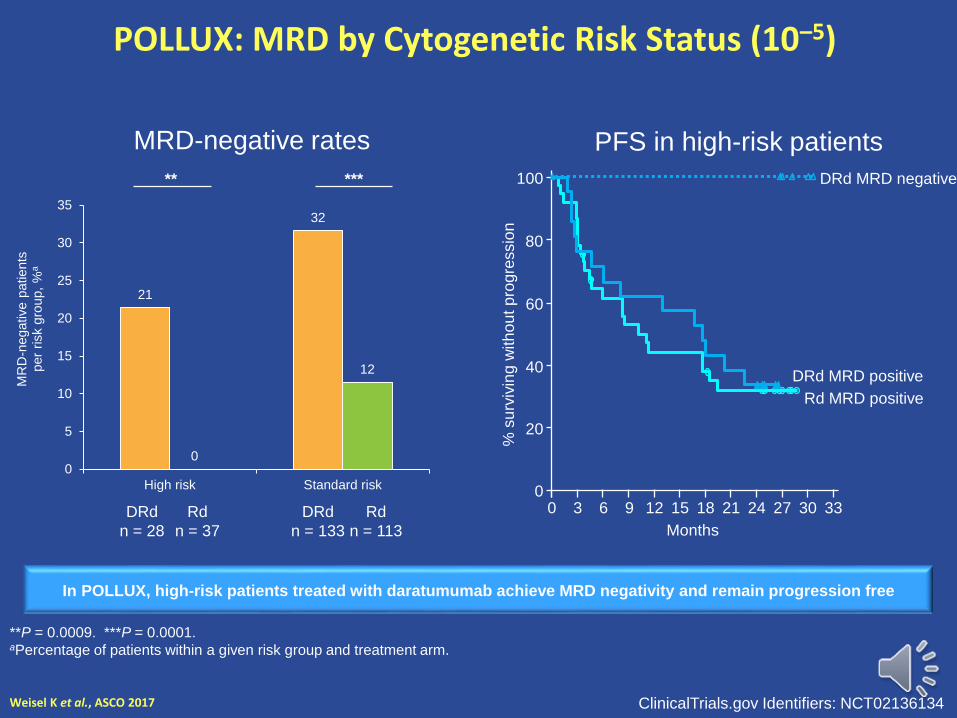
POLLUX: MRD by Cytogenetic Risk Status (10–5)
Weisel K et al., ASCO 2017
**P = 0.0009. ***P = 0.0001. aPercentage of patients within a given risk group and treatment arm.
21
32
0
12
0
5
10
15
20
25
30
35
High risk Standard risk
MR
D-n
egative p
atients
per
risk g
roup,
%a
** ***
DRd
n = 28
Rd
n = 37
DRd
n = 133
Rd
n = 113
MRD-negative rates PFS in high-risk patients
% s
urv
ivin
g w
ith
ou
t p
rogre
ssio
n0
20
40
60
80
100
0 3 6 9 12 15 18 33
Months
21 24
Rd MRD positive
DRd MRD negative
27
DRd MRD positive
30
In POLLUX, high-risk patients treated with daratumumab achieve MRD negativity and remain progression free
ClinicalTrials.gov Identifiers: NCT02136134

P-value (trend) : p<0.0001
<10-6
[10-6;10-5[[10-5;10-4[
>=10-4
0.2
0.3
0.4
0.5
0.6
0.7
0.8
0.9
1.0P
atients
without
progressio
n (
%)
40 40(0) 40(0) 40(0) 33(6) 23(9) 15(6) 4(4) 2(1)[10-4;10
-3[
23 23(0) 23(0) 23(0) 22(1) 19(3) 14(2) 3(5) 2(0)[10-5;10
-4[
29 29(0) 29(0) 29(0) 28(0) 22(5) 16(3) 4(4) 1(1)[10-6;10
-5[
86 86(0) 86(0) 86(0) 86(0) 77(5) 61(3) 36(5) 10(0)<10-6
N at risk(events)
06
1218
2430
3642
48
Months since randomization
MRD at post-maintenance
Phase 3 multicenter, IFM/DFCI 2009, NDMM
Depth of MRD matters
RVDx3
RVD x 2
RVD x 5
Revlimid 12 mos
Melphalan 200mg/m2* +
ASCT
CY (3g/m2) MOBILIZATIONGoal: 5 x10⁶ cells/kg
RVDx3
CY (3g/m2)MOBILIZATIONGoal: 5 x10⁶ cells/kg
Randomize
Revlimid 12 mos
Avet-Loiseau H. Oral presentation at IMW 2017. New Delhi, India.

IFM 2009 trial
Role of treatment
P<0.001
0
25
50
75
100
Pa
tie
nts
(%
)
40 39 34 31 17 1negative MRD_RVD50 47 43 38 23 4negative MRD_Transp66 51 38 21 11 2positive MRD-RVD68 62 49 35 15 1positive MRD-Transplant
N at risk
0 12 24 36 48 60
Time since MRD assessment
positive MRD-Transplant
positive MRD-RVD
negative MRD_Transp
negative MRD_RVD
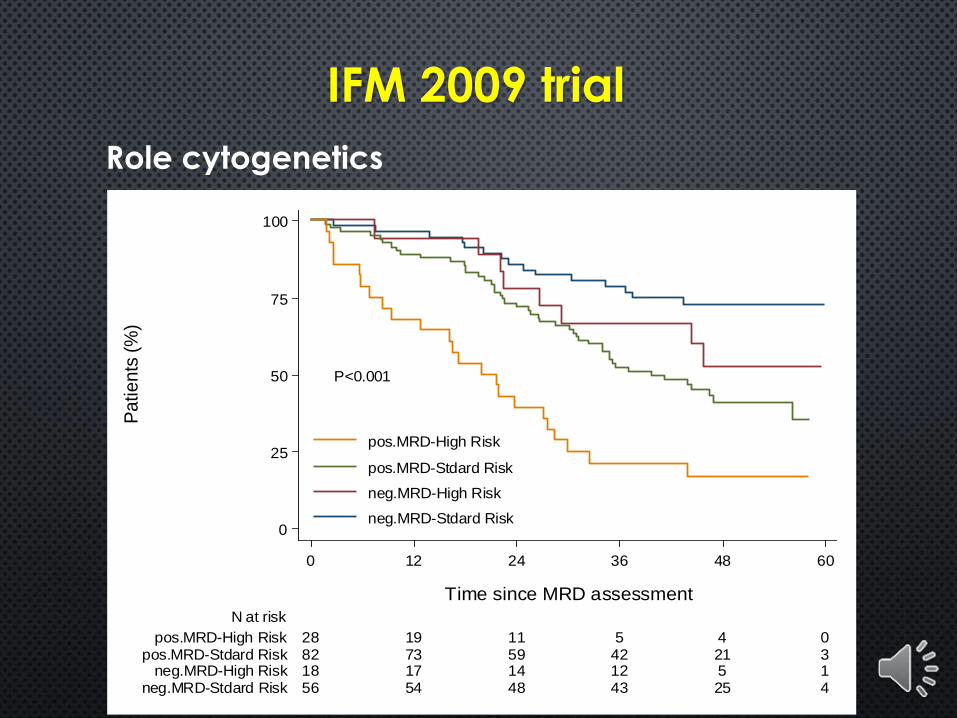
IFM 2009 trial
Role cytogenetics
P<0.001
0
25
50
75
100
Pa
tie
nts
(%
)
56 54 48 43 25 4neg.MRD-Stdard Risk18 17 14 12 5 1neg.MRD-High Risk82 73 59 42 21 3pos.MRD-Stdard Risk28 19 11 5 4 0pos.MRD-High Risk
N at risk
0 12 24 36 48 60
Time since MRD assessment
pos.MRD-High Risk
pos.MRD-Stdard Risk
neg.MRD-High Risk
neg.MRD-Stdard Risk
Keats et al., Blood, 2012
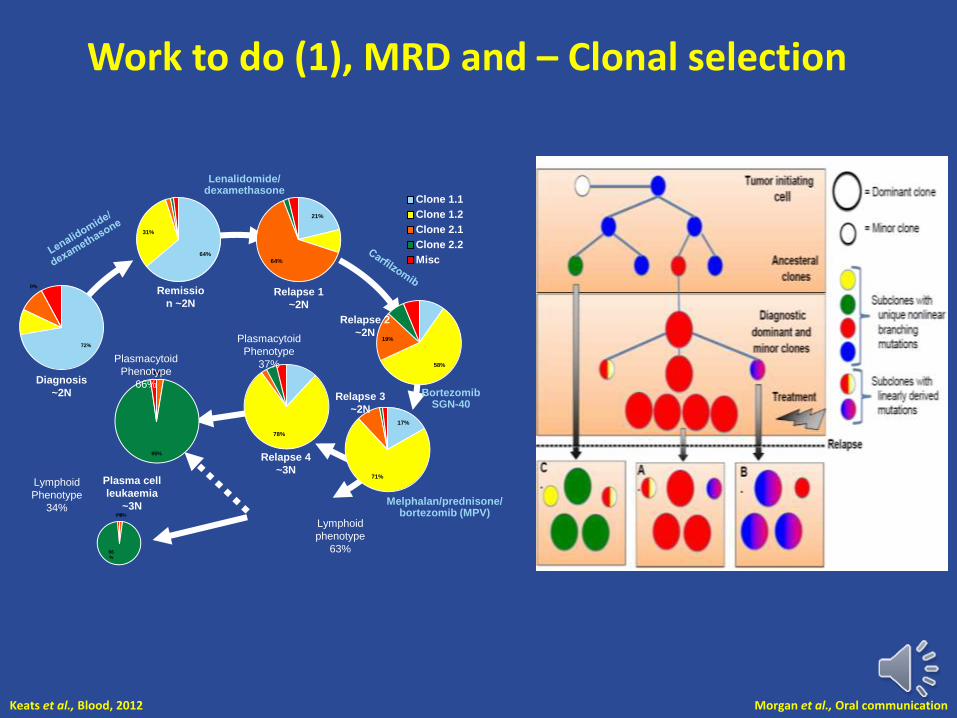
Work to do (1), MRD and – Clonal selection
21%
64%
58%
19%
17%
71%
78%
0%0%
95%
Remissio
n ~2N
Diagnosis
~2N
Relapse 1
~2N
Relapse 2
~2N
Relapse 3
~2N
Plasmacytoid
Phenotype
37%
Relapse 4
~3NPlasma cell
leukaemia
~3N
Lymphoid
Phenotype
34%
Lymphoid
phenotype
63%
Clone 1.1
Clone 1.2
Clone 2.1
Clone 2.2
Misc
Lenalidomide/dexamethasone
Plasmacytoid
Phenotype
66%
Melphalan/prednisone/ bortezomib (MPV)
72%
0%
64%
31%
Bortezomib SGN-40
0%0%
96%
Morgan et al., Oral communication
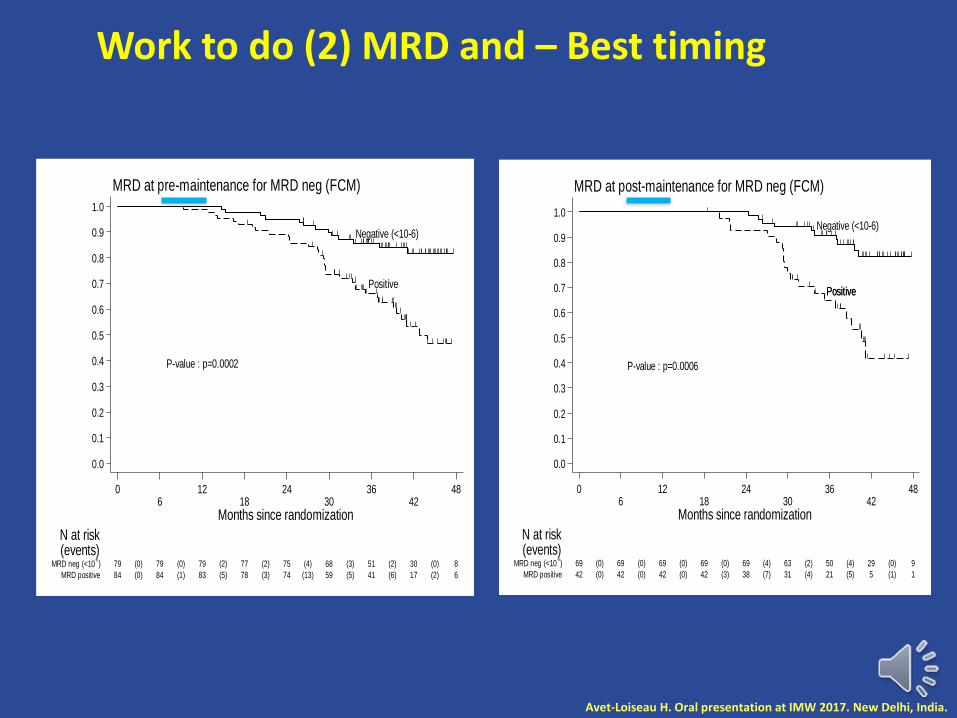
P-value : p=0.0002
Negative (<10-6)
Positive
0.0
0.1
0.2
0.3
0.4
0.5
0.6
0.7
0.8
0.9
1.0
Pa
tients
without
pro
gre
ssio
n (
%)
84 84(0) 83(1) 78(5) 74(3) 59(13) 41(5) 17(6) 6(2)MRD positive
79 79(0) 79(0) 77(2) 75(2) 68(4) 51(3) 30(2) 8(0)MRD neg (<10-6)
N at risk(events)
06
1218
2430
3642
48
Months since randomization
MRD at pre-maintenance for MRD neg (FCM)
Work to do (2) MRD and – Best timing
P-value : p=0.0006
Negative (<10-6)
PositivePositive
0.0
0.1
0.2
0.3
0.4
0.5
0.6
0.7
0.8
0.9
1.0
Pa
tients
without
pro
gre
ssio
n (
%)
42 42(0) 42(0) 42(0) 38(3) 31(7) 21(4) 5(5) 1(1)MRD positive
69 69(0) 69(0) 69(0) 69(0) 63(4) 50(2) 29(4) 9(0)MRD neg (<10-6)
N at risk(events)
06
1218
2430
3642
48
Months since randomization
MRD at post-maintenance for MRD neg (FCM)
Avet-Loiseau H. Oral presentation at IMW 2017. New Delhi, India.
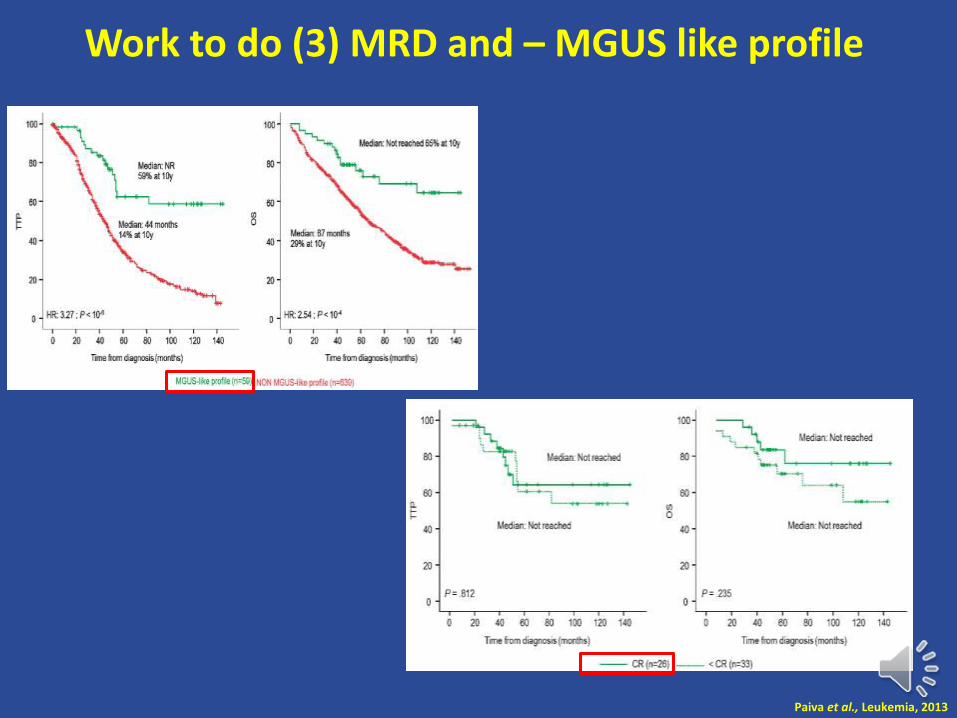
Work to do (3) MRD and – MGUS like profile
Paiva et al., Leukemia, 2013

Work to do (4) MRD study
Zamagni et al, Blood 2011 Moreau et al, Oral communication
Various ways to study the BM, BM sampling, PET CT ….
Thal/dex followed by tandem ASCT IFM 2009/DFCI - Imajem
p=0.000424
Months
Switch PET CT -
Switch PET CT +
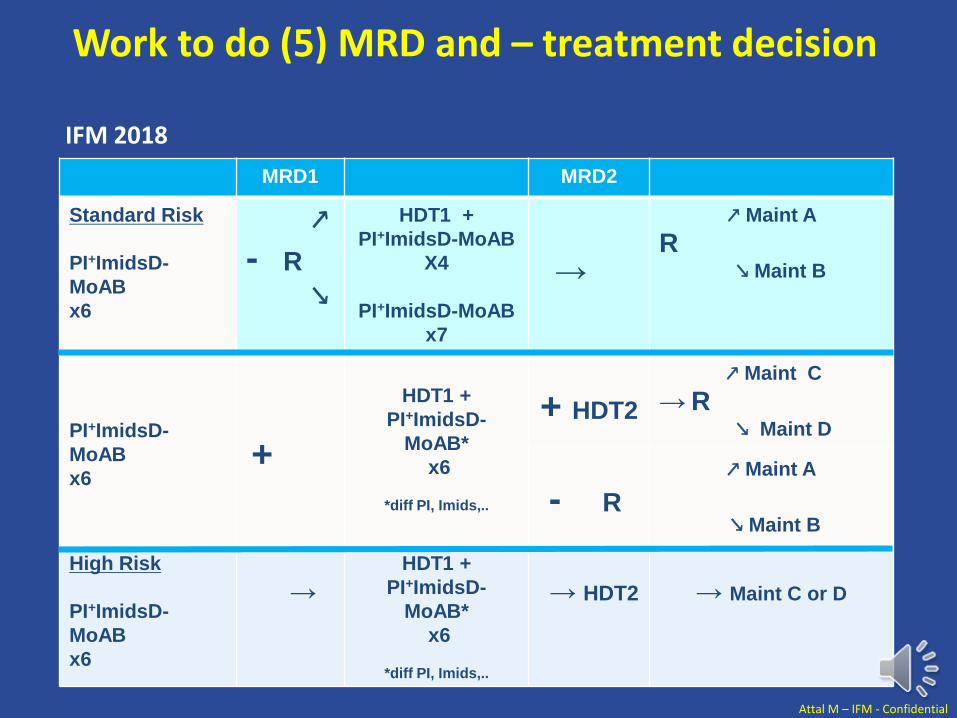
MRD1 MRD2
Standard Risk
PI+ImidsD-
MoAB
x6
PI+ImidsD-
MoAB
x6
↗
- R
↘
HDT1 +
PI+ImidsD-MoAB
X4
PI+ImidsD-MoAB
x7
→
↗ Maint A
R ↘ Maint B
+
HDT1 +
PI+ImidsD-
MoAB*
x6
*diff PI, Imids,..
+ HDT2
↗ Maint C
→ R ↘ Maint D
- R
↗ Maint A
↘ Maint B
High Risk
PI+ImidsD-
MoAB
x6
→HDT1 +
PI+ImidsD-
MoAB*
x6
*diff PI, Imids,..
→ HDT2 → Maint C or D
IFM 2018
Attal M – IFM - Confidential
Work to do (5) MRD and – treatment decision
Minimal Residual Disease Assessment:
Not Relevant for Clinical Practice Yet
Sagar Lonial, MDChair and Professor
Department of Hematology and Medical OncologyChief Medical Officer, Winship Cancer Institute
Emory University School of Medicine
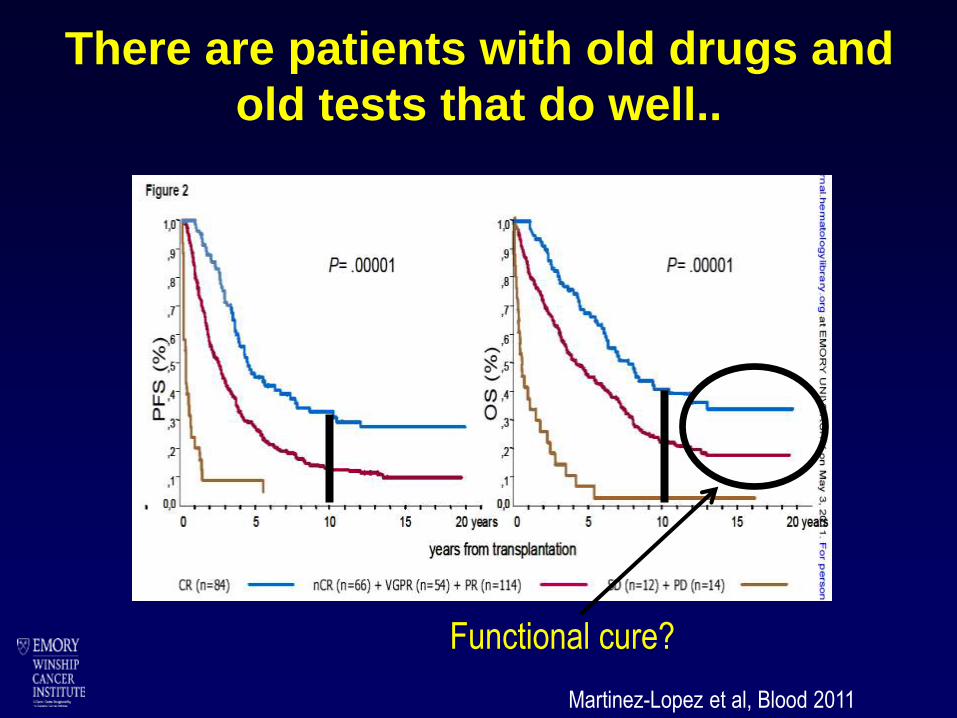
There are patients with old drugs and
old tests that do well..
Martinez-Lopez et al, Blood 2011
Functional cure?
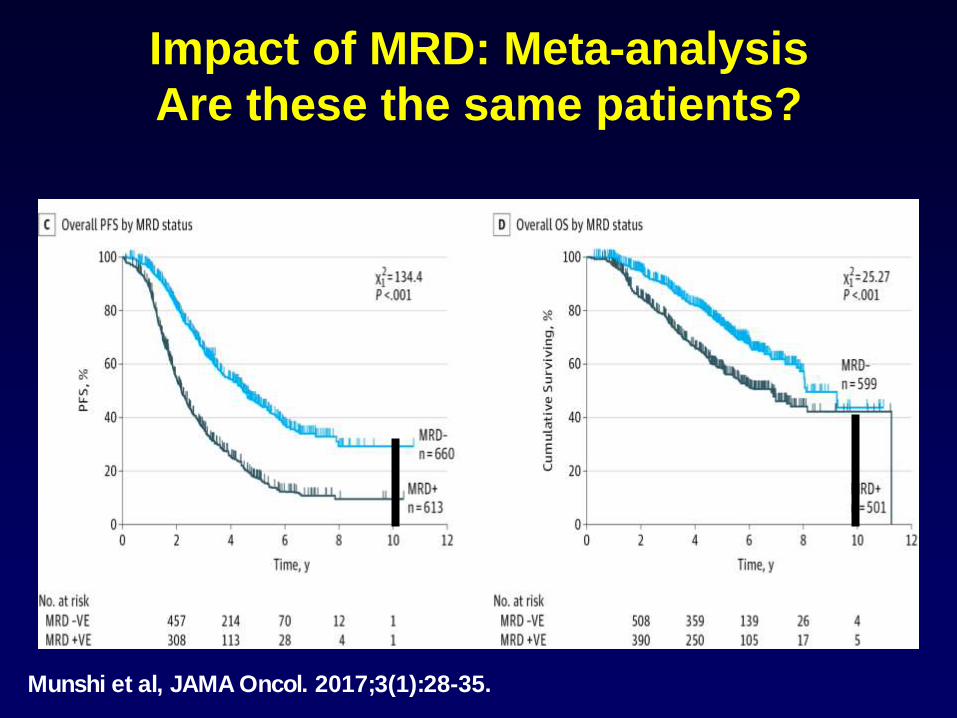
Impact of MRD: Meta-analysis
Are these the same patients?
Munshi et al, JAMA Oncol. 2017;3(1):28-35.

Getting to Minimal Residual Disease
(MRD): New Definitions for CR
S.S. Patient
1×10¹²
Stringent CR
NGS CR 1×10⁻⁶
?Cure?
Disease burden
Newly diagnosed
0.
0
Antibodies
Genomic
Based Tx
CR
MRD Flow CR 1×10⁻⁵

P-value (trend) : p<0.0001
<10-6
[10-6;10-5[
[10-5;10-4[
>=10-4
0.2
0.3
0.4
0.5
0.6
0.7
0.8
0.9
1.0
Pa
tients
without
progressio
n (
%)
79 79(0) 70(9) 59(11) 50(9) 38(11) 28(6) 6(9) 0(3)[10-4;10
-3[
49 49(0) 47(2) 45(2) 43(2) 34(7) 22(4) 8(6) 2(0)[10-5;10
-4[
31 31(0) 30(1) 28(2) 27(0) 22(4) 17(1) 8(2) 4(1)[10-6;10
-5[
87 87(0) 87(0) 85(2) 83(2) 74(6) 54(4) 31(3) 8(0)<10-6
N at risk(events)
06
1218
2430
3642
48
Months since randomization
MRD at pre-maintenance
How you measure MRD impacts the
results
P-value (trend) : p<0.0001
<10-6
[10-6;10-5[[10-5;10-4[
>=10-4
0.2
0.3
0.4
0.5
0.6
0.7
0.8
0.9
1.0
Pa
tients
without
progressio
n (
%)
40 40(0) 40(0) 40(0) 33(6) 23(9) 15(6) 4(4) 2(1)[10-4;10
-3[
23 23(0) 23(0) 23(0) 22(1) 19(3) 14(2) 3(5) 2(0)[10-5;10
-4[
29 29(0) 29(0) 29(0) 28(0) 22(5) 16(3) 4(4) 1(1)[10-6;10
-5[
86 86(0) 86(0) 86(0) 86(0) 77(5) 61(3) 36(5) 10(0)<10-6
N at risk(events)
06
1218
2430
3642
48
Months since randomization
MRD at post-maintenance
Avet-Loiseau et al, ASH 2015
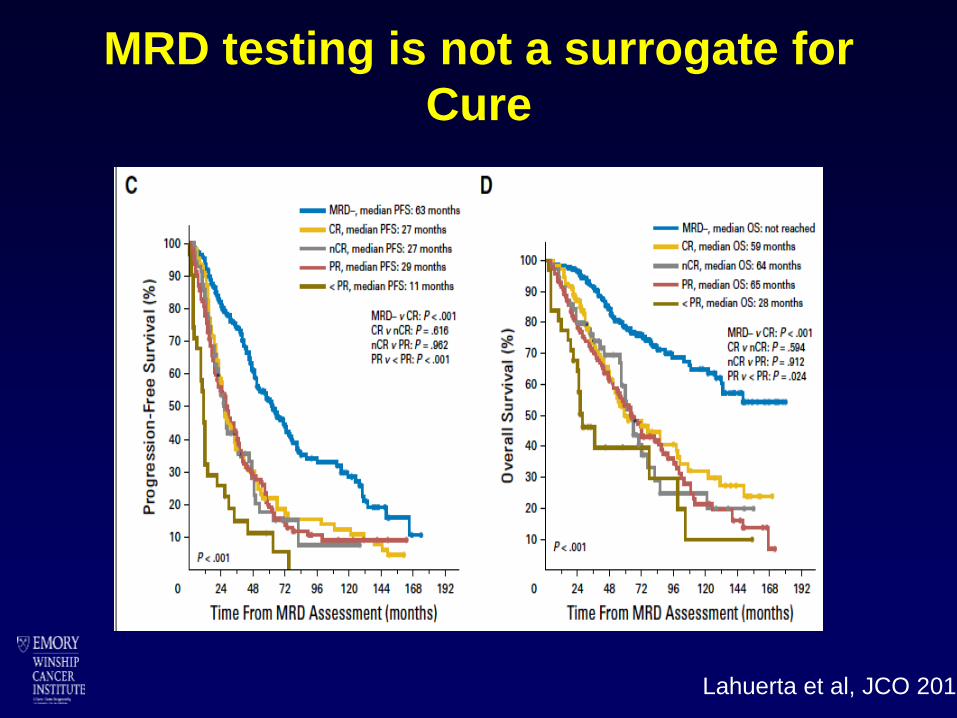
MRD testing is not a surrogate for
Cure
Lahuerta et al, JCO 2017
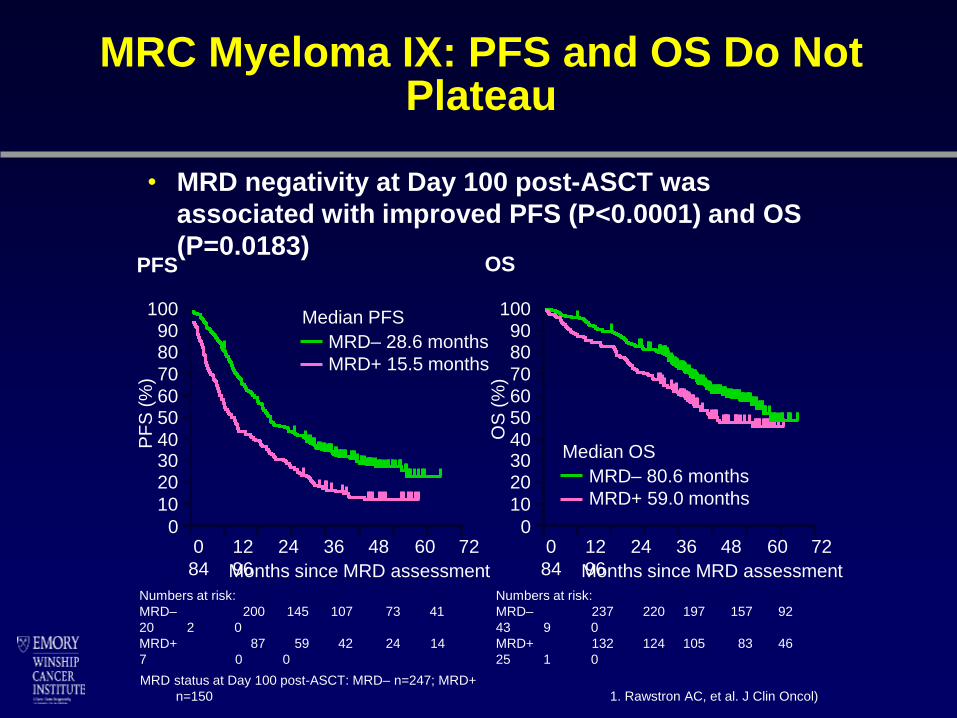
MRC Myeloma IX: PFS and OS Do Not Plateau
• MRD negativity at Day 100 post-ASCT was
associated with improved PFS (P<0.0001) and OS
(P=0.0183)PFS OS
MRD status at Day 100 post-ASCT: MRD– n=247; MRD+
n=150 1. Rawstron AC, et al. J Clin Oncol)
MRD– 28.6 months
MRD+ 15.5 months
PF
S (
%)
Months since MRD assessment
0 12 24 36 48 60 72
84 96
Median PFS1009080
70
6050
403020
10
0
Numbers at risk:
MRD– 200 145 107 73 41
20 2 0
MRD+ 87 59 42 24 14
7 0 0
Months since MRD assessment
0 12 24 36 48 60 72
84 96
OS
(%
)
1009080
70
6050
403020
10
0
MRD– 80.6 months
MRD+ 59.0 months
Median OS
Numbers at risk:
MRD– 237 220 197 157 92
43 9 0
MRD+ 132 124 105 83 46
25 1 0
P-value (trend) : p<0.0001
<10-6
[10-6;10-5[[10-5;10-4[
>=10-4
0.2
0.3
0.4
0.5
0.6
0.7
0.8
0.9
1.0
Pa
tients
without
pro
gre
ssio
n (
%)
40 40(0) 40(0) 40(0) 33(6) 23(9) 15(6) 4(4) 2(1)[10-4;10
-3[
23 23(0) 23(0) 23(0) 22(1) 19(3) 14(2) 3(5) 2(0)[10-5;10
-4[
29 29(0) 29(0) 29(0) 28(0) 22(5) 16(3) 4(4) 1(1)[10-6;10
-5[
86 86(0) 86(0) 86(0) 86(0) 77(5) 61(3) 36(5) 10(0)<10-6
N at risk(events)
06
1218
2430
3642
48
Months since randomization
MRD at post-maintenance
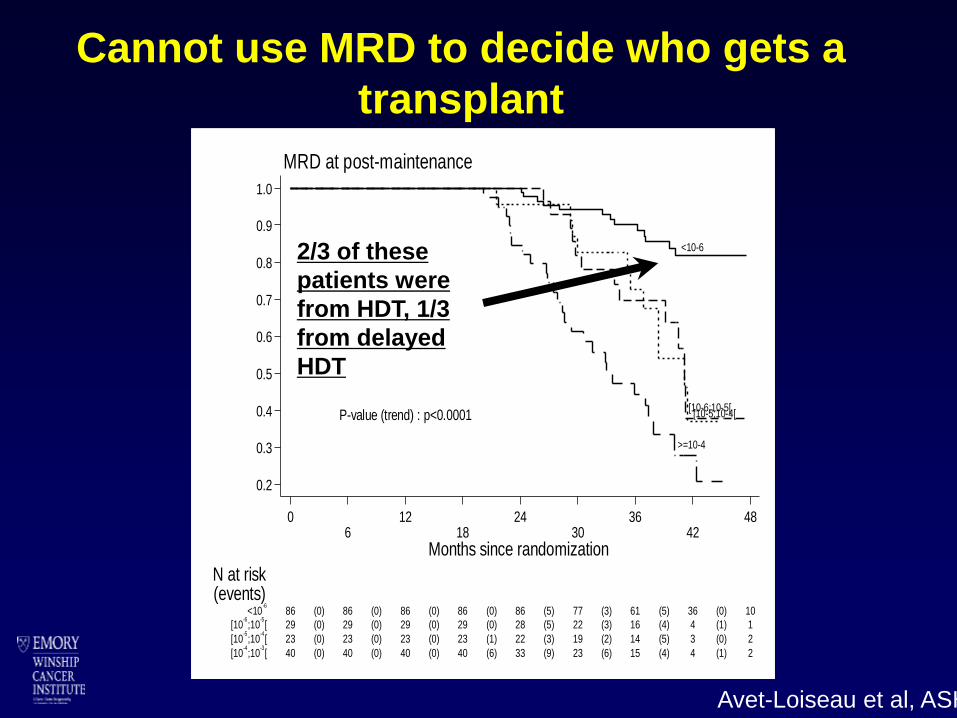
Cannot use MRD to decide who gets a
transplant
2/3 of these
patients were
from HDT, 1/3
from delayed
HDT
Avet-Loiseau et al, ASH 2015
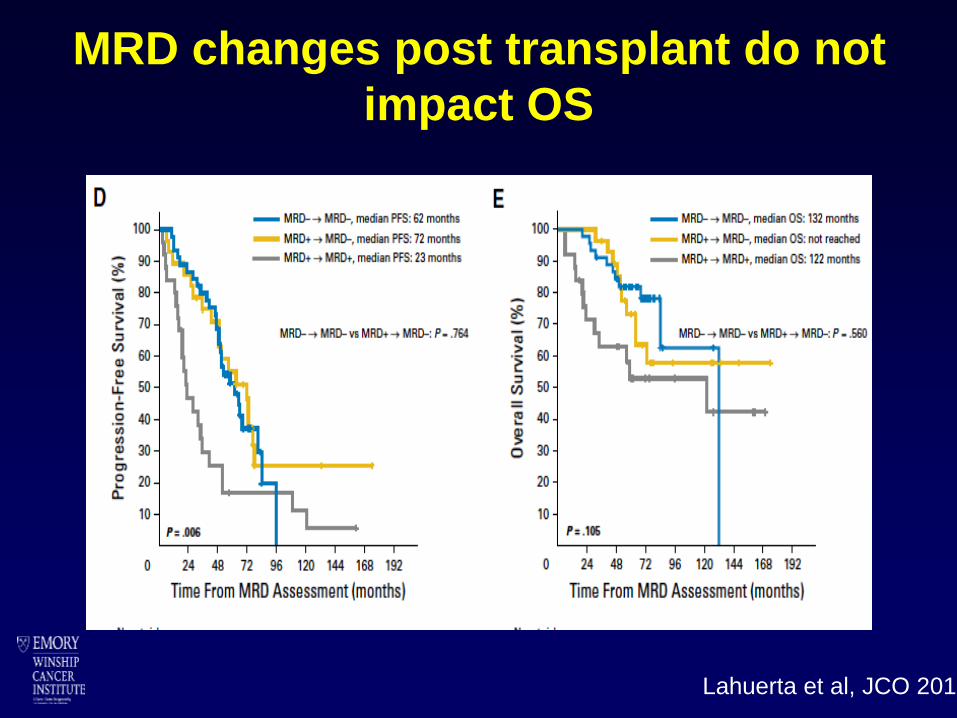
MRD changes post transplant do not
impact OS
Lahuerta et al, JCO 2017
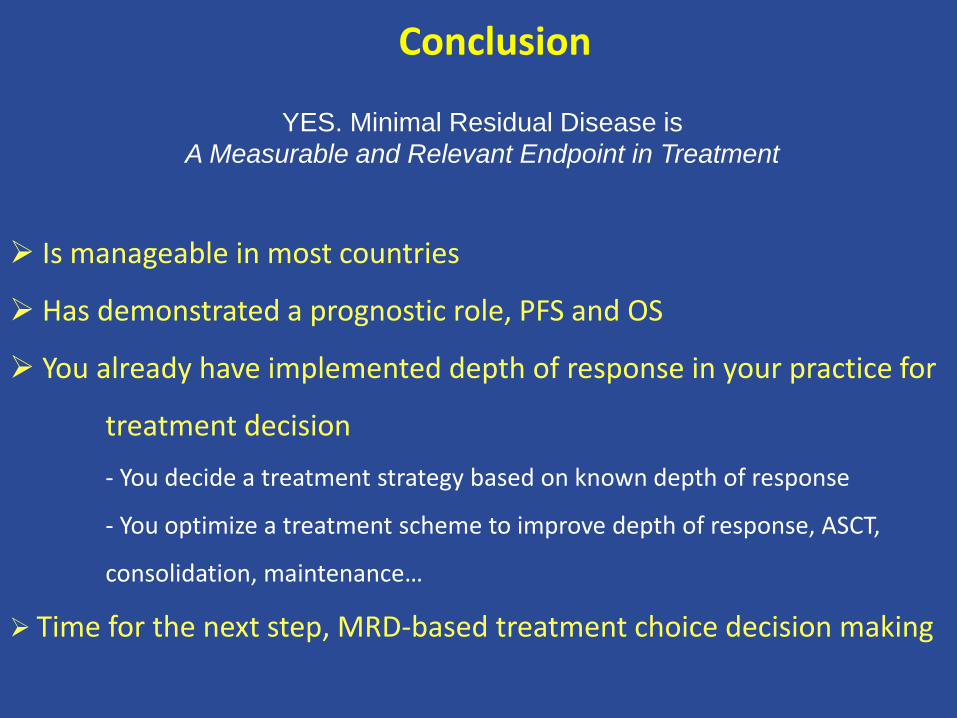
Conclusion
YES. Minimal Residual Disease is
A Measurable and Relevant Endpoint in Treatment
➢ Is manageable in most countries
➢ Has demonstrated a prognostic role, PFS and OS
➢ You already have implemented depth of response in your practice for
treatment decision
- You decide a treatment strategy based on known depth of response
- You optimize a treatment scheme to improve depth of response, ASCT,
consolidation, maintenance…
➢ Time for the next step, MRD-based treatment choice decision making
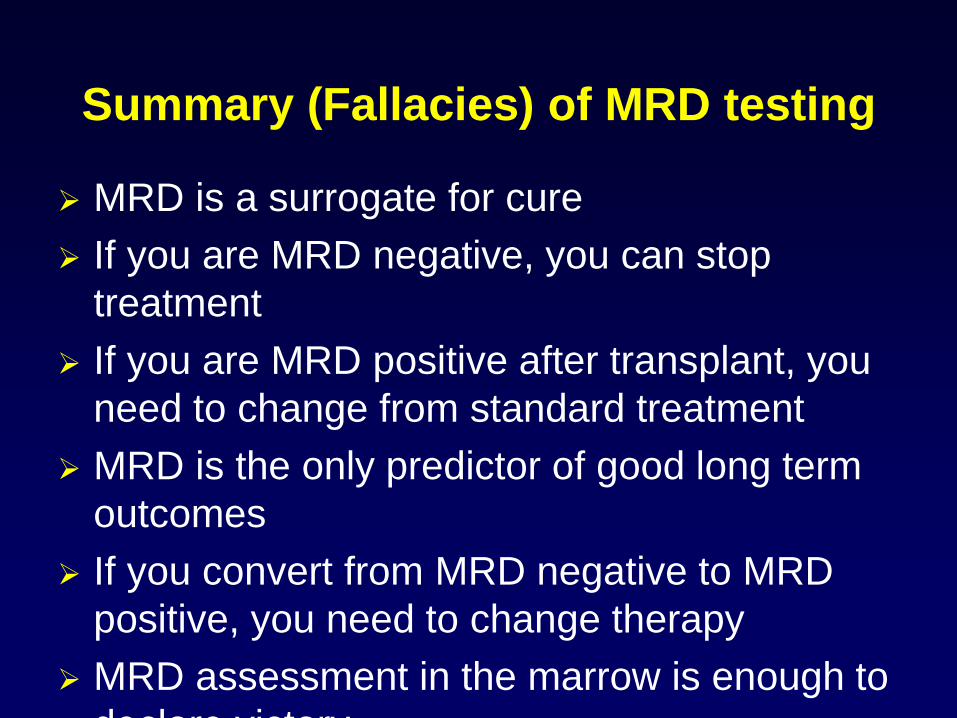
Summary (Fallacies) of MRD testing
➢ MRD is a surrogate for cure
➢ If you are MRD negative, you can stop
treatment
➢ If you are MRD positive after transplant, you
need to change from standard treatment
➢ MRD is the only predictor of good long term
outcomes
➢ If you convert from MRD negative to MRD
positive, you need to change therapy
➢ MRD assessment in the marrow is enough to
declare victory
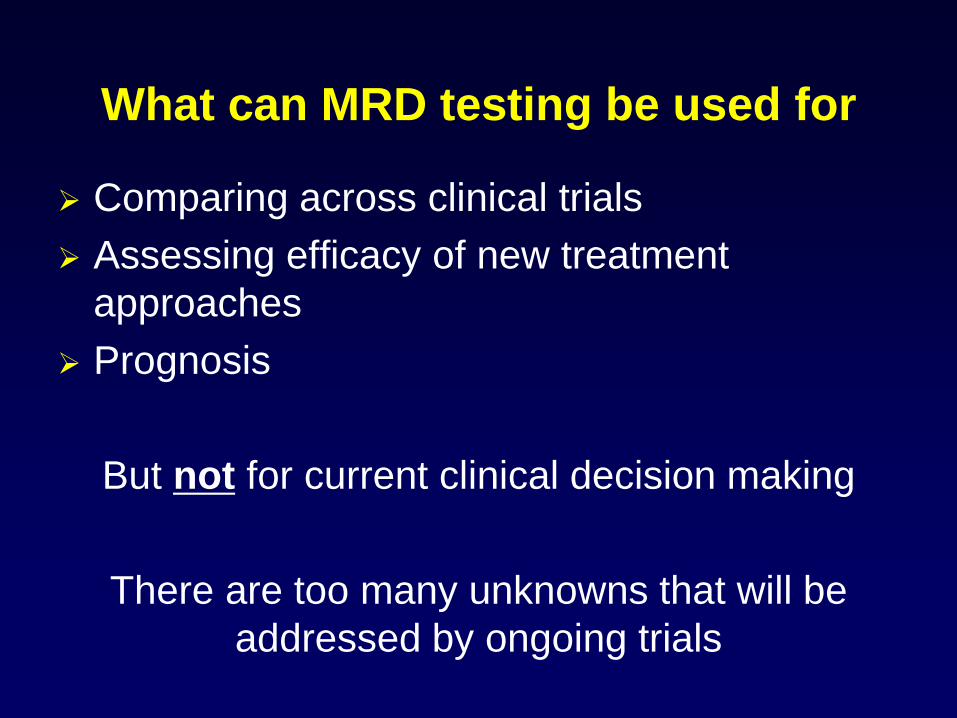
What can MRD testing be used for
➢ Comparing across clinical trials
➢ Assessing efficacy of new treatment
approaches
➢ Prognosis
But not for current clinical decision making
There are too many unknowns that will be
addressed by ongoing trials

Thank you for your attention
Never give up!