are the relations between politicians and administrators ... · 2 1. introduction the relation...
TRANSCRIPT
ARE THE RELATIONS BETWEEN POLITICIANS AND ADMINISTRATORS AT
THE LOCAL LEVEL DETERMINED BY THE DEGREE OF CENTRAL
GOVERNMENT REGULATIONS?
Paper presented ECPR Joint Sessions of Workshops, Grenoble, April 2001
Workshop no. 21: “Local Autonomy and Local Democracy”
Dag Ingvar Jacobsen
Associate Professor
Agder University College
Dept. for Economics and Social Sciences
Servicebox 422
4604 Kristiansand
NORWAY
Tel: + 38 14 15 28
Fax: + 38 14 10 11
E-mail: [email protected]
1st draft.
2
1. INTRODUCTION
The relation between politics and administration – and especially the distribution of
power between the two spheres - is a classic theme in political science since the writings of
Max Weber, Woodrow Wilson and several other prominent writers. Today, it seems as if the
idea of a total separation between a political and an administrative sphere has been
abandoned. Rather than a dichotomy, politics and administration is today seen as two
overlapping spheres.
In practical terms, this notion implies that administrators most probably are important
political actors. An overlapping between politics and administration also opens up for the
possibility that there may be both conflict and co-operation between politicians and
administrators. An interesting question is if this relation to some extent is shaped by central
government regulations. One possible hypothesis is that strong central government will leave
little room for local politicians to make priorities, in short: take political decisions. Strong
regulation may then tilt power in favour of the administration. Administrators follow the rules
outlined by central government, and may use this as an argument against listening to signals
given by local politicians. A possible consequence is that local politicians with responsibility
for a strongly regulated field will feel that the local administration is more powerful than
politicians governing fields with less central government regulations.
Another possible consequence is that strong regulation in fact may decrease conflict
between politics and administration. The argument for this hypothesis is that autonomy may
give more room for conflicting interests. The lack of central government regulations can lead
to a situation where there is no rules or standard procedures on how to handle a possible
conflict between politics and administration.
This article tries to shed some light on these hypotheses through an empirical study,
more specifically a survey including both local politicians and local administrators in
Norwegian municipalities.
2. POLITICS AND ADMINISTRATION – DIFFERENT, BUT INTERTWINED
One of the most prominent traits in modern democracies is the existence of large
administrative bodies, in many instances called bureaucracies. Even if the logic of democracy
– representation, accountability to the people through elections, generalist knowledge – is in
stark contrast to the logic of bureaucracy – expertise, stability, interpretation of laws and rules
– the two also seems to be tightly connected. Bureaucratisation and democratisation are
historically very much parallel processes (Bendix 1964). In today’s democracies, with wide
ranging public responsibilities, the thought of not having large bureaucracies seems very
unrealistic.
For political scientists the relationship between politics and bureaucracy has been an
important topic, firmly rooted in the classical writings of Max Weber in Europe (Gerth &
Mills 1948) and Woodrow Wilson in the United States (Wilson 1887/1992). Both these
writers were more occupied with outlining how the relationship should be, rather than trying
to describe it. Especially Weber emphasised strongly that he operated with “ideal types”,
something that would not be found empirically, but rather to be used as a standard for how
things ought to be.
Reading Weber, one sees that he tries to distinguish between the two spheres – politics
and administration – using several different dimensions. The first dimension regards the logic,
or rationality, in the two spheres. Politics, according to Weber, was all about choosing
between values, i.e. to decide on how things ought to be. This implies that it is not possible to
distinguish empirically between good and bad values, opening up for political conflict and
3
procedural arrangements to reach decisions in situations with diverging interests.
Administration, on the other hand, was all about facts, i.e. finding the best way to reach goals
set by rulers. Factual decisions could be tested empirically, and it could be stated whether they
were wrong or right. The second dimension concerns the main tasks in the two spheres.
Politics should be about specifying values and goals in general laws and rules, while
administration should concentrate on the execution of these laws and rules. The third
dimension was about the type of behaviour in politics and administration. Political behaviour
should be characterised by passion and a willingness to fight for one’s beliefs, implying that
being a politician to some extent should be a vocation. Administrative behaviour should be
characterised by neutrality, impartiality and not including personal feelings and emotions. In
Weber’s own words administrative behaviour should be “sine ira et studio, without scorn or
bias” (Gerth & Mills 1946:95), while political behaviour would be “To take a stand, to be
passionate – ira et studium” (op.cit.:95).
Much of modern research and theorising about the relationship between politics and
administration has focused on deviations from the weberian ideal. One of the first to attack
Webers distinction between values and facts was Herbert Simon in his groundbreaking book
“Administrative behavior” (1976). He argued, among other, that under conditions of
uncertainty it would be impossible to distinguish clearly between facts and values, and that
choosing certain means would in itself have implications for values and goals. Simon did not
totally erase the distinction between fact and values, but argued strongly that many decisions
could be termed as both factual and ethical (op.cit:45-60). In short, he argued that there
always would be a “grey zone” between purely ethical and purely factual decisions, causing
uncertainty on whether a decision should be located in the political or the administrative
sphere. A second attack was set in against the wilsonian ideal that different tasks should be
allocated to the political and the administrative spheres, i.e. that politicians should concentrate
on strategic and principled tasks, while more “technical” tasks should be delegated to the
administration. One of the strong voices against this attempt to make a clear distinction
between political and administrative tasks was Mosher (1982) who argued strongly that it was
impossible to analyse public tasks only in technical (factual) terms. If politics were about the
distribution of scarce resources, almost every public task including the use of discretion
would fall under the heading “politics”. Another type of critique against the clear distinction
between politics and administration focused on the idea that politicians and administrators had
responsibilities for different phases in the public decision processes. Politicians should be in
charge of taking initiatives (setting the agenda), making formal decisions and controlling
these decisions, while administrators should assist in the preparation of decisions as well as in
implementing political decisions. This distinction was one of the topics in the now famous
debate between Finer (1941) and Friedrich (1940). Although both disagreed in many ways,
both of them took as a starting point from a notion that politics could not be separated into
different phases, but rather that the different phases were tightly connected, and concluding
that politics was “a continuous process” (Friedrich 1941: 318).
If the conclusion form these debates are taken to the extreme, one could argue that
there is no distinction between politics and administration whatsoever. Such a conclusion
seems too radical, although specific situations some times may resemble such a situation.
Rather, it seems more plausible that there is a political and an administrative sphere, and that
these spheres can be distinguished both by factual/ethical decisions, principled/technical tasks
and preparation and implementation versus initiative, deciding and controlling. In many
instances, however, the line between these spheres becomes more or less blurred, resulting in
a zone that may be coined as being both administrative and political. This is also the main
point in the writings of James H Svara (1985, 1989, 1990, 1998) where he distinguishes
between tasks that are more or less political.
4
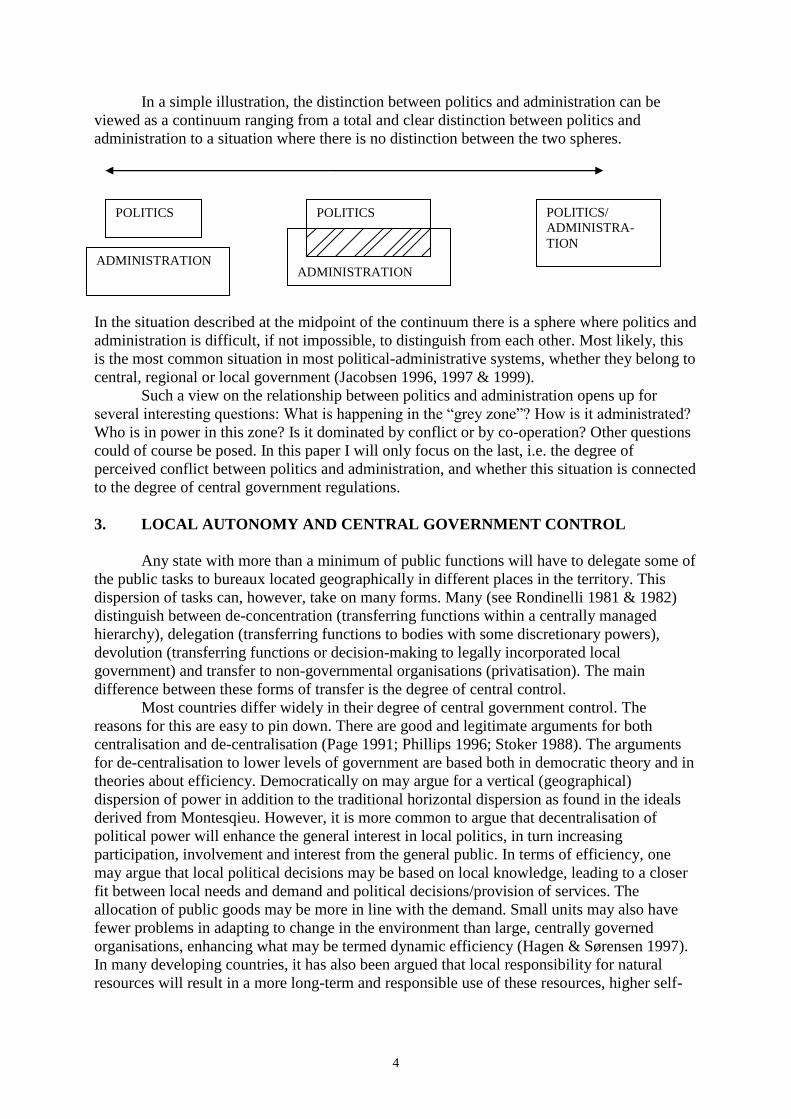
In a simple illustration, the distinction between politics and administration can be
viewed as a continuum ranging from a total and clear distinction between politics and
administration to a situation where there is no distinction between the two spheres.
In the situation described at the midpoint of the continuum there is a sphere where politics and
administration is difficult, if not impossible, to distinguish from each other. Most likely, this
is the most common situation in most political-administrative systems, whether they belong to
central, regional or local government (Jacobsen 1996, 1997 & 1999).
Such a view on the relationship between politics and administration opens up for
several interesting questions: What is happening in the “grey zone”? How is it administrated?
Who is in power in this zone? Is it dominated by conflict or by co-operation? Other questions
could of course be posed. In this paper I will only focus on the last, i.e. the degree of
perceived conflict between politics and administration, and whether this situation is connected
to the degree of central government regulations.
3. LOCAL AUTONOMY AND CENTRAL GOVERNMENT CONTROL
Any state with more than a minimum of public functions will have to delegate some of
the public tasks to bureaux located geographically in different places in the territory. This
dispersion of tasks can, however, take on many forms. Many (see Rondinelli 1981 & 1982)
distinguish between de-concentration (transferring functions within a centrally managed
hierarchy), delegation (transferring functions to bodies with some discretionary powers),
devolution (transferring functions or decision-making to legally incorporated local
government) and transfer to non-governmental organisations (privatisation). The main
difference between these forms of transfer is the degree of central control.
Most countries differ widely in their degree of central government control. The
reasons for this are easy to pin down. There are good and legitimate arguments for both
centralisation and de-centralisation (Page 1991; Phillips 1996; Stoker 1988). The arguments
for de-centralisation to lower levels of government are based both in democratic theory and in
theories about efficiency. Democratically on may argue for a vertical (geographical)
dispersion of power in addition to the traditional horizontal dispersion as found in the ideals
derived from Montesqieu. However, it is more common to argue that decentralisation of
political power will enhance the general interest in local politics, in turn increasing
participation, involvement and interest from the general public. In terms of efficiency, one
may argue that local political decisions may be based on local knowledge, leading to a closer
fit between local needs and demand and political decisions/provision of services. The
allocation of public goods may be more in line with the demand. Small units may also have
fewer problems in adapting to change in the environment than large, centrally governed
organisations, enhancing what may be termed dynamic efficiency (Hagen & Sørensen 1997).
In many developing countries, it has also been argued that local responsibility for natural
resources will result in a more long-term and responsible use of these resources, higher self-
POLITICS
ADMINISTRATION
POLITICS/
ADMINISTRA-
TION
POLITICS
ADMINISTRATION

5
reliance, and that such a local control over natural resources is in line with tradition and
culture (Rondinelli 1992).
But it is just as easy to find legitimate arguments for centralisation. In
democratic terms, many will argue that there is, within any unitary nation, the need for some
standardisation to secure equality (at least on certain criteria) across the whole state. Great
local autonomy may tilt the situation in strong favour of the resourceful local units. In many
countries, the national is also so weak that great local autonomy may end in fragmentation,
and – most radically – in local areas striving for independence (as we see in Spain and
Indonesia, to pick two different countries). From an economic point of view, one may also
argue that decentralisation may result in many small units, each of them being too small to
take advantage of any economies of scale. It has also been argued that many autonomous,
local units may increase the possibility of external effects, for instance if one unit takes
advantage of investments (roads, cultural activities, etc.) made in another unit.
The question, then, is not what is best – centralisation or decentralisation – but rather
how to find a sustainable balance between the two. In most states there is a constant search for
this balance. The result, at any point of time, is that any country may be described as both
centralised and decentralised. Usually, the degree of central control varies between different
public tasks, making the total picture highly differentiated and complex. Different countries
tend to prioritise different tasks in different ways. Some countries may have a policy to keep
primary schooling as identical in all regions as possible, while other countries allow much
more variation in the field of primary schooling, but may be more concerned about
geographical equality regarding health services.
4. LOCAL GOVERNMENT IN NORWAY
Formally, Norway is a three-tier political and administrative system, with national,
regional (19 counties) and local (436 municipalities) levels. The local levels are not founded
in the constitution, but are legally guaranteed through specific laws. Both counties and
municipalities have own incomes through different types of taxes (accounting for
approximately 50% of the total in 1999) and other payments for services (approximately
10%), as well as a significant proportion of their income coming from grants from central
government (approximately 40%). This economic freedom is supported by a political freedom
guaranteed through direct, regular elections to county and municipality councils every four
years. Still, Norway is a unitary state, implying that – formally speaking – national
government still decide what tasks and what powers should be delegated (or relegated from)
to the local levels.
The discussion over local autonomy versus central control has been one of the most
heated during the last fifty years. The arguments are rather easy to identify: representatives of
local government bodies generally argue that central control is to strong, stifling political
activity, the ability to make important political decisions, etc. Representatives of central
government usually use arguments for the opposite, saying that local autonomy in many
instances is too great.
The Norwegian “paradox” seems to be that both arguments may be termed correct.
Page (1991) use two dimensions while discussing the degree of local autonomy, a) the amount
of tasks delegated to local government, and b) the central control with, and regulation of these
tasks through laws, rules and standards for quantity and quality. Norway ranks high on the
first dimension, meaning that many public tasks are located at the local levels and, then, are
the responsibility for local politicians. On the second dimension, Norway score significantly
lower. Especially schooling and health–services are rather strongly regulated by central
government. Hagen & Sørensen (1997) use two other dimensions: c) the possibility to

6
influence revenues (and expenses), and d) size of municipalities/counties (structural
decentralisation measured by number of inhabitants in each municipality). Even if income
from tax is about 50%, the maximum tax level is set by central government, and all
municipalities/counties have set their levels at the maximum. Norway is rather centralised on
this dimension. In some instances, also the expenses are heavily regulated, mostly in the form
of “earmarked” grants. These are grants given to specific purposes, and the specification is
made by central government. On the average, Norwegian municipalities receive
approximately 40% of their income from central government grants, and in year 2000 about
40% of these grants were earmarked (Aftenposten 7.2.2001). On the dimension of structural
decentralisation, Norway seems rather decentralised with not more than an average of slightly
less than 10000 inhabitants per municipality. As a conclusion, Norway is both centralised and
decentralised at the same time. However, combining all the four dimensions, Hagen &
Sørensen (1977:296) range Norway as considerably less centralised than UK, very similar to
other Scandinavian countries, the Netherlands and Ireland, and more centralised than
countries with federal arrangements, like Germany, Switzerland and Austria.
But, as noted earlier, the degree of centralisation in Norway depends largely on what
type of decentralised tasks one is discussing. Central government control and regulation take
many forms, but theoretically one may operate with four different types of regulations:
1) Whether a municipal task is mandated by law (compulsory or not) decided by
parliament or other central government bodies.
2) Whether there are minimum standards for the provision of a service, i.e. concerning
the quantity produced within a municipality.
3) Whether there are written quality standards (specifying for instance educational levels
of nurses, teachers, and others; limiting which book can be used in teaching;
specifying the space available for each pupil, etc.).
4) The amount of “earmarked” grants given by central government, i.e. grants reserved
for a specific service or tasks.
If we concentrate on the municipalities (which will constitute the empirical focus of this
study) the following tasks are the most prominent:
Education, where primary schooling (age 6 to 15 years) is the most important, but also
education for adults and special education (mostly for physically disabled children, but also
for children with psychic disabilities). Kindergartens.
Health services rendered to pupils at primary schools, municipal doctors and physiotherapist.
Social services, where monetary support of clients is the most important, but also including
arrangements for drug-abusers outside institutions (motivation, housing etc) and child-care.
Care for the elderly, including both institutions as well as home based arrangements.
Arrangements for people with psychiatric problems.
“Technical tasks”, such as fire-fighting, water supply, renovation and municipal roads
(maintenance and building).
Cultural tasks, a wide array of tasks including sports arenas and sporting, supporting
voluntary activities, churches and graveyards, musical schools.
Environment, mostly in the form of a consultant or group of consultants to overview the
environmental effects of activities within the municipality.
Activities to increase the establishment of, and growth in private businesses, most usually
restricted to certain types of support and helping activities. In many Norwegian municipalities
this activity is strongly coupled with activities associated with farming.
7
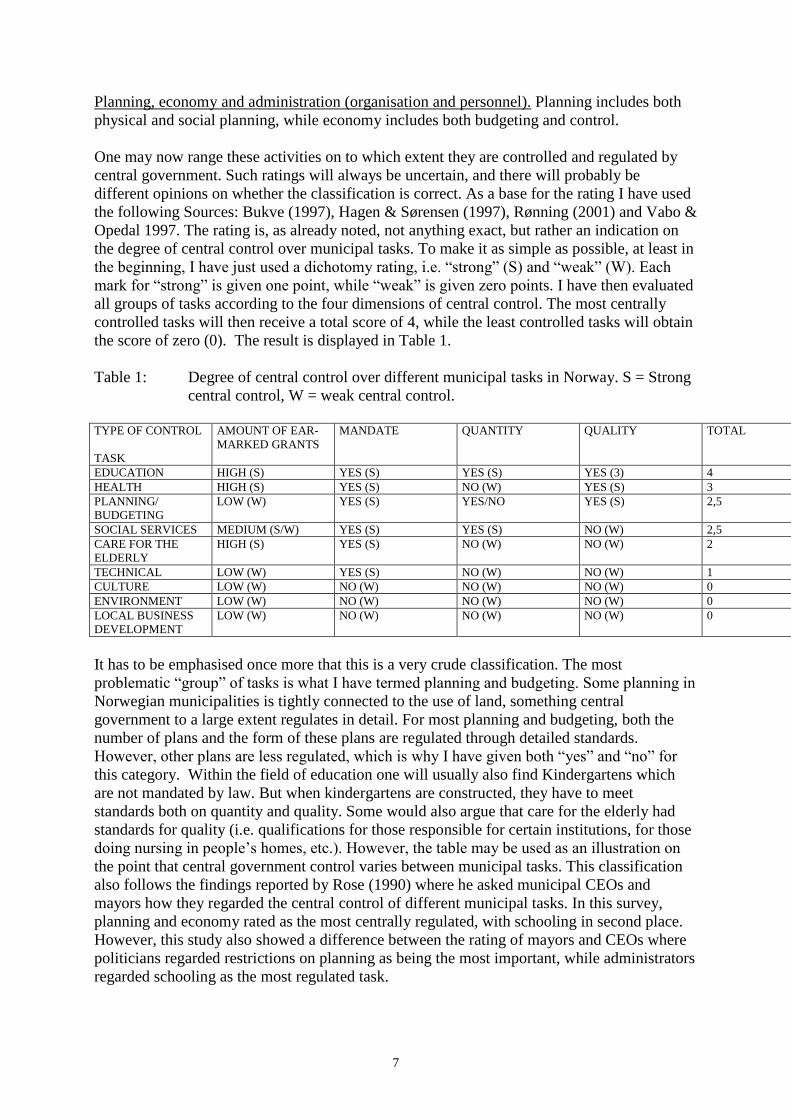
Planning, economy and administration (organisation and personnel). Planning includes both
physical and social planning, while economy includes both budgeting and control.
One may now range these activities on to which extent they are controlled and regulated by
central government. Such ratings will always be uncertain, and there will probably be
different opinions on whether the classification is correct. As a base for the rating I have used
the following Sources: Bukve (1997), Hagen & Sørensen (1997), Rønning (2001) and Vabo &
Opedal 1997. The rating is, as already noted, not anything exact, but rather an indication on
the degree of central control over municipal tasks. To make it as simple as possible, at least in
the beginning, I have just used a dichotomy rating, i.e. “strong” (S) and “weak” (W). Each
mark for “strong” is given one point, while “weak” is given zero points. I have then evaluated
all groups of tasks according to the four dimensions of central control. The most centrally
controlled tasks will then receive a total score of 4, while the least controlled tasks will obtain
the score of zero (0). The result is displayed in Table 1.
Table 1: Degree of central control over different municipal tasks in Norway. S = Strong
central control, W = weak central control.
TYPE OF CONTROL
TASK
AMOUNT OF EAR-
MARKED GRANTS
MANDATE QUANTITY QUALITY TOTAL
EDUCATION HIGH (S) YES (S) YES (S) YES (3) 4
HEALTH HIGH (S) YES (S) NO (W) YES (S) 3
PLANNING/
BUDGETING
LOW (W) YES (S) YES/NO YES (S) 2,5
SOCIAL SERVICES MEDIUM (S/W) YES (S) YES (S) NO (W) 2,5
CARE FOR THE
ELDERLY
HIGH (S) YES (S) NO (W) NO (W) 2
TECHNICAL LOW (W) YES (S) NO (W) NO (W) 1
CULTURE LOW (W) NO (W) NO (W) NO (W) 0
ENVIRONMENT LOW (W) NO (W) NO (W) NO (W) 0
LOCAL BUSINESS
DEVELOPMENT
LOW (W) NO (W) NO (W) NO (W) 0
It has to be emphasised once more that this is a very crude classification. The most
problematic “group” of tasks is what I have termed planning and budgeting. Some planning in
Norwegian municipalities is tightly connected to the use of land, something central
government to a large extent regulates in detail. For most planning and budgeting, both the
number of plans and the form of these plans are regulated through detailed standards.
However, other plans are less regulated, which is why I have given both “yes” and “no” for
this category. Within the field of education one will usually also find Kindergartens which
are not mandated by law. But when kindergartens are constructed, they have to meet
standards both on quantity and quality. Some would also argue that care for the elderly had
standards for quality (i.e. qualifications for those responsible for certain institutions, for those
doing nursing in people’s homes, etc.). However, the table may be used as an illustration on
the point that central government control varies between municipal tasks. This classification
also follows the findings reported by Rose (1990) where he asked municipal CEOs and
mayors how they regarded the central control of different municipal tasks. In this survey,
planning and economy rated as the most centrally regulated, with schooling in second place.
However, this study also showed a difference between the rating of mayors and CEOs where
politicians regarded restrictions on planning as being the most important, while administrators
regarded schooling as the most regulated task.

8
5. CENTRAL GOVERNMENT CONTROL AND THE POLITICAL-
ADMINISTRATIVE RELATIONS AT THE LOCAL LEVEL
This article started out with the idea that there may be a link between the degree of
central government control, and the political-administrative relations within municipalities.
More specifically, we may argue that the degree of central control may influence the degree
of conflict between the two spheres. To support this argument, we have to take a step
backwards to the theory of conflict in organisations.
As already implied, the relationship between politicians and administrators can be
viewed as an organisational conflict. Formally, politicians are the hierarchical leaders of the
administration, as well as employers for the administrators. This relationship is then taking
place within formal and informal organisational boundaries, and we can then use insight from
organisation theory. The interest in organisational conflict stems largely from what can be
termed the “power-school” in organisation theory (Perrow 1986). A focus on power naturally
leads to focus on such concepts as (different) interests, bases of power, authority and conflict.
Conflict may be regarded as a “breakdown in standard mechanisms of decision
making” (March & Simon 1958:112). Standard operating procedures, rules and agreed upon
patterns of decision making are set aside, and different parties involve in activities to obtain
their goals. Conflict is not just a dichotomy, i.e. conflict or nor, but more like a continuum
going from no conflict, via hidden conflict to over manifest conflict (Pondy 1967). There may
be several stages in a conflict, and conflict may also be resolved (or suppressed) at every
stage.
Conflict may stem from several factors, but two factors are usually viewed as being
necessary for conflict to arise: different interests and interdependence. Difference of interest
between parties seems obvious, but becomes less so if we distinguish between differences in
perception of interests and what may be coined as “objective” interests. Perceived differences
are often based in lack of information about the other party’s interest, and may stem from a
lack of information and the creation of “pictures of the enemy”. “Objective” interests are
found where one party may gain something on behalf of another party, a game where one part
is losing and another is winning. Interdependence, on the other hand, implies that the two (or
more) parties with different interests are forced to stay together. They cannot act
independently of each other.
Both these factors are present in the relationship between politicians and
administrators. From many of the economic approaches to understanding public
bureaucracies, it is almost an axiom that politicians (principals) have different interests from
administrators (agents). They are also highly interdependent, where administrators are
dependent on political decisions indicating direction and funding, and politicians are
dependent on professional advice as well as implementation of political decisions.
But conflict is also influenced by the organisational setting where it takes place. This
is where central government control comes in. How it influences conflict may be specified in
two, different hypotheses. First, the following hypothesis can be set forward:
H1: The stronger the central government control, the less conflict between politicians and
administrators at the municipal level.
Strong government regulation of a field may be viewed as a form of standardisation of a
relationship between two or more parties. In its strongest form, regulation may decrease the
possibilities for both parts to use discretion. They may still have different interests, but a third
party – central government – functions as a regulator indicating which party is right and
which is wrong. Central government standards may function as a recipe for “the right way” to

9
do things, and then as an external “judge” in case of differing interests. Put shortly, strong
central government control may impose “standard procedures for making decisions” to use
the terms of March & Simon (1958).
However, another outcome may also be possible, formalised in the following
hypothesis:
H2: The stronger the central government control, the more conflict between politicians and
administrators at the municipal level.
In most instances, it is assumed that politicians always will be in favour of more discretion
because it gives more room for making policy decisions. Strong central government control
may be perceived, at least by politicians, as a mechanism that favours the administration. In
turn, this may increase the feeling among politicians that the administration may take
decisions that goes against political interests because the administration can legitimate their
actions by referring to central government standards. A possible result is political frustration,
or a feeling that they don’t have any power over their own administration. This in turn can
lead to attempts to find other areas where they can “arrest” the administration, just to show
their formal power. The result may be administrative frustration, and an increased feeling of a
conflict situation.
The degree of central government regulation is not, of course, the only cause of
conflict between politics and administration. Conflict is always accentuated by lack of
resources. The more scarce resources, the higher the level of a conflict may become (Pfeffer
1981). It may be possible that the level of conflict between politics and administration is
higher the less discretionary resources the municipality has. Second, it may be assumption
that the level of political conflict – between political parties – in a municipality will influence
the politics-administration conflict. In a municipality with high political conflict, the
administration will most likely be charged with accusations of supporting one of the fractions
(Stillman 1977). Third, it seems plausible that conflict may decrease with increasing tenure,
both political and administrative. The longer a person has functioned as administrator or
politician, the more time he/she will have had to “negotiate” some division of labour between
the two spheres. A psychological contract – unwritten agreements – may be the result of
interaction over a certain amount of time between politicians and administrators (Rousseau
1995). Fourth, there is a possibility that the more “professional” a politician becomes (i.e. the
more being a politician resembles a job, part time or full time) the less political-administrative
conflict he/she will perceive. The reason for this is that professional politicians will establish
tight links with the administration, leading to more understanding and acceptance of the
administrative way of thinking. Or, as Peters (1978) coins it, the politicians may become
“bureaucratised”. Fifth, there is a possibility that politician’s feeling of conflict with the
administration to some extent is determined by the political colour of the party he/she is a
member of. Several academics have reported that political scepticism seems to follow a left-
right axis in politics (see for instance Downs & Larkey 1986). Conservative and liberalist
politicians have a greater scepticism towards the bureaucracy than more left-wing politicians.
Sixth, degree of conflict may be determined by the degree of interaction between politicians
and administrators. Which effects interaction will have are more ambiguous. On one hand,
high interaction may be an indication of high interdependence between the two parties, and
high interdependence is usually seen as a factor increasing the possibility for conflict
(Mintzberg 1979; Thompson 1967). On the other hand, interaction may be viewed as a
learning process where parts learn to understand each other’s preferences, wishes and
behaviours (Axelrod 1984). This in turn may decrease conflict. Seventh, one may argue that

10
the more professional, in terms of years of education, an administrator is, the more willing
(and able?) he/she will be to engage in conflict with the politicians. Several authors have
noted that professionalism often is combined with low trust in politicians, and even some
political contempt. Professionals, according to for instance Putnam (1977), have a tendency to
view politicians as “grains of sand in the administrative machinery”. Eighth, administrators
that have been politicians earlier, or still are politicians, will perhaps understand the political
logic more easily than those having no experience with politics. This may perhaps decrease
the feeling of conflict with politicians. Lastly, it may be that administrators with experience
from the private sector will be less positive towards politicians than those having spent their
whole career in the public sector.
6. THE EMPIRICAL STUDY
To shed some light on these hypotheses a questionnaire was sent to both politicians
(799) and administrators (465) in 30 municipalities in southern Norway. 540 politicians
(response rate 68%), and 313 administrators responded (response rate 67%). The general
response rate is very good. The political responses were checked against municipality,
political party and gender and no skewness was found. The administrative responses were
checked against municipality, position in the organisation and gender. There is a small
tendency that those with the highest positions (CEOs and sector leaders) are over-represented,
but the deviance is small.
The questionnaires to politicians and administrators had some identical and some
different questions. In this paper, the two groups are analysed separately. Politician’s
perception of conflict with the administration was measured by two questions (conflict with
the CEO and conflict with other administrative leaders). Administrator’s perception of
conflict with the politicians was measured by four questions (conflict with the mayor,
politicians in the executive committee, politicians in the specialised political body they report
to and conflict with other specialised political bodies). A five-point scale was used as
response alternatives, ranging from “mainly conflict” to “mainly co-operation”. This way of
collecting data implies that what is measured is the subjective – or perceived – conflict. This,
in turn, will open for the possibility that the two groups in this study – local politicians and
administrators – can have different views on the level of conflict.
The other main variable – degree of central government control – should be
constructed on the basis that different municipal tasks were subjects to different degrees of
central government control. This would have been easy to do if respondents – both
administrators and politicians - in our survey only had one type of tasks. Norwegian
municipalities, especially after the introduction of a rather liberal law on municipal
organisation in 1992, are organised in a great variety of ways. This implies that tasks are
coupled or de-coupled differently in different municipalities. In our sample there are four
different main principles for organising, based on product (result), task (sector), function or
mixed form. In one municipality, however, political and administrative organisation may be
based on different principles for organisation. The most used form is by task (sector), but not
even this form is very clear. What tasks that are combined within each sector differ, especially
tasks such as cultural activities, environment and local business development. Therefore we
had to ask each respondent about what were their main tasks and give them an opportunity to
select several tasks. I then conducted a correlation analysis (as well as a factor analysis)
between the different tasks to see whether there were tendencies for certain tasks to be
grouped together. Some clear patterns emerged, as well as some rather ambiguous results. A
closer scrutiny of documents on each of the municipalities’ organisational form was also
conducted to support the final solution.
11
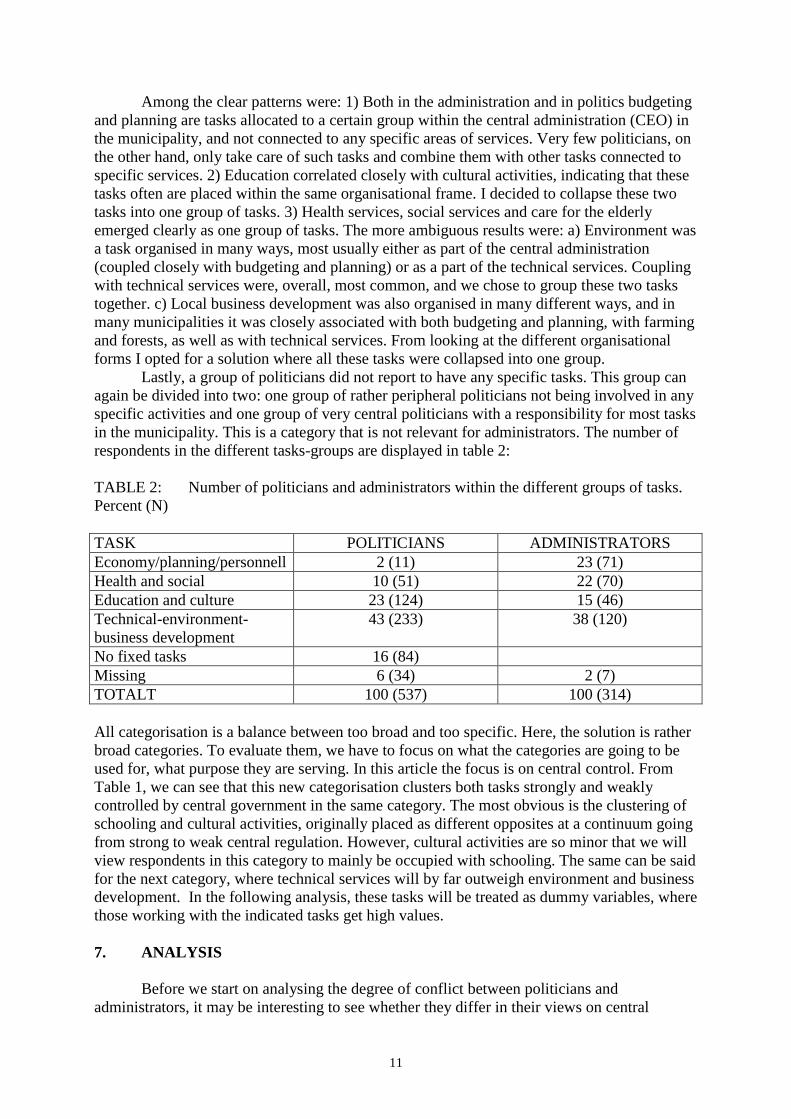
Among the clear patterns were: 1) Both in the administration and in politics budgeting
and planning are tasks allocated to a certain group within the central administration (CEO) in
the municipality, and not connected to any specific areas of services. Very few politicians, on
the other hand, only take care of such tasks and combine them with other tasks connected to
specific services. 2) Education correlated closely with cultural activities, indicating that these
tasks often are placed within the same organisational frame. I decided to collapse these two
tasks into one group of tasks. 3) Health services, social services and care for the elderly
emerged clearly as one group of tasks. The more ambiguous results were: a) Environment was
a task organised in many ways, most usually either as part of the central administration
(coupled closely with budgeting and planning) or as a part of the technical services. Coupling
with technical services were, overall, most common, and we chose to group these two tasks
together. c) Local business development was also organised in many different ways, and in
many municipalities it was closely associated with both budgeting and planning, with farming
and forests, as well as with technical services. From looking at the different organisational
forms I opted for a solution where all these tasks were collapsed into one group.
Lastly, a group of politicians did not report to have any specific tasks. This group can
again be divided into two: one group of rather peripheral politicians not being involved in any
specific activities and one group of very central politicians with a responsibility for most tasks
in the municipality. This is a category that is not relevant for administrators. The number of
respondents in the different tasks-groups are displayed in table 2:
TABLE 2: Number of politicians and administrators within the different groups of tasks.
Percent (N)
TASK POLITICIANS ADMINISTRATORS
Economy/planning/personnell 2 (11) 23 (71)
Health and social 10 (51) 22 (70)
Education and culture 23 (124) 15 (46)
Technical-environment-
business development
43 (233) 38 (120)
No fixed tasks 16 (84)
Missing 6 (34) 2 (7)
TOTALT 100 (537) 100 (314)
All categorisation is a balance between too broad and too specific. Here, the solution is rather
broad categories. To evaluate them, we have to focus on what the categories are going to be
used for, what purpose they are serving. In this article the focus is on central control. From
Table 1, we can see that this new categorisation clusters both tasks strongly and weakly
controlled by central government in the same category. The most obvious is the clustering of
schooling and cultural activities, originally placed as different opposites at a continuum going
from strong to weak central regulation. However, cultural activities are so minor that we will
view respondents in this category to mainly be occupied with schooling. The same can be said
for the next category, where technical services will by far outweigh environment and business
development. In the following analysis, these tasks will be treated as dummy variables, where
those working with the indicated tasks get high values.
7. ANALYSIS
Before we start on analysing the degree of conflict between politicians and
administrators, it may be interesting to see whether they differ in their views on central

12
government control. Two identical questions were asked to both politicians and
administrators:
“Central government regulation through laws of Norwegian municipalities is too strong”
“Norwegian municipalities are too economically dependent on central government”.
Response alternatives formed a Likert-scale ranging from 0 (totally agree) to 4 (totally
disagree).
TABLE 3: Politicians’ and administrators’ views on central government control. (N=842-
843). Mean, standard deviation, t-value and significance.
Mean std t-value Sig. Too strong
regulation
Administrator 2,8 1,1 5,57 .00 Politician 3,2 1,0
Too dependent
economically
Administrator 3,0 1,0 6,85 .00 Politician 3,5 0,8
Not surprisingly, we see that politicians tend to agree more on these items than administrators
do. This may support the notion mentioned earlier that central government regulation first and
foremost limit the discretionary powers of politicians. For many administrators, strong central
government control may be a guarantee against the “whims” of local politicians. Central
control leads to more stability, something always appreciated by administrators.
One should also believe that the views on central government control would vary
among sectors, i.e. that politicians and administrators working with the most regulated tasks
also would report a higher degree of central government control. By comparing means within
the four groups of tasks we found very few significant differences. Among politicians we
could not distinguish any differences at all. Among administrators, there was a tendency for
those working with planning and economy to agree most on the items above, i.e. being the
ones most likely to feel that government control is too strong.
a) Degree of conflict between politicians and administrators
The variable conflict consisted of several items in the questionnaire. The reason for
this is that conflict is not a general situation, but closely associated with conflict with
someone. We therefore asked politicians about their perceived conflict with the CEO
(“Rådmann”) and with other top managers (“etatsledere”), and we asked administrators about
their perceived conflict with mayor/vice-mayor, politicians in the executive committee,
politicians in the specialised committee the administrator reports to, and politicians in other
specialised committees. On all items, both politicians and administrators could answer from
“mainly conflict” (4) to “mainly co-operation” (0). The higher the numerical value the higher
the perceived conflict.
13
TABLE 4: Politicians’ and administrators’ perceptions of conflict with different groups in
the municipality.
POLITICIANS (N=527-528) MEAN STD Conflict with CEO 0,9 0,9 Conflict other managers 0,8 0,8 ADMINISTRATORS (N=281-308) Conflict with mayor 0,5 0,7 Conflict with executive committee 0,7 0,7 Conflict with specialised committee
one reports to 0,6 0,7
Conflict with other specialised
committees 0,8 0,6
Generally, the level of conflict is very low, and most – both politicians and
administrators – place themselves on the co-operative side. This finding supports a picture of
municipalities with little or no conflict between politicians and administrators. There is,
however, some internal variation, something one can detect by looking at the standard
deviations, indicating that some politicians and some administrators perceive more conflict
than others. The objective of the rest of the analysis is to detect what factors that can explain
some of this variation.
First of all, an additive index for conflict was created both for politicians and
administrators. To compare these scales, we divided them by the number of items in the index
(two for politicians, four for administrators), resulting in scales that indicate high conflict the
closer one becomes to the numerical value of four. The results are displayed in table 5.
TABLE 5: Politicians’ (N=526) and administrators’ (N=281) scores on the conflict
indexes.
MEAN MEDIAN MODE STD
Politicians’
perceived
conflict with
administrators
0,9
1,0
1,0
0,7
Administrators’
perceived
conflict with
politicians
0,6
0,8
0,0
0,6
In general, we see that politicians perceive more conflict with the administration than vice
versa, but the general impression is still one of harmony.
b) Explaining the variance in perceived conflict
The next step in the analysis was to use multivariate techniques to explain the
variation in the conflict indexes. Variables described in part 5 will be included in a multiple
regression. We will treat politicians and administrators as two different samples because the
theoretical variables explaining degree of conflict to a certain extent differs between the two
groups. Operationalisations of the independent variable are as follows:

14
TABLE 6: Theoretical and operational variables
Theoretical variable Operational variable
Scarcity of resources Income per capita (metric)
Level of political conflict* a) Number of political parties
b) Dispersion of seats (high value = high
concentration)
c) Proportion of “other political parties”
Tenure Political: Number of elected periods (ordinal)
Administration: Number of years in
municipality
Professionalism Political: percentage politician as paid
occupation (metric)
Administrative: Level of education (ordinal,
high value = long education in years)
Political colour Political party a politician represents (several
dummy variables where 1 = member)
Interaction Contact with administrative/political units
(ordinal index, high value = high interaction)
Administrators’ political experience Have been politician before (dummy, 1 = yes)
Administrators’ career experience Have been employed in private sector more
than three years (dummy, 1=yes)
Central government control** a) group of task (dummy, 1 = yes)
b) scale of regulation (high value = strong
regulation)
The variable marked with an asterisk (*) needs some explanation. It can be argued that the
level of political conflict has something to do with the number of political fractions within a
political body. That is what I assume, although one could easily argue that political bodies
with only two political parties would experience the highest degree of conflict. The same can
be said for the next empirical measure – dispersion of seats. I have used a standardised modal
percent to measure this, a measure where the value zero indicates full dispersion (all political
parties have the same proportion of seats), and the value one perfect concentration (one party
have all the seats). The last empirical measure – proportion of other parties – stems from the
fact that some of the municipalities have experienced great political conflict over the last
years, usually a geographical conflict over the localisation over public buildings. “Other
parties”, then, indicates the existence of such parties, and may be a good indicator of conflict
within a municipality.
The variable marked with two asterisks (**) indicates that both variables will be used,
but not in the same equations. This is due to the fact that these variables are constructed on
identical data, and the inclusion of both in an empirical analysis would create severe problems
of auto-correlation.
The first equation consists of the politicians’ perception of conflict with the
administration. I used a stepwise regression analysis, a method that favours the strongest
predictors.

15
TABLE 7: Regressions analysis with politicians’ perceptions of conflict with the
administration. Variables entered in the model in bold types. Stepwise method. OLS. Beta-
values (t-values). (N=482)
VARIABLES IN THE EQUATION BETA-VALUE (T-VALUE)
Member of the progressive party (FRP) .19 (4,23)
Member of “other” parties .14 (2,90)
Percentage of “others” in council -.13 (-2.64)
Task: Education and culture .11 (2,58)
VARIABLE NOT IN THE EQUATION
Political concentration -.08 (-1,89)
Percentage as professional politician -.08 (-1,73)
Number of periods in council -.08 (-1.55)
Level of education -.07 (-1,44)
Member of Social Democratic Party (AP) -.06 (-1,36)
Member of Socialist Party (SV) -.06 (-1,25)
Member of Liberal Party (V) .05 (1,23)
Income per capita -.06 (-1.18)
Task: Economy-planning-budgeting .05 (1,02)
Interaction .04 (0,92)
Political dispersion (number of parties) -.04 (-0,87)
Task: Health and social -.03 (-0,74)
Member of Christian Democratic Party (KRF) .02 (0,54)
Task: technical-business development -.02 (-0,50)
Member of Conservative Party (H) .02 (0,45)
Member of Agrarian Party (SP) .00 (-0,00)
Adjusted R square 0,07
First of all, the variables do not explain more than 7% of the variation in the dependent
variable. This is very much due to the small variation in the dependent variable, but also a
sign that the general level of conflict is difficult to predict, at least with these independent
variables. As we noted earlier, much of the conflict will probably be specific, meaning that it
will occur over specific topics. A measure for this is not possible to include in this kind of
survey, it would be too detailed.
However, some interesting results occur. First, the political perception of conflict is to
some degree shaped by political values. We see that members of the Progressive Party have
the strongest feeling of conflict. If we go further down in table 7, and look at the effects of the
non-significant variables, we see that members of political parties usually associated with
conservatism report higher levels of conflict than members of social democratic or socialist
parties. Second, being member of the category “other parties” also increases the perceived
conflict. Third, we see that the higher the proportion of “other political parties” in the council,
the less conflict with the administration politicians report. Fourth, politicians working within
the sector I classified as being the most regulated by central government also perceive a
higher level of conflict than politicians working mainly with other tasks.
If we look at the non-significant effects, we see that they support many of our initial
hypotheses. The more concentrated the council, in political terms, the less conflict one
reports. The most professional politicians – measured in whether have politics as a job, level

16
of education and number of periods in the council – also report less conflict than the other
politicians, and, as expected, the more income per capita, the less conflict is being reported.
If we now move to the administrators, we will conduct a similar analysis with this
group’s perception of conflict with politicians.
TABLE 8: Regressions analysis with administrators’ perceptions of conflict with the
politicians. Variables entered in the model in bold types. Stepwise method. OLS. Beta-values
(t-values). (N=256)
VARIABLES IN THE EQUATION BETA-VALUE (T-VALUE)
Position (level) -.19 (-3,18)
Political dispersion -.20 (-3,22)
Percentage of conservative party (H) and
progressive party (FRP) in council
.19 (3,08)
VARIABLES NOT IN THE EQUATION
Politician in municipality one works -.09 (-1,51)
Percentage of social democratic part (AP) and
socialist party (SV) in council
.09 (1,41)
Main tasks economy/bugdeting/planning -.09 (-1,41)
Percentage of “other” political parties in
council
-.09 (-1,29)
Main tasks health and social services .08 (1,28)
Worked more than 3 years in private sector -.07 (-1,13)
Interaction with politicians .08 (1,27)
Year in position -.06 (-0,92)
Income per capita .06 (0,92)
Main tasks technical-business development .05 (0,90)
Have been politician in municipality -.04 (-0,74)
Have been politician before -.03 (-0,56)
Year in municipality -.04 (-0,71)
Percentage of “center parties” in council .03 (0,36)
Level of education .01 (0,21)
Main tasks schooling and culture .01 (0,08)
Political dispersion (number of parties) .00 (-0,00)
Adjusted R square 0,09
First of all, there is no empirical evidence in this study that administrators’ perception of
conflict with politicians has anything to do with what type of task (and, correspondingly,
degree of central government control and regulation) that is their main responsibility. Other
factors seem much more important. As expected, people in higher positions feel less conflict
with politicians than people in lower ones. It is interesting that position has this effect, even
when we are controlling for interaction and tenure (both correlates positively with level of
position). Even more interesting is that perception of conflict increases with the number of
conservative and liberalist political parties in the council. Generally speaking, the model does
not have any great fit, indicating that there are many other factors explaining administrators’
perception of conflict with politicians than those included in this equation.
17
DISCUSSION AND CONCLUSION
This article started with the notion that there may be a correlation between the degree
of central government regulation and control over municipal tasks and the level of conflict
between politicians and administrators in the municipalities. Since there a no other empirical
studies, at least to my knowledge, that studies this topic, I had no clear idea how central
government control and regulation would influence local conflict. To hypotheses were set
forth, one indicating that strong central government control and regulation could increase
conflict, the other that it could decrease conflict. To investigate which one of these hypotheses
that were most correct, a survey was conducted among both politicians and administrators in
30 municipalities in Norway.
In the analysis, politicians and administrators were treated as two separate groups. One
reason for this is because our focus at best could be about subjective perceptions of conflict.
Any measure on “real conflict” is impossible to collect when data is gathered by asking
individuals questions in a questionnaire. And perceptions can, and will probably differ. In the
analysis, we found a tendency for politicians working with the most regulated task –
schooling – to perceive more conflict with the administration than politicians mainly occupied
with other tasks. This supports one of the ideas initially set out in this article, that politicians
would feel that strong central government control and regulation would diminish their ability
to take discretionary decisions, and to shape local policies. However, there is no parallel
within the administrative group. The main task, and therefore the degree of central
government control, does not influence the perceived conflict with politicians.
In sum, only hypothesis two – that strong central government regulation increases
conflict between politicians at the local level – get some support in the empirical findings.
And this support is rather weak. On the whole, it seems as central government control only to
a small degree influence the degree of conflict between local politicians and local
administrators. The reason for this may be that these factors are loosely, or not at all, coupled.
Or it may be that our empirical measures are not refined enough, and that the lack of strong
links is due to methodological weaknesses.
Another possibility also exists, highlighted in the attempts to make empirically clear
categories based on main tasks. The analysis showed that many tasks correlated rather
strongly. Many of these tasks would, if they had been possible to separate clearly, be
categorised as very different according to the degree of central government regulation and
control. The best example is that the most and the least regulated tasks, schooling and culture,
are often treated by the same persons, both politicians and administrators. One can, rightly so,
ask if one should expect these variables to have any effect on the level of conflict when they
are so internally inconsistent. Both administrators and politicians are working with tasks that
are both very little and very much regulated by central government, at the same time. How
such an ambiguous situation should effect conflict is difficult to predict.
The most interesting results in the analysis have little to do with central government
regulation and control of local government. The data indicates that the perception of conflict
between politicians and administrators to a certain extent is shaped by political factors, i.e. the
political party politicians are members of, and the political “colour” of the council. Seen in a
more theoretical perspective, this could support some of the (rather speculative) “axioms”
underlying some of the theories often grouped under a “principal-agent” heading (see for
instance Blaise & Dion 1991 or Douma & Schreuder 1991). In this tradition it is often argued
that public administrators have specific political preferences, tending to be more “left-wing”
than both the majority of politicians and the people. That employees in the public sector tends

18
to vote more for left-wing parties than the people on the whole, is rather well documented (see
for instance Knudsen 1986).
The effects of such political inclinations within the public administration, however,
have been significantly less studied. This study shows that administrators, report a higher
degree of political conflict with councils dominated by political parties often associated with
the “right wing”. And, it shows that politicians being member of these political parties report
more conflict with the administration than members of other parties do. Several speculations
can be derived from this finding. One is that politicians being members of right-wing parties,
to a certain extent is obliged to report conflict with the local administration. Many of these
political parties have as an integrated part of their political programs, phrases like “reducing
bureaucracy”, “getting rid of red tape”, etc. The administrators are for many of these
politicians, opponents by definition. But, one may also speculate that the feeling of conflict is
based in more factual and less subjective conditions. Politicians from “right-wing” parties
often try to implement policies that may be viewed as a threat by some administrators. Such
policies may include privatisation, introducing competitive tendering, downscaling public
organisations and introducing more elaborate control and monitoring systems (Lane 2000).
One plausible consequence is that many within the administration may try to resist the
implementation of such “new public management techniques”. This may explain why more
right-wing politicians report more conflict with the administration than members of other
political parties, and why administrators report more conflict with councils dominated by
“right-wing” parties than with those dominated by other parties.

19
LITTERATURE
Axelrod, R. 81984): The Evolution of Cooperation. New York, Basic Books
Bendix, R. (1964): Nation-Building and Citizenship. Berkley, University of California Press
Blaise, A. & Dion, S. (1991): The Budget Maximizing Bureaucrat: Appraisals and Evidence.
Pittsburg, University of Pittsburg Press
Bukve, O. (1997): Kommunal forvaltning og planlegging. Oslo, Det Norske Samlaget
Douma, S. & Schreuder, H. (1991): Economic Approaches to Organizations. London,
Prentice Hall
Finer, H. (1941): Administrative responsibility in Democratic Government. Public
Administration review, vol 1: 335-350
Friedrich, C.J. (1940): Public Policy and the Nature of Administrative Responsibility. In
friedrich, C.J. & Mason, E.S. (eds): Public Policy. Cambridge, Harvard University Press
Gerth, H.H. & Mills, C.W. (1946): From Max Weber. Essays in Sociology. New York,
Oxford University Press
Hagen, T.P. & Sørensen, R. (1997): Kommunal organisering. Oslo, Tano-Aschehoug
Jacobsen, D.I. (1996): The Role of the Public Manager: Loyalty, Autonomy or Advocacy?
Scandinavian Political Studies, vol 19: 45-65
Jacobsen, D.I. (1997): Administrasjonens makt. Oslo, Fagbokforlaget
Jacobsen, D.I. (1999): Trust in Political-Administrative relations: The Case of Local
Authorities in Norway and Tanzania. World Development, vol 27: 839-853
Knutsen, O (1996): Offentlig ansatte. Mulige årsaker til partipolitiske skillelinjer. Norsk
Statsvitenskapelig Tidsskrift, vol 2:21-44
Lane, J-E. (2000): New Public management. London, Routledge
March, J.G. & Simon, H.A. (1958): Organizations. New York, Wiley
Mintzberg, H (1979): The Structuring of Organizations. New York, Prentice Hall
Mosher, F. C. (1982): Democracy and the Public Service. New York, Oxford University Press
Page, E. (1991): Localism and centralism in Europe. New York, Oxford University Press
Perrow, C. (1986): Complex Organizations. A Critical Essay. New York, Random House
Peters, G.B. (1978): The Politics of Bureaucracy. New York, Longman

20
Pfeffer, J. (1981): Power in organizations. Cambridge Massachusetts, Ballinger
Phillips, A. (1996): Why Does Local Democracy Matters? In Pratchett, L. & Wilson, D. (eds):
Local democracy and Local Government. Houndmills, Macmillan Press
Pondy, L.R. (1967): Organizational Conflict: Concepts and Models. Administrative Science
Quarterly, vol 12:296-320
Putnam, R.D. (1977): Elite Transformation in Advanced Industrial Societies: An Empirical
Assessment of the Theory of Technocracy. Comparative Political Studies, vol 10: 383-412
Rondinelli, D.A. (1981): Government Decentralization in a Comparative Perspective. Theory
end Practice in developing Countries. International Review of Administrative Sciences, vol
XLVII: 133- 145
Rondinelli, D.A. (1992): Implementing Decentralization Programmes in Asia: A Comparative
Analysis. In Smith, B. (ed): Progress in developmenty Administration. Chichester, John
Wiley
Rose, L.E. (1990): Staten – bremsekloss eller smørekopp for kommunal ledelse og
innovasjon? I Baldersheim, H. (red): Ledelse og innovasjon i kommunene. Oslo, Tano
Rousseau, D. M. (1995): Psychological Contracts in Organization: Understanding written and
unwritten agreements. Thousand Oaks, Sage
Simon, H.A. (1976): Administrative Behavior. New York, Free Press
Stillman, R.J. (1977): The City manager: professional Helping hand or Political Hired hand?
Public Administration review, vol 37: 659-670
Stoker, G. (1988): The politics of local government. London, Macmillan
Svara, J.H. (1985): Dichotomy and Duality: Reconceptualizing the Relationship between
Policy and Administration in Council-Maanager Cities. Public Administration Review, vol
45: 221-232
Svara, J.H. (1989): Policy and Administration: City Managers as Coomprehensive
Professional Leaders, i Fredrickson, H.G. (ed): Ideal and Practice in Council-Manager
Government, Washington: International City Management Association.
Svara, J.H. (1990): Official Leadership in the City: Patterns of Conflict and Cooperation. New
York: Oxford University Press
Svara, J.H. (1998): The Politics-Administration Dichotomy as Aberration. Public
Administration review, vol 58, no 1: 51-58
Thompson, J.D. (1967): Organizations in Action. New York, McGraw Hill
Vabo, S.I. & Opedal, S. (1997): Oppfatninger av forholdet mellom staten og kommunene.
NIBR Notat:1997:12, Oslo

21
Wilson, W. (1887/1992): The Study of Administration. In Shafritz, J.M. & Hyde, A.C.
(1992)(eds): Classics of Public Administration. Pacific grove, CA, Brooks/Cole Publishing
Co.