are the fama and french factors global
TRANSCRIPT
The Society for Financial Studies
Are the Fama and French Factors Global or Country Specific?Author(s): John M. GriffinReviewed work(s):Source: The Review of Financial Studies, Vol. 15, No. 3 (Summer, 2002), pp. 783-803Published by: Oxford University Press. Sponsor: The Society for Financial Studies.Stable URL: http://www.jstor.org/stable/2696721 .Accessed: 20/04/2012 19:07
Your use of the JSTOR archive indicates your acceptance of the Terms & Conditions of Use, available at .http://www.jstor.org/page/info/about/policies/terms.jsp
JSTOR is a not-for-profit service that helps scholars, researchers, and students discover, use, and build upon a wide range ofcontent in a trusted digital archive. We use information technology and tools to increase productivity and facilitate new formsof scholarship. For more information about JSTOR, please contact [email protected].
Oxford University Press and The Society for Financial Studies are collaborating with JSTOR to digitize,preserve and extend access to The Review of Financial Studies.
http://www.jstor.org
Are the Fama and French Factors Global or Country Specific?
John M. Griffin Arizona State University
This article examines whether country-specific or global versions of Fama and French's three-factor model better explain time-series variation in international stock returns. Regressions for portfolios and individual stocks indicate that domestic factor models explain much more time-series variation in returns and generally have lower pricing errors than the world factor model. In addition, decomposing the world factors into domestic and foreign components demonstrates that the addition of foreign factors to domestic models leads to less accurate in-sample and out-of-sample pricing. Practical applications of the three-factor model, such as cost of capital calculations and perfor- mance evaluations, are best performed on a country-specific basis.
The three-factor model of Fama and French (1993) posits that expected returns can be explained by the excess market return, a size factor (SMB), and a book-to-market equity factor (HML). In a later study, Fama and French (1998) extend the model to a global context and provide evidence that a two- factor model with a world market and world book-to-market equity (WHML) factor explains international stock returns better than the world capital asset pricing model (CAPM).
This article provides a comprehensive examination of whether the time- series variation in stock returns is best characterized by country-specific or global versions of these factors. This is an important question, because the choice of a domestic or global model can substantially affect expected return estimates. For example, for U.S. stocks, the average difference between the domestic and global three-factor model expected return estimates is 8.41% per year. Using the wrong model can lead to errors in capital budgeting, portfolio evaluation, and risk analysis decisions.
Despite the straightforwardness of the Fama and French factors and the growing empirical support, considerable controversy exists regarding their interpretation as risk factors. Critics can be classified into two main groups.'
I am grateful for helpful comments and discussions with Min Ahn, Hank Bessembinder, Chris Gadarowski, Andrew Karolyi, Mike Lemmon, Spencer Martin, Sara Moeller, Federico Nardari, Frederik Schlingemann, Rene M. Stulz, Rohan Williamson, and especially Wayne Ferson (the editor) and an anonymous referee. I thank Selim Topaloglu and Kelsey Wei for research assistance. Part of this research was conducted while I was a Dice Visiting Scholar at Ohio State University. Any remaining errors are mine. Address correspondence to John M. Griffin, Department of Finance, College of Business-ASU, P.O. Box 873906, Tempe, AZ 85287-3906, or e-mail: [email protected].
Another line of critics argues the explanatory power of size and book-to-market equity is spurious-due to sample selection or data snooping biases. While biases potentially exaggerate the results, mounting interna- tional evidence [Chan, Hamao, and Lakonishok (1991), Capaul, Rowley, and Sharpe (1993), Hawawini and Keim (1997), Fama and French (1998), and Barry et al. (1999)] indicates that the book-to-market effect is not spurious.
The Review of Financial Studies Summer 2002 Vol. 15, No. 3, pp. 783-803 C 2002 The Society for Financial Studies
The Review of Financial Studies / v 15 n 3 2002
The first group [Lakonishok, Shleifer, and Vishny (1994), Haugen (1995)] argues that the size and book-to-market equity effects are due to investor overreaction rather than compensation for risk bearing. They argue that investors systematically overreact to recent corporate news, unrealistically extrapolating high or low growth into the future. This, in turn, leads to under- pricing of "value" [small market capitalization, high book-to-market equity (BE/ME) stocks] and overpricing of "growth" (typically large, low BE/ME) stocks. A second group of critics [Ferson, Sarkissian, and Simin (1999)] cautions against using empirical regularities as "explanatory risk factors." Berk (1995) argues that high BE/ME and small market capitalization firms will, by construction, earn higher mean returns whether they are related to mispricing or economic risk. Consistent with these arguments questioning a risk-based interpretation, Daniel and Titman (1997) find that firm character- istics (i.e., size and BE/ME) explain returns better than factor loadings from the Fama and French model. However, Davis, Fama, and French (2000) argue that Daniel and Titman's results are subsample specific. Ferson and Harvey (1999) show that the three-factor model fails to explain conditional expected returns.2
One way to further examine the empirical validity of such factors is to use international data. Along this line of reasoning, Daniel, Titman, and Wei (2001) demonstrate that characteristics and not factor loadings explain stock returns in Japan. Liew and Vassalou (2000) argue that the Fama and French factors predict future economic growth in several international markets. Fama and French (1998) apply the implication from international asset pricing theory that, under the null hypothesis of market integration, there should be one set of risk factors that explain expected returns in all countries. Fol- lowing this line of reasoning, they demonstrate that using a world two-factor model with a world book-to-market equity factor leads to lower intercepts and higher adjusted R2s than a world market factor alone. However, they do not compare the world factor model to country-specific models. The latter is a potentially important comparison, because the explanatory power of world factors could be driven by their country-specific components.
This article compares a world three-factor model to country-specific models. Recent work surrounding the importance of size and book-to-market equity factors argues that data grouping methods can significantly affect inferences [e.g., Ferson, Sarkissian, and Simin (1999) and Berk (2000)]. To address this concern, in addition to more traditional BE/ME-sorted and size-sorted port- folios, individual security data are also examined. Our findings are broadly consistent for portfolios and individual returns. The domestic models explain more time-series variation and generally provide more accurate pricing than the world model. We also examine whether there are any benefits to adding
2 Similarly, Griffin and Lemmon (2001) find that the explanatory power of BE/ME is inconsistent with a distress risk interpretation and more consistent with mispricing explanations.
784
Fama and French Factors
foreign factors to domestic three-factor models. Adding foreign factors leads to a statistically significant but economically small increase in expla- natory power. Furthermore, country-specific three-factor models have lower in-sample and out-of-sample pricing errors than models that include foreign factors. The findings here indicate that there are no benefits to extending the three-factor model to an international context.
Section 1 presents the world model and distinguishes it from international and country-specific models. Section 2 explains the data and descriptive statistics. In Section 3 we use portfolios to examine the relative performance of domestic, world, and international models. Section 4 uses individual stock returns to analyze the usefulness of these models and Section 5 examines the out-of-sample accuracy of these models. Section 6 examines an alternative formation of global factors, the relative performance of other international factor models, the usefulness of foreign factors, and cross-sectional regres- sion results. Section 7 concludes.
1. Three Empirical Models
Fama and French (1993) propose a three-factor model in which the factors are the market return in excess of the risk-free rate (MRF), the difference between the returns on small and large capitalization portfolios (SMB, small minus big), and the difference between the returns on high and low book- to-market portfolios (HML, high minus low). In an efficient and integrated international capital market, there should be only one set of risk factors that describe expected returns in all countries. The world factor model regression describes the dollar-denominated return on domestic asset i in excess of the dollar-denominated domestic risk-free rate, ri, as follows:3
rit = ai + bi (WMRFt) + si(WSMBt) + hi (WHMLt) + ?i (1)
where bi, si, and hi are the unconditional sensitivities of the ith asset to the factors.4
The world factors are weighted averages of the country-specific compo- nents, for example, WMRFt = WDtlIDMRFt + wFt_,FMRFt, where WDt-1 is the fraction of the total dollar-denominated market capitalization of the coun- tries in the sample attributable to the domestic market in the previous month, and WFt-I is the fraction of the total market capitalization in the previous
3 As noted by Solnik (1983), when expressed in the foreign currency, the risk-free rate's stochastic component
is equal to the exchange rate movement. Thus, expressing a foreign security's returns in excess of the local market's risk-free rate in dollar denominated terms reduces the influence of systematic exchange rate shocks.
4 Unconditional time-series approaches are used here. Conditional approaches to testing intemational pricing models include those by Harvey (1991), Chan, Karolyi, and Stulz (1992), Ferson and Harvey (1993, 1994, 1997), and Bansal, Hsieh, and Viswanathan (1993), among others. Ferson (1995) provides a comprehensive discussion of the advantages and limitations of testing in a conditional context.
785
The Review of Financial Studies / v 15 n 3 2002
period attributable to foreign market capitalization. The world HML and SMB factors are also weighted averages of their respective country-specific factors.
Allowing domestic and foreign factors to have a different impact on stock returns leads to the following international factor model regression:
rit= ai + bDi(wDt-I DMRFt) + SDi(WDt1 DSMBt) + hDi(wDt I DHMLt)
+ bFi(wFt-l FMRFt) + SFi(WFt-I FSMBt)
+ hFi(wFt_ FHMLt) + Ei- (2)
The international model decomposes the world model into its domestic and foreign components. If the foreign factors are irrelevant, then the international model becomes one in which only domestic components drive stock returns:
rit= ai + bDi(WDt-l DMRFt) + SDi(WDt1 DSMBt)
+ hDi(wDt1 DHMLt) + Ei. (3)
The three models in Equations (1), (2), and (3) all use market capitalization weights. We also consider unweighted models that are identical to those above, except that the WD and WF are set to one. In this case, to be consistent with equal weighting throughout, we form both world and foreign factors as equal-weighted averages of the pertinent country factors.
The prediction from the models above is that across all securities, regres- sion intercepts should jointly be statistically indistinguishable from zero. Asset pricing models do not provide predictions regarding the magnitude of adjusted R2s. However, factor model regressions with useful factors should have higher R2s. The average absolute values of model intercepts (pricing errors) can be used as a means of model comparison, as the inclusion of effective factors should lead to intercepts that are closer to zero.
One remaining issue is the level of aggregation of the test assets. Ferson, Sarkissian, and Simin (1999) show that constructing factors from attribute- sorted portfolios on the basis of an empirical regularity will produce evidence of that regularity in-sample. Berk (2000) argues that grouping procedures can lead to a rejection of a valid asset pricing model and recommends testing before sorting into groups. Portfolio tests reduce sampling error and facilitate comparison with the previous literature, while the use of individual stocks removes potential biases due to the sorting procedure. Thus we begin our analysis using more traditional BE/ME-sorted and size-sorted portfolios, and then analyze factor model regressions with individual firm data.
2. Data and Descriptive Statistics
2.1 The stock return sample Since the model is tested jointly with the maintained hypothesis of market integration, we focus on markets that are likely to be integrated. Most empir- ical articles find evidence of market integration between the United States
786
Fama and French Factors
and Canada, the United Kingdom, and Japan, particularly after 1980.5 For this reason, for the empirical tests in this article, we use monthly returns from January 1981 to December 1995. In 1995 the sample comprises 1521 firms in Japan, 1234 in the United Kingdom, and 631 in Canada, for a total of 3386 non-U.S. firms. The large cross section of firms allows a firm-level analysis of the validity of size and book-to-market factors. Appendix A gives the sample construction details.
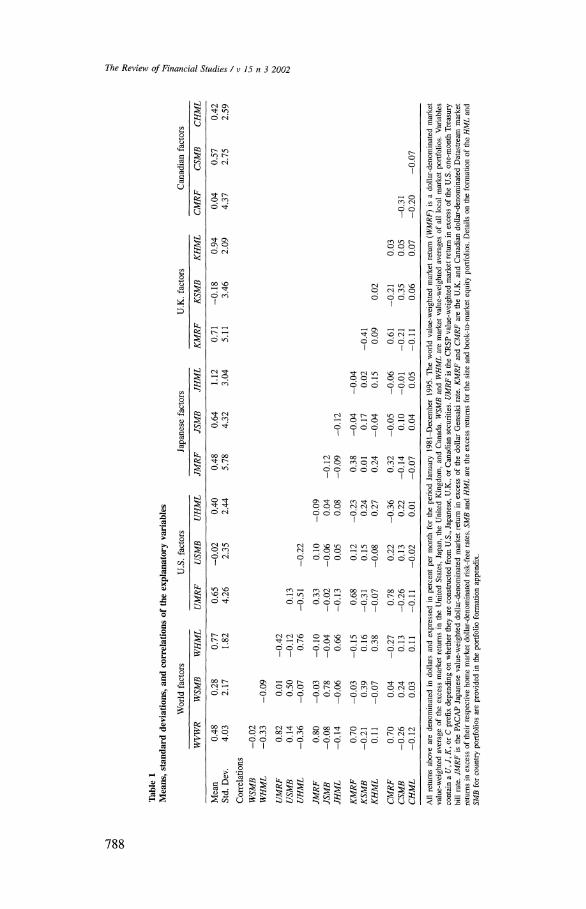
2.2 Explanatory variables and summary statistics Table 1 displays means, standard deviations, and correlations of the U.S., Japanese, U.K., and Canadian variables. The U.S. excess market return (UMRF) has correlations of 0.33, 0.68, and 0.78 with the Japanese, U.K., and Canadian excess market returns, respectively. The world SMB and HML factors have high correlations with their country counterparts, reflecting that they are constructed from the country components.6 Among the various SMB and HML factors, the correlations across countries are low. These findings support those of Hawawini and Keim (1997), who document size and price- to-book effects in France, the United Kingdom, Germany, Japan, and the United States, but also find low correlations among these premia across mar- kets. The low correlations between SMB and HML factors across countries are interesting, because we would expect these two variables to be highly correlated if size and book-to-market risk in each country represent the same underlying state variables, and if markets are integrated. For our empiri- cal tests, the low correlations mean that we can include both domestic and foreign factors in the same regressions without concerns about collinearity.
3. Time-Series Tests Using BE/ME-Sorted Portfolios
First, we evaluate the performance of domestic, world, and international factor model regressions for BE/ME-sorted and then BE/ME- and size-sorted portfolios.
5 Gultekin, Gultekin, and Penati (1989) and Campbell and Hamao (1992) cannot reject the null of market integration between the United States and Japan after 1980. Korajczyk and Viallet (1989), Bekaert and Hodrick (1992), and Chan, Karolyi, and Stulz (1992) also find some evidence of integration. Harvey (1991) presents evidence of integration between the United Kingdom and Canadian market retums and the world market portfolio. Mittoo (1992) finds that both interlisted and noninterlisted Canadian securities are integrated with the U.S. market beginning in 1982. However, in summarizing this literature, Stulz (1995) notes that empirical tests are often unable to distinguish between competing models.
6 Fama and French (1998) also use a value-weighted world market and book-to-market factor. Comparing the Datastream market value weights to those in their Table 1 shows that the relative magnitude of U.S. and Japanese market caps in Datastream are similar to those using the MSCI weights (Fama and French). Fama and French (1998) report that the United States and Japan represent 79.2% of their total 13-country market cap in 1985. In addition, the cross-country correlations between Japanese and U.K. HML with both U.S. and world HML factors convey a similar pattern to those in Fama and French (1998).
787
The Review of Financial Studies / v 15 n 3 2002
Table 1 Means,
standard
deviations,
and
correlations of
the
explanatory
variables
World
factors
U.S.
factors
Japanese
factors
U.K.
factors
Canadian
factors
WVWR
WSMB
WHML
UMRF
USMB
UHML
JMRF
JSMB
JHML
KMRF
KSMB
KHML
CMRF
CSMB
CHML
Mean
0.48
0.28
0.77
0.65
-0.02
0.40
0.48
0.64
1.12
0.71
-0.18
0.94
0.04
0.57
0.42
Std.
Dev.
4.03
2.17
1.82
4.26
2.35
2.44
5.78
4.32
3.04
5.11
3.46
2.09
4.37
2.75
2.59
Correlations
WSMB
-0.02
WHML
-0.33
-0.09
UMRF
0.82
0.01
-0.42
USMB
0.14
0.50
-0.12
0.13
UHML
-0.36
-0.07
0.76
-0.51
-0.22
JMRF
0.80
-0.03
-0.10
0.33
0.10
-0.09
JSMB
-0.08
0.78
-0.04
-0.02
-0.06
0.04
-0.12
JHML
-0.14
-0.06
0.66
-0.13
0.05
0.08
-0.09
-0.12
KMRF
0.70
-0.03
-0.15
0.68
0.12
-0.23
0.38
-0.04
-0.04
KSMB
-0.21
0.39
0.16
-0.31
0.15
0.24
0.01
0.17
0.02
-0.41
KHML
0.11
-0.07
0.38
-0.07
-0.08
0.27
0.24
-0.04
0.15
0.09
0.02
CMRF
0.70
0.04
-0.27
0.78
0.22
-0.36
0.32
-0.05
-0.06
0.61
-0.21
0.03
CSMB
-0.26
0.24
0.13
-0.26
0.13
0.22
-0.14
0.10
-0.01
-0.21
0.35
0.05
-0.31
CHML
-0.12
0.03
0.11
-0.11
-0.02
0.01
-0.07
0.04
0.05
-0.11
0.06
0.07
-0.20
-0.07
All
returns
above
are
denominated in
dollars
and
expressed in
percent
per
month
for
the
period
January
1981-December
1995.
The
world
value-weighted
market
return
(WMRF) is a
dollar-denominated
market
value-weighted
average of
the
excess
market
returns in
the
United
States,
Japan,
the
United
Kingdom,
and
Canada.
WSMB
and
WHML
are
market
value-weighted
averages of all
local
market
portfolios.
Variables
contain a U, J, K, or C
prefix
depending on
whether
they
are
constructed
from
U.S.,
Japanese,
U.K., or
Canadian
securities.
UMRF is
the
CRSP
value-weighted
market
return in
excess of
the
U.S.
one-month
Treasury
bill
rate.
JMRF is
the
PACAP
Japanese
value-weighted
dollar-denominated
market
return in
excess of
the
dollar
Gensaki
rate.
KMRF
and
CMRF
are
the
U.K.
and
Canadian
dollar-denominated
Datastream
market
returns in
excess of
their
respective
home
market
dollar-denominated
risk-free
rates.
SMB
and
HML
are
the
excess
returns
for
the
size
and
book-to-market
equity
portfolios.
Details on
the
formation of
the
HML
and
SMB
for
country
portfolios
are
provided in
the
portfolio
formation
appendix.
788
Fama and French Factors
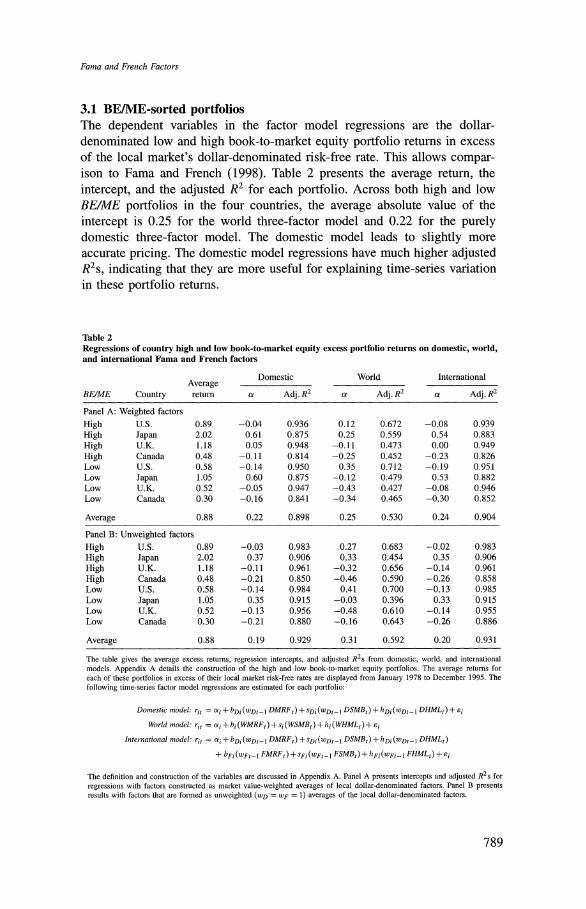
3.1 BE/ME-sorted portfolios The dependent variables in the factor model regressions are the dollar- denominated low and high book-to-market equity portfolio returns in excess of the local market's dollar-denominated risk-free rate. This allows compar- ison to Fama and French (1998). Table 2 presents the average return, the intercept, and the adjusted R2 for each portfolio. Across both high and low BE/ME portfolios in the four countries, the average absolute value of the intercept is 0.25 for the world three-factor model and 0.22 for the purely domestic three-factor model. The domestic model leads to slightly more accurate pricing. The domestic model regressions have much higher adjusted R2s, indicating that they are more useful for explaining time-series variation in these portfolio returns.
Table 2 Regressions of country high and low book-to-market equity excess portfolio returns on domestic, world, and international Fama and French factors
Average Domestic World International
BE/ME Country return a Adj. R2 a Adj. R2 a Adj. R2
Panel A: Weighted factors
High U.S. 0.89 -0.04 0.936 0.12 0.672 -0.08 0.939 High Japan 2.02 0.61 0.875 0.25 0.559 0.54 0.883 High U.K. 1.18 0.05 0.948 -0.11 0.473 0.00 0.949 High Canada 0.48 -0.11 0.814 -0.25 0.452 -0.23 0.826 Low U.S. 0.58 -0.14 0.950 0.35 0.712 -0.19 0.951 Low Japan 1.05 0.60 0.875 -0.12 0.479 0.53 0.882 Low U.K. 0.52 -0.05 0.947 -0.43 0.427 -0.08 0.946 Low Canada 0.30 -0.16 0.841 -0.34 0.465 -0.30 0.852
Average 0.88 0.22 0.898 0.25 0.530 0.24 0.904
Panel B: Unweighted factors
High U.S. 0.89 -0.03 0.983 0.27 0.683 -0.02 0.983 High Japan 2.02 0.37 0.906 0.33 0.454 0.35 0.906 High U.K. 1.18 -0.11 0.961 -0.32 0.656 -0.14 0.961 High Canada 0.48 -0.21 0.850 -0.46 0.590 -0.26 0.858 Low U.S. 0.58 -0.14 0.984 0.41 0.700 -0.13 0.985 Low Japan 1.05 0.35 0.915 -0.03 0.396 0.33 0.915 Low U.K. 0.52 -0.13 0.956 -0.48 0.610 -0.14 0.955 Low Canada 0.30 -0.21 0.880 -0.16 0.643 -0.26 0.886
Average 0.88 0.19 0.929 0.31 0.592 0.20 0.931
The table gives the average excess returns, regression intercepts, and adjusted R2s from domestic, world, and international models. Appendix A details the construction of the high and low book-to-market equity portfolios. The average returns for each of these portfolios in excess of their local market risk-free rates are displayed from January 1978 to December 1995. The following time-series factor model regressions are estimated for each portfolio:
Domestic model: rit = ai + bDi(WDt-I DMRFt) + SDi(WDt1I DSMBt) + hDi(WDt1I DHMLt) + ei
World model: rit = ai + bi (WMRFt) + si (WSMBt) + hi (WHMLt) + ei
Internationial inodel: rit = ai +bDi(wDt-l DMRFt) +SDi(WDtlI DSMBt) +hDi(WDtlI DHMLt)
+ bFi (WFt-I FMRFt) + sFi(WFt-I FSMBt) + hFi(WFt- IFHMLt) + ei
The definition and construction of the variables are discussed in Appendix A. Panel A presents intercepts and adjusted R2s for regressions with factors constructed as market value-weighted averages of local dollar-denominated factors. Panel B presents results with factors that are formed as unweighted (wD = WF = 1) averages of the local dollar-denominated factors.
789
The Review of Financial Studies / v 15 n 3 2002
When examining high and low book-to-market equity portfolios in each country, Fama and French (1998, Table 4) find that the inclusion of a world HML factor leads to intercepts closer to zero and higher adjusted R2s than does a world CAPM. We find the same result. However, we also find that domestic two-factor models (with the domestic HML and MRF factors) lead to even lower intercepts and higher adjusted R2s than the world two-factor model.7
Regression results for the international six-factor models yield an aver- age pricing error of 0.24, which is actually 0.02 higher than for the purely domestic model. The average adjusted R2 from the international models is 0.904, as compared to 0.898 with the purely domestic factor model regres- sions. Thus the international models have slightly higher explanatory power. However, the international models yield higher absolute intercepts, which signals a greater tendency toward model misspecification. As shown in panel B of Table 2, using equal-weighted averages of the individual country factors gives findings quite similar to the value-weighted results in panel A.
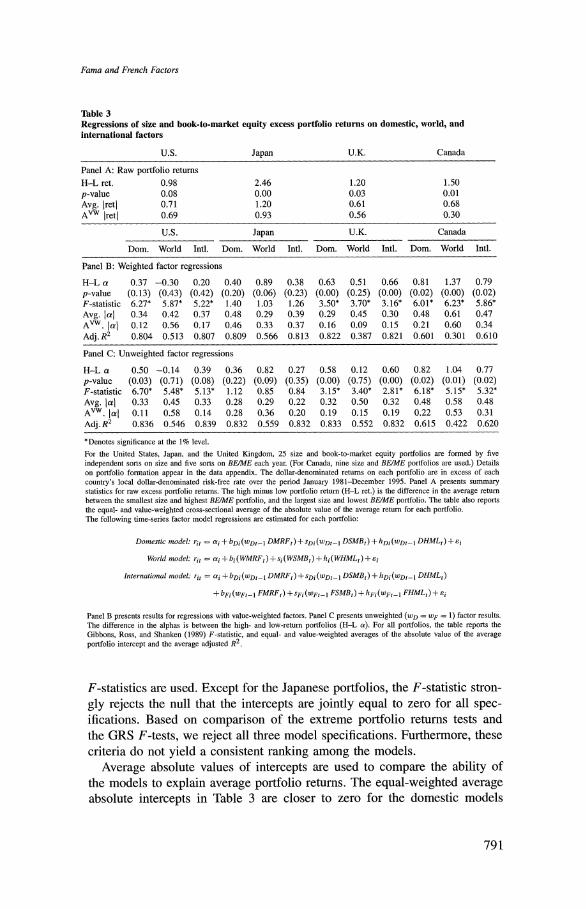
3.2 BE/ME- and size-sorted portfolios In this section, the dependent variables are the excess returns to 25 portfo- lios within each country, formed from five independent rankings on size and five rankings on BE/ME. (For Canadian equities, we form only nine portfo- lios because of the limited number of firms.) Table 3 gives the raw portfolio return differences between the extreme high-return (small size, high BE/ME) and low-return (large size, low BE/ME) portfolios. There is substantial cross- sectional variation between average returns in the extreme portfolios which can provide a more powerful approach for distinguishing between competing global and country-specific regression models. Table 3 presents the differ- ence in time-series regression intercepts between the extreme portfolios.8 Compared to the domestic models, the world model shows smaller differ- ences in intercepts for the United States and United Kingdom, but not for Japan and Canada. The international models show slightly less dispersion between extreme portfolios than the other two models for the United States, Japan, and Canada, but not for the United Kingdom. The difference between extreme portfolios for the international models is also statistically significant and different from zero in both Canada and the United Kingdom.
To evaluate the hypothesis that the model intercepts from all 25 portfolios are jointly equal to zero, Gibbons, Ross, and Shanken (1989; hereafter GRS)
7 The main difference between our study and that of Fama and French (1998) is that their portfolios are in excess of the U.S. (not local market) risk-free rate. However, we repeat the tests in Table 2, using portfolios
in excess of the U.S. risk-free rate and come to similar conclusions.
8 The standard errors for the difference in portfolio intercepts are obtained from the time series of regression disturbance terms. The p-values are from the normal distribution. This test is similar to the difference between small- and large-firm intercepts as performed by Banz (1981) and small- and large-firm pricing errors as performed by Chan, Chen, and Hsieh (1985).
790
Fama and French Factors
Table 3 Regressions of size and book-to-market equity excess portfolio returns on domestic, world, and international factors
U.S. Japan U.K. Canada
Panel A: Raw portfolio returns H-L ret. 0.98 2.46 1.20 1.50 p-value 0.08 0.00 0.03 0.01 Avg. iretl 0.71 1.20 0.61 0.68 AVw Iretj 0.69 0.93 0.56 0.30
U.S. Japan U.K. Canada
Dom. World Intl. Dom. World Intl. Dom. World Intl. Dom. World Intl.
Panel B: Weighted factor regressions
H-L a 0.37 -0.30 0.20 0.40 0.89 0.38 0.63 0.51 0.66 0.81 1.37 0.79 p-value (0.13) (0.43) (0.42) (0.20) (0.06) (0.23) (0.00) (0.25) (0.00) (0.02) (0.00) (0.02) F-statistic 6.27* 5.87* 5.22* 1.40 1.03 1.26 3.50* 3.70* 3.16* 6.01* 6.23* 5.86* Avg. Ial 0.34 0.42 0.37 0.48 0.29 0.39 0.29 0.45 0.30 0.48 0.61 0.47 AVW. lai 0.12 0.56 0.17 0.46 0.33 0.37 0.16 0.09 0.15 0.21 0.60 0.34 Adj. R2 0.804 0.513 0.807 0.809 0.566 0.813 0.822 0.387 0.821 0.601 0.301 0.610
Panel C: Unweighted factor regressions
H-L a 0.50 -0.14 0.39 0.36 0.82 0.27 0.58 0.12 0.60 0.82 1.04 0.77 p-value (0.03) (0.71) (0.08) (0.22) (0.09) (0.35) (0.00) (0.75) (0.00) (0.02) (0.01) (0.02) F-statistic 6.70* 5.48* 5.13* 1.12 0.85 0.84 3.15* 3.40* 2.81* 6.18* 5.15* 5.32* Avg. jai 0.33 0.45 0.33 0.28 0.29 0.22 0.32 0.50 0.32 0.48 0.58 0.48 Avw. jal 0.11 0.58 0.14 0.28 0.36 0.20 0.19 0.15 0.19 0.22 0.53 0.31 Adj. R2 0.836 0.546 0.839 0.832 0.559 0.832 0.833 0.552 0.832 0.615 0.422 0.620
*Denotes significance at the 1% level.
For the United States, Japan, and the United Kingdom, 25 size and book-to-market equity portfolios are formed by five independent sorts on size and five sorts on BEIME each year. (For Canada, nine size and BE/ME portfolios are used.) Details on portfolio formation appear in the data appendix. The dollar-denominated returns on each portfolio are in excess of each country's local dollar-denominated risk-free rate over the period January 1981-December 1995. Panel A presents summary statistics for raw excess portfolio returns. The high minus low portfolio return (H-L ret.) is the difference in the average return between the smallest size and highest BE/ME portfolio, and the largest size and lowest BE/ME portfolio. The table also reports the equal- and value-weighted cross-sectional average of the absolute value of the average return for each portfolio. The following time-series factor model regressions are estimated for each portfolio:
Domestic model: rit = ai + bDi (WDt- I DMRFt) + SDi (WDt- I DSMBt) + hDi (WDt- I DHMLt) + ei
World model: rit = ai +bi(WMRF) +si(WSMBt) +hi(WHMLt) +ei
International model: rit = ai + bDi (WDt-I DMRFt) + SDi (WDt- I DSMBt) + hDi (WDt-I DHMLO)
+ bFi (WFt- I FMRFt) + SFi (WFt-I FSMBt) + hFi (wFt1l FHMLt) + ei
Panel B presents results for regressions with value-weighted factors. Panel C presents unweighted (wD = WF = 1) factor results. The difference in the alphas is between the high- and low-return portfolios (H-L a). For all portfolios, the table reports the Gibbons, Ross, and Shanken (1989) F-statistic, and equal- and value-weighted averages of the absolute value of the average portfolio intercept and the average adjusted R2.
F-statistics are used. Except for the Japanese portfolios, the F-statistic stron- gly rejects the null that the intercepts are jointly equal to zero for all spec- ifications. Based on comparison of the extreme portfolio returns tests and the GRS F-tests, we reject all three model specifications. Furthermore, these criteria do not yield a consistent ranking among the models.
Average absolute values of intercepts are used to compare the ability of the models to explain average portfolio returns. The equal-weighted average absolute intercepts in Table 3 are closer to zero for the domestic models
791
The Review of Financial Studies / v 15 n 3 2002
than for the world model in all countries except Japan. Value-weighted aver- age pricing errors are used in an international context by Ferson and Harvey (1994), and advocated as an economic measure of model performance by Kan and Zhang (1995). The value-weighted average absolute intercepts are closer to zero for the domestic models for U.S. and Canadian portfolios, but not for the Japanese and U.K. portfolios. With unweighted factors, domestic models yield lower equal-weighted average absolute intercepts than does the world model in all countries, and lower value-weighted average absolute alphas in all countries except the United Kingdom. Domestic models generally provide more accurate pricing than the world model. A comparison of average inter- cepts between domestic three-factor and international six-factor models for both weighted and unweighted regressions shows that each model has lower intercepts about half the time. There is little difference in the ability of the domestic and international models to capture the average portfolio returns.
Finally, to examine the ability of the factor models to explain time-series variation in portfolio returns, adjusted R2s are compared across models. Weighted domestic three-factor models have average adjusted R2s that are substantially higher than the world three-factor regression R2s in the United States (0.804 compared to 0.513), Japan (0.809 compared to 0.566), the United Kingdom (0.822 compared to 0.387), and Canada (0.601 compared to 0.301). We also observe large differences in adjusted R2s for unweighted regressions. The international six-factor model has a slightly higher average adjusted R2 than does the domestic three-factor model in three of the four countries with weighted factors, but the average adjusted R2 of the interna- tional model is slightly higher in only two countries with unweighted factors.
Overall, these portfolio results show that all models are formally rejected as asset pricing models, as indicated by the large GRS F-statistics and the inability of all models to explain differences in average returns for the extreme portfolios. Domestic factor model regressions yield large increases in factor model explanatory power (higher R2s) and generally lower pricing errors than the world model. Adding foreign factors to the domestic mod- els yields only small increases in explanatory power (R2s) and often higher pricing errors, indicating few advantages to the use of foreign factors.
4. Tests with Individual Securities
In this section we focus on the ability of domestic, world, and international factor model regressions to explain individual security returns. Each month, beginning with January 1981, individual security regressions are estimated over 132 rolling 60-month periods. The last period ends in December 1995. By restricting each period to five years of monthly observations, we allow for the possibility that the structural parameters bi, si, and hi in Equations (1), (2), and (3) change over time.9
9 We also use three-year periods and obtain qualitatively similar results.
792
Fama and French Factors
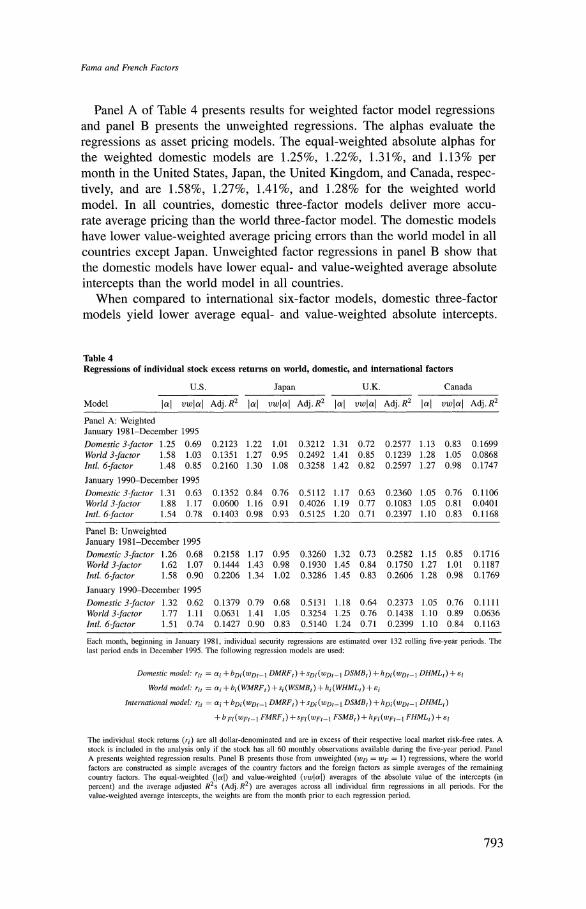
Panel A of Table 4 presents results for weighted factor model regressions and panel B presents the unweighted regressions. The alphas evaluate the regressions as asset pricing models. The equal-weighted absolute alphas for the weighted domestic models are 1.25%, 1.22%, 1.31%, and 1.13% per month in the United States, Japan, the United Kingdom, and Canada, respec- tively, and are 1.58%, 1.27%, 1.41%, and 1.28% for the weighted world model. In all countries, domestic three-factor models deliver more accu- rate average pricing than the world three-factor model. The domestic models have lower value-weighted average pricing errors than the world model in all countries except Japan. Unweighted factor regressions in panel B show that the domestic models have lower equal- and value-weighted average absolute intercepts than the world model in all countries.
When compared to international six-factor models, domestic three-factor models yield lower average equal- and value-weighted absolute intercepts.
Table 4 Regressions of individual stock excess returns on world, domestic, and international factors
U.S. Japan U.K. Canada
Model Il! vwlal Adj.R2 Il! vwlal Adj.R2 Il! vwlal Adj.R2 Ial vwlal Adj. R2
Panel A: Weighted January 1981-December 1995
Domestic 3-factor 1.25 0.69 0.2123 1.22 1.01 0.3212 1.31 0.72 0.2577 1.13 0.83 0.1699 World 3-factor 1.58 1.03 0.1351 1.27 0.95 0.2492 1.41 0.85 0.1239 1.28 1.05 0.0868 Intl. 6-factor 1.48 0.85 0.2160 1.30 1.08 0.3258 1.42 0.82 0.2597 1.27 0.98 0.1747
January 1990-December 1995
Domestic 3-factor 1.31 0.63 0.1352 0.84 0.76 0.5112 1.17 0.63 0.2360 1.05 0.76 0.1106 World 3-factor 1.88 1.17 0.0600 1.16 0.91 0.4026 1.19 0.77 0.1083 1.05 0.81 0.0401 Intl. 6-factor 1.54 0.78 0.1403 0.98 0.93 0.5125 1.20 0.71 0.2397 1.10 0.83 0.1168
Panel B: Unweighted January 1981-December 1995
Domestic 3-factor 1.26 0.68 0.2158 1.17 0.95 0.3260 1.32 0.73 0.2582 1.15 0.85 0.1716 World 3-factor 1.62 1.07 0.1444 1.43 0.98 0.1930 1.45 0.84 0.1750 1.27 1.01 0.1187 Intl. 6-factor 1.58 0.90 0.2206 1.34 1.02 0.3286 1.45 0.83 0.2606 1.28 0.98 0.1769
January 1990-December 1995
Domestic 3-factor 1.32 0.62 0.1379 0.79 0.68 0.5131 1.18 0.64 0.2373 1.05 0.76 0.1111 World 3-factor 1.77 1.11 0.0631 1.41 1.05 0.3254 1.25 0.76 0.1438 1.10 0.89 0.0636 Intl. 6-factor 1.51 0.74 0.1427 0.90 0.83 0.5140 1.24 0.71 0.2399 1.10 0.84 0.1163
Each month, beginning in January 1981, individual security regressions are estimated over 132 rolling five-year periods. The last period ends in December 1995. The following regression models are used:
Domestic model: rit = ?i +bDi(wDt- I DMRFt) + sDi(WDt.- I DSMBt) + hDi(wDDt- I DHMLt) +? i
World model: rit = ai + bi(WMRFt) + si (WSMBt) + hi (WHMLt) + si
Iznternational model: rit = ?i +bDi (WDt- I DMRFt) + SDi (WDt.-I DSMBt) + hDi(wDt- I DHMLt)
+ b Fi (WFt- I FMRFt) + sFi (WFt- I FSMBt) + hFi (WFt- I FHMLt) + ?i
The individual stock returns (ri) are all dollar-denominated and are in excess of their respective local market risk-free rates. A stock is included in the analysis only if the stock has all 60 monthly observations available during the five-year period. Panel A presents weighted regression results. Panel B presents those from unweighted (wD = WF = 1) regressions, where the world factors are constructed as simple averages of the country factors and the foreign factors as simple averages of the remaining country factors. The equal-weighted (lal) and value-weighted (vwlal) averages of the absolute value of the intercepts (in percent) and the average adjusted R2s (Adj. R2) are averages across all individual firm regressions in all periods. For the value-weighted average intercepts, the weights are from the month prior to each regression period.
793
The Review of Financial Studies / v 15 n 3 2002
This result holds for both weighted and unweighted factors. The subpe- riod of the 1990s is examined separately to see if the importance of foreign factors has increased over time. For both weighted and unweighted factors, the results for the 1990s show that the domestic models again have lower equal- and value-weighted average absolute intercepts. The domestic models provide more accurate average pricing than both the world and international models.
The R2s evaluate the factor models in terms of their usefulness in explain- ing time-series variations in returns. In all countries, the weighted domes- tic model average adjusted R2s are substantially higher than the R2s for world three-factor regressions. The international six-factor models increase the average adjusted R2 by only 0.0033, 0.0042, 0.0022, and 0.0051 in the United States, Japan, the United Kingdom, and Canada, respectively. The increase in the average adjusted R2 due to the addition of foreign factors can be expressed relative to the total average adjusted R2 for the six-factor model. The proportion of the explained variance attributable to foreign fac- tors is 1.62%, 1.30%, 0.87%, and 2.97% in the United States, Japan, the United Kingdom, and Canada, respectively. For the 1990s, the percentages are 3.43%, 0.26%, 1.89%, 4.58%, respectively, indicating that the impor- tance of foreign factors increases only slightly over time. Foreign factors also explain only a small proportion of the total variation in stock returns in unweighted regression specifications.
To measure the statistical significance of foreign factors, we compare six- factor regressions to six-factor regressions with the same domestic factors but simulated foreign factors. Since the simulated foreign factors should bear no relation to stock returns, regressions with the simulated factors can be used to form an empirical distribution of alphas and R2s for the null that foreign factors do not explain stock returns. These simulations (which are described in Appendix B) show that foreign factors produce small but statistically sig- nificant increases in adjusted R2s, but statistically insignificant increases in absolute alphas.
In sum, both the full sample (1981-1995) and later period (1990-1995) regression results demonstrate that domestic three-factor models have much greater explanatory power, and in most instances lower pricing errors, than does the world three-factor model. This result holds for both weighted and unweighted factors. The gain in explanatory power of international six-factor models is marginal. The international models produce intercepts that are actu- ally farther from zero than with purely domestic models, indicating that for- eign factors do not lead to better pricing.
5. Out-of-Sample Evidence
This section examines the differences in cost of capital estimates between models and the relative accuracy of these estimates.
794
Fama and French Factors
5.1 Is the model choice relevant? One question related to our findings is whether the choice of domestic or international models has any material effect in practice, such as estimating expected returns used in common applications, for example, calculating the cost of capital. We investigate this question by estimating five-year rolling regressions, every month beginning in 1981, using individual stocks for each of the three main models. We use regressions without intercept terms because this has been shown to generate more accurate expected return estimates by Fama and French (1997) and Simin (2000). Ferson and Locke (1998) show that using the past historical average leads to better forecasts of the market return than a 60-month historical average. Therefore we use the average fac- tor return over the entire data period prior to the forecast to calculate expected factor returns. Fama and French (1997) use the full sample period to calcu- late average factor returns. However, this approach is not implementable, since future return observations are not known at the time that estimates are made.10 Multiplying the estimated regression beta coefficients with the realized average factor returns forms expected return estimates for the next month. With weighted factors, the average absolute difference in expected return estimates between the domestic and world models is 8.41%, 6.09%, 9.35%, 9.14% per year for the United States, Japan, the United Kingdom, and Canada, respectively. The choice between a domestic or international fac- tor model shows smaller differences in expected return estimates of 7.14%, 6.43%, 5.33%, 6.25% in the United States, Japan, the United Kingdom, and Canada, respectively. The choice of a domestic, global, or international model has a substantial impact on expected return estimates.
5.2 Out-of-sample forecast errors These findings lead to the question of which model yields more accurate forecasts of actual returns. One advantage of out-of-sample evaluation is that it is a helpful way of evaluating the costs of estimation error in factor loadings. For example, even though foreign factors have some in-sample explanatory power, adding foreign factors to a purely domestic model could yield less-accurate expected return estimates if there is substantial estimation error in foreign factor loadings.
For each stock, out-of-sample forecast errors are generated by using next month's stock returns in excess of the expected return estimates formed as discussed in the previous subsection. It is interesting to note that forecast errors are large in magnitude for all models, but there is a clear ranking among models. The mean absolute monthly forecast errors for the domes- tic models with weighted factors are 9.87%, 8.86%, 8.13%, and 7.25% in the United States, Japan, the United Kingdom, and Canada, respectively, as
compared to 9.89%, 8.90%, 8.22%, and 7.33%, respectively, for the world
10 Nevertheless, we also use this approach and find that it yields a similar out-of-sample ranking between models.
795
The Review of Financial Studies / v 15 n 3 2002
model and 9.90%, 8.89%, 8.16%, and 7.30% with the international six-factor model. The world and international models produce less accurate forecasts than do the domestic three-factor models for all four countries." In addition, the median absolute and root mean square forecast errors are also lower for the domestic models than for the world and international models in all four countries. Unweighted factor models also yield similar conclusions. World and international factor models yield less accurate estimates of future returns than domestic models.
6. Additional Evidence
6.1 Sensitivity to the formation of the world factors The preceding analysis forms the three world factors (WMRF, WSMB, and WHML) either as a value-weighted average of individual country factors (weighted) or as an equal-weighted average of the individual country factors (unweighted). Another possible way to construct world size and book-to- market factors is to ignore cross-country differences (particularly in account- ing conventions) and to form the world factor breakpoints for BE/ME and dollar-denominated market value by pooling stocks in all countries. Foreign factors can also be formed in a similar manner by ignoring cross-country differences and forming factors from securities in the other three countries. World and foreign SMB and HML factors formed in this way are used in regressions for individual stocks (similar to results reported in Table 4). The average adjusted R2s for these world factor regressions indicate some increase in explanatory power over the previously constructed, weighted world fac- tors. However, in all countries, the domestic three-factor models still have substantially higher average adjusted R2s than the world model. Forming world and foreign factors without regard to country composition does not impact our conclusions.'2
6.2 Other international models In unreported results (available on request), we also consider two other international models: a domestic three-factor model with a foreign-market return and a domestic three-factor model with a foreign-market return and the change in the country's exchange rate with the dollar.'3 In both weighted and unweighted specifications for individual stocks, the domestic three-factor model has lower equal- and value-weighted absolute intercepts than these other two models in all countries. Except for the value-weighted average
The forecast error results are available on request.
12 We also examine the impact of the currency of denomination. Local currency returns in excess of local interest rates are regressed on local currency denominated factors for individual stock regressions. These regressions yield similar findings to those in Table 4.
13 For the United States, the dollar/yen rate is used.
796
Fama and French Factors
intercept in Japan, equal- and value-weighted average absolute pricing errors are always higher for the world three-factor and international six-factor mod- els than these other two international models. Among other international models, the Fama and French world and international models perform poorly.
6.3 Usefulness of factors The time-series tests indicate that foreign factors have little explanatory power. To more thoroughly study the importance of foreign factor loadings, we estimate international six-factor regressions using individual stocks over two-year (or three-year) nonoverlapping periods. The Spearman rank corre- lations between factor loadings on the foreign SMB and HML are close to zero and statistically insignificant. There is no evidence that stocks with high foreign SMB or T-/ItL loadings in one period have higher loadings in the next period.'4
To examine the importance of foreign factor loadings for portfolios, we estimate seemingly unrelated time-series regressions (SUR) separately for the 25 size and BE/ME portfolios in each country. The tests demonstrate that only 3 of 12 foreign coefficients are significantly different from zero, and that the foreign HML factor is insignificant in all countries. A joint F-test shows that the weighted foreign SMB and HML factors are insignificant in all countries except Canada.'5
6.4 Cross-sectional tests Kan and Zhang (1999) caution that t-statistics from Fama and MacBeth (1973) regressions can be extremely misspecified when a factor is not useful in time series. The intuition is that if the true beta of a factor is close to zero (which Kan and Zhang term a "useless factor") then to explain the cross- sectional variation in returns, the absolute value of the risk premium must approach infinity. Since our previous rQsults find only a trivial role for foreign factors, using these factor loadings in a second-stage cross-sectional analy- sis could lead to spurious findings. Nevertheless, we perform second-pass, cross-sectional regressions on the factor loadings from first-pass weighted six-factor regressions for the size and BE/ME portfolios. Despite the fact that these foreign risk premia are likely to be biased upward (in absolute value), only 1 of the 12 foreign coefficients is significantly positive.'6
14 These results are available on request.
15 The use of unweighted factors leads to similar findings.
16 First-pass regressions for these portfolios are estimated over the entire period, as suggested by Chan and Chen (1988). In the United States, there is a negative price of foreign MRF risk (t-statistic = -2.14) and a significant positive price of foreign HML risk (t-statistic = 1.96). These standard errors are corrected for heteroscedasticity and autocorrelation as suggested by Ahn and Gadarowski (2000). Correcting for errors in variables, as suggested by Shanken (1992), yields t-statistics of -1.78 and 2.31, respectively, on the price of FMTB and FHML risk in the United States. Given that the significance of the foreign HML factor is strongly rejected in the previously discussed time-series SUR regressions for the same portfolios, this significance for the United States could be spurious. These results are available on request.
797
The Review of Financial Studies / v 15 n 3 2002
7. Conclusion
This article examines the usefulness of domestic, world, and international versions of the Fama and French factor model for equity returns. F-tests of the null hypothesis that the portfolio intercepts are jointly equal to zero are rejected for all models. Thus none of the models completely capture aver- age returns when used as asset pricing models. However, country-specific (domestic) versions of the three-factor model are more useful at explaining time-series variation in portfolio and individual stock returns than a world three-factor model. Domestic factor model regressions also generally yield lower average pricing errors than the world model-particularly for individ- ual securities.
We also examine international models that incorporate both foreign and domestic factors. The international models with actual foreign factors produce increases in explanatory power as measured by regression R2s. However, the economic importance of the increase is trivial. Moreover, in individual secu- rity regressions, alphas are smaller for the domestic (country-specific) three- factor models, indicating that the inclusion of foreign factors do not reduce the average pricing errors. These findings are robust to alternative ways of forming world and foreign factors and hold up in the 1990s as well. In addi- tion, domestic three-factor models also yield lower out-of-sample pricing errors.
The findings in this article do not support the notion that there are benefits to extending the Fama and French three-factor model to a global context. Country-specific three-factor models are more useful in explaining average stock returns than are world and international versions. These findings have important implications. Cost-of-capital calculations, performance measure- ment, and risk analysis using Fama and French-style models are best done on a within-country basis. It is important to note that our findings do not directly speak to a wider array of models. Better risk proxies may ascribe a more important role to global factors. Future research should focus on understanding what international factors, if any, are useful in obtaining more accurate cost-of-capital estimates.
Appendix A: Data and Portfolio Formation
A.1 Japanese data All Japanese data comes from the Pacific-Basin Capital Markets (PACAP) database. Constructing the size and book-to-market equity portfolios closely follows the procedure described by Fama and French (1993). In portfolio rankings, we use all nonfinancial PACAP firms from Sections 1 and 2 of the Tokyo Stock Exchange with positive book equity and returns available in September. For the September portfolio rankings, the book-to-market equity variable is defined as total shareholder's equity on or preceding March 31, divided by the total market capitalization on
798
Fama and French Factors
March 31. All stocks meeting the selection criteria are ranked independently into five groups based on their BE/ME and five groups based on their September market capitalization. The intersection of the five BE/ME and five market capitalization rankings are used to form the 25 size and book-to-market value-weighted portfolio returns.
The Japanese variables JHML and JSMB are constructed from rankings on book-to-market equity and market capitalization similar to those above. All PACAP stocks with positive book equity on or before each March 31 fiscal year-end and market capitalizations as of March 31 and September 30 are ranked (independently) according to their size and BE/ME. Half of the firms are classified as small market capitalization (S for small) and the other half as large mar- ket capitalization stocks (B for big). For the book-to-market classification, the bottom 30% are designated as low BE/ME firms (L), the middle 40% as M, and the highest 30% as H. The inter- section of the rankings allows for six value-weighted portfolios: HB, MB, LB, HS, MS, and LS. The return variable JSMB (Japanese small minus big) = (HS +MS +LS - HB - MB - LB)/3, and the return JHML (Japanese high minus low) = (HB + HS - LB - LS)/2. The low (L) and high (H) BE/ME portfolios are formed as L = LS + LB and H = HS + HB.
A.2 U.K. data End-of-the-month data for all nonfinancial London Stock Exchange stocks, exchange rates, a value-weighted market index, and short-term interest rates are from Datastream International. Delisted securities are included to control for survivorship bias. Book-to-market equity is calcu- lated as the inverse of the Datastream market-to-book value. Similar to U.S. firms, many U.K. companies have December fiscal year-ends. Consequently, stocks with book-to-market equity values from the preceding December and market capitalizations as of June 30 are ranked (inde- pendently) according to their size and BE/ME. The remaining procedure for forming KHML and KSMB is identical to that described above for Japanese stocks.
A.3 Canadian data All Canadian data is from Datastream. Thus many of the construction details are similar to those discussed above for the United Kingdom. Canadian nonfinancial common stocks are members of the Toronto Stock Exchange. This is the only Canadian exchange for which Datastream has extensive coverage prior to the late 1980s. Because Datastream do not include delisted securities prior to 1991, the data prior to this date do suffer from survivorship bias. U.S.-listed Canadian equities are excluded from the sample after the U.S. listing month, because previous research by Jorion and Schwartz (1986) and Mittoo (1992) finds substantial differences between U.S.- listed and non-U.S.-listed Canadian equities. Canadian non-U.S.-listed stocks with market values less than two million 1975 Canadian dollars are excluded from the analysis. Listing dates are obtained by using the first day of coverage by Datastream on a U.S. exchange, and directly from the NYSE, AMEX, and NASDAQ fact books.
Because systematic differences might exist between firms with book-to-market values, firms with "missing" book-to-market values are included in the analysis in a missing category. To form portfolios, all stocks meeting the above selection criteria (with one of the groups for firms with missing BE/ME) are separated into three groups based on their BE/ME and three groups on market capitalization. The intersection forms the nine size and book-to-market portfolios. For the formation of the Canadian HML and SMB, we use only firms with book-to-market equity.
A.4 U.S. data For tests with U.S. data, we use all nonfinancial NYSE, AMEX, and NASDAQ stocks provided by Center for Research in Security Prices (CRSP) with Compustat book values available in the preceding year and CRSP market values available in June. Portfolios are formed every June according to rankings on book-to-market equity from the preceding year and on June market
799
The Review of Financial Studies / v 15 n 3 2002
values. The selection criteria and portfolio formation procedure closely follow that of Fama and French (1993), and thus is similar to the description above for Japanese data.
Appendix B: A Comparison of Foreign Factors to Simulated Factors
To test the statistical significance of foreign factors, we use empirical distributions from regres- sions with simulated foreign factors. The simulated foreign factors are generated from a multi- variate normal distribution that has the same mean and variance/covariance matrix as the actual weighted foreign factors and the same covariance with domestic factors. Under the null that the foreign factors are not useful in explaining time-series variation in security returns, the simu- lated foreign factors should only explain domestic stock returns through their covariance with the domestic factors.
For each individual stock regression of the international model, we estimate 500 regressions with the simulated factors. In these regressions the domestic factors are the actual ones and do not change across trials.17 If foreign factors lead to better pricing, then the regressions with the true foreign factors should have lower intercepts and higher adjusted R2s than the regressions with random foreign factors. For each regression, the empirical p-value of the R2 (absolute intercept) is calculated as the fraction of the simulated regressions that have adjusted R2s (absolute intercepts) greater (smaller) than that obtained from the actual regression. Under the null hypothesis that actual foreign factors perform no better than simulated ones, p-values across regressions should be distributed uniformly between zero and one.
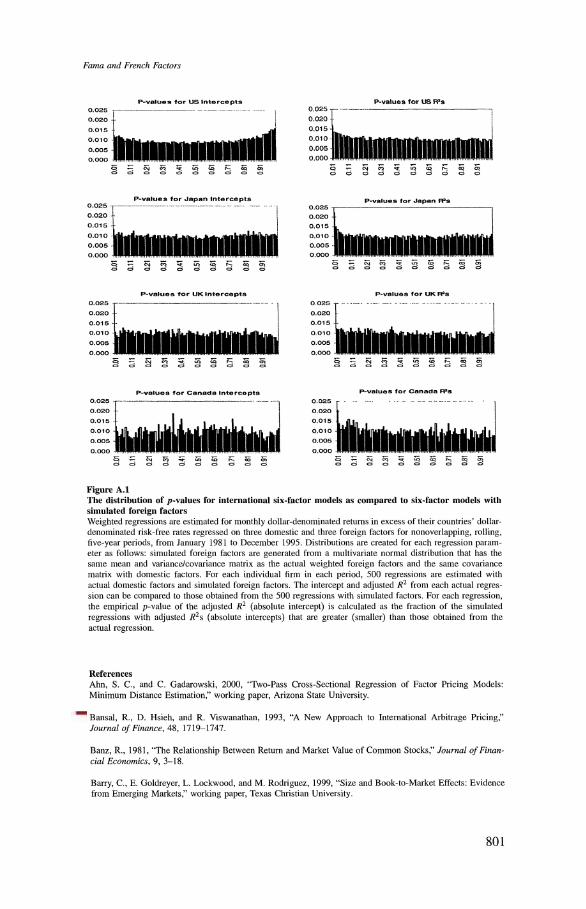
For each country, Figure A.1 displays the distributions of the p-values for both the absolute value of the intercepts and the adjusted R2s from the weighted six-factor regressions. P-values for absolute intercepts appear uniformly distributed, except for the United States. In the United States, the figure shows a disproportionate share of high-intercept p-values, indicating that actual foreign factors perform slightly worse than the simulated factors. The figures for the R2s indi- cate slightly more low p-values in all countries. Foreign factors appear to provide statistically significant improvements in explanatory power for a slightly larger share of stocks than could be attributed to chance.
To summarize these figures, we find that for the United States, Japan, and Canada, more than half of the regressions have lower absolute intercepts from regressions with simulated factors than from those with actual factors. In contrast, foreign factors lead to an increase in explanatory power (as compared to simulated factors) for slightly more than half the securities. To calculate empirical p-values, we use the fraction of the average absolute intercepts (R2s) from the 500 simulated factor regressions that are smaller (larger) than the average absolute intercept (R2) from the actual foreign factor regressions.18 The high p-values for the absolute intercepts indicate that none of the country averages are statistically different from absolute intercepts with simulated factors. R2s are significant at the 5% level in all countries. However, the average increase in R2s from foreign factors beyond simulated factors is only 0.0033, 0.0043, 0.0021, 0.0051 in the United States, Japan, the United Kingdom, and Canada, respectively, indicating that the economic importance is small. The main conclusion that emerges from this analysis is that regressions with foreign factors are useful in explaining a small but statistically significant amount of time-series variation in individual stock returns, but do not lead to more accurate pricing.
17 We address the validity of this procedure with a Monte Carlo experiment, discussed below. See Noreen (1989) and Efron and Tibshirani (1993) for a discussion of bootstrap methods in regression analysis. The concept here is similar, except the factors are created through simulations. These results are available on request.
18 To assess the ability of this procedure to determine the importance of foreign factors, we perform a Monte Carlo analysis. We simulate stock returns from different worlds, where between 0 and 5% of the variation in returns is attributed to foreign factors and the remaining component to domestic factors. In this synthetic world, the procedure has power to detect a statistically significant increase in R2 when only 1% or 2% of the variation in returns is due to foreign factors.
800
Fama and French Factors
P-values for US Intercepts P-values for US WS's
0.025 T -- . 0.025 .-_ -
0.020 0.020
0.015 0.01 5l
0.010 _____________ __ 0.010
0.005~ __0 005
0.000 .
0.................. O__
= C). C O C3 ED i: X: C> 0= _ i c C3 3 i C3 C3 U6 <C3 i
P-values for Japan Intercepts P-values for Japan RFa 0.025 - - -- 0.025
0.020 0.020
0.015 - i 0.015
0o010 , 0010
0000. 00000 0.00 5 _ _ _ _ _ _ _ _ _ _ _ _ _ _ 0 005
P-values for UK Intercepts P-values for UK R2s
0.025 - _ 0.025 -. -
0.020 0.020
0.015 0015
0.010 C) 0 010
0.005 __ 0005 __
0.000 0.000
P-values for Canada Intercepts P-values for Canada R2s
0.025 0-.025--- --- 0._
0.020 ................... 0.020 0.015
0.015
0.010 --010 20 0.0105.0 0.005 0.005
Figure A.1 The distribution of p-values for international six-factor models as compared to six-factor models with simulated foreign factors Weighted regressions are estimated for monthly dollar-denominated retums in excess of their countries' dollar- denominated risk-free rates regressed on three domestic and three foreign factors for nonoverlapping, rolling, five-year periods, from January 1981 to December 1995. Distributions are created for each regression param- eter as follows: simulated foreign factors are generated from a multivariate normal distribution that has the same mean and variance/covariance matrix as the actual weighted foreign factors and the same covariance matrix with domestic factors. For each individual firm in each period, 500 regressions are estimated with actual domestic factors and simulated foreign factors. The intercept and adjusted R2 from each actual regres- sion can be compared to those obtained from the 500 regressions with simulated factors. For each regression, the empirical p-value of the adjusted R2 (absolute intercept) is calculated as the fraction of the simulated regressions with adjusted R2s (absolute intercepts) that are greater (smaller) than those obtained from the actual regression.
References Ahn, S. C., and C. Gadarowski, 2000, "Two-Pass Cross-Sectional Regression of Factor Pricing Models: Minimum Distance Estimation," working paper, Arizona State University.
Bansal, R., D. Hsieh, and R. Viswanathan, 1993, "A New Approach to Intemational Arbitrage Pricing," Journal of Finance, 48, 1719-1747.
Banz, R., 1981, "The Relationship Between Retum and Market Value of Common Stocks," Journal of Finan- cial Economics, 9, 3-18.
Barry, C., E. Goldreyer, L. Lockwood, and M. Rodriguez, 1999, "Size and Book-to-Market Effects: Evidence from Emerging Markets," working paper, Texas Christian University.
801
The Review of Financial Studies / v 15 n 3 2002
Berk, J. B., 1995, "A Critique of Size Related Anomalies," Review of Financial Studies, 8, 275-286.
Berk, J. B., 2000, "Sorting Out Sorts," Journal of Finance, 55, 407-427.
Bekaert, G., and R. Hodrick, 1992, "Characterizing Predictable Components in Excess Returns on Equity and Foreign Exchange Markets," Journal of Finance, 47, 467-509.
Campbell, J., and Y Hamao, 1992, "Predictable Stock Returns in the United States and Japan: A Study of Long-Term Capital Market Integration," Journal of Finance, 47, 43-69.
Capaul, C., I. Rowley, and W. F. Sharpe, 1993, "International Value and Growth Stock Returns," Financial Analysts Journal, January-February, 27-36.
Chan, K. C., and N. Chen, 1988, "An Unconditional Asset-Pricing Test and the Role of Firm Size as an Instrument for Risk," Journal of Finance, 43, 309-325.
Chan, K. C., N. Chen, and D. Hsieh, 1985, "An Exploratory Investigation of the Firm Size Effect," Journal of Financial Economics, 14, 451-471.
Chan, L. K. C., Y. Hamao, and J. Lakonishok, 1991, "Fundamentals and Stock Returns in Japan," Journal of Finance, 46, 1739-1764.
Chan, K. C., G. Karolyi, and R. Stulz, 1992, "Global Financial Markets and the Risk Premium on U.S. Equity," Journal of Financial Economics, 32, 137-167.
Daniel, K., and S. Titman, 1997, "Evidence on the Characteristics of Cross-Sectional Variation in Stock Returns," Journal of Finance, 52, 1-33.
Daniel, K., and S. Titman, and J. Wei, 2001, "Explaining the Cross-Section of Stock Returns in Japan: Factors or Characteristics?," Journal of Finance, 56, 743-766.
Davis, J., E. F. Fama, and K. R. French, 2000, "Characteristics, Covariances, and Average Returns: 1929-1997," Journal of Finance, 55, 389-406.
Efron, B., and R. J. Tibshirani, 1993, An Introduction to the Bootstrap, Chapman & Hall, New York.
Fama, E. F., and K. R. French, 1993, "Common Risk Factors in the Returns on Stocks and Bonds," Journal of Financial Economics, 33, 3-56.
Fama, E. F., and K. R. French, 1997, "Industry Costs of Equity," Journal of Financial Economics, 43, 153-193.
Fama, E. F., and K. R. French, 1998, "Value versus Growth: The International Evidence," Journal of Finance, 53, 1975-1999.
Fama, E. F., and J. D. MacBeth, 1973, "Risk, Return, and Equilibrium: Empirical Tests," Journal of Political Economy, 81, 607-636.
Ferson, W. E., 1995, "Theory and Empirical Testing of Asset Pricing Models," in R. Jarrow, V. Maksimovic, and W. T. Ziemba (eds.), Finance, Handbook in Operations Research and Management Science, Elsevier, Amsterdam.
Ferson, W. E., and C. R. Harvey, 1993, "The Risk and Predictability of International Equity Returns," Review of Financial Studies, 6, 527-565.
Ferson, W. E., and C. R. Harvey, 1994, "Sources of Risk and Expected Returns in Global Equity Markets," Journal of Banking and Finance, 18, 775-803.
Ferson, W. E., and C. R. Harvey, 1997, "Fundamental Determinants of National Equity Market Returns: A Perspective on Conditional Asset Pricing," Journal of Banking and Finance, 21, 1625-1665.
Ferson, W. E., and C. R. Harvey, 1999, "Conditioning Variables and the Cross-Section of Stock Returns," Journal of Finance, 54, 1325-1360.
Ferson, W. E., and D. H. Locke, 1998, "Estimating the Cost of Capital Through Time: An Analysis of the Sources of Error," Management Science, 44, 485-500.
802
Fama and French Factors
Ferson, W. E., S. Sarkissian, and T. Simin, 1999, "The Alpha Factor Asset Pricing Model: A Parable," Journal of Financial Markets, 2, 49-68.
Gibbons, M. R., S. A. Ross, and J. Shanken, 1989, "A Test of the Efficiency of a Given Portfolio," Econo- metrica, 57, 1121-1151.
Griffin, J. M., and M. Lemmon, 2001, "Does Book-to-Market Equity Proxy for Distress Risk or Mispricing?," working paper, Arizona State University.
Gultekin, M. N., N. B. Gultekin, and A. Penati, 1989, "Capital Controls and Intemational Capital Market Seg- mentation: The Evidence from the Japanese and American Stock Markets," Journal of Finance, 44, 849-860.
Harvey, C. R., 1991, "The World Price of Covariance Risk," Journal of Finance, 46, 111-157.
Haugen, R., 1995, The New Finance: The Case Against Efficient Markets, Prentice Hall, Englewood Cliffs, NJ.
Hawawini, G., and D. B. Keim, 1997, "The Cross Section of Common Stock Retums: A Review of the Evidence and Some New Findings," working paper, University of Pennsylvania.
Jorion, P., and E. Schwartz, 1986, "Integration vs. Segmentation in the Canadian Stock Market," Journal of Finance, 41, 603-614.
Kan, R., and C. Zhang, 1995, "The Value-Weighted Average Mis-specification in Asset Pricing Models," working paper, University of Toronto.
Kan, R., and C. Zhang, 1999, "Two-Pass Tests of Asset Pricing Models with Useless Factors," Journal of Finance, 54, 203-235.
Korajczyk, R. A., and C. J. Viallet, 1989, "An Empirical Investigation of International Asset Pricing," Review of Financial Studies, 2, 553-585.
Lakonishok, J., A. Shleifer, and R. W. Vishny, 1994, "Contrarian Investnient, Extrapolation, and Risk," Journal of Finance, 49, 1541-1578.
Liew J., and M. Vassalou, 2000, "Can Book-to-Market, Size and Momentum be Risk Factors that Predict Economic Growth?," Journal of Financial Economics, 57, 221-245.
Mittoo, U. R., 1992, "Additional Evidence on Integration in the Canadian Stock Market," Journal of Finance, 47, 2035-2054.
Noreen, E. W., 1989, Computer Intensive Methods for Hypothesis Testing: An Introduction, Wiley, New York.
Shanken, J., 1992, "On the Estimation of Beta-Pricing Models," Review of Financial Studies, 5, 1-33.
Simin, T., 2000, "The Predictive Performance of Asset Pricing Models," working paper, University of Washington.
Solnik, B., 1983, "International Arbitrage Pricing Theory," Journal of Finance, 38, 449-457.
Stulz, R. M., 1995, "International Asset Pricing: An Integrative Survey," in R. Jarrow, V. Maksimovic, and W. T. Ziemba (eds.), The Handbook of Modern Finance, North Holland, Amsterdam.
803