are new yorkers ready for retirement? - office of the ... are new yorkers ready for retirement? |...
TRANSCRIPT

Are New Yorkersready forretirement?
JANUARY 2012New York City ComptrollerJohn C. LiuNew York City Comptroller

JOHN C. LIUComptroller
First Deputy ComptrollerEric V. Eve
Deputy Comptroller for Accountancy & Budget
Simcha Felder
Assistant Comptroller for Budget & Chief Policy Officer
Ari Hoffnung
Executive Director, BudgetJonathan Rosenberg
Executive Director, Corporate GovernanceMichael Garland
Chief EconomistFrank Braconi, Ph.D.
Bureau Chief, Fiscal & Budget Studies Eng-Kai Tan
Bureau Chief, Financial AnalysisKirk Parks
Assistant Bureau Chief, Fiscal & Budget StudiesManny Kwan
Senior Advisor to the ComptrollerSharon Lee
AnalystAmitabha Basu
EditorJacqueline Gold
AssociateConnor Osetek
Assistant Director of Policy & Research / Project Manager
Susan Scheer
Mercy Asare Kettly Bastien
Millicent Budhai-Robinson Rosa Charles Carmen Cruz
Robert DeLaurentis Andrew Elcock Peter E. Flynn Michele Griffin Michael Hecht
Farid Heydarpour, Ph.D.
Dahong HuangAmna KhanMabel LawPui Chi Law
Marcia MurphyPaula Murrien
Albert NgAndrew RosenthalKenneth Sylvester
Michelle TaylorOrlando Vasquez
JANUARY 2012Published by the
New York City Comptroller’s Office Budget & Policy Bureau
1
2
OveRvIew
About the New York City Comptroller’s OfficeThe New York City Comptroller, an independently elected official, is the Chief Financial Officer of the City of New York. The mission of the office is to ensure the financial health of New York City by advising the Mayor, the City Council, and the public of the City’s financial condition. The Comptroller also makes recommendations on City programs and operations, fiscal policies, and financial transactions. In addition, the Comptroller manages the assets of the five New York City Pension Funds, performs budgetary analysis, keeps the City’s accounts, audits City agencies, and registers proposed contracts. His office employs a workforce of more than 700 professional staff members. These employees include accountants, attorneys, computer analysts, economists, engineers, budget, financial and investment analysts, claim specialists, and researchers in addition to clerical and administrative support staff.
About the Schwartz Center for economic Policy AnalysisSCEPA is the economic policy research arm of the department of economics at The New School in New York City’s Greenwich Village. SCEPA works to focus public debate on the role government can and should play in the economy to raise living standards, create economic security, and attain full employment. With a focus on collaboration and outreach, it provides original, standards-based research on key policy issues to empower policymakers to create positive change.
About Retirement Security NYC Retirement Security NYC is a major initiative launched by Comptroller John C. Liu to protect the retirement security of public employees while ensuring the City’s financial health. Retirement Security NYC is partnering with two leading institutions – the National Institute on Retirement Security and the New School’s Schwartz Center for Economic Policy Analysis – to analyze the current state of public pensions and retirement preparedness among all New Yorkers and offer sensible reforms.
About the AuthorsDr. Teresa Ghilarducci, the Director of the Schwartz Center for Economic Policy Analysis (SCEPA), is one of the nation’s leading experts on retirement security. She joined The New School after 25 years as a professor of economics at the University of Notre Dame and 10 years as director of the Higgins Labor Research Center at the university. She has written and lectured extensively on pension issues and frequently publishes in refereed journals and testifies before the U.S. Congress. Dr. Ghilarducci was the 2006–2008 Wurf Fellow at Harvard Law School, and her research has been funded by the Alfred P. Sloan Foundation, U.S. Department of Labor, Ford Foundation, and Retirement Research Foundation. Dr. Joelle Saad-Lessler, SCEPA’s statistician, completed her Ph.D. at Columbia University, and worked as an assistant professor of economics at Long Island University for eight years. Lauren Schmitz is a graduate student and research assistant in the New School’s Department of Economics.
CONTeNTSPAge
ReTIRemeNT PLAN SPONSORSHIP BY emPLOYeRS
9 emPLOYee PARTICIPATION RATeS
12 wHAT THe FUTURe HOLdS FOR THOSe NeAR ReTIRemeNT Age
18
21
CONCLUSION
TeCHNICAL APPeNdIx
Are New Yorkers reAdY for retiremeNt?
Trends in Plan Sponsorship, Participation, and Preparedness
A Report by the Schwartz Center for economic Policy Analysis
Joelle Saad-Lessler, Teresa Ghilarducci, and
Lauren Schmitz

A Report by the Schwartz Center for Economic Policy Analysis | 2011
1New York City ComptrollerJohn C. Liu RETIREMENT SECURITY NYC
OveRvIew
In this volatile economic climate, many New Yorkers are concerned not only about their ability to meet their current financial needs but also about what will happen to them as they age. Along with Social Security—and for the purposes of this report we assume that it will be maintained in its present form—many working New Yorkers depend on the convenience and affordability of employer-sponsored retirement plans.
This analysis finds that employer sponsorship of retirement plans is declining in New York City.
• Between 2000 and 2009, the percentage of employees in New York City who reported having access to an employer-sponsored retirement plan declined by eight percentage points, from 48 percent to 40 percent. The decline in the United States as a whole was also eight percentage points, from 61 percent to 53 percent. However, the nationwide decrease still leaves more than half of the working population with access to retirement benefits. The New York City decline does not.
A significant majority of working New Yorkers did not participate in employer-sponsored retirement plans in 2009.
• Overall, two-thirds of NYC workers (more than 2 million people) in 2009 did not participate in employer-sponsored retirement plans, largely because their employer did not offer one. In addition, approximately 1.1 million New Yorkers between the ages of 25 and 64 were not working in 2009 and, by definition, did not participate in a current employer’s retirement plan.
• In 2009, those covered by a union contract were 2.5 times more likely to have access to an employer-sponsored retirement plan than those who weren’t covered by such a contract.
The immediate implications of these negative trends for retirement preparedness can be seen in a snapshot of the financial situation of those nearest to retirement in 2009.
• More than one-third of households in which the head is near retirement age (aged 55-64 years old) will have to subsist almost entirely—and more than 50 percent primarily—on Social Security income, or will not be able to retire at all due to the fact that they have liquid assets of less than $10,000.
The first section of this report looks at the decline in sponsorship of retirement plans by employers at the local and national levels, including a demographic breakdown. The second section analyzes the rate of participation in employer-sponsored retirement plans. The third section examines how the group nearest retirement in 2009 (those aged 55-64 years old) is prepared financially for post-work life.
Overall, two-thirds of
NYC workers (more
than 2 million people) in
2009 did not participate
in employer-sponsored
retirement plans, largely
because their employer
did not offer one.

2
ARe New YORkeRS ReAdY FOR ReTIRemeNT? | Trends in Plan Sponsorship, Participation, and Preparedness
New York City ComptrollerJohn C. Liu RETIREMENT SECURITY NYC
Both the first and second sections rely on 2001 and 2010 data from the Current Population Survey (CPS), a joint program administered by the Census Bureau and the Bureau of Labor Statistics.1 The second and third sections use data from the 2008 Survey of Income and Program Participation (SIPP).2 The third section also uses 2009 New York State Personal Income Tax Files to consider the retirement preparedness of households aged 55-643 in the metropolitan areas of New York State. The Technical Appendix discusses in detail the report’s methodology.
The report findings suggest that the decline in sponsorship and the shift to 401K-type plans are jeopardizing the retirement security of working New Yorkers. This could potentially result in a greater number of New York City residents experiencing a dramatic drop in living standards as they retire.
ReTIRemeNT PLAN SPONSORSHIP BY emPLOYeRS
Employers have traditionally played an integral role in the U.S. retirement system.4 They have contributed to their employees’ retirement plans as part of a benefits package designed to attract and keep quality workers, bolstering their workers’ assets and easing the burden of saving for retirement.
Workplace retirement plans are an effective vehicle for the accumulation of retirement savings. An employee’s retirement contribution is automatically deducted from his or her paycheck, removing the temptation to spend these funds on day-to-day budget needs.
An employer who chooses to sponsor a retirement plan for their employees plays a significant role in the administration and function of the plan. They decide what type of plan to offer, how much they will contribute to the plan, and, in the case of DB plans, the investment strategies of accumulated funds.
The employer also decides whether to sponsor a defined benefit (DB) and/or defined contribution (DC) retirement plan. A DB plan uses a formula that typically credits every year of service with a certain percentage of pay to determine lifetime pension benefits. The employer invests the assets and guarantees the pension, and the worker implicitly pays for the DB plan with reduced take-home earnings. With DC plans—most are 401Ks—the employer provides a tax-advantaged savings account that employees can contribute to on a voluntary basis. The worker, not the employer, invests the assets. Employers may also contribute to a DC plan, though the level of contribution can vary from year to year or not occur at all.
Both types of employer-sponsored retirement plans significantly improve a worker’s readiness for retirement. Retirees receiving income from a workplace retirement plan are more likely to retain middle-class lifestyles than retirees without income from an employer-sponsored plan.5
1 The CPS is a survey of households conducted each month to obtain comprehensive data on the labor force. Roughly 60,000 households are surveyed across the United States by highly-trained interviewers. Answers to survey questions from this representative group of households are used to make inferences about the entire population.
2 The SIPP asks questions that are designed to capture the economic profile of people in the United States. Approximately 14,000-36,700 house-holds are interviewed in the United States over a 2½-4 year period about their cash and non-cash income, retirement plan participation, taxes, assets, liabilities, and participation in government transfer programs. The survey uses a 4-month recall period and interviews are conducted in person or over the telephone. We use data from waves 3 and 4 of the 2008 panel of the Survey of Income and Program Participation. The data for these modules was collected in the 4th reference month for each rotation (from April 2009-July 2009 for wave 3, and August 2009-November 2009 for wave 4).
3 A household is defined as aged 55-64 if the reference person for the household is in this age range. A reference person is an owner or renter of record for the household. All other members in the household are listed based on their relationship to the reference person.
4 Boivie, I. 2011. ”Who Killed the Private Sector DB Plan?” Washington DC: National Institute on Retirement Security.5 Social Security Administration. 2008. “Income of the Population 55 and Older.” Washington DC; William G. Gale. 1998. “The Effects of Pensions
on Household Wealth: A Reevaluation of Theory and Evidence.” The Journal of Political Economy, Vol. 106, No. 4. (Aug.), pp. 706-723.

A Report by the Schwartz Center for Economic Policy Analysis | 2011
3New York City ComptrollerJohn C. Liu RETIREMENT SECURITY NYC
employer Sponsorship of Retirement Plans in New York City is declining
This report uses data from the Current Population Survey (CPS) to analyze employer sponsorship of retirement plans. The CPS asked NYC residents who worked full-time or part-time in the previous calendar year6 about their retirement plan coverage and participation.7 Responses to this question were used to examine sponsorship levels for NYC residents aged 25-64 in 2000 and 2009.8 Retirement plan sponsorship was also calculated for the U.S. to evaluate how NYC residents9 are faring relative to the rest of the nation.10
As of 2009, 40 percent of employed NYC residents aged 25-64 had access to a retirement plan at work, compared with 53 percent of similar workers in the rest of the U.S. In other words, by 2009 only 4 out of 10 workers residing in NYC had access to a retirement plan at work.
Figure 1: employer-Based Retirement Plan Sponsorship Rates
Source: Current Population Survey, March Supplement, 2001 and 2010. Sample is limited to persons aged 25-64 who worked at some point in the last calendar year. NYC sample is limited to residents of NYC. Metropolitan Areas in NYS includes New York City.
The trends in retirement plan sponsorship rates between 2000 and 2009 are alarming. The data indicate that access to a retirement plan fell by eight percentage points for NYC residents, the same absolute decline as for all Americans. In NYC, retirement plan sponsorship dropped from 48 percent to 40 percent of the workforce over the decade, while retirement plan sponsorship in the U.S. sank from 61 percent to 53 percent. However, the decline was more consequential in New York City, since fewer workers had access to employer-sponsored plans to begin with.
6 Because the CPS data references a worker’s situation in the previous year, data from 2001 (and 2010) is used to analyze sponsorship levels in 2000 (and 2009).
7 Specifically, respondents were asked if their employer or union for their longest job held during the preceding calendar year had a pension or other retirement plan for any of the employees, and, if so, whether they were included in that plan.
8 We focus on this age group because by age 25 most workers have finished their schooling and have started their career. Moreover, many workers can be legally excluded from retirement plans if they are younger than 25.
9 Data for residents of metropolitan areas of NY State is also included because the analysis in section three of this report refers to this level of geographic detail.
10 See “A Note on Sponsorship Rates” for more information on the population of workers represented by the CPS data.
61% 59%
48%53% 51%
40%
0%
10%
20%
30%
40%
50%
60%
70%
UnitedStates MetropolitanAreasinNY
State
NYC
2000
2009
61% 59%48%53% 51%
40%

4
ARe New YORkeRS ReAdY FOR ReTIRemeNT? | Trends in Plan Sponsorship, Participation, and Preparedness
New York City ComptrollerJohn C. Liu RETIREMENT SECURITY NYC
A Note on Sponsorship Rates
The CPS asks respondents about retirement plan sponsorship based on their job in the previous calendar year. Therefore, respondents who did not work in 2009, or 26 percent of the NYC population aged 25-64, were not asked about their retirement plan status. (More than 80 percent of this group was out of the labor force—or not actively looking for work in 2010—another 10 percent were unemployed in 2010 and the other 8 percent were employed.) Since those who did not work in 2009 did not have access to an employer-sponsored plan, the sponsorship rates in this report understate the rate of sponsorship for the entire working-age population at any given point in time. Some of those who are currently jobless may have a retirement plan from a previous job, or may gain access to one through a future job. Accordingly, no direct inference about the ultimate percent of the retired population that benefits from an employer-sponsored retirement plan can be drawn from current sponsorship rates.
Figure 2. employment Status and Sponsorship Rates for New York City Residents, 2009
Of Those Who Worked…
Source: 2010 Current Population Survey, March Supplement. Percentages in chart are rounded.
Employer does not sponsor a retirement plan
Employer sponsors a retirement plan2009 New York City Population(Aged 25-64) = 4,381,950
Didn’twork in
200926%
Workedin 2009
74%
40%1,305,878
60%1,939,109

A Report by the Schwartz Center for Economic Policy Analysis | 2011
5New York City ComptrollerJohn C. Liu RETIREMENT SECURITY NYC
Understanding the downward Trend in employer Sponsorship
As noted above, sponsorship rates in NYC fell from 48 percent in 2000 to 40 percent in 2009 (see Figure 1). However, these declines were not uniform across all social and economic groups, as is illustrated in Table 1 below. While trends show sponsorship rates falling for workers in almost all social and economic categories, men suffered a larger decline in sponsorship (down 21 percent) than women (down 12 percent), as did non-citizens (down 36 percent) compared with citizens (down 15 percent). Middle-age workers had the largest drop in sponsorship (down 21 percent), and a breakdown by race reveals that Asian and Black non-Hispanic workers lost the most ground (down 33 percent and 21 percent, respectively).
Across industries, sponsorship for workers in Entertainment and Recreation Services fell by 57 percent, followed by a 44 percent drop in sponsorship for workers in Wholesale and Retail Trade. Manufacturing workers rode out the storm pretty well, actually gaining in sponsorship rates by 8 percent, perhaps because smaller New York manufacturers have become more artisanal, design-oriented, and technology-based and thus, perhaps, more likely to have a more educated workforce and to sponsor 401K plans.
Self-employed workers were one of the fastest-growing categories of workers in New York City during the decade.11 Self-employed workers may establish retirement plans for themselves, their spouses, and other employees through several provisions of the federal tax code. Among those options are the “Solo 401K,” the simplified employee pension plan (SEP), and the SIMPLE-IRA. Also, in 2010, the Freelancers’ Union established a group 401K plan open to Union members with 1099 income. Still, sponsorship rates for the self-employed remain among the lowest of all workers. In 2000, only 18 percent of self-employed workers in NYC had a sponsored plan, and that rate fell by a full nine percentage points by 2009.
Firms with 25 employees or less showed the biggest proportional drop in sponsorship (down 24 percent). However, the absolute decline in sponsorship rates was largest among midsize and large firms. Employees working in firms with 500 to 999 employees reported a decline in sponsorship rates from of 68 percent to 58 percent, while the sponsorship rate for employees working in firms with 1,000 employees or more also dropped by 10 percentage points.
Why the sponsorship rates for midsize and large firms dropped so dramatically is unclear. Many large firms closed or froze their defined benefit plans during the past decade, but virtually all continued to offer defined contribution plans.12 There are few known cases of large firms closing their defined contribution plans. One possible explanation is that fewer growing firms that have crossed the 500- or 1,000-employee threshold have established retirement plans of any type, even as more established firms convert their retirement plans from defined benefit to defined contribution.
11 U.S. Bureau of Economic Analysis, Local Area Personal Income and Employment. September 15, 2011.12 United States Government Accountability Office. July, 2008. GAO-08-817. “Defined Benefit Pensions: Plan Freezes Affect Millions of
Participants and May Pose Retirement Income Challenges.” The report notes that about 3.3 million active participants in the study popu-lation (about 21% of all active participants in the single-employer DB system) were affected by the freeze.
Firms with 25
employees or less
showed the biggest
proportional drop in
sponsorship (down
24 percent).

6
ARe New YORkeRS ReAdY FOR ReTIRemeNT? | Trends in Plan Sponsorship, Participation, and Preparedness
New York City ComptrollerJohn C. Liu RETIREMENT SECURITY NYC
Although midsize and large firm sponsorship rates fell considerably during the decade, they remain higher than for all other size firms. This is one reason that sponsorship rates in New York City are lower than the national rate. In 2009, 53.8 percent of private-sector employed city residents (excluding the self-employed) were employed at firms with fewer than 100 employees, compared to 48.2 percent in the rest of the nation. In fact, an even more disproportionate share of NYC workers is employed in firms with fewer than 25 employees than in the country as a whole.
Finally, unionized13 workers managed to increase their rates of retirement plan sponsorship in NYC by 21 percent, while their non-unionized counterparts suffered a 33 percent drop in sponsorship rates.
Table 1: Retirement Plan Sponsorship Rates by Social and Personal worker Characteristics in New York City and the U.S.
13 Unionized workers were workers who were members of a union, or who were not members of a union, but were covered by a union contract.
NYC US
2000 2009 % Change 2000 2009 % Change
Working Population 3,071,201 3,244,987 121,000,000 126,000,000
Total Sponsored 48% 40% -17% 61% 53% -13%
Gender
Male 45% 36% -21% 61% 52% -15%
Female 51% 45% -12% 61% 55% -11%
Citizenship Status
Non-Citizens 30% 19% -36% 36% 27% -26%
Citizens 55% 47% -15% 64% 56% -12%
Age Group
Ages 25-44 48% 39% -20% 60% 51% -15%
Ages 45-54 46% 36% -21% 65% 56% -14%
Ages 55-64 54% 51% -6% 60% 57% -6%
Race
White Non-Hispanic 59% 53% -10% 65% 57% -12%
Black Non-Hispanic 48% 38% -21% 60% 53% -11%
Asian Non-Hispanic 39% 26% -33% 55% 49% -10%
Hispanic 35% 30% -14% 42% 35% -18%
Other 28% 47% 69% 55% 53% -2%
Classification of Worker
Self-Employed 18% 9% -53% 20% 13% -32%
Wage and Salary Workers 47% 37% -22% 62% 53% -15%
Government 76% 69% -9% 87% 82% -5%
table continued on next page

A Report by the Schwartz Center for Economic Policy Analysis | 2011
7New York City ComptrollerJohn C. Liu RETIREMENT SECURITY NYC
Table 1: Retirement Plan Sponsorship Rates by Social and Personal worker Characteristics in New York City and the U.S.
Source: CPS March Supplement, 2001 and 2010.
Note: sample is limited to residents of NYC aged 25-64 who worked in the previous calendar year. Percentages in the table are rounded. Classification of worker listing excludes unpaid family workers, members of the U.S. Armed Forces, and those who did not specify their classification. Industry listing excludes agriculture, forestry and fishing, mining, and the military. A similar breakdown, using 2009 results from the Survey of Income and Program Participation, can be found in the Technical Appendix on page 21.
NYC US
2000 2009 % Change 2000 2009 % Change
Firm Size
1-25 employees 20% 15% -24% 27% 20% -23%
26-99 40% 39% -2% 56% 48% -15%
100-499 54% 48% -11% 71% 61% -14%
500-999 68% 58% -15% 77% 70% -9%
1000+ 72% 62% -14% 82% 75% -9%
Union Status
Not covered by a union contract 46% 31% -33% 64% 55% -14%
Covered by a union contract 64% 78% 21% 84% 82% -3%
Industry
Construction 30% 27% -10% 42% 33% -20%
Manufacturing 42% 45% 8% 72% 64% -12%
Transport, Communications, Utilities 43% 37% -14% 69% 58% -16%
Wholesale & Retail Trade 34% 19% -44% 52% 43% -18%
Finance, Insurance & Real Estate 71% 54% -25% 67% 60% -11%
Business & Repair Services 48% 34% -29% 51% 42% -17%
Personal Services 26% 15% -42% 30% 26% -13%
Entertainment & Recreation Services 43% 19% -57% 53% 42% -20%
Professional Services 56% 51% -9% 71% 63% -11%
Public Administration 85% 76% -11% 89% 83% -7%
table continued from previous page

8
ARe New YORkeRS ReAdY FOR ReTIRemeNT? | Trends in Plan Sponsorship, Participation, and Preparedness
New York City ComptrollerJohn C. Liu RETIREMENT SECURITY NYC
The data presented above provide an overall description of retirement plan sponsorship in New York City, but they do not explain the reasons behind the decline in sponsorship rates between 2000 and 2009. (Note: the pension sponsorship rates for workers covered by union contracts increased because employee benefits, pensions, and health care are top priorities for union negotiators. Overall rates of pension sponsorship fell in part because the percent of workers covered by union contracts is smaller.)14
There are a number of demographic characteristics of the New York City workforce that may impact sponsorship rates. A higher proportion of NYC’s working residents are employees of small firms than in the U.S. as a whole, so all things being equal, it would be expected that fewer work in firms that sponsor retirement plans. However, the analysis shows that sponsorship rates are lower in the city for employees of each firm size category. Also, a tabulation of demographic characteristics of the NYC population relative to the U.S. (please see page 25 in the Technical Appendix) shows that NYC’s working population has characteristics of people less likely to be covered; it is slightly younger and consists of more minority populations and non-citizens. On the other hand, the New York City labor force also has a larger proportion of women,15 a smaller proportion of self-employed workers, and twice as many union workers, which would predict a higher sponsorship rate in NYC than in the rest of the U.S.
We use a statistical technique to parse out what employee- and employer-related factors are most important in explaining the decline of sponsorship in New York. A decomposition analysis16 of the change in sponsorship rates over the decade reveals that, indeed, if only the characteristics of workers changed—their age, citizenship status, gender—then the rates of pension sponsorship would have actually increased by 8-11 percentage points. Between 2000 and 2009, the working population of NYC changed to include more kinds of workers who are likely to have pension coverage, such as older workers and female workers. Technically we predicted the change in pension sponsorship, holding constant the change in employer characteristics, such as industry and firm size.17 However, the change in employer characteristics swung sponsorship rates down 16-19 percentage points. The net impact on sponsorship rates was the 8 percentage point decline evident in the data. Therefore, we conclude that the decline in employers’ ability and/or willingness to sponsor retirement plans across most industries and occupations was the primary driver behind the downturn in sponsorship.
A similar analysis was conducted for U.S. data and arrived at similar conclusions—employer decision-making drove the decline in retirement plans—but the differences were not as stark. Changes in worker characteristics in the U.S. were found to be responsible for decreasing sponsorship rates by 0.3-1 percentage points, while changes in employer behavior brought about a 7-7.7 percentage point decline in sponsorship rates.
14 Ghilarducci, Teresa. 2008. When I’m Sixty-Four: The Plot against Pensions and the Plan to Save Them (Princeton University Press) describes the fall in unionization and the preferences union members and negotiators have for employee benefits compared to what is expressed by nonunion employees.
15 Munnell, Alicia H., Pamela Perun. 2006. “An Update on Private Pensions.” Issue in Brief 50. Chestnut Hill, MA: Center for Retirement Research at Boston College.
16 A Blinder-Oaxaca decomposition analysis is applied to the data to derive the results above. See the Methodology section in the Technical Appendix at the end of this report for a detailed description of this technique.
17 The results of the decomposition depend on whether 2000 or 2009 is used as the year of reference. See the Methodology section in the Techni-cal Appendix at the end of this report for a detailed description of this technique.

A Report by the Schwartz Center for Economic Policy Analysis | 2011
9New York City ComptrollerJohn C. Liu RETIREMENT SECURITY NYC
emPLOYee PARTICIPATION RATeS
Even if an employer sponsors a retirement plan for their employees, participation is not universal. An employer is permitted under law to exclude employees from participating in a retirement plan if they have less than one year of service, are part-time, or are younger than 25.18 Moreover, the structural differences between DB and DC plans impact employee participation. In a DB plan, worker participation is usually mandatory, guaranteeing that each worker has a retirement account if they are sponsored. Under a DC plan, workers can choose to opt-out of the retirement plan entirely.
Figure 3 below summarizes sponsorship and participation rates for working NYC residents aged 25-64 in 2009 using data from the CPS.19 Of the 40 percent of workers whose employers sponsored a retirement plan in 2009, 88 percent participated in the plan. Only 35 percent (40%*88%) of the overall NYC working population participated in an employer-sponsored retirement plan in 2009. Put another way, 65 percent of NYC workers (more than 2 million people) in 2009 did not participate in employer-sponsored retirement plans either because their employer did not offer one or the employee did not participate for voluntary or involuntary reasons. Furthermore, as noted in the previous section, approximately 1.1 million New Yorkers between the ages of 25 and 64 were not working in 2009 and, by definition, did not participate in a current employer’s retirement plan.
Figure 3: Sponsorship and Participation Rates for working New York City Residents, 2009
Source: 2010 Current Population Survey, March Supplement. Note: Sample is limited to NYC residents aged 25-64 who worked at some point in the previous calendar year. Percentages in chart are rounded.
18 See U.S. Department of Labor. October 2010. What You Should Know About Your Retirement Plan. “Federal law allows employers to include certain groups of employees and exclude others from a retirement plan. For example, your employer may sponsor one plan for salaried employees and another for union employees. Part-time employees may be eligible if they work at least 1,000 hours per year, which is about 20 hours per week.” http://www.dol.gov/ebsa/publications/wyskapr.html#chapter2
19 We use the CPS data to determine the fraction of NYC workers who are participating in an employer-sponsored plan. The CPS asks respondents if their union or employer sponsored a pension or other retirement plan for any of the employees, and, if so, whether they were included in that plan.
2009 NYC Working Population(Aged 25-64) = 3,244,987
Of Those Sponsored...
NotSponsored
60%Sponsored
40%
Participating88%
1,144,776
NotParticipating
12%

10
ARe New YORkeRS ReAdY FOR ReTIRemeNT? | Trends in Plan Sponsorship, Participation, and Preparedness
New York City ComptrollerJohn C. Liu RETIREMENT SECURITY NYC
The CPS data does not give us additional information regarding the type of plan workers are enrolled in and their reasons for not participating.20 For that information, we use data from a specialized survey called the Survey of Income and Program Participation (SIPP). The finest level of geographical detail available in the SIPP data is all metropolitan areas in New York State. Approximately 46 percent of those included in the metropolitan areas sample are NYC residents.21
Figure 4: Retirement Plan Sponsorship, Participation, and Primary Plan Type for workers in NY State metropolitan Areas, 2009
Working Population* 6,025,966
Employer sponsors a plan
3,674,267 61%
Employer doesn’t sponsor a plan
2,291,416 38%
Participating 2,928,284
80%
Not Participating 745,983
20%
Voluntary Non-Participation
469,427 63%
Involuntary Non-Participation
276,556 37%
Didn’t answer the question
60,283 1%
Primary Plan is a DB plan
1,269,151 43%
Primary Plan is a DC plan
1,659,133 57%
Source: 2008 Survey of Income and Program Participation (SIPP) Panel. *Working population refers to all workers who are aged 25-64, have worked in the reference period, have positive earnings, are not
unpaid family workers, and are not in the Armed Forces or in the Agriculture, Forestry, and Fisheries sector.
Figure 4 above describes the retirement plan status of workers aged 25-64 in NY State metropolitan areas using the SIPP data. Of the 6,025,966 workers in NY State metropolitan areas, 61 percent work for employers who sponsor retirement plans.22 Of those who work for an employer that sponsors a plan, 80 percent report participating, with
20 Voluntary reasons for non-participation cited by survey respondents include that they “can’t afford to contribute,” “don’t want to tie up money,” “employer doesn’t contribute or contribute enough,” “don’t plan to be in the job long enough,” “don’t need it,” “have an IRA or other pension plan coverage,” “spouse has a pension plan,” “haven’t thought about it,” or “some other reason.” Involuntary reasons for non-participation cited include “no one in my type of job is allowed in the plan,” “don’t work enough hours, weeks, or months per year,” “haven’t worked long enough for this employer,” “started job too close to retirement date,” or “I am too young.”
21 See the Technical Appendix of this report, page 24, for a complete listing of all counties included in NY State metropolitan areas.22 According to the CPS data, 51 percent of workers residing in the NY State metropolitan areas were sponsored for a retirement plan through
A Report by the Schwartz Center for Economic Policy Analysis | 2011
11New York City ComptrollerJohn C. Liu RETIREMENT SECURITY NYC
43 percent reporting that their primary plan is a DB plan, and 57 percent reporting that their primary plan is a DC plan.
Among workers who do not participate in a retirement plan at work, 63 percent do not participate for voluntary reasons, while 37 percent cite involuntary reasons.23 The reasons for non-participation change as workers get older and closer to retirement. According to the SIPP data, two-thirds of workers aged 25-44 do not participate for voluntary reasons, while only half of older workers aged 45-64 voluntarily opt out. Since participation in most DB plans is mandatory, the majority of workers who chose not to participate were those offered a DC plan. This implies the plan design chosen by the employer (i.e., DB vs. DC) has a significant impact on participation rates. An employer’s choice of a DC plan, which allows for greater “leakage” (voluntary non-participation), is more likely to result in lower participation rates.24
A complete display of DB/DC participation by a worker’s social, personal, or economic characteristics is available in the Technical Appendix (see Detailed Analysis of DB and DC Participation by Social, Economic, and Personal Characteristics, page 27). This data reveals that age, income, and race are important determinants of DB/DC participation. Younger workers aged 25-44 have slightly higher rates of DC participation (58 percent) than older workers aged 55-64 (54 percent), and low income workers have much higher rates of DB participation (48 percent) than middle income workers (42 percent).25 Sixty percent of Black workers in NY State metropolitan areas report having a DB plan, while only 41 percent of White workers and 38 percent of Hispanic workers have DBs.
However, the main differences in participation by plan type are driven by a worker’s industry. For instance, 74 percent of workers employed in the Finance, Insurance, and Real Estate industry and 75 percent of workers in the Wholesale Trade industry report having DC plans as their primary plan, while only 42 percent in Transport, Warehousing, and Utilities and 40 percent of Public Administration workers have DC coverage.
The changing nature of the workplace and the transformation of the economy from manufacturing to service-oriented occupations, among other factors, have been associated with an overall decline in employer-sponsored DB plans and an increase in DC plans. Since participation rates in DC plans are lower than in DBs, due in part to their voluntary nature, this shift has implications for the overall preparedness of those nearing retirement age.
their employers. The disparity in measured sponsorship rates between the CPS and the SIPP data arises because the two data sources are structurally different. The CPS data asks respondents once whether their employer sponsors a retirement plan for any of the employ-ees, and whether they are included in such a plan. The SIPP data inquires whether the employer offers a retirement plan, and if they do, whether the respondent participates in the plan. The SIPP survey further asks whether the employer offers a 401K-type plan, and if the employee participates in that plan. This ensures that the employee accurately responds to the sponsorship and participation questions. Because the SIPP survey is more thorough, it is likely that measured sponsorship and participation rates in the SIPP data are closer to the true rates. See Sanzenbacher, Geoffrey. 2006. “Estimating Pension Coverage Using Different Data Sets,” Center for Retirement Research. Boston College. http://pensioncoverage.org/studies_and_statistics/estimating_pension_coverage.pdf. We used CPS data for sponsor-ship rates in the first section of this report because it provided a large enough sample of NYC-only data to permit demographic analysis.
23 Workers can legally be excluded from their employer’s DB or DC retirement plan. See Footnote 19 for voluntary reasons for non-partici-pation cited by survey respondents.
24 Other studies also found that the switch from the DB form of pension—that which mandates coverage—to the DC form—that which lets participation be voluntary—reduced coverage among people who are more likely to state they do not have enough income to save for retirement. On this point see: Karamcheva, Nadia and Geoffrey Sanzenbacher. 2010. “Pension Participation and Uncovered Workers.” Issues in Brief. Center for Retirement Research. Boston College. IB#10-13.
25 Low income workers are those making $24,000 per year or less. Middle income workers are those making between $24,000 and $65,004 per year.
The main differences
in participation by plan
type are driven by a
worker’s industry.

12
ARe New YORkeRS ReAdY FOR ReTIRemeNT? | Trends in Plan Sponsorship, Participation, and Preparedness
New York City ComptrollerJohn C. Liu RETIREMENT SECURITY NYC
wHAT THe FUTURe HOLdS FOR THOSe NeAR ReTIRemeNT Age
This report describes how a decline in employer-sponsorship of retirement plans, coupled with the changing nature of plan design, has eroded retirement plan participation and, potentially, the retirement security of New York workers. However, retirement plans provide only one source of income in retirement. A complete evaluation of New Yorkers’ readiness for retirement must take into account income from all sources.
The SIPP data offers a comprehensive listing of survey respondents’ financial assets, including the value of their bank accounts, bonds and securities, savings bonds, stocks and mutual funds, life insurance policies, IRA/KEOGH accounts, DC accounts, real estate holdings, home equity, and business equity. There is also information on total debt owed. This data allows a computation of total household net worth. These estimates do not factor in the present cash value of projected Social Security or DB pension benefits. For the purposes of the present discussion, only the retirement preparedness of households located in NY metropolitan areas, whose reference person is aged 55-64 is considered. Younger households have more time to accumulate savings for retirement; their current net worth may or may not reflect the level of preparedness they will have when they reach retirement.
Table 2: Household Net worth by Age group and Household Type, metropolitan Areas of New York State, 2009
Age Group
Single Person
Household
Married Couple
Household
Other Households*
55-64Average $170,298 $533,646 $174,142
Median $46,000 $442,450 $77,605
Source: 2008 Survey of Income and Program Participation (SIPP) Panel.
*Consists of non-married couple households with more than one member, or households with the reference person living with a parent.
Note: Calculation of household net worth excludes the net worth of children, other relatives, or non-relatives who reside in the household, but does include net worth of parents and unmarried partners who reside in the household.

A Report by the Schwartz Center for Economic Policy Analysis | 2011
13New York City ComptrollerJohn C. Liu RETIREMENT SECURITY NYC
According to the SIPP, the average net worth of near-retirement households residing in metropolitan areas of New York state is $170,298 for single person households, $533,646 for married couple households, and $174,142 for other household types. The average numbers are quite high because the few households with very high net worth bring up the average. The more revealing number is the median asset value. It is also important to note that we have included home equity in the net worth calculations. In theory, all the financial assets of a household can be liquidated, including the home, and its entire net worth can be “annuitized” through the purchase of a guaranteed income annuity from a private financial institution. The net worth of near-retirement households in metropolitan areas of New York State can thus be converted to a cash income stream of approximately $12,252 per year for single person households, $31,680 for married couple households, and $12,528 for other household types.26
However, net worth among New York’s near-retirement population is highly concentrated, and so retirement income will be similarly unequal; the cash income stream that would result from annuitizing the median net worth of the same households only yields $3,312 per year for single person households, $26,268 for married couple households, and $5,580 for other household types. This income would be in addition to any Defined Benefit pension and/or Social Security benefits,27 if household members were eligible for such payments.
A note of caution is needed, however, because the net worth calculations include home equity, and it is unrealistic to assume that most retired homeowners will sell their homes and annuitize the value of their equity. Aside from the attachment most retirees have for their homes, in many cases it would be financially counterproductive to sell the home, because households would then have to pay rent.
26 These numbers were computed from the Fidelity Guaranteed Income Calculator, given interest rate conditions on October 29, 2011. For a single person household and for ‘other’ households, the annuity value was calculated for a hypothetical male in NY, who was born on June 1, 1945 (they were 64 at the time the sample was collected in 2009). These calculations are for a lifetime annuity with-out beneficiaries. However, for married couple households, the annuity value was calculated for a couple residing in NY, where one person is a male born on June 1, 1945, and the other person is a female born on June 1, 1945. These calculations are for a lifetime annuity where the survivor continues to receive 100% benefit, without beneficiaries.
27 Using the average monthly benefit awarded in 2009 for a retiree 65 years of age according to the Social Security Administration’s An-nual Statistical Supplement, 2010, Table 6.A4, we can estimate that the average male would receive $18,720 in annual Social Security income, the average female $13,848 in annual Social Security income, and the average married couple, $32,568.
A note of caution is needed,
however, because the net
worth calculations include
home equity, and it is
unrealistic to assume that
most retired homeowners will
sell their homes and annuitize
the value of their equity.

14
ARe New YORkeRS ReAdY FOR ReTIRemeNT? | Trends in Plan Sponsorship, Participation, and Preparedness
New York City ComptrollerJohn C. Liu RETIREMENT SECURITY NYC
As a result, Table 3 below shows the distribution of liquid assets of the near-retirement population in 2009. The figures represent financial assets that can be easily liquidated and converted to an annuitized income stream, without necessitating the sale of a home. From the table, it is apparent that more than one-third of metropolitan New York households who are at or near retirement age have less than $10,000 in liquid assets—they have virtually no financial assets to annuitize. In other words, these households will have to subsist nearly exclusively on their Social Security income and on any Defined Benefit pensions they may be eligible for.28 Another one-fifth, those who have assets between $10,000 and $99,999, also have very little to annuitize (annuitizing $50,000 is less than $45 dollars per month.)
Table 3: Total Liquid Assets of Near-Retirement Households—Aged 55-64— in metropolitan Areas of New York State
Total Household Liquid Assets*
No. of Households
Percent of Total
Households
Mean Household
Income
Median Household
Income
Less than $10,000 424,623 36% $32,039 $18,684
$10,000-$99,999 218,578 19% $49,554 $41,616
$100,000-$299,999 246,252 21% $75,638 $71,112
$300,000 or more 277,562 24% $142,543 $99,924
TOTAL 1,167,015 100%
Source: 2008 Survey of Income and Program Participation (SIPP) Panel.
*Liquid Assets are defined as dollar balances in savings and checking accounts, IRA, KEOGH or 401K accounts, holdings of government or corporate bonds, stocks and mutual funds, the cash value of life insurance policies, real estate holdings, equity in rental properties, the value of non-primary residence mobile homes, amounts owed for sale of business, and other financial assets. Note: Calculation of liquid assets and household income excludes the liquid assets and income of children, other relatives, or non-relatives who reside in the household. The liquid assets and income of parents and unmarried partners who reside in the household are included.
On the other hand, about 24 percent of the households have liquid assets in excess of $300,000. These households will be able to realize an adequate cash income stream from retirement savings.
28 For anecdotal evidence of the financial difficulties facing those at or near retirement, see: Browning, E.S., “Retiring Boomers Find 401(k) Plans Fall Short,” The Wall Street Journal, February 19, 2011; Farnham, Alan, “Record Pessimism About Retirement,” ABC News, March 18, 2011; Far-rell, Chris, “The Rising Price of Retirement,” Bloomberg Businessweek, April 12, 2011.

A Report by the Schwartz Center for Economic Policy Analysis | 2011
15New York City ComptrollerJohn C. Liu RETIREMENT SECURITY NYC
Table 4: Total Liquid Assets* of Near-Retirement Households in metropolitan Areas
of New York State, 2009, by Retirement Plan Status
Households with DB Plans
Households with DC Plans
Households without a Retirement Plan with Their Current
Employer
Assets/Liabilities Mean Median Mean Median Mean Median
Investments $185,149 $100,550 $238,205 $125,054 $54,279 $500
Other Assets $47,697 $0 $58,579 $0 $18,828 $0
Retirement Savings (IRA, KEOGH, 401K, 403B) $89,689 $24,000 $144,533 $67,000 $11,623 $0
Debt $7,994 $1,500 $24,371 $1,500 $4,644 $0
Total Liquid Assets less Debt $314,541 $123,050 $416,946 $190,554 $80,086 $500
Number of Households 263,001 262,618 641,396
Home Equity $161,142 $110,000 $158,462 $109,999 $111,670 $0
Household Income $100,124 $81,360 $105,493 $77,412 $44,574 $24,936
Source: 2008 Survey of Income and Program Participation (SIPP) Panel. *Calculation of liquid assets and household income excludes the liquid assets and income of children, other relatives, or non-relatives who reside in the household. The liquid assets and income of parents and unmarried partners who reside in the household are included. Households are identified as a DB household if one of the members of the household has a DB plan as their primary retirement plan. Households are identified as a DC household if none of the members has a DB plan, and at least one of the members has a DC plan as their primary retirement plan. Households are identified as having no retirement plan if none of the members has a retirement plan of either kind at their current employer. Household members include the reference person, a spouse or unmarried partner, and a parent residing in the household. Children, other relatives, or other non-relatives living in the household are excluded.
Table 4 above shows the same SIPP data tabulated by the retirement plan status of households. One of the striking findings of Table 4 is that most households with a member near retirement age have no retirement plan coverage. Almost 641,400 households, or 55 percent, have no coverage from their current employer and less than $12,000 in retirement savings. Note that in the sponsorship section above, over 60 percent of individuals aged 25-64 reported working for an employer that did not sponsor a retirement plan. The data in Table 4 underscore the implications for households of having no coverage—they have little or no savings for retirement—and very little other assets as well.
In 2009, near-retirement households with at least one member participating in a DC plan had the highest income, followed by households with DB plans, and then households with no retirement plan. In fact, median household income of households with a DB or DC retirement plan was approximately three times as large as the median

ARe New YORkeRS ReAdY FOR ReTIRemeNT? | Trends in Plan Sponsorship, Participation, and Preparedness
New York City ComptrollerJohn C. Liu RETIREMENT SECURITY NYC16
household income of households with no retirement plan. Much larger differences are seen in the households’ liquid assets available for annuitization. Households with DC plans have amassed nearly four times as many liquid assets as households with no retirement plan, and about 1.5 times as much as those with DB plans. From this tabulation, it would seem that households with DC plans are the most ready for retirement, followed by DB households.
According to the Social Security Administration, Annual Statistical Supplement, 2010, the average male retiree age 65 received $18,720 in annual Social Security income in 2009, while the average female received $13,848 in annual Social Security income, and the average married couple received $32,568. Using the annuitized value of median liquid assets in Table 4 in combination with the Social Security averages for a married couple29 it can be estimated that households with DC plans have an average annual income potential of about $43,884, households with DB plans have an average annual income potential of about $39,876 (exclusive of their DB income), and households with no retirement plan of about $32,568 annually. That would give the households in each category annual income replacement rates of approximately 57 percent, 49 percent and 130 percent30 respectively based on median household income.
However, households with DB plans will also have a stream of income from those plans that will be available to them in retirement, which we have not yet accounted for. Unfortunately, it is not possible to estimate the stream of traditional pension income that survey respondents have accrued from the SIPP data. New York State personal income tax data, however, indicate that 426,298 NYC tax filers reported pension and/or annuity income in 2008, with an average of $19,298 in such income per filer.31 Adding that to the average estimated retirement income of 55-64 year-old households with DB plans raises their estimated median retirement income to about $59,174, and their income replacement rate to about 73 percent.
Most retirement experts agree that replacement rates should be at least 70 percent of final employment income.32
This means that DB households (73 percent) and households with no retirement plan (130 percent) achieve an income replacement rate that retirement advisors suggest is necessary for households to maintain their standard of living in retirement.33 Note that the replacement rate for households with no retirement plans is a function of their very low current earnings, not because their income in retirement is expected to be high. Moreover, their very low median earnings relative to their mean earnings suggest that many of this group are only marginally employed as they near retirement.
However, the near-retirement households with DC retirement plans (57 percent) will not reach anywhere near the recommended replacement rate in retirement. In other words, even though DC households had the highest incomes and accumulated the most liquid assets, they appear to be the least ready for retirement. As DB plans become increasingly rare, and as more and more workers are pushed towards DC plans, a growing portion of NY households will find themselves realizing these low income replacement rates, even when they save for retirement.
We conclude that most households with DB plans are more likely to maintain a middle class lifestyle throughout their retirement years. While typical households with only DC plans will have more comfortable circumstances than those with no retirement plan, most will see their standard of living decline once they stop working.
29 The liquid assets tabulated in Table 4 are not broken down by household type because of sample size constraints. However, each household is assigned the Social Security income of a married couple, and is thus treated as a married couple household.
30 For the purposes of this analysis, we are applying the same Social Security estimate for each group, but, in reality, Social Security benefits do vary based on earnings history.
31 Tabulated from 2009 New York State Personal Income Tax Files by the New York City Comptroller’s Office.32 Palmer, B., DeStefano, R., Schachet, M., Paciero, J., and Bone, C. 2008. 2008 Replacement Ratio Study. Chicago, IL: Aon Consulting.33 See the following studies for a detailed analysis of the employer-sponsored pension system in the U.S. and for evidence that employer-spon-
sored retirement plans are correlated with higher savings rates and individual wealth accumulation: Bailliu, Jeannine N. and Helmut Reisen. 1998. “Do Funded Pensions Contribute to Higher Aggregate Savings? A Cross-Country Analysis.” Review of World Economics. Volume 134, Number 4, 692-71; Bloom, David E., David Canning, Richard K. Mansfield, and Michael Moore, 2007. “Demographic Change, Social Security Systems, and Savings.” Journal of Monetary Economics. Volume 54, Issue 1, 92-114; Gale, William G., John Sabelhaus, and Robert E. Hall. 1999. “Perspectives on the Household Saving Rate.” Brookings Papers on Economic Activity, Vol. 1999, No. 1, 181-224.

A Report by the Schwartz Center for Economic Policy Analysis | 2011
A Note on Retirement Planning and Household Composition
Table 5: Retirement Plan Statistics and Asset Accumulation for workers Aged 25-64 by Household Composition, 2009
Household composition (whether one is single or living with a spouse) influences net worth and the availability of assets that can be used in retirement to provide financial support.
Married workers are more likely than single workers or single-parent workers to work for an employer that sponsors a retirement plan. Accordingly, married households accrue 71 percent more in assets (in terms of average current net worth) than single-person households and 81 percent more in assets than single-parent households. This puts unmarried households—some 63 percent of the NYC population33—at a
considerable disadvantage because they cannot supplement their own savings with those of a spouse.
Couples where both spouses are participating in a retirement plan at work accumulate 15 percent more in assets than couples where only one spouse is participating, and 140 percent more in assets than couples where neither spouse is saving for retirement through an employer-sponsored plan. The data also shows that when both spouses are participating in a retirement plan, a greater proportion report having a DB plan (45 percent) than couples where only one spouse is participating in a retirement plan (41 percent).
MARRiED WORkERS34
Total Population 3,356,991 (56%)
Sponsorship rate35 65%
Participation rate (if sponsored) 81%
Primary Plan is a DB plan 43%
Primary Plan is a DC plan 57%
Average Current Net Worth $215,860
MARRIED WORKERS WITH NEITHER SPOUSE PARTICIPATING IN A RETIREMENT PLAN
Primary Plan is a DB plan 0
Primary Plan is a DC plan 0
Average Current Net Worth $120,197
MARRIED WORKERS WITH ONE SPOUSE PARTICIPATING IN A RETIREMENT PLAN
Primary Plan is a DB plan 41%
Primary Plan is a DC plan 59%
Average Current Net Worth $251,574
MARRIED WORKERS WITH BOTH SPOUSES PARTICIPATING IN A RETIREMENT PLAN
Primary Plan is a DB plan 45%
Primary Plan is a DC plan 55%
Average Current Net Worth $289,053
Source: 2008 Survey of Income and Program Participation (SIPP) Panel.
SiNGLE WORkERS36
Total Population 1,219,640 (20%)
Sponsorship rate37 59%
Participation rate (if sponsored) 80%
Primary Plan is a DB plan 42%
Primary Plan is a DC plan 58%
Average Current Net Worth $126,228
Source: 2008 Survey of Income and Program Participation (SIPP) Panel.
SiNGLE PARENT WORkERS38
Total Population 842,199 (14%)
Sponsorship rate 58%
Participation rate (if sponsored) 83%
Primary Plan is a DB plan 44%
Primary Plan is a DC plan 56%
Average Current Net Worth $119,092
Source: 2008 Survey of Income and Program Participation (SIPP) Panel. Notes: Sample is limited to civilian residents of NY State metropolitan areas ages 25-64 who worked at some point in the reference period, had positive earnings, were not unpaid family workers, and were not in the Armed Forces, or in the Agriculture, Forestry, or Fishing sector.
33 2009 American Community Survey.34 The analysis of married workers limits the sample to the household reference person and their spouse, when both are age 25-64, have worked in the reference period,
have positive earnings, are not unpaid family workers, and are not in the Armed Forces or in the Agriculture, Forestry, and Fisheries sector.35 3,329,694 people answered the sponsorship question.36 Single workers refer to all members of a non-family household who are age 25-64, have worked in the reference period, have positive earnings, are not unpaid family
workers, and are not in the Armed Forces or in the Agriculture, Forestry, and Fisheries sector.37 1,197,999 people answered the sponsorship question.38 Analysis of single parent workers is limited to the household reference person in female-headed or male-headed family households, when the reference person is
aged 25-64, has worked in the reference period, has positive earnings, is not an unpaid family worker, and is not in the Armed Forces or in the Agriculture, Forestry, and Fisheries sector. 17

18
ARe New YORkeRS ReAdY FOR ReTIRemeNT? | Trends in Plan Sponsorship, Participation, and Preparedness
New York City ComptrollerJohn C. Liu RETIREMENT SECURITY NYC
Figure 5:34 Pension35 Sponsorship36 and37 Participation38 in39 Historical Perspective, U.S. and NYC
CONCLUSIONThe analysis in this report has found that employer sponsorship of retirement plans has declined precipitously,40 overall participation in an employer-provided retirement plan is low, and more than one-third of older workers in metropolitan areas of New York State will either have to subsist nearly exclusively—and more than half primarily—on their Social Security income, or will be unable to retire at all.41 This paints a discouraging picture of retirement readiness for workers who resided in New York as of 2009. But how will things look in 10 or 20 years? Are the trends identified in the report likely to reverse themselves?
Figure 5: Pension Sponsorship and Participation in Historical Perspective, U.S. and NYC
Source: March Supplement data from the CPS, from the IPUMS42 data.
34 135 236 337 438 539 640 This finding is consistent with other studies of trends in retirement plan sponsorship. See: Purcell, Patrick. 2008. “Pension Sponsorship and
Participation: Summary of Recent Trends.” Federal Publications. Paper 543, http://digitalcommons.ilr.cornell.edu/key_workplace/543; United States Government Accountability Office. 2009a, “Retirement Savings: Automatic Enrollment Shows Promise for Some Workers, but Proposals to Broaden Retirement Savings for Other Workers Could Face Challenges,” http://www.gao.gov/new.items/d1031.pdf; United States General Accounting Office. September, 2001. “Private Pensions: Issues of Coverage and Increasing Contribution Limits for Defined Contribution Plans,” http://www.gao.gov/new.items/d01846.pdf.
41 If Social Security benefits erode any further because of policy changes and an ever increasing premium for Medicare, workers in their 20s and 30s will be much worse off when it is time to retire.
42 Miriam King, Steven Ruggles, J. Trent Alexander, Sarah Flood, Katie Genadek, Matthew B. Schroeder, Brandon Trampe, and Rebecca Vick. 2010. Integrated Public Use Microdata Series, Current Population Survey: Version 3.0. [Machine-readable database]. Minneapolis: University of
30%
35%
40%
45%
50%
55%
60%
1980
1982
1984
1986
1988
1990
1992
1994
1996
1998
2000
2002
2004
2006
2008
US Participation Rate US Sponsorship Rate
NYC Participation Rate NYC Sponsorship Rate20
10

A Report by the Schwartz Center for Economic Policy Analysis | 2011
19New York City ComptrollerJohn C. Liu RETIREMENT SECURITY NYC
To help answer that question, Figure 5 above plots retirement sponsorship and participation rates for NYC and the U.S. from 1980 through 2009. The picture is disturbing. Sponsorship and participation rates have been steadily falling from 1980 through 2009 in NYC, while in the rest of the U.S., sponsorship and participation rates initially rose, but then began a downward slide in 2000. This suggests that the declining sponsorship and participation rates identified in this report are not a temporary artifact of the 2008-2009 recession, but are a product of more persistent structural trends. If those trends continue as they have for the past 30 years, it is likely that sponsorship and participation rates will continue to sink. This means that the retirement readiness of NYC residents is likely to get worse.
Employer sponsorship of retirement plans in New York City has eroded over the past decade, dropping from 48 percent coverage of active workers in 2000 to 40 percent coverage in 2009. By 2009, less than half of the NYC workforce worked for an employer who sponsored a retirement plan for any of its workers. Moreover, only 35 percent of NYC workers report actively participating in a retirement plan at work in 2009.
Many changes happened in New York during this period that may explain the decline in sponsorship. For example, more noncitizens entered the labor force and manufacturing employment declined. However, a decomposition analysis indicates that the change in the demographics, or the characteristics of workers (their age, marital status, citizenship status, gender, etc.) would, if nothing else occurred, have caused an increase in sponsorship by 8-11 percentage points, rather than a decline of 8 percentage points. We conclude that the decline in employers’ ability and/or willingness to sponsor pensions across all industries and occupations was the primary driver behind the downturn in sponsorship.
The consequences of declining sponsorship and low participation rates will mean higher rates of poverty and a diminished ability of many workers to maintain their standard of living in retirement. Our analysis further indicates that while defined contribution plans are an important part of many workers’ retirement security, DC savings alone will generally not be sufficient to replace a significant part of household pre-retirement earnings.43 The only workers protected from a significant reduction in their living standards when they retire are the dwindling number of workers with traditional DB plans, and the small percentage of households with high net worth.
Further study of the declining retirement plan sponsorship rates in New York City is urgently needed. Why have the sponsorship rates declined so precipitously? Are there regulatory or other obligations that are causing employers to close or forego retirement plans? How can more small businesses be encouraged to sponsor plans? How can the unique retirement planning problems of the self-employed be addressed? Can retirement systems along the lines of traditional defined benefit retirement plans be revived? Policies that help workers gain access to employment-based retirement savings vehicles can help to reverse some of the erosion in future retirement income that our findings portend.
Minnesota.43 See Browning, E.S., The Wall Street Journal, Op. Cit.
If trends continue as they
have for the past 30 years, it
is likely that sponsorship and
participation rates will continue
to sink. This means that the
retirement readiness of NYC
residents is likely to get worse.

20
ARe New YORkeRS ReAdY FOR ReTIRemeNT? | Trends in Plan Sponsorship, Participation, and Preparedness
New York City ComptrollerJohn C. Liu RETIREMENT SECURITY NYC

A Report by the Schwartz Center for Economic Policy Analysis | 2011
21New York City ComptrollerJohn C. Liu RETIREMENT SECURITY NYC
TeCHNICAL APPeNdIx

22
ARe New YORkeRS ReAdY FOR ReTIRemeNT? | Trends in Plan Sponsorship, Participation, and Preparedness
New York City ComptrollerJohn C. Liu RETIREMENT SECURITY NYC
methodology
For the purposes of this study, we use data from the March Supplement of the 2001 and 2010 Current Population Survey (CPS). In particular, we use the variable PENSION which asks whether the respondent’s union or employer for his or her longest job during the preceding calendar year had a pension or other retirement plan for any of the employees, and, if so, whether the respondent was included in that plan. The question specifically excluded retirement support from Social Security. Pension sponsorship and participation from the CPS data refer to employer-based retirement plan status in 1999 and 2008, respectively. This question was only asked of respondents who worked in the previous calendar year. All tabulations reflect weighted counts using the March Supplement weights.
We also use data from waves 3 and 4 of the 2008 panel of the Survey of Income and Program Participation (SIPP). Specifically, we use data from the Retirement Expectations module in wave 3 of the 2008 SIPP panel, as well as data from the Assets and Liabilities, Real Estate, Stocks and Mutual Funds, Value of Business, Rental Properties, Interest Earning and Other Financial Assets modules in wave 4 of the 2008 SIPP panel. The reference period is different for wave 3 and wave 4. The data for these modules was collected in the 4th reference month for each rotation (from April 2009-July 2009 for wave 3, and August 2009-November 2009 for wave 4). Because wave 3 and wave 4 are four months apart, their samples are not identical. Wave 3 contains 95,252 observations, while wave 4 contains 91,219 observations. The merged data set has 84,994 observations. There were 10,258 observations in wave 3 that were not in wave 4. There were 6,225 observations in wave 4 that were not in wave 3.
Since the merged data set drops a number of observations, it does not exactly mimic population numbers in the general population. For example, the weighted population count for the U.S. is 301 million for wave 3 alone, and 302 million for wave 4 alone. But the merged sample represents 282 million, which is less than the 301 million actually in the U.S. population. Therefore, we had to choose which weights to use. We use weights from the fourth reference month of wave 4 data for the merged sample following the advice of statisticians at the SIPP. The logic behind this choice is that since there is attrition in the sample, the wave 4 sample reflects the population that remained in the sample as of November 2009.
The working sample in the SIPP is limited to civilian residents of NY State metropolitan areas, aged 25-64 who stated that they worked at some point in the reference period (the past four months) and who had positive earnings; it also excludes unpaid family workers. This sample was used to calculate sponsorship, participation rates, and the respondent’s primary plan type (DB or DC). Further analysis to calculate current net worth uses a more limited sample; for these calculations, we drop workers in the Agriculture, Forestry, and Fisheries sector.
The Retirement Expectations module asks respondents whether their primary source of income in the previous four months was from a job or a business. Based on that answer, occupation, industry, firm size, and class of worker status was assigned from the most important job/business for that person. Our sample does not drop businesses that were unincorporated or that earned or expected to earn less than $2,500 per year. For such businesses, firm size was assigned to be less than 25 employees.
Sponsorship of a retirement plan is defined as the respondent answering affirmatively a question about whether their employer (at their most important job/business) offers a retirement plan, and/or later in the survey, the respondent says that their employer offers a 401K plan.
The logic behind this
choice is that since
there is attrition in
the sample, the wave
4 sample reflects
the population
that remained in
the sample as of
November 2009.

A Report by the Schwartz Center for Economic Policy Analysis | 2011
23New York City ComptrollerJohn C. Liu RETIREMENT SECURITY NYC
Participation in a retirement plan is defined as the respondent stating that their employer sponsors a retirement plan, they participate in such a plan, and/or they participate in a 401K plan through their employer.
The worker’s most important retirement plan was deemed to be a Defined Benefit (DB) plan if they answered that the plan was based on earnings and years on the job, or if it was a cash balance plan, or they stated that the plan benefits would be increased or decreased because of participation in the Social Security program. Alternatively, the most important plan was determined to be a Defined Contribution (DC) plan if the respondent stated that they had an individual account plan, or they had a 401K plan. For those who had only one plan, the most important plan was classified as a DC plan if they stated that they could choose the investments in the plan, or if they could take (or had already) taken out a loan against the plan, or if the contributions to the plan are tax deferred and employer contributions depend fully or in part on the employee’s contributions. The latter characteristics were asked about all retirement plans, not just the primary plan; therefore they could only be used to ascertain the nature of the most important retirement plan for those who had only one retirement plan.
Respondents in the sample were asked about the value of their assets. This is the main value of the SIPP data over CPS data. The SIPP sample gives us a snapshot of earnings and assets for workers aged 25-64 in 2009. Assetsinclude non-interest earning checking accounts (jointly-owned and solely-owned), interest earning accounts (jointly-owned and solely-owned), bonds and securities (jointly-owned and solely-owned), savings bonds (solely-owned), equity in stocks and mutual funds (jointly-owned and solely-owned), cash value of life insurance policies, equity in other financial investments, market value of IRA/KEOGH accounts, the value of solely-owned retirement DC accounts, the equity in rental properties not on the land of residence jointly-owned and solely-owned, home equity (adjusted for share of ownership), mobile home (adjusted for share of ownership), other real estate (adjusted for share of ownership), business equity (adjusted for share of ownership), and money owed to the respondent for the sale of a business. We then subtract the debt owed jointly and solely for loans, store bills/credit cards, and other debt. This gives us a measure of current net worth.
Household calculations
Household members include the reference person, a spouse or unmarried partner, and a parent residing in the household. Children, other relatives, or other non-relatives living in the household are excluded. Therefore, there are three kinds of households: single person households only contain the reference person, once all children, other relatives and non-relatives are excluded; married couple households contain the reference person and their spouse, and maybe a parent; other households are not married couples, and yet have more than one member—this could include unmarried couples living with or without a parent, or a single individual living with a parent.
Given who is included among members of the household, calculation of household net worth excludes the net worth of children, other relatives, or non-relatives who reside in the household, but does include net worth of parents and unmarried partners who reside in the household.
Households are identified as a DB household if one of the members of the household has a DB plan as their primary retirement plan. Households are identified as a DC household if none of the members has a DB plan, and at least one of the members has a DC plan. Households are identified as having no retirement plan if none of the members has a retirement plan of either kind at their current employer.
When calculating the annuity value of assets, for a single person household and for other households, the annuity value was calculated for a hypothetical male in NY State, who was born on June 1, 1945 (they were 64 at the
24
ARe New YORkeRS ReAdY FOR ReTIRemeNT? | Trends in Plan Sponsorship, Participation, and Preparedness
New York City ComptrollerJohn C. Liu RETIREMENT SECURITY NYC
time the sample was collected in 2009). These calculations are for a lifetime annuity without beneficiaries. However, for married couple households, the annuity value was calculated for a couple residing in NY State, where one person is a male born on June 1, 1945 (they were 64 at the time the sample was collected in 2009), and the other person is a female born on June 1, 1945. These calculations are for a lifetime annuity where the survivor continues to receive 100 percent benefit, without beneficiaries.
geographical Coverage of the data
All estimates from the CPS data are for New York City, or Kings, Queens, Bronx, Richmond, and New York counties. The smallest geographical unit available in the SIPP data is metropolitan areas in New York. Thus, our analysis of retirement plan participation by plan type, as well as any estimates of the retirement deficit (which come from SIPP data), are representative of residents in metropolitan areas of NY State. Metropolitan areas in NY include the following counties: Suffolk, Nassau, Westchester, Rockland, Orange, Dutchess, Putnam, Broome, Chautauqua, Erie, Niagara, Monroe, Genesee, Ontario, Cayuga, Onondaga, Rensselaer, Saratoga, Oswego, Albany, Madison, Schenectady, Oneida, Herkimer, Washington, Wayne, Orleans, Tioga, and Warren Counties. These are in addition to Bronx, Queens, Richmond, Kings, and New York counties, which make up New York City. New York City residents dominate the data—they constitute 46 percent of the population in NY State metropolitan areas. So even though it is not possible to isolate New York City in the SIPP data, using a sample of residents of New York metropolitan areas produces a good approximation of the retirement assets and needs of New York City residents.
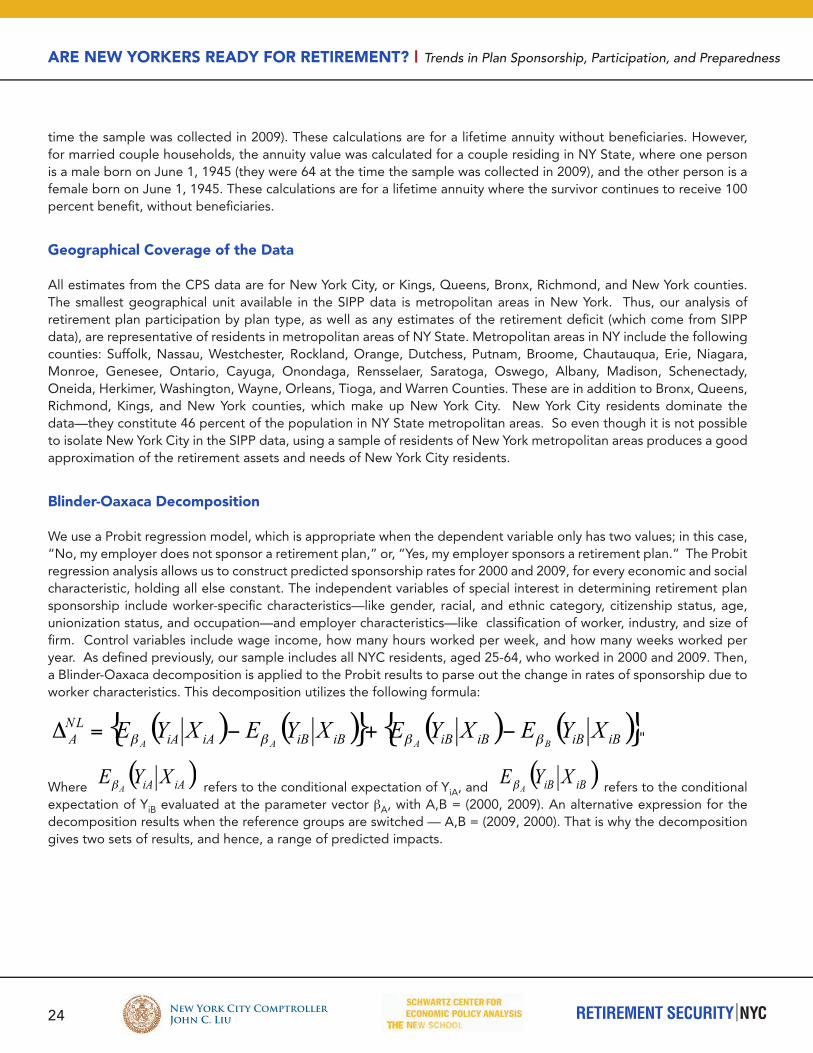
Blinder-Oaxaca decomposition
We use a Probit regression model, which is appropriate when the dependent variable only has two values; in this case, “No, my employer does not sponsor a retirement plan,” or, “Yes, my employer sponsors a retirement plan.” The Probit regression analysis allows us to construct predicted sponsorship rates for 2000 and 2009, for every economic and social characteristic, holding all else constant. The independent variables of special interest in determining retirement plan sponsorship include worker-specific characteristics—like gender, racial, and ethnic category, citizenship status, age, unionization status, and occupation—and employer characteristics—like classification of worker, industry, and size of firm. Control variables include wage income, how many hours worked per week, and how many weeks worked per year. As defined previously, our sample includes all NYC residents, aged 25-64, who worked in 2000 and 2009. Then, a Blinder-Oaxaca decomposition is applied to the Probit results to parse out the change in rates of sponsorship due to worker characteristics. This decomposition utilizes the following formula:
Where MMMMMMMMM refers to the conditional expectation of YiA, and MMMMMMMMM refers to the conditional expectation of YiB evaluated at the parameter vector βA, with A,B = (2000, 2009). An alternative expression for the decomposition results when the reference groups are switched — A,B = (2009, 2000). That is why the decomposition gives two sets of results, and hence, a range of predicted impacts.
"" "

A Report by the Schwartz Center for Economic Policy Analysis | 2011
25New York City ComptrollerJohn C. Liu RETIREMENT SECURITY NYC
demographic, Social, and economic Composition of the working Population, Aged 25-64, 2009
table continued on next page
NYC U.S.
Gender
Male 52% 53%
Female 48% 47%
Citizenship Status
Non-Citizens 24% 9%
Citizens 76% 91%
Age Group
25-44 58% 53%
45-54 25% 28%
55-64 17% 19%
Race
White Non-Hispanic 38% 69%
Black Non-Hispanic 22% 11%
Asian Non-Hispanic 14% 5%
Hispanic 25% 14%
Other 0% 2%
Classification of Worker
Self-Employed 8% 10%
Wage and Salary Workers 76% 73%
Government 11% 8%
Firm Size
1-25 employees 38% 30%
26-99 10% 12%
100-499 12% 13%
500-999 4% 5%
1000+ 36% 40%
Union Status
Not covered by a union contract 68% 85%
Covered by a union contract 32% 15%
Industry
Construction 5% 7%
Manufacturing 4% 11%
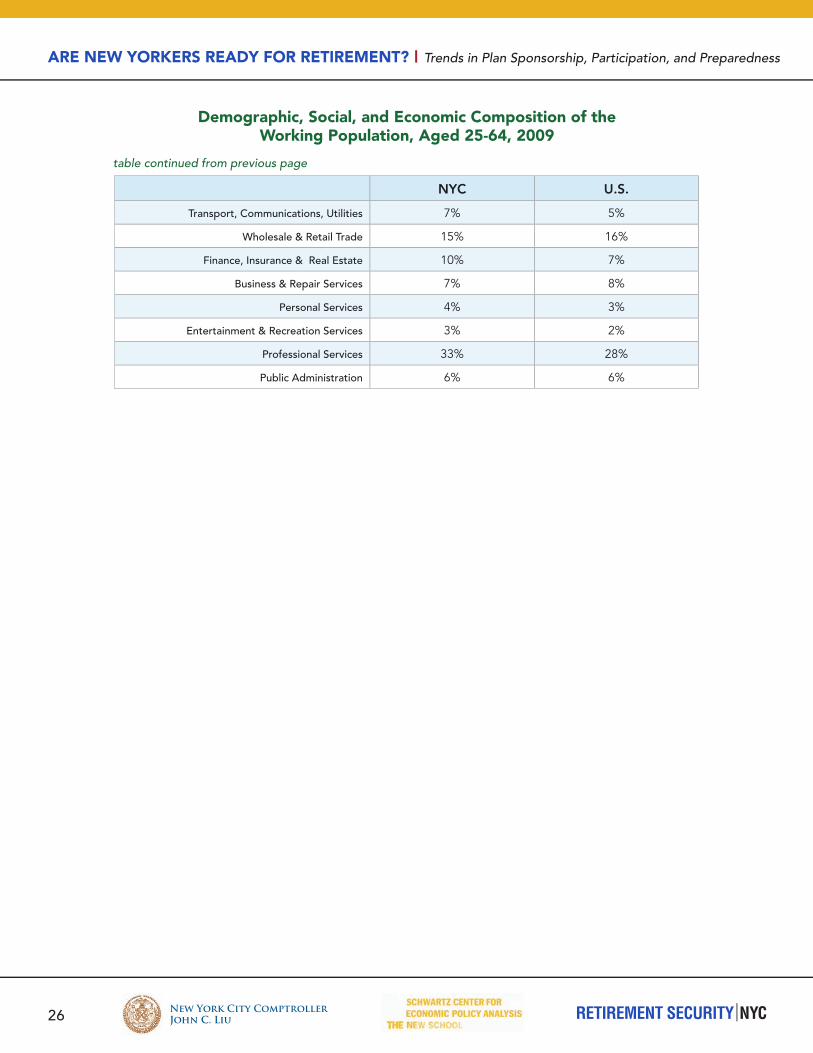
26
ARe New YORkeRS ReAdY FOR ReTIRemeNT? | Trends in Plan Sponsorship, Participation, and Preparedness
New York City ComptrollerJohn C. Liu RETIREMENT SECURITY NYC
NYC U.S.
Transport, Communications, Utilities 7% 5%
Wholesale & Retail Trade 15% 16%
Finance, Insurance & Real Estate 10% 7%
Business & Repair Services 7% 8%
Personal Services 4% 3%
Entertainment & Recreation Services 3% 2%
Professional Services 33% 28%
Public Administration 6% 6%
demographic, Social, and economic Composition of the working Population, Aged 25-64, 2009
table continued from previous page

A Report by the Schwartz Center for Economic Policy Analysis | 2011
27New York City ComptrollerJohn C. Liu RETIREMENT SECURITY NYC
Social, Personal, or Economic Characteristic
DB Plan Participation
RateParticipating Population
DC Plan Participation
RateParticipating Population
Gender
Female 44% 587,537 56% 758,354
Male 43% 681,614 57% 900,779
Citizenship Status
Non-Citizen 47% 57,772 53% 66,293
Citizen 43% 1,211,379 57% 1,592,840
Age Group
25-44 42% 546,911 58% 753,140
45-54 43% 426,119 57% 556,465
55-64 46% 296,121 54% 349,528
Income Category*
Low Income ($0-$24,000) 48% 138,924 52% 150,504
Middle Income ($24,001-$65,004) 42% 702,879 58% 955,438
High Income ($65,005+) 44% 427,348 56% 553,191
Classification of Worker**
Private Sector: Wage and Salary 36% 673,942 64% 1,203,522
Private Sector: Self Employed 9% 7,325 91% 76,420
Government 61% 584,130 39% 374,478
Race
White Non-Hispanic 41% 850,290 59% 1,229,390
Black Non-Hispanic 61% 197,652 39% 128,869
Asian Non-Hispanic 50% 85,673 50% 87,105
Hispanic 38% 124,357 62% 201,652
Other 48% 11,179 52% 12,117
Industry
Construction 56% 67,438 44% 53,663
Manufacturing 30% 74,906 70% 172,254
Wholesale Trade 25% 23,465 75% 69,208
Retail Trade 37% 57,471 63% 95,874
*Low, middle, and high income categories are defined as the bottom 25th, middle 50th, and top 25th percentiles of the total personal earnings distribution, as calculated from the SIPP sample of NY State metropolitan area residents aged 25-64. **Workers who are not in the question universe for the class of worker question but who participate in a retirement plan total 8,467.
detailed Analysis of dB and dC Participation by Social, economic, and Personal Characteristics, 2009
table continued on next page

28
ARe New YORkeRS ReAdY FOR ReTIRemeNT? | Trends in Plan Sponsorship, Participation, and Preparedness
New York City ComptrollerJohn C. Liu RETIREMENT SECURITY NYC
Social, Personal, or Economic Characteristic
DB Plan Participation
RateParticipating Population
DC Plan Participation
RateParticipating Population
Transport, Warehousing, Utilities 58% 135,859 42% 97,843
Information Services 49% 48,257 51% 50,094
Finance, Insurance, Real Estate, Rental Services 26% 70,844 74% 203,542
Professional, Scientific, Management, Administration, Waste Management
27% 90,884 73% 246,786
Education, Health Care, Social Assistance 48% 404,614 52% 435,394
Arts, Entertainment, Recreation, Accommodation, Food Services
43% 40,175 57% 52,958
Other Services (Except Public Administration) 46% 26,321 54% 30,741
Public Administration 60% 228,917 40% 150,776
Firm Size***
Small Firm (Less than 25 Employees) 25% 72,916 75% 224,252
Medium Firm (25-99 Employees) 42% 79,977 58% 111,946
Large Firm (100+ Employees) 46% 1,112,504 54% 1,318,222
Source: 2008 Survey of Income and Program Participation (SIPP) Panel. Note: Sample includes all NY State metropolitan area residents aged 25-64 who have worked in the reference period (April-July 2009), have positive earnings, are not unpaid family workers, and are not in the Armed Forces or in the Agriculture, Forestry, and Fisheries sector. ***Contingent workers who participate in a retirement plan are not in the universe of this question. They total 8,467.
detailed Analysis of dB and dC Participation by Social, economic, and Personal Characteristics, 2009
table continued from previous page


New York City ComptrollerJohn C. Liu
Comptroller of the City of New York
1 Centre Street, New York, NY 10007
comptroller.nyc.gov
RETIREMENT SECURITY NYC