are food webs divided into compartments?
TRANSCRIPT

Are Food Webs Divided into Compartments?Author(s): Stuart L. Pimm and John H. LawtonSource: Journal of Animal Ecology, Vol. 49, No. 3 (Oct., 1980), pp. 879-898Published by: British Ecological SocietyStable URL: http://www.jstor.org/stable/4233 .
Accessed: 02/05/2014 19:35
Your use of the JSTOR archive indicates your acceptance of the Terms & Conditions of Use, available at .http://www.jstor.org/page/info/about/policies/terms.jsp
.JSTOR is a not-for-profit service that helps scholars, researchers, and students discover, use, and build upon a wide range ofcontent in a trusted digital archive. We use information technology and tools to increase productivity and facilitate new formsof scholarship. For more information about JSTOR, please contact [email protected].
.
British Ecological Society is collaborating with JSTOR to digitize, preserve and extend access to Journal ofAnimal Ecology.
http://www.jstor.org
This content downloaded from 130.132.123.28 on Fri, 2 May 2014 19:35:31 PMAll use subject to JSTOR Terms and Conditions
Journal of Animal Ecology (1980), 49, 879-898
ARE FOOD WEBS DIVIDED INTO COMPARTMENTS?*
BY STUART L. PIMMt AND JOHN H. LAWTON
Environmental Sciences Division, Oak Ridge National Laboratory, Oak Ridge, Tennessee 37830, U.S.A., and Department of Biology, University of York,Heslington, York YOI 5DD
England
SUMMARY
(1) In general, randomly constructed model food webs are less likely to be stable the more species they contain, the more interactions there are between species, and the greater the intensity of these interactions.
(2) Intriguingly, it has been argued (May 1972, 1973) that for a given interaction strength and web connectance, model food webs have a higher probability of being stable if the interactions are arranged into 'blocks' or 'compartments'; this has been coupled with the prediction that complex food webs in the real world may be similarly compartmented.
(3) Alternative food web models are briefly described. These incorporate biologically more realistic assumptions, and do not neccessarily predict that food webs are more likely to be stable if they are divided into blocks.
(4) Compartments exist in food webs if the interactions within the web are grouped into subsystems: that is, if species interact strongly only with species in their own sub- systems, and interact little, if at all, with species outside it.
(5) Drawing on a number of alternative approaches, we test the null hypothesis that real food webs are not significantly more compartmented than chance alone dictates.
(6) Analyses of published food webs show that subsystems can only be detected where the webs span major habitat divisions, for example a forest and a prairie, or adjacent freshwater and terrestrial habitats. These compartments are imposed by the natural histories of the component species. There are no grounds for believing that dynamical constraints, i.e. a requirement for persistent natural food webs to be stable, play any part in imposing compartments.
(7) On a finer scale, we find no evidence for compartments in any of the food webs examined. Polyphagy in higher trophic levels may lead to a merging of detritus and grazing food chains, immediately above the level of the primary consumers. Polyphagy similarly generates non-compartmented food webs in assemblages of phytophagous in- sects. Several well documented food webs from other habitats are not noticeably com- partmented.
(8) The implications, and limitations, of these results are discussed in the light of the general notion that loosely coupled subsystems promote ecosystem stability. On present
* Research supported by the United States National Science Foundation's Ecosystem Studies Program under Interagency Agreement No. DEB 77-25781 with the U.S. Department of Energy under contract W-7405-eng-26 with Union Carbide Corporation. Publication No. 1566, Environmental Sciences Division, ORNL.
t Current address: Department of Biological Sciences, Texas Tech. University, Lubbock, Texas 79409, U.S.A.
0021-8790/80/1000-0879$02.00 ?1980 Blackwell Scientific Publications
879
This content downloaded from 130.132.123.28 on Fri, 2 May 2014 19:35:31 PMAll use subject to JSTOR Terms and Conditions
evidence, we conclude there are neither adequate theoretical nor convincing empirical grounds for believing that food webs are divided into compartments.
(9) These conclusions require more detailed testing using food web data which specify not only the presence, but also the strength and temporal variation of the interactions.
INTRODUCTION
Arguably the most important insight to emerge from May's (1972, 1973) analysis of model food webs is that complexity begets instability, not stability. In general, randomly constructed model food webs are less likely to be stable the more species they contain, the more interactions there are between species, and the greater the intensity of those interactions. Ecological communities persist in the real world despite, not because of, their complexity.
Real food webs are not random assemblages of species. Hence we can ask: what are the special features of real, as opposed to random food webs which tend to make the former stable and the latter unstable? The answer seems to be several things. For example, the stability of real food webs is probably enhanced by low levels of connectance between species (Rejmanek & Stary 1979); the absence of biologically absurd linkages of the type species A feeds on B, which feeds on C, which feeds on A (Pimm 1979a, b); special constraints on biomass transfer (DeAngelis 1975); a limit on the number of trophic levels (Pimm & Lawton 1977; Lawton & Pimm 1978; Pimm 1979a); a low frequency, and special patterns of omnivory (Pimm & Lawton 1978; Lawton & Pimm 1979; Pimm 1979a); and a non-random (patchy) distribution of prey and predators (Hassell 1978). One other important possibility, suggested by May (1972, 1973), has not yet been explored in detail; namely that when food webs are divided into blocks, or compartments, the probability of the resulting food webs being stable is greatly enhanced. Following May, both McNaughton (1978) and Rejmanek & Stary (1979) have recently proposed that division into discrete subsystems promotes the persistence and stability of two very different assemblages of species, plants in an African grassland (but see Lawton & Rallison 1979), and populations of aphids and their associated natural enemies. A contrary point of view has been put by Murdoch (1979) who argues that most well studied natural communities do not appear to be divided into loosely coupled subsystems.
In this paper we examine the structure of real food webs, to see if they are, or are not, divided into compartments. The webs are defined by binary data: a feeding link either exists, or it does not. Our analysis is therefore modest and preliminary, taking no account of the strength or the seasonal variation of the feeding links. If compartments can be shown to exist using binary data they will remain in more sophisticated descriptions of food webs. If compartments can not be identified using binary data, the case for the existence of subsystems within food webs is weakened, but not destroyed. We return to this problem briefly in the Discussion.
Two extreme hypotheses encompass possible web structures in the real world. (1) The 'reticulate hypothesis': species interactions are uniformly distributed (homo-
geneous) throughout the system, subject to the minimal biological constraints outlined below.
(2) The 'loosely coupled subsystem hypothesis': only species within a particular sub-
system interact. Between subsystems (called 'blocks' by May 1973, and 'compartments' by Pimm 1979a) there is little interaction. (In this paper, when we use the term sub-
Are food webs compartmented? 880
This content downloaded from 130.132.123.28 on Fri, 2 May 2014 19:35:31 PMAll use subject to JSTOR Terms and Conditions
S. L. PIMM AND J. H. LAWTON
system we shall be referring to this idea and not to any other subset of species within a system.)
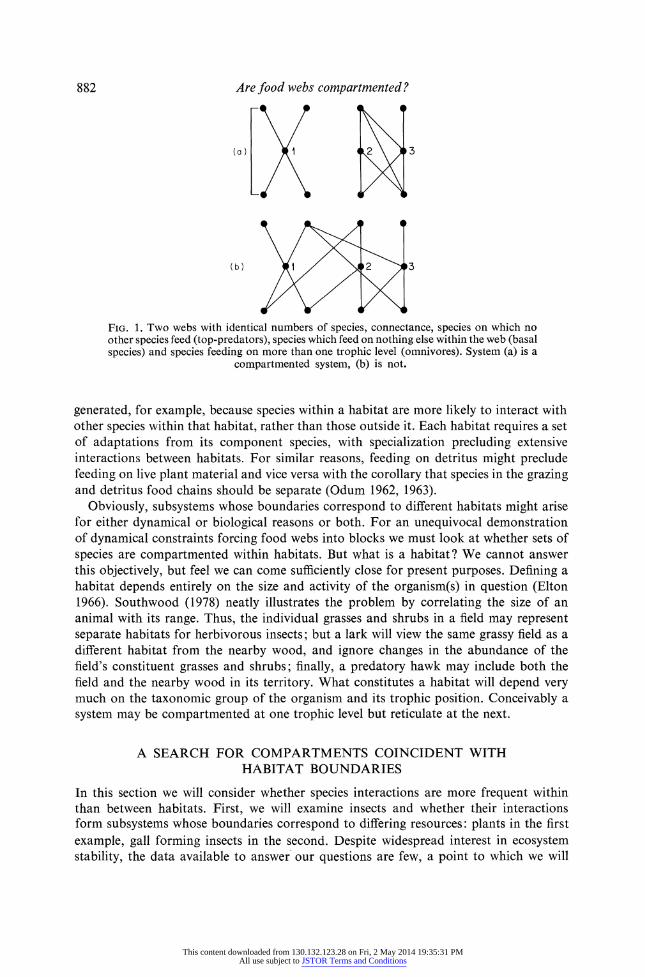
The two hypotheses are illustrated in Fig. 1. Of course, food webs in the real world will neither be completely compartmented, nor totally reticulate: but if the notion that blocking promotes stability has any substance, real food webs should be more compart- mented than chance alone dictates.
Deciding what chance alone dictates is not completely straightforward, because asking a computer to draw an unconstrained random food web, for example, leads to all sorts of biological absurdities: predators with nothing to feed on; autotrophes (plants) in the middle of food chains; excessively large numbers of trophic levels; thermodynamically impossible loops of the type A feeds on B, feeds on C, feeds on A, and so on. Cohen (1978) and Pimm (1979a, 1979b) discuss these problems in detail; Pimm (1979b) presents an algorithm for generating constrained random webs without biological absurdities. The key null hypothesis in this paper is that within the limits imposed by minimal biological constraints, real food webs are not significantly more blocked (compartmented) than chance alone dictates.
A closer look at the prediction that blocking enhances the stability of model food webs
May (1972, 1973) argued from considerations of connectance (the proportion of possible species interactions that are non-zero) and interaction strength (the magnitude of the non-zero interactions) that 'for a given interaction strength and web connectance (models) will do better if the interactions tend to be arranged in blocks'. By 'better' May meant more likely to be locally stable, and hence more likely to persist. His com- parisons are based on the fraction of models that are asymptotically stable, the same criterion we have used elsewhere (Pimm & Lawton 1977, 1978) to make predictions about the design of food webs. However, May's comparisons are between blocked models and completely randomly organized models. When we exclude many of the biologically unreasonable phenomena found in completely random model food webs (see above) his intriguing result no longer holds. Indeed, completely compartmented models with a given level of connectance have the least likelihood of being stable (Pimm 1979a). The distinction between May's result and Pimm's result is important. The former specifically predicts that compartments should be present in real food webs, the latter that they should not.
Note both Pimm and May (and authors cited therein) agree that low connectance enhances a model's chances of being stable. As connectance is lowered, models will tend to become more compartmented. However, connectance and blocking are independent; when the former is fixed the latter can vary extensively (Fig. 1). The destabilizing influence of high connectance should not be attributed to a lack of compartmentalization.
Whether May's or Pimm's result is a more accurate description of the real world is probably best settled by an analysis of real webs rather than a pedantic discussion of their models' assumptions. Finding out what happens in real webs is one of the principle objectives of this paper.
May's result is a specific example of a general class of models predicting structure in food webs for dynamical reasons. It is important to realize that the same structures, or patterns (e.g. blocking) might just as easily be generated by biological, or natural history constraints. Examples in the real world of food web structures predicted by stable models would then merely be consistent with the requirements for stability; they would not be a consequence of those requirements. Compartments in food webs could presumably be
881
This content downloaded from 130.132.123.28 on Fri, 2 May 2014 19:35:31 PMAll use subject to JSTOR Terms and Conditions
Are food webs compartmented?
(a) 3
(b) 3
FIG. 1. Two webs with identical numbers of species, connectance, species on which no other species feed (top-predators), species which feed on nothing else within the web (basal species) and species feeding on more than one trophic level (omnivores). System (a) is a
compartmented system, (b) is not.
generated, for example, because species within a habitat are more likely to interact with other species within that habitat, rather than those outside it. Each habitat requires a set of adaptations from its component species, with specialization precluding extensive interactions between habitats. For similar reasons, feeding on detritus might preclude feeding on live plant material and vice versa with the corollary that species in the grazing and detritus food chains should be separate (Odum 1962, 1963).
Obviously, subsystems whose boundaries correspond to different habitats might arise for either dynamical or biological reasons or both. For an unequivocal demonstration of dynamical constraints forcing food webs into blocks we must look at whether sets of species are compartmented within habitats. But what is a habitat? We cannot answer this objectively, but feel we can come sufficiently close for present purposes. Defining a habitat depends entirely on the size and activity of the organism(s) in question (Elton 1966). Southwood (1978) neatly illustrates the problem by correlating the size of an animal with its range. Thus, the individual grasses and shrubs in a field may represent separate habitats for herbivorous insects; but a lark will view the same grassy field as a different habitat from the nearby wood, and ignore changes in the abundance of the field's constituent grasses and shrubs; finally, a predatory hawk may include both the field and the nearby wood in its territory. What constitutes a habitat will depend very much on the taxonomic group of the organism and its trophic position. Conceivably a system may be compartmented at one trophic level but reticulate at the next.
A SEARCH FOR COMPARTMENTS COINCIDENT WITH HABITAT BOUNDARIES
In this section we will consider whether species interactions are more frequent within than between habitats. First, we will examine insects and whether their interactions form subsystems whose boundaries correspond to differing resources: plants in the first
example, gall forming insects in the second. Despite widespread interest in ecosystem stability, the data available to answer our questions are few, a point to which we will
882
This content downloaded from 130.132.123.28 on Fri, 2 May 2014 19:35:31 PMAll use subject to JSTOR Terms and Conditions
return below. Second, we will examine whether major habitat divisions (forest versus prairie, for example) impose a subsystem structure upon larger organisms. Finally, we will examine interactions within and between grazing and detritus food chains.
Plants and their insects as subsystems Direct evidence
Data on the herbivorous insects and their predators and parasitoids for two or more species of plant in the same local area are few. We have two examples:
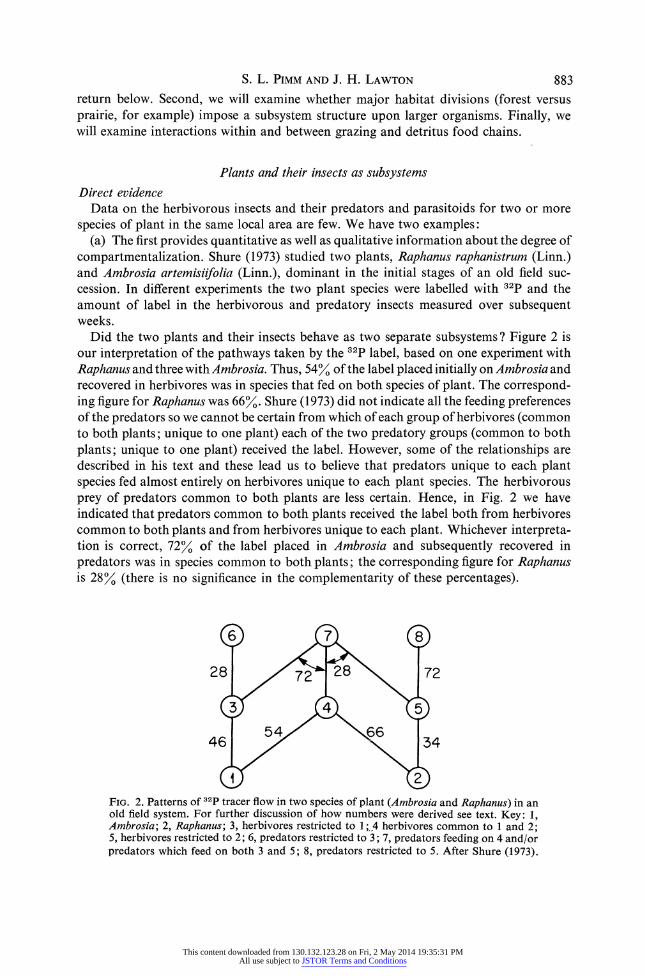
(a) The first provides quantitative as well as qualitative information about the degree of compartmentalization. Shure (1973) studied two plants, Raphanus raphanistrum (Linn.) and Ambrosia artemisiifolia (Linn.), dominant in the initial stages of an old field suc- cession. In different experiments the two plant species were labelled with 32P and the amount of label in the herbivorous and predatory insects measured over subsequent weeks.
Did the two plants and their insects behave as two separate subsystems ? Figure 2 is our interpretation of the pathways taken by the 32P label, based on one experiment with Raphanus and three with Ambrosia. Thus, 540 of the label placed initially on Ambrosia and recovered in herbivores was in species that fed on both species of plant. The correspond- ing figure for Raphanus was 66%. Shure (1973) did not indicate all the feeding preferences of the predators so we cannot be certain from which of each group of herbivores (common to both plants; unique to one plant) each of the two predatory groups (common to both plants; unique to one plant) received the label. However, some of the relationships are described in his text and these lead us to believe that predators unique to each plant species fed almost entirely on herbivores unique to each plant species. The herbivorous prey of predators common to both plants are less certain. Hence, in Fig. 2 we have indicated that predators common to both plants received the label both from herbivores common to both plants and from herbivores unique to each plant. Whichever interpreta- tion is correct, 72% of the label placed in Ambrosia and subsequently recovered in predators was in species common to both plants; the corresponding figure for Raphanus is 28o (there is no significance in the complementarity of these percentages).
28 / 8 72
46 5 \ 34
FIG. 2. Patterns of 32P tracer flow in two species of plant (Ambrosia and Raphanus) in an old field system. For further discussion of how numbers were derived see text. Key: 1, Ambrosia; 2, Raphanus; 3, herbivores restricted to ;.4 herbivores common to 1 and 2; 5, herbivores restricted to 2; 6, predators restricted to 3; 7, predators feeding on 4 and/or predators which feed on both 3 and 5; 8, predators restricted to 5. After Shure (1973).
S. L. PIMM AND J. H. LAWTON 883
This content downloaded from 130.132.123.28 on Fri, 2 May 2014 19:35:31 PMAll use subject to JSTOR Terms and Conditions
2 2 2
2 2
Are food webs compartmented? TABLE 1
Predators
22 23 24 25 26 27 28 29 30 31 1 1
-1 -1 2 2 1 1 1 2 -1 1 2 -1
-1
-1
-1 2 1
-1 -1
-1 2 2 2
32 33 34 35 36 37
1 1
1
1
1 1
1
1 -1 1 -1 -1 -1 1
1 1 1 1 1 1 1
1 1
1 1
1 1
I
1 1
1
1 1
1
1 1 1 1 1 1 1 1
1
1
1 I
1 1 1 1 1 1 1 1
1 1 1 1
1 1 1 1
1 1 1
1
1
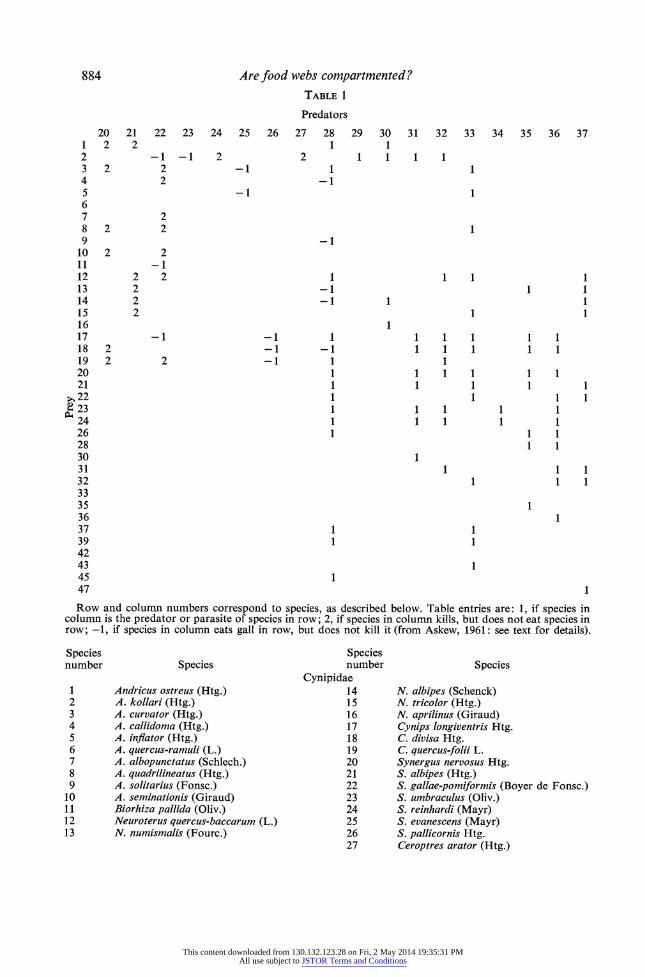
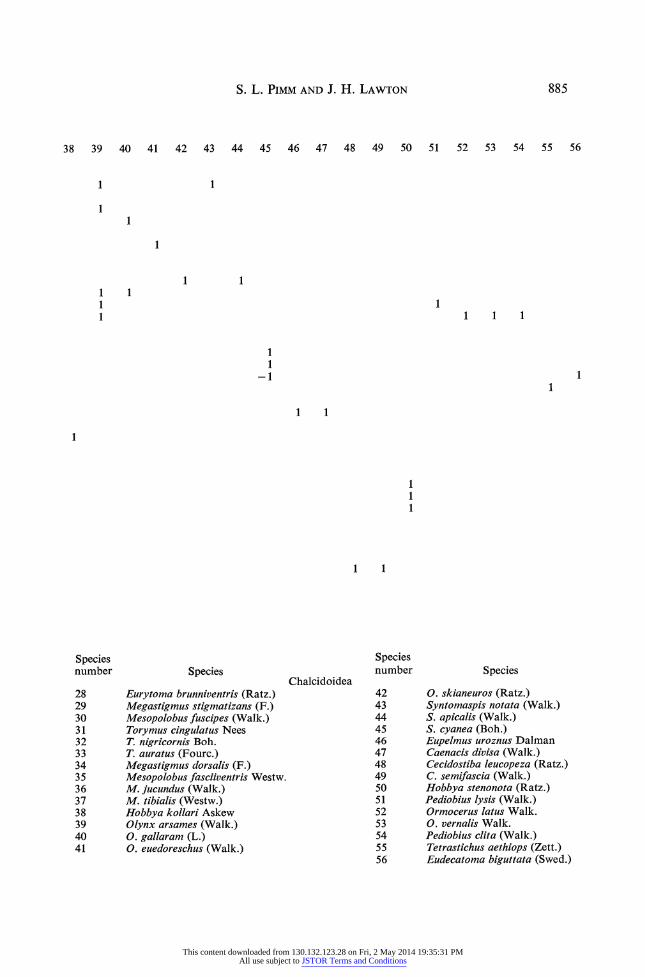
Row and column numbers correspond to species, as described below. Table entries are: 1, if species in column is the predator or parasite of species in row; 2, if species in column kills, but does not eat species in row; -1, if species in column eats gall in row, but does not kill it (from Askew, 1961: see text for details).
Species number Species
1 Andricus ostreus (Htg.) 2 A. kollari (Htg.) 3 A. curvator (Htg.) 4 A. callidoma (Htg.) 5 A. inflator (Htg.) 6 A. quercus-ramuli (L.) 7 A. albopunctatus (Schlech.) 8 A. quadrilineatus (Htg.) 9 A. solitarius (Fonsc.)
10 A. seminationis (Giraud) 11 Biorhiza pallida (Oliv.) 12 Neuroterus quercus-baccarum (L.) 13 N. numismalis (Fourc.)
Species number
Cynipidae 14 N. albipes (Schenck) 15 N. tricolor (Htg.) 16 N. aprilinus (Giraud) 17 Cynips longiventris Htg. 18 C. divisa Htg. 19 C. quercus-folii L. 20 Synergus nervosus Htg. 21 S. albipes (Htg.) 22 S. gallae-pomiformis (Boyer de Fonsc.) 23 S. umbraculus (Oliv.) 24 S. reinhardi (Mayr) 25 S. evanescens (Mayr) 26 S. pallicornis Htg. 27 Ceroptres arator (Htg.)
884
20 2
2
21 2
2 2 2 2
1 2 3 4 5 6 7 8 9
10 11 12 13 14 15 16 17 18 19 20 21
, 22 E 23
24 26 28 30 31 32 33 35 36 37 39 42 43 45 47
1 1 1 1 1
1
1 1
1 1
Species
1
This content downloaded from 130.132.123.28 on Fri, 2 May 2014 19:35:31 PMAll use subject to JSTOR Terms and Conditions
S. L. PIMM AND J. H. LAWTON
38 39 40 41 42 43 44 45
I
1
46 47 48 49 50 51 52 53 54 55
1
1
1
1 1
1 1 1
1 1 1
1 I
-1 I
1 1
1
1 1 1
1 1
Species
Eurytoma brunniventris (Ratz.) Megastigmus stigmatizans (F.) Mesopolobus fuscipes (Walk.) Torymus cingulatus Nees T. nigricornis Boh. T. auratus (Fourc.) Megastigmus dorsalis (F.) Mesopolobus fasciiventris Westw. M. jucundus (Walk.) M. tibialis (Westw.) Hobbya kollari Askew Olynx arsames (Walk.) 0. gallaram (L.) 0. euedoreschus (Walk.)
Species number
Chalcidoidea 42 43 44 45 46 47 48 49 50 51 52 53 54 55 56
Species
0. skianeuros (Ratz.) Syntomaspis notata (Walk.) S. apicalis (Walk.) S. cyanea (Boh.) Eupelmus uroznus Dalman Caenacis divisa (Walk.) Cecidostiba leucopeza (Ratz.) C. semifascia (Walk.) Hobbya stenonota (Ratz.) Pediobius lysis (Walk.) Ormocerus latus Walk. 0. vernalis Walk. Pediobius clita (Walk.) Tetrastichus aethiops (Zett.) Eudecatoma biguttata (Swed.)
56
1
Species number
28 29 30 31 32 33 34 35 36 37 38 39 40 41
885
1
This content downloaded from 130.132.123.28 on Fri, 2 May 2014 19:35:31 PMAll use subject to JSTOR Terms and Conditions
Interpreting these figures is not easy because there is no obvious null hypothesis, i.e. we have no way of knowing what percentages of the label should be expected in each of the groups in Fig. 2 if either the reticulate or subsystem hypothesis were the more appropriate description of reality. One could easily argue that the data indicate compart- mentalization, or the converse. However, since an average of 500 or more of the label goes to species shared by the two plants at each consumer level, our interpretation is that the data do not support the hypothesis of two obvious compartments.
(b) A second example is provided by the data on leaf galls and their natural enemies (mainly parasitoids and hyper-parasitoids) described by Askew (1961). All are gall formers on the oak (Quercus robur, Linn.) from which we have extracted the information for one locality (Wytham Woods, Oxford, England). They form one of the most detailed and carefully gathered sets of data with which we can test for the existence of compart- ments in food webs. Arguably an oak tree forms one habitat, in which case the following analysis more properly belongs in the next major section. Instead, we have chosen to regard each kind of gall as a potentially isolated subsystem (habitat) for its specific producers, lodgers and enemies. It makes no difference to our thesis which approach is adopted.
Although the different gall-forming species could in theory give rise to different subsystems, examination of these data (Table 1) suggest that most species share many enemies (which for convenience we will label 'predators'). However, they also show the existence of two groups with no shared interactions, and even better separation might be achieved by considering congeners as subsystems; indeed we could establish a number of subsystems within the data by inspection and a posteriori reasoning, and hence find support for the subsystem hypothesis. However, we consider this a poor procedure. The potential number of ways of organizing the interactions between these species is very large and we expect chance alone to generate some compartments. Hence, the a posteriori recognition of subsystems is at best a statistically risky procedure. What we need to know is whether a particular web is more compartmented than chance alone dictates. We require an objective statistical test, with a distribution we know, or at least one which we can approximate. To do this consider some features of Fig. 1.
In the system with two subsystems (a), notice that species 1 shares neither predator nor prey species with the species of the other subsystem (2 and 3). However species 2 and 3 share both predators and prey. The numbers of predators and prey shared are shown in Table 2a. In the reticulate model (b), species 1 shares predators with species 3, and shares prey with species 2. Species 2 and 3 share a prey species but they do not share predators (Table 2b). In general, there is a tendency to share prey if predators are shared and vice versa only if the system is compartmented. If the system is reticulate, then the numbers of predators shared between two species is independent, or negatively correlated with the number of prey shared.
There is one modification that must be made to this analysis before it can be applied to Askew's data. In the data for the oak-gall food webs there is a positive correlation between the number of predators a species suffers and the number of species of prey which it utilizes. A positive correlation between the number of prey types attacked by a species, and the number of predators which in turn attack it is not usual in food webs as a whole (S. L. Pimm, in prep.) but, for whatever reason, it emerges very clearly in Askew's data. The effect of species having different numbers of prey and predators can be factored out by calculating the expected number of prey (or predators) the two species should share. This requires only a knowledge of the number of species of prey (or predators)
Are food webs compartmented ? 886
This content downloaded from 130.132.123.28 on Fri, 2 May 2014 19:35:31 PMAll use subject to JSTOR Terms and Conditions

TABLE 2. Observed and expected numbers of prey and predators shared by three species in Fig. 1. Predators shared are above diagonal, prey shared
below diagonal Observed (a) A system with two subsystems
Species 1 2 3
1 - 0 0 Species 2 0 - 1
3 0 2 - 302-
Observed (b) A system without distinct subsystems Species
1 2 3 1 - 0 1
Species 2 1 - 0 3 0 1 0
Expected (for both webs) Species 1 2 3
1 - ? 1 Species 2 1 -
3 11 -
exploited by each species and the total number of prey (or predators) within the system. Expected values have been calculated in this way for the systems in Fig. 1, and are presented in Table 2. The difference between the observed and expected values are both negative or both positive for the prey and predators of the two species being compared when and only when there are subsystems within the larger web. The differences are independent if the web is not divided into blocks. The number of cases where 'more prey are shared than expected and more predators are shared than expected' and 'fewer prey are shared than expected and fewer predators are shared than expected' can then be analysed using a standard Chi-square test.
Unlike the example shown in Fig. 1 Askew's data are further complicated by the web's complexity, which leads to the same species appearing simultaneously in the list of intermediate species, victims, and exploiters. However, ignoring this complication, which probably makes very little difference to the analysis, shows that the difference between the observed and expected number of predators shared is independent (P > 0.05) of the difference between the observed and expected number of prey shared. We conclude that the system is not more compartmented than we would expect by chance.
Indirect evidence That these two examples exhaust our evidence for and against the existence of sub-
systems within plants and their insect faunas might seem surprising. It is therefore worth considering the sorts of information we can and cannot use to refute the hypothesis that food webs are not compartmented more than we would expect by chance.
Tests of the type used on Askew's data require detailed information on more than two trophic levels because we attempt to identify subsystems by using the interactions between two trophic levels, and then test them on a third trophic level. Adequate data are extremely scarce because few workers have the necessary time, skill and patience to collect information on large numbers of herbivores, their predators, parasitoids and hyper-parasitoids at one locality. There are numerous lists of food plants, herbivores and
S. L. PIMM AND J. H. LAWTON 887
This content downloaded from 130.132.123.28 on Fri, 2 May 2014 19:35:31 PMAll use subject to JSTOR Terms and Conditions
Are food webs compartmented? their natural enemies for larger geographical regions (e.g., Lawton & Schr6der 1977; Lawton & Price 1979), but for obvious reasons these are not adequate to test hypotheses about food webs at particular localities within that region.
Similarly, there are many studies which list a taxonomically restricted set of herbivores and the plants they utilize. Cohen (1978) calls these 'sink webs' and presents examples. Unfortunately, sink webs cannot be used to make inferences about subsystems either. Even if the species show complete monophagy the importance of polyphagous species of different taxa is, by definition unstudied and therefore unknown. Clearly one requires a list of plant species and all their herbivores. These are 'source webs' and Cohen (1978) has but one example, centred upon a single species of plant.
A necessary (but not sufficient) condition for food webs to be compartmented is that data across two trophic levels indicate a subsystem structure. However, as we pointed out above, data on at least the third trophic level are needed to establish the existence of compartments. Attracted by the large number of monophagous or oligophagous phytophagous insects in certain taxa (e.g., Lawton & McNeill 1979) we earlier, tentatively suggested that food webs based on green plants might well be compartmented (Lawton & Pimm 1978). In so doing, we overlooked the fact that each of the polyphagous species of insects associated with a particular species of plant would feed on an idiosyncratic selection of alternative hosts in the habitat, a point which emerges clearly from the work of Futuyma & Gould (1979) on insect-plant associations in a deciduous forest. Hence even without the complications imposed by a third trophic level, it now appears that oligophagous and particularly polyphagous species blur any incipient compartmentali- zation generated by the monophagous species. This inference is supported by several studies (e.g. Gibson (1976), Hansen & Ueckert (1970); Joern (1979) and Shelden & Rogers (1978), all of which show considerable overlap in the plant species used. The data certainly do not give a clear impression of compartmentalization across two trophic levels; therefore the webs as a whole cannot be compartmented.
Vertebrates and major habitat divisions as subsystems We have located four studies (Table 3) which describe species interactions within and
between major habitat divisions. These divisions were established a priori by the original authors. If food webs are not divided into blocks centred on each habitat there should be as many interactions between subsystems as within subsystems, relative to the number of species in each subsystem. Figure 3 is based on the work of Summerhayes & Elton (1923) who described the major interactions within and between three habitats (terrestrial, freshwater and marine) on an arctic island. In this study the species interactions do appear to be grouped into three subsystems, though evidently some species feed across the boundaries.
In the studies we shall analyse, each species was placed in only one habitat by the original authors, even though some, or all, of its prey might come from another habitat. This suggests the following analysis:
Consider two habitats A and B, with SA and SB species in each. Further, suppose there are PA and PB interactions within each habitat and Q interactions between habitats. The average number of interactions per species within subsystems (habitats) is:
(PA + PB)I(SA + SB).
888
(1)
This content downloaded from 130.132.123.28 on Fri, 2 May 2014 19:35:31 PMAll use subject to JSTOR Terms and Conditions
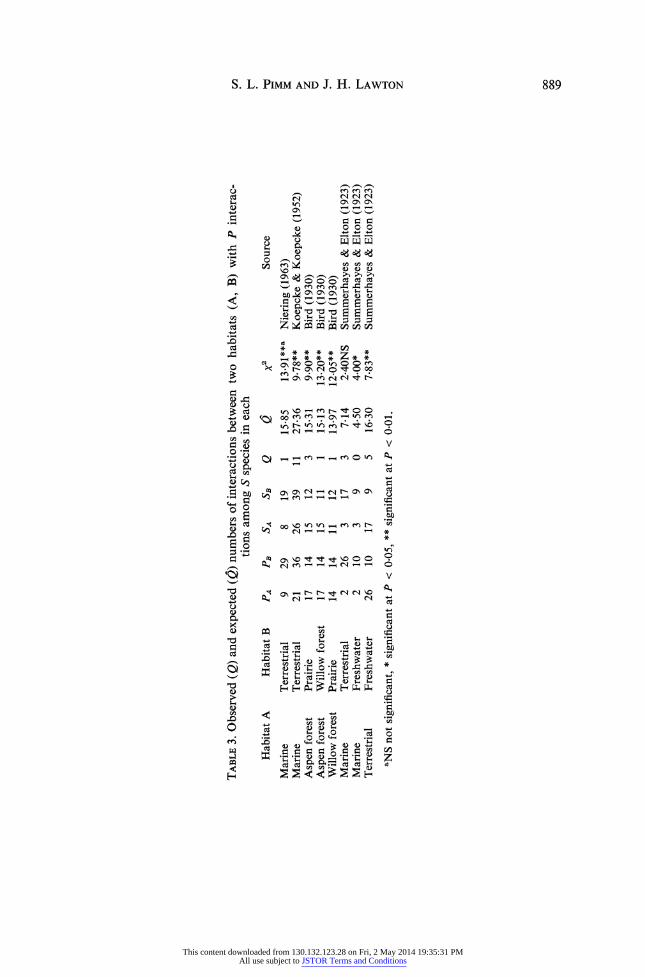
TABLE 3. Observed (Q) and expected (Q) numbers of interactions between two habitats (A, B) with P interac- v: tions among S species in each
Habitat A Habitat B PA PB SA SB Q Q 2 Source
Marine Terrestrial 9 29 8 19 1 15-85 13.91**a Niering (1963) Marine Terrestrial 21 36 26 39 11 27-36 9.78** Koepcke & Koepcke (1952) > Aspen forest Prairie 17 14 15 12 3 15-31 9.90** Bird (1930) z Aspen forest Willow forest 17 14 15 11 1 15-13 13.20** Bird (1930) Willow forest Prairie 14 14 11 12 1 13-97 12-05** Bird (1930) Marine Terrestrial 2 26 3 17 3 7-14 2-40NS Summerhayes & Elton (1923) . Marine Freshwater 2 10 3 9 0 4-50 4-00* Summerhayes & Elton (1923) Terrestrial Freshwater 26 10 17 9 5 16-30 7-83** Summerhayes & Elton (1923) >
aNS not significant, * significant at P < 0-05, ** significant at P < 0.01.
oo oo
This content downloaded from 130.132.123.28 on Fri, 2 May 2014 19:35:31 PMAll use subject to JSTOR Terms and Conditions

Marine Terrestrial I Freshwater
20a 20b
FIG. 3. Patterns of interaction described by Summerhayes & Elton (1923) within and between three arctic subsystems. Key: 1. plankton, 2. marine animals, 3. seals, 4. (a) plants (b) dead plants, 5. worms, 6. geese, 7. Colembola, 8. Diptera, 9. mites, 10. Hymenoptera, 11. sea-birds, 12. snow-bunting, 13. purple sandpiper, 14. ptarmigan, 15. spiders, 16. ducks and divers, 17. arctic fox, 18. skua and glaucous gull, 19. planktonic algae, 20. (a) benthic algae (b) decaying matter, 21. protozoa, 22. protozoa, 23. invertebrates, 24.
diptera, 25. other invertebrates, 26. Lepidurus, 27. polar bear.
The number of interactions between habitats should be proportional to the relative sizes of the numbers of species in each habitat, i.e. to
2 SA B S.(2) (SA + SBSA + S (2)
The factor two indicates that the interactions can go from A to B and from B to A. Since the expression in (1) provides a measure of the proportion of interactions to species (an underestimate, because it ignores interactions between habitats, Q), (1) times (2) provides a conservative estimate of the expected number of interactions per species between the two habitats. Thus (1) times (2) times the number of species in the system is the expected number of interactions between habitats, (Q):
2(PA + PB)SASB (SA+ SB)2
'
The observed value, 0, and the expected value, Q can be compared using a Chi-square test; the results are shown in Table 3. For all but one comparison there are fewer inter- actions between the subsystems than we would expect by chance. We conclude that these large foodwebs are compartmented, with compartment boundaries matching habitat boundaries.
Grazing versus detritus food chains as subsystems Several studies have compared the flows of energy or radioactive tracers in grazing and
detritus food-chains (Odum 1962, 1963). For small invertebrates, detritus and green plants form two markedly different subsystems and so provide a basis for the compartmentaliza- tion of food chains implied by Odum's 'Y-shaped' energy flow diagram. In a typical example, Marples (1966) labelled separately both Spartina alterniflora (Loiseleur- Deslongchamps) and the surrounding mud with 32P in a salt marsh in Georgia, U.S.A. There was virtually no overlap in the primary consumers (herbivores and detritivores) but the predators in the system, spiders, fed on both the food chains. This pattern of
890 Are food webs compartmented ?
This content downloaded from 130.132.123.28 on Fri, 2 May 2014 19:35:31 PMAll use subject to JSTOR Terms and Conditions
S. L. PIMM AND J. H. LAWTON
distinct pathways at the primary consumer level merging at the secondary consumer level (and higher) is found in a range of terrestrial and aquatic systems:
(1) the arctic habitats of Summerhays & Elton (1923); (2) the land-sea interface of Koepcke & Koepcke (1952); (3) the temperate forest of Varley (1970); (4) the oligotrophic lake of Morgan (1972) and Blindloss et al. (1972); (5) the eutrophic lake of Burgis et al. (1973) and Moriarty et al. (1973); (6) the river of Mann (1964, 1965) and Mann et al. (1972). In short, the grazing and detritus food chains are separate subsystems only at the
primary producer/detritus and primary consumer level. Above that, the subsystems are linked by common predators, although the intensity of this linkage might repay further study. We would be surprised if there were typically as many predatory links between the detritus and green plant based food chains as within them, particularly where the detritus food chain is well separated from the plants, for example between the floor and canopy of a forest. Unfortunately, the data are not adequate for us to conduct an analysis comparable to that in the previous section. At best, detritus and green plants appear to form fuzzy compartments linked by common predators.
A SEARCH FOR SUBSYSTEMS WITHIN HABITATS
In the previous section we found some evidence for the compartmentalization of food- webs based on physically distinct habitats, but the compartments are often blurred and difficult to demonstrate. Sometimes we cannot find them at all.
Where 'habitat imposed' compartments do exist within ecosystems, they may con- ceivably play a part in maintaining the stability of such systems. The really important question is whether dynamical constraints force food webs into compartments indepen- dently of the habitat imposed subsystems already discussed. In other words, to test May's important and intriguing assertion (May 1972, 1973), we must discover whether subsystems exist within habitats.
Some of the problems already encountered with Askew's (1961) data also apply here; we do not know where the boundaries between the possible subsystems should be located. We know neither the number of subsystems nor the number of species per subsystem. Consequently, for any system there might be a large range of possible subsystems. Rearranging the actual interactions between the species but preserving the trophic structure produces many possible webs. Among these one might frequently recognize apparent subsystems. Our experience suggests this to be true. To circumvent this problem we must first define a statistic which measures the degree to which a system is organized into subsystems. Then, we must find how this statistic is distributed in model systems under a null hypothesis of no compartments. Only then can we test whether real webs are more compartmented than chance alone dictates. Theoretically, we could have used this approach to analyse Askew's (1961) data. We did not because for systems as large as Askew's the technique we shall now outline is impossible to compute in a reasonable amount of time with current computer facilities.
Deciding whether subsystems exist has analogies to problems in plant ecology and systematics. In plant ecology one may have 'n' locations containing one or more of 'm' plant species. The problem is to group the locations into divisions representing com- munity types based on the presence or absence of species. In systematics one has 'm' characteristics and 'n' individuals; the latter need to be grouped so they can be given
891
This content downloaded from 130.132.123.28 on Fri, 2 May 2014 19:35:31 PMAll use subject to JSTOR Terms and Conditions
892 Are food webs compartmented?
specific or subspecific labels. There is a plethora of ordination techniques for elucidating possible boundaries between groups, but we are unable to find a technique which decides whether, given the structure of the data, one should or should not recognize distinct groups. The question of whether there are actually any groups there to be recognized seems to have been appreciated (Goodall 1966) but not solved.
The compartmentalization statistic
We call our statistic describing the degree to which systems are organized into sub- systems C : C for compartmentalization, '1' because it is only one of a large number of possibilities, and the bar because it is an average. The derivation of C1 is entirely heuristic. Its utility stems from it correctly distinguishing the degree to which systems are grouped into subsystems in a large number of test cases. It works well only when systems identical in the number of species, connectance and a variety of other properties, are compared. This proves no disadvantage here, but the statistic should not be used when systems differing in these properties are compared. An analytical understanding of the distribu- tion of C1 is probably intractable under interesting ecological conditions, but it is amenable to numerical computation.
Consider a binary matrix, A, of size n by n, where n is the number of species in the matrix; the entries aij are:
ai = I all i ai = aji = 1 if 'i' feeds on j and where j is fed upon by i. (We assume all feeding
links are reciprocal; that is, if i feeds onj, i influencesj andj influences i.
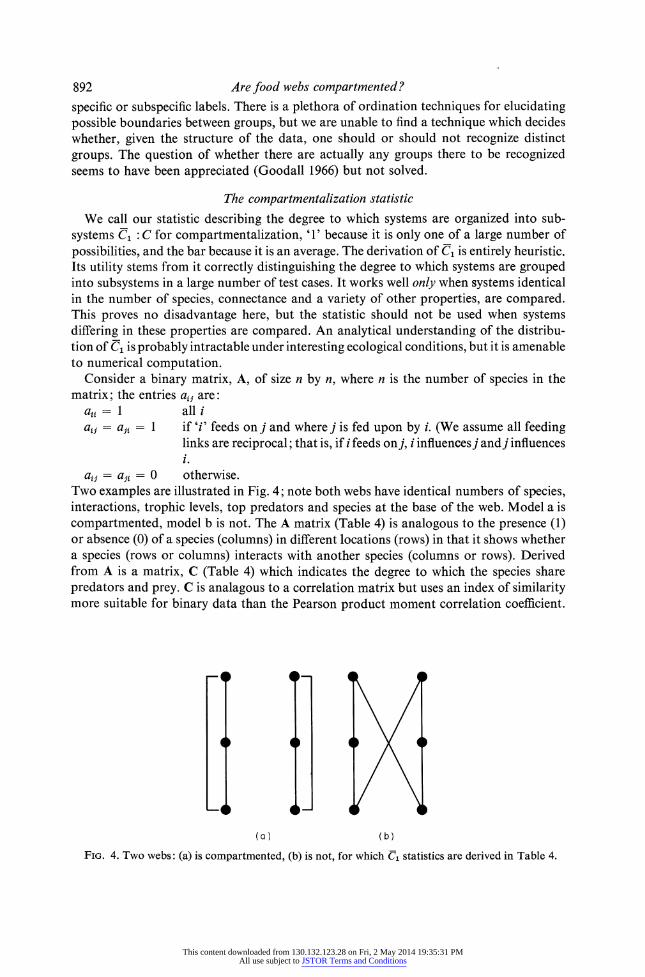
aj = aji = 0 otherwise. Two examples are illustrated in Fig. 4; note both webs have identical numbers of species, interactions, trophic levels, top predators and species at the base of the web. Model a is compartmented, model b is not. The A matrix (Table 4) is analogous to the presence (1) or absence (0) of a species (columns) in different locations (rows) in that it shows whether a species (rows or columns) interacts with another species (columns or rows). Derived from A is a matrix, C (Table 4) which indicates the degree to which the species share predators and prey. C is analagous to a correlation matrix but uses an index of similarity more suitable for binary data than the Pearson product moment correlation coefficient.
-? ?*-
(a) (b)
FIG. 4. Two webs: (a) is compartmented, (b) is not, for which C1 statistics are derived in Table 4.
This content downloaded from 130.132.123.28 on Fri, 2 May 2014 19:35:31 PMAll use subject to JSTOR Terms and Conditions
S. L. PIMM AND J. H. LAWTON
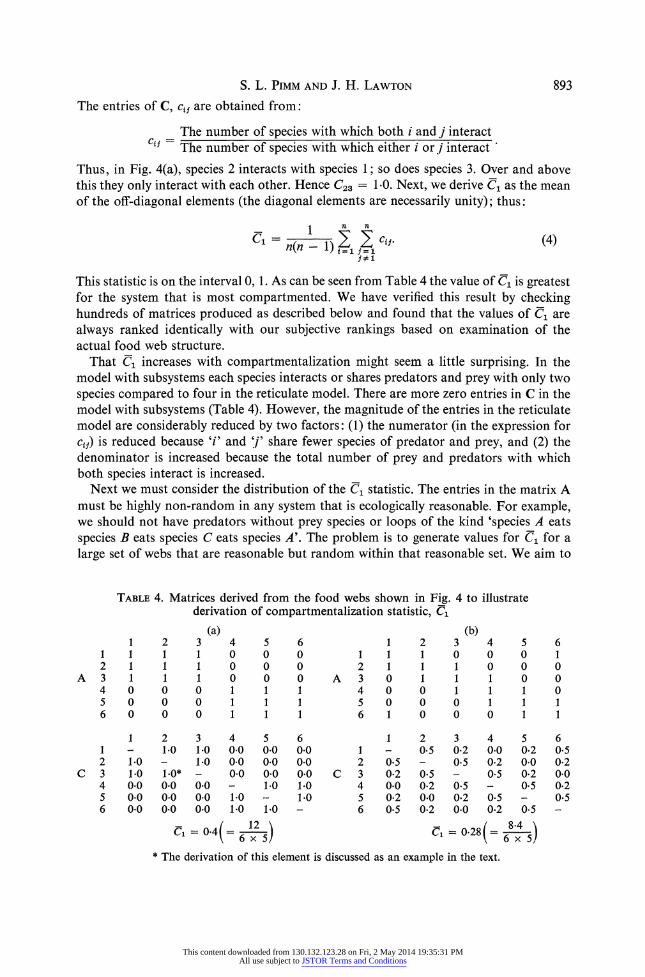
The entries of C, cij are obtained from:
The number of species with which both i and j interact ci The number of species with which either i or j interact
'
Thus, in Fig. 4(a), species 2 interacts with species 1; so does species 3. Over and above this they only interact with each other. Hence C23 = 1.0. Next, we derive C, as the mean of the off-diagonal elements (the diagonal elements are necessarily unity); thus:
- 1 n
C1,= n(n - l)Zi2 Cii.(4 Z=iJ=
This statistic is on the interval 0, 1. As can be seen from Table 4 the value of Ci is greatest for the system that is most compartmented. We have verified this result by checking hundreds of matrices produced as described below and found that the values of Ci are always ranked identically with our subjective rankings based on examination of the actual food web structure.
That C1 increases with compartmentalization might seem a little surprising. In the model with subsystems each species interacts or shares predators and prey with only two species compared to four in the reticulate model. There are more zero entries in C in the model with subsystems (Table 4). However, the magnitude of the entries in the reticulate model are considerably reduced by two factors: (1) the numerator (in the expression for c1j) is reduced because 'i' and 'j' share fewer species of predator and prey, and (2) the denominator is increased because the total number of prey and predators with which both species interact is increased.
Next we must consider the distribution of the C1 statistic. The entries in the matrix A must be highly non-random in any system that is ecologically reasonable. For example, we should not have predators without prey species or loops of the kind 'species A eats species B eats species C eats species A'. The problem is to generate values for C1 for a large set of webs that are reasonable but random within that reasonable set. We aim to
TABLE 4. Matrices derived from the food webs shown in Fig. 4 to illustrate derivation of compartmentalization statistic, C1
1 2 1 1 1 2 1 1
A 3 1 1 4 0 0 5 0 0 6 0 0
(a) 3 4 5 6 1 0 0 0 1 0 0 0 1 0 0 0 0 1 1 1 0 1 1 0 1 1
(b) 1 2 3 4 5 6
1 1 1 0 0 0 1 2 1 1 1 0 0 0
A 3 0 1 1 1 0 0 4 0 0 1 1 1 0 5 0 0 0 1 1 1 6 1 0 0 0 1 1
1 2 3 4 5 1 - 1-0 1-0 0-0 0-0 2 1.0 - 1.0 00 00
C 3 1.0 1-0* - 00 0.0 4 0.0 0.0 0.0 - 1.0 5 0-0 0-0 0-0 1-0 - 6 0.0 0.0 0.0 1.0 1*0
C = 0.4(= 6 ) =6x 5
6 00 00 0.0 1.0 1-0
1 2 3 4 5 6 1 - 0.5 0.2 0.0 0.2 0-5 2 0-5 - 0.5 0.2 0-0 0-2
C 3 0-2 0-5 - 0-5 0.2 0.0 4 0-0 0-2 0-5 - 0.5 0.2 5 0.2 0.0 0-2 0.5 - 0*5 6 0.5 0.2 0.0 0.2 0.5 -
C1 = 0.28(= 6x
* The derivation of this element is discussed as an example in the text.
893
(4)
This content downloaded from 130.132.123.28 on Fri, 2 May 2014 19:35:31 PMAll use subject to JSTOR Terms and Conditions
compare actual webs with a set of random webs, constrained to be as similar as possible to the real web under consideration. Indeed, the more properties shared by our random, but constrained, webs and the real web under consideration, the less likely that differences in values of C, will be due to factors other than the degree of grouping into subsystems. Our methods are similar (and much of the computer programme identical) to those described by Pimm (1979b) for testing other attributes of real food webs. They will be presented below only in outline.
For each real 'within-habitat' food web at our disposal we generated a random family of webs, identical in the following properties:
(1) the same number of interactions; (2) the same number of top-predators (species on which nothing else feeds); (3) the same number of basal species (species which feed on nothing else). These are
usually plants, but sometimes are detritivores; (4) the same number of intermediate species (species which are neither top-predators
nor basal species); and (5) the same number of modal trophic levels (the modal number of connections between
each top predator and the basal species, each pathway counted separately, plus one). The webs analysed and their parameters are shown in Table 5. The reasons for selecting
these studies (Pimm 1979b) largely correspond to independent decisions made by Cohen (1978). Some additional studies have been included where these met the criteria outlined and some large webs have been included which were previously difficult to analyse on available computer facilities. For each random web we calculate C1, and for the entire set, P, the proportion of random webs with Cx less than the observed value. If the null hypothesis is correct, the mean value of P for all webs should be 0.5, with P distributed uniformly on the interval 0, 1; that is, chance alone dictates that half of the random webs should be more compartmented than the real web, and half less. Some of the individual webs in Table 1 obviously depart strongly from their random relatives, but these departures are not in any consistent direction. Some webs are more compartmented than expected, others more uniform (reticulate). We set out in this paper to discover whether food webs in general were divided into subsystems. If the mean value of P averaged over all webs in Table 5 is sufficiently large, it indicates that real webs are, on average, more
compartmented than one would expect by chance. They are not; the mean of P is 0.467 and the probability that this result does not differ from 0.5 is considerably greater than 5/0. We conclude that on average within habitats there is no evidence for species inter- actions being grouped into subsystems.
DISCUSSION AND CONCLUSIONS
Our concluding remarks are four-fold and can be brief. First we are able to present some evidence for species interactions being grouped into subsystems. However, compartment- alization does not appear to be a common phenomenon. When we observe compartments they appear for biological reasons; there is no evidence for them being generated by dynamical constraints. Encouragingly, and as we pointed out in the Introduction, the prediction that webs should be compartmented for dynamical reasons may in any case be a product of using biologically unreasonable random models. Compartmented models are no more likely to be stable than randomly organized models, if care is taken to exclude biologically unreasonable phenomena from the analyses (Pimm 1979a). Hence, a lack of compartmentalization is in accord with other predictions about food
894 Are food webs compartmented ?
This content downloaded from 130.132.123.28 on Fri, 2 May 2014 19:35:31 PMAll use subject to JSTOR Terms and Conditions
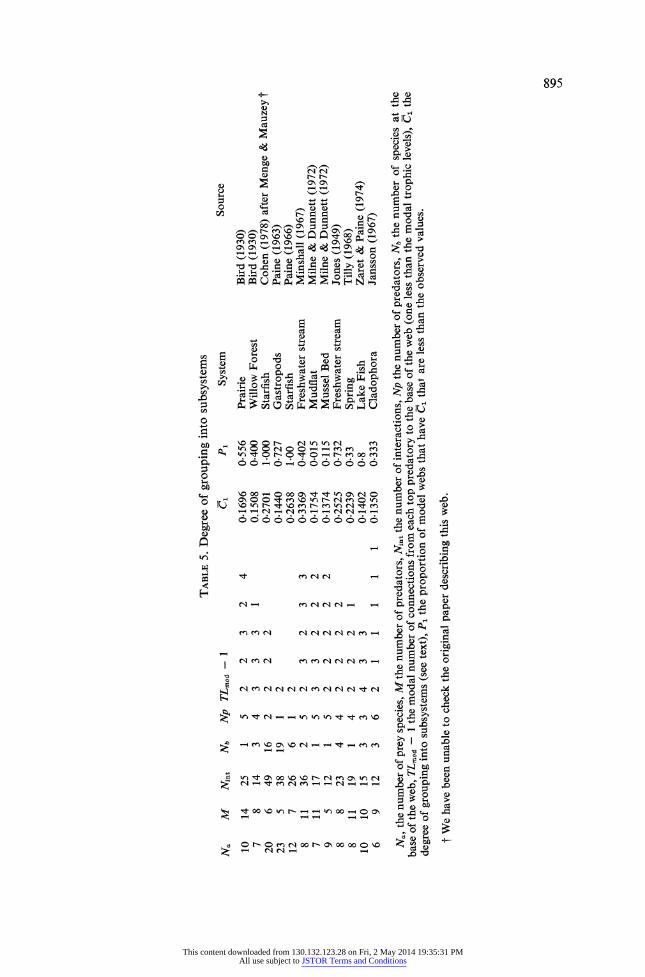
TABLE 5. Degree of grouping into subsystems
Na M Nint Nb Np TLmod - 1
10 14 25 1 5 2 2 3 2 4 7 8 14 3 4 3 3 3 1
20 6 49 16 2 2 2 2 23 5 38 19 1 2 12 7 26 6 1 2 8 11 36 2 5 2 3 2 3 3 7 11 17 1 5 3 3 2 2 2 9 5 12 1 5 2 2 2 2 2 8 8 23 4 4 2 2 2 2 8 11 19 1 4 2 2 2 1
10 10 15 3 3 4 3 3 6 9 12 3 6 2 1 1 1 1
C1 P1
0.1696 0.556 0.1508 0-400 0-2701 1-000 0.1440 0-727 0-2638 1.00 0-3369 0-402 0.1754 0.015 0-1374 0-115 0-2525 0-732 0-2239 0-33 0-1402 0-8
1 0-1350 0-333
System
Prairie Willow Forest Starfish Gastropods Starfish Freshwater stream Mudflat Mussel Bed Freshwater stream Spring Lake Fish Cladophora
Source
Bird (1930) Bird (1930) Cohen (1978) after Menge & Mauzey Paine (1963) Paine (1966) Minshall (1967) Milne & Dunnett (1972) Milne & Dunnett (1972) Jones (1949) Tilly (1968) Zaret & Paine (1974) Jansson (1967)
Na, the number of prey species, M the number of predators, Nint the number of interactions, Np the number of predators, Nb the number of species at the base of the web, TLmod - 1 the modal number of connections from each top predatory to the base of the web (one less than the modal trophic levels), Ci the
degree of grouping into subsystems (see text), P1 the proportion of model webs that have C1 that are less than the observed values.
t We have been unable to check the original paper describing this web.
00 no f-
This content downloaded from 130.132.123.28 on Fri, 2 May 2014 19:35:31 PMAll use subject to JSTOR Terms and Conditions
Are food webs compartmented? web structure derived from simple Lotka-Volterra equations; none of these predictions are refuted by the evidence at our disposal (Lawton & Pimm 1979; Pimm & Lawton 1978; Pimm 1979a, b).
Second, the caveat 'on the evidence at our disposal' is an important one. For example, within habitats, it is always possible for food webs to be divided into blocks, with the boundaries corresponding to the limits of most published work. That is, observers of real food webs stop recording where nature provides a convenient natural compartment. If we had seen only one or a small number of Askew's (1961) gall webs it would have been easy to argue that these represented a neatly defined, natural compartment. As it is we have access to numerous oak-gall webs and can refute the challenge. We cannot refute the argument at the next step, which is that the entire oak-gall system, or the oak tree in toto is the compartment, although Varley's woodland (1970) web, and our earlier comments about phytophagous insects in general make us sceptical. Those who wish to believe that webs are compartmented can always retreat to the limits of the data, but if published food webs themselves really correspond to natural compartments we see no clear way of establishing that this is so. In other words we need more and better data on food webs, specifically designed to test the compartmentalization hypothesis. On present evidence, we see no evidence for the existence of clearly defined subsystems except where they are imposed by habitat boundaries: even then they may be difficult or impossible to detect.
By using binary data (a feeding link exists, or it does not) we are, of course, unable to detect more subtle kinds of blocking. If links vary through time, for example, compart- ments may come and go although the whole web appears to be reticulate. Alternatively, it is possible for compartments to exist, defined by very strong interactions, and bordered by feeble ones. Paine's (1980) meticulous studies of marine intertidal food webs reveal a high variance in interaction strengths within webs, and he has further speculated: 'predictable strong interactions encourage the development of modules or subsystems embedded within the community'. If this is generally so, then food webs may still be made up of relatively autonomous subunits, despite the impression to the contrary created by binary data. We see no way of establishing the generality of Paine's proposition, or the existence of compartments which vary through time, without massive research efforts. In other words, our conclusions refer to an absence of compartments in binary food web data. They do not eliminate other, more subtle kinds of blocking.
Finally, there are some, as yet, rather hazy implications for ecosystem management in our results. If species interactions are, indeed, grouped into subsystems there will be a different effect on 'species deletion stability' (Pimm 1979c), than will be the case if the interactions are random, or are reticulate. Species deletion stability is defined as the probability that no species will become extinct following the removal of a species from the system. In model food webs species deletion stability is generally low (approximately 0.3) and details of food web design appear to have little effect on its magnitude (Pimm 1979c). Experimental removal of a top predator from an intertidal system (Paine 1966, 1980) or of a lake fish through the introduction of a superior competitor (Zaret & Paine 1974) both resulted in the loss of many species from each system. How many species 'ought' to have become extinct under the reticulate and the subsystem hypotheses respectively, we cannot say, but other things being equal, ecosystem disturbances should propagate more under the reticulate hypothesis than under the subsystem hypothesis. Hence, there may be both theoretical and practical reasons for examining species deletion stability in more detail.
896
This content downloaded from 130.132.123.28 on Fri, 2 May 2014 19:35:31 PMAll use subject to JSTOR Terms and Conditions
S. L. PIMM AND J. H. LAWTON
ACKNOWLEDGMENTS
Professors R. T. Paine, L. R. Taylor and M. H. Williamson made helpful comments on the manuscript.
REFERENCES
Askew, R. R. (1961). On the biology of the inhabitants of Oak gall of Cynipidae (Hymenoptera) in Britain. Transactions of the Society for British Entomology, 14, 237-269.
Bird, R. D. (1930). Biotic communities of the aspen parkland of central Canada. Ecology, 11, 356-442. Bindloss, M. E., Holden, A. V., Bailey-Watts, A. E., & Smith, I. R. (1972). Phytoplankton production,
chemical and physical conditions in Loch Leven. Productivity Problems of Freshwaters (Ed. by Z. Kajak & A. Hillbricht-Ilkowska), pp. 639-659. Polish Scientific Publishers, (Panstwowe Wydawnictwo Naukowe).
Burgis, M. J., Darlington, J. P. E. C., Dunn, I. G., Ganf, G. G., Gwahaba, J. J., & McGowan, L. M. (1973). The biomass and distribution of organisms in Lake George, Uganda. Proceedings Royal Society B, 184, 271-298.
Cohen, J. E. (1978). Food Webs and Niche Space. Princeton University Press, Princeton, New Jersey. DeAngelis, D. L. (1975). Stability and connectance in food web models. Ecology, 56, 238-243. Elton, C. S. (1966). The Pattern of Animal Communities. Methuen, London. Futuyma, D. J. & Gould, F. (1979). Associations of plants and insects in a deciduous forest. Ecological
Monographs, 49, 33-50. Gibson, C. W. D. (1976). The importance of foodplants for the distribution and abundance of some
Stenodemini (Heteroptera: Miridae) of limestone grassland. Oecologia, 25, 55-76. Goodall, D. W. (1966). Hypothesis-testing in classification. Nature 211, 329-330. Hansen, R. M. & Ueckert, D. N. (1970). Dietary similarity of some primary consumers. Ecology, 51,
640-648. Hassell, M. P. (1978). The Dynamics of Arthropod Predator Prey Systems. Princeton University Press,
Princeton, New Jersey. Jansson, A. M. (1967). The food-web of the Cladophora-belt fauna. Helgalaender wissenschaftliche
Meeresuntersuchungen, 15, 574-588. Joern, A. (1979). Feeding patterns in grasshoppers (Orthoptera: Acrididae): factors affecting special-
ization. Oecologia, 38, 325-348. Jones, J. R. E. (1949). A further ecological study of calcareous streams in the 'Black Mountain'
district of South Wales. Journal of Animal Ecology, 18, 142-159. Koepcke, H. W. & Koepcke M. (1952). Sobre el proceso de transformacion de la materia organica en
las playas arenosas marinas del Peru. Publicaciones Universidad Nacional Mayor San Marcos, Zoologie, Serie A, 8.
Lawton, J. H. & McNeill, S. (1979). Between the devil and the deep blue sea: on the problem of being a herbivore. Population Dynamics (Ed. by R. M. Anderson, B. D. Turner & L. R. Taylor), pp. 223-244. British Ecological Society Symposium. Blackwell Scientific Publications, Oxford.
Lawton, J. H. & Pimm, S. L. (1978). Population dynamics and the length of food chains. Nature, 279, 190.
Lawton, J. H. & Pimm, S. L. (1979). Are real ccmmunities unstable? Nature, 279, 822. Lawton, J. H. & Price, P. W. (1979). Species richness of parasites on hosts: Agromyzid flies on the
British Umbelliferae. Journal of Animal Ecology, 48, 619-638. Lawton, J. H. & Rallison, S. P. (1979). Stability and diversity in grassland communities. Nature, 279,
351. Lawton, J. H. & Schrider, D. (1977). Effects of plant type, size of geographical range and taxanomic
isolation on the number of insect species associated with British plants. Nature, 265, 137-140. Mann, K. H. (1964). The case history: the river Thames. River Ecology and Man (Ed. by R. T. Oglesby,
C. A. Carlson, & J. A. McCann), pp. 215-231. Academic Press, New York. Mann, K. H. (1965). Energy transformations by a population of fish in the River Thames. Journal of
Animal Ecology, 34, 253-275. Mann, K. H., Britton, R. H., Kowalczewski, A., Lack, T. J., Mathews, C. P., & McDonald, I. (1972).
Productivity and energy flow at all trophic levels in the River Thames, England. Productivity Problems in Freshwaters (Ed. by Z. Kajak & A. Hillbricht-Ilkowska), pp. 579-596. Polish Scientific Publishers, (Panstwowe Wydawnictwo Naukowe).
Marples, T. G. (1966). A radionuclide tracer study of arthropod food chains in a Spartina salt marsh ecosystem. Ecology, 47, 270-277.
May, R. M. (1972). Will a large complex system be stable? Nature, 238, 413-414.
897
This content downloaded from 130.132.123.28 on Fri, 2 May 2014 19:35:31 PMAll use subject to JSTOR Terms and Conditions
Are food webs compartmented? May, R. M. (1973). Stability and Complexity in Model Ecosystems. Princeton University Press, Prince-
ton, New Jersey. McNaughton, S. J. (1978). Stability and diversity of ecological communities. Nature, 274, 251-253. Milne H., & Dunnett, G. M. (1972). Standing crop, productivity and trophic relationships of the fauna
of the Ythan estuary. The Estuarine Environment (Ed. by R. S. K. Barnes & J. Green), pp. 86-103. Applied Science Publishers, London.
Minshall, G. W. (1967). Role of allochthonous detritus in the trophic structure of a woodland spring- brook community. Ecology, 48, 139-149.
Morgan, N. C. (1972). Productivity studies at Loch Leven (a shallow nutrient-rich lowland lake). Productivity Problems of Freshwaters (Ed. by Z. Kajak & A. Hillbricht-Ilkowska), pp. 183-205: Polish Scientfic Publishers, (Pafstwowe Wydawnictwo Naukowe).
Moriarty, D. J. W., Darlington, J. E. P. C., Dunn, I. G., Moriarty, C. M., & Tevlin, M. P. (1973). Feeding and grazing in Lake George, Uganda. Proceedings of the Royal Society B, 184, 299-319.
Murdoch, W. W. (1979). Predation and the dynamics of prey populations. Fortschritte der Zoologie, 25, 295-310.
Niering, W. A. (1963). Terrestrial ecology of Kapingamarangi Atoll, Caroline Islands. Ecological Monographs, 33, 131-160.
Odum, E. P. (1962). Relationship between structure and function in the ecosystem. Japanese Journal of Ecology, 12, 108-118.
Odum, E. P. (1963). Ecology. Holt, Rinehart, & Winston, New York. Paine, R. T. (1963). Trophic relationships of 8 sympatic predatory gastropods. Ecology, 44, 63-73. Paine, R. T. (1966). Food web complexity and species diversity. The American Naturalist, 100, 65-75. Paine, R. T. (1980). Food webs: linkage, interaction strength and community infrastructure. The third
Tansley Lecture. Journal of Animal Ecology, 49, 667-685. Pimm, S. L. (1979a). The structure of food webs. Theoretical Population Biology, 16, 144-158. Pimm, S. L. (1979b). The properties of food webs. Ecology, (in press). Pimm, S. L. (1979c). Complexity and stability; another look at MacArthur's original hypothesis.
Oikos, 33, 351-357. Pimm, S. L., & Lawton, J. H. (1977). The number of trophic levels in ecological communities. Nature,
268, 329-331. Pimm, S. L., & Lawton, J. H. (1978). On feeding on more than one trophic level. Nature, 275, 542-544. Rejmanek, M. & Stary, P. (1979). Connectance in real biotic communities and critical values for
stability of model ecosystems. Nature, 280, 311-313. Sheldon, J. K., & Rogers, L. E. (1978). Grasshopper food habits in a shrub-steppe community. Oecologia,
32, 85-92. Shure, D. J. (1973). Radionuclide tracer analysis of trophic relationships in an old-field ecosystem.
Ecological Monographs, 43, 1-19. Southwood, T. R. E. (1978). On the effects of size in determining the diversity of insect faunas.
Diversity of Insect Faunas (Ed. by L. A. Mound & N. Waloff). Royal Entomological Society Symposium, 9, pp. 19-40. Blackwell Scientific Publications, Oxford.
Summerhayes, V. S. & Elton, C. S. (1923). Contributions to the ecology of Spitsbergen and Bear Island. Journal of Ecology, 11, 214-286.
Tilly, L. J. (1968). The structure and dynamics of Cone Spring. Ecological Monographs, 37, 169-197. Varley, G. C. (1970). The concept of energy flow applied to a woodland community. Animal Popula-
tions in Relation to Their Food Resources (Ed. by A Watson), pp. 389-405. Blackwell Scientific Publications, Oxford.
Zaret, T. M. & Paine, R. T. (1953). Species introduction into a tropical lake. Science, 182, 449-455.
(Received 5 November 1979)
898
This content downloaded from 130.132.123.28 on Fri, 2 May 2014 19:35:31 PMAll use subject to JSTOR Terms and Conditions