arb vision 2.0 overview...arb vision 2.0 overview public workshop staff presentation march 16, 2015...
TRANSCRIPT

ARB VISION 2.0
OVERVIEW
PUBLIC WORKSHOP STAFF PRESENTATION
MARCH 16, 2015

WORKSHOP AGENDA
• Vision program goals & plans
• Vision 2.0 model structure
• Developing scenarios
• Description of mobile sector modules
• Description of energy module & emission factors
• Next steps
2

MISSION: REDUCING EMISSIONS
IN TRANSPORTATION “SYSTEM”
3
Activity Reduction
Advanced Technology Alternative
Fuels

• U.S. DOE Scenario Planning definition
• Identifying the range of possibilities of trends & policies
• Developing a shared understanding of a problem
• ARB and State Agency Goals
• Identify emissions benefits from existing programs,
towards reaching emissions targets
• Capture interactions of full transportation system
• Explore hypothetical strategies to meet emission target
• Provide options for policymakers to consider
GOAL OF SCENARIO PLANNING
4
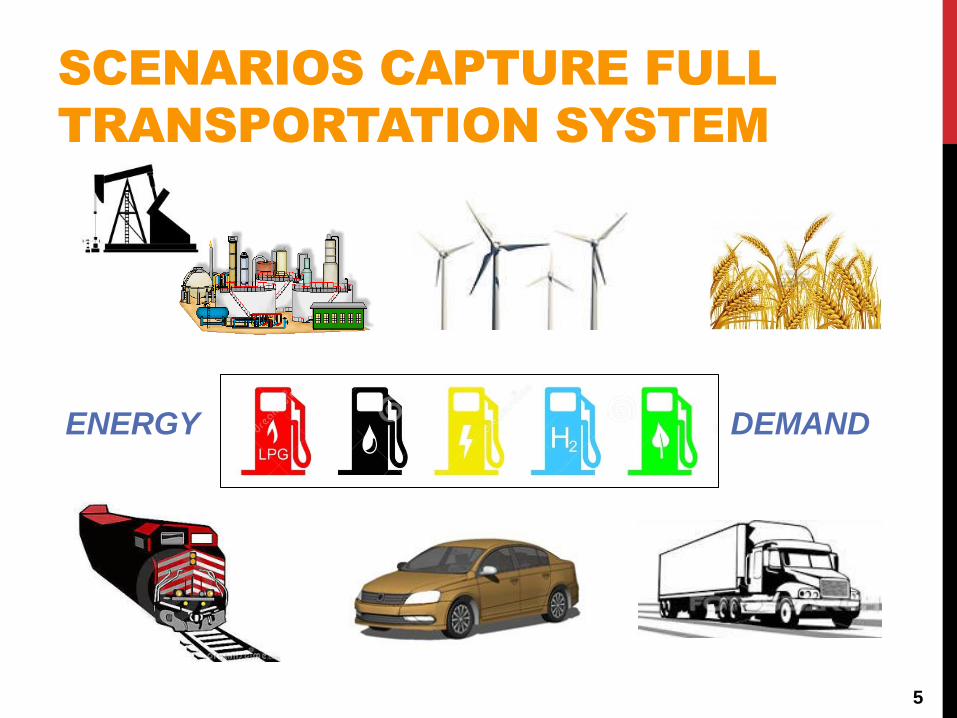
SCENARIOS CAPTURE FULL
TRANSPORTATION SYSTEM
5
ENERGY DEMAND

• Regulatory measures
• Identify vehicle and fuel coordinated strategies
• Inform scale of necessary emission reductions
• Public incentives and investments
• Identify strategic areas with long-term emission
benefits; informs spending priorities
• Local and regional planning
• Highlight types of alternative fuels needed by sector
(infrastructure planning)
• Highlight fuel production and delivery transformation
VALUE OF VISION SCENARIOS
FOR POLICYMAKERS
6

VISION SCENARIO PLANS:
INFORMING ARB PROGRAMS
• 2016 SIP for 75 ppb 8 hr ozone standard
• Governor’s climate and petroleum targets
• Mobile sector policies for NOx & GHG reductions
• Heavy duty vehicle & off-road policies
• Light duty vehicle LEV/ZEV Rules
• Sustainable Freight
• Scoping Plan Updates
• Caltrans CTP 2040
7

KEY TRANSPORTATION QUESTIONS
TO ADDRESS EMISSIONS GOALS
Systems
• How do strategies cut across climate, criteria, and community health goals?
• What are strategies for reaching 2032 NOx, 2050 GHG goals?
Mobile Technology
• What are benefits of potential HDV & Off-Rd NOx policies?
• What scale of electrification in varying mobile sectors?
Fuels
• What scale of biofuel carbon intensity reduction is needed?
Activity Change
• What are the benefits of VMT reductions beyond SB 375?
• Are there efficiency improvements across freight modes?
8

MODEL STRUCTURE
9

SCENARIO TOOL FRAMEWORK
10
2010 2050
Vehicle Sales by Tech Type
2010 2050
New Vehicle Efficiency, Tech Type
+
2010 2050
Vehicle Fleet Model
Energy Demand
2010 2050
Fuel Blends
2010 2050
2010 2050
Electricity Mix
Hydrogen Mix
2010 2050
Emission Factor Tables
Vehicle Emissions (TTW)
Upstream Emissions (WTT)
2010 2050
Vehicle Activity by Class
+

• Passenger vehicles
• Heavy-duty vehicles
• Rail (freight, passenger)
• Aviation
• Ocean going vessels (in-development)
• Cargo handling equipment
• Commercial harbor craft
• Construction equipment
• Other off-road vehicles
SECTORS IN VISION 2.0
11
• Industry, including fuel production activities
• Residential and commercial buildings
• Non-energy sectors: waste, agriculture, etc (in development)
Mobile Sectors Included
Stationary Sectors Included

UNIQUE VALUE OF
TRANSPORTATION MODELS (1)
12
• Rigorous match to existing ARB policies & inventories
• Captures nuances of regulations (e.g. ACC, LCFS), including
regulatory metrics, credits, compliance projections, etc
• Captures newest official emissions inventories
• Detailed mobile sector disaggregation by vehicle class
• To inform specific mobile sector rules, plans
• Allows detailed assumptions of technology by vehicle class

UNIQUE VALUE OF
TRANSPORTATION MODELS (2)
13
• Incorporates multiple pollutants
• CO2e, NOx, PM2.5, VOC/ROG
• Well-to-tank (WTT) criteria emission factors for CA facilities
(in-state controlled stationary sources)
• AB 32 GHG emissions accounting boundary (portions of
upstream fuel production occurring in-state)
• Detailed spatial resolution; Data for ozone simulations
• State, air basins, counties, census block

DEVELOPING SCENARIOS
14

DEVELOPING SCENARIOS:
SCENARIO FRAMEWORK
• Modeled years: 2010 – 2050
• Multi-sector tradeoffs
• Study buildings and non-energy sectors to identify
their potential for emission reductions
• Which strategies are appropriate for specific veh sectors
• Scenarios
• Baseline – all existing major policies and rules
• Open-ended – extensions of existing policies
• Top-down – aggressive tech, fuels, activity assumptions
• Top-down – accelerated strategies 15

DEVELOPING SCENARIOS:
IDENTIFYING INPUTS
• Leverage ARB Technology Assessment
• Mobile sector technology readiness, market
• Other agency assessments: CEC, U.S. DOE, U.S. EPA
• External research and data
• Academia, National Academies, CCST, National Labs
• Industry data where publicly available
• Evaluating strategy aggressiveness across sectors
16
BASELINE SCENARIO: MAJOR
POLICIES INCORPORATED
• Mobile:
• EMFAC 2014 inventory updates (LDV & HDV)
• LDV: LEV/ZEV (Advanced Clean Cars) & SB 375
• HDV: Phase 1 GHG, 2010 NOx Std and Truck/Bus rule
• Rail: Updated rail inventory and 1998 Rail MOU
• Fuels:
• LCFS: Assumes 2020 ARB compliance scenario
• Grid: RPS 33% renewables by 2020
• Hydrogen: SB 1505 33% renewables, expected by 2020
• Biomethane: Landfill methane & waste diversion for biogas
17

RESULTS: BASELINE
= AB 32 Requirement = CA Executive Order 2050 climate target
= SCAB 2023 NOx target, 80% below 2010 = SCAB 2032 NOx target, 90% below 2010
Sectors included are transportation, fuel production, and buildings
18 Note: WTW = well-to-wheel; TTW = tank-to-wheel (vehicle emissions); SCAB = South Coast Air Basin

DESCRIPTION OF SECTOR
MODULES
19

PASSENGER VEHICLES
20

GOALS
• For calendar years 2010-2050, overlay
existing passenger vehicle inventory with
any mix of:
• Technology (defined by the user, not the model)
• Population or VMT changes
• Maintain as much specificity as possible
• Flexibility to run baseline, incentive, turnover
scenarios with any population, VMT, or
technologies
21

DATA SOURCES
• EMFAC2014 – July 2014 draft version
• Base Populations
• Emission Rates/Fuel Consumption Rates
• Accrual and Trip Rates
• Sales and Attrition Rates
• Growth Rates
• EMFAC2014 reflects all adopted policies for passenger vehicles such as Advanced Clean Cars (ACC)
22

MODEL FUNCTIONALITY
• Works within EMFAC structure, with user defined
segments of the population
• For certain population segments, user may define:
• New Sales Fractions
• VMT/trips
• Survival curves
• Emission rates & fuel economy
23

VEHICLE SPECIFICITY
• Vehicle types
• LD Auto, LT1, LT2, MDV (up to 8,500 GVWR)
• Urban and school buses
• Combustion
• Gasoline, ethanol
• Diesel
• Natural gas
• Advanced Technologies –
• Battery electric vehicle (BEV)
• Fuel cell vehicle (FCV)
• Plug-in hybrid electric vehicle (PHEV) 24

GEOGRAPHIC DOMAIN SPECIFICITY
25

POLLUTANTS & PROCESS SPECIFICITY
Fuel/Pollutant Process VISION Pollutant_ProcessStarting Fuel/Energy Starting
Idle
Running
Starting Exhaust NOx Starting Exhaust
Idle Exhaust
Running Exhaust
Starting Exhaust PM2.5 Starting Exhaust
Idle Exhaust
Running Exhaust
PM Tire Wear
PM Brake Wear
Starting Exhaust ROG Starting Exhaust
Idle Exhaust
Running Exhaust
Hot Soak
Running Loss
Resting Loss
Diurnal LossROG Resting Loss
PM2.5
PM2.5 Running Exhaust
PM BW_TW
ROG/VOC
ROG Running Exhaust
ROG Running Loss
Fuel/Energy
Consumption Fuel/Energy Running
NOxNOx Running Exhaust
26

ASSIGNING ASSUMPTIONS TO
TECHNOLOGIES NOT CURRENTLY IN
EMFAC
• Assumptions required for characteristics of
alternative vehicle technologies not included in the
EMFAC model:
• Attrition rates
• Accrual and trip rates
• Emission factors/fuel consumption rates
• Deterioration rates
• eVMT split for PHEVs
• Current approach: match to conventional
technologies in EMFAC based on similarities in
engine, vehicle type and regional characteristics
27

POPULATION PROFILE OUTPUT
Statewide Passenger Vehicle Population Profile – Baseline Scenario
28

DAILY SCAB NOX:
LDV+MDV+BUSES
29 Note: tpd = tons NOx per day

HEAVY DUTY VEHICLES
30

GOALS
• Heavy duty module focuses on freight vehicles over
8,500 lbs
• Overlay existing heavy duty inventory with any mix of:
• Technology (defined by the user, not the model)
• Population or VMT changes
• Maintain as much specificity as possible
• Flexibility to run baseline, incentive, turnover scenarios
with any population, VMT, or technologies
31

DATA SOURCES
• EMFAC2014 – July 2014 draft version
• Base Population
• Emission Rates
• Accrual and Trip Rates
• Sales and Attrition Rates
• Growth
• EMFAC2014 reflects all adopted policies for
heavy duty vehicles including the Truck and Bus
Rule and Phase I
32

MODEL FUNCTIONALITY
• Works within EMFAC structure, with user defined
segments of the population
• For population segments, user may define:
• Population changes
• Survival curve and purchasing
• VMT
• Emission rates & fuel economy
33

TRUCK MODEL SPECIFICITY
• Truck classification 2b to 8 (8,501+ GVWR)
• EMFAC categories: LHDT1, LHDT2, MHDT, HHDT
• Technology
• Any (engine, body, drivetrain, roadway, fuel/energy)
• Truck Type
• Any LH/MH and HD, down to EMFAC detail level
• Location
• Any (national, state, air basin, county, corridor)
• Scenario
• Any (natural turnover, accelerated turnover, state rules, local rules, incentives, mode shifts, varying growth)
34

LEVEL OF DETAIL
Multiply by 7 Vision Regions or 69 COABDIS Regions, 20+Model years, and 40+ Years
diurn_hc diurn_rog diurn_tog hotsoak_hc
hotsoak_rog hotsoak_tog idlex_ch4 idlex_co
idlex_co2 idlex_hc idlex_nox idlex_pm
idlex_pm10 idlex_pm2_5 idlex_rog idlex_tog
pmbw_pm pmbw_pm10 pmbw_pm2_5 pmtw_pm
pmtw_pm10 pmtw_pm2_5 restloss_hc asrestloss_rog
restloss_tog runex_ch4 runex_co runex_co2
runex_hc runex_nox runex_pm runex_pm10
runex_pm2_5 runex_rog runex_tog runloss_hc
runloss_rog runloss_tog strex_ch4 strex_co
strex_co2 strex_hc strex_nox strex_pm
strex_pm10 strex_pm2_5 strex_rog strex_tog
T6 Ag
T6 CAIRP heavy
T6 CAIRP small
T6 instate construction heavy
T6 instate construction small
T6 instate heavy
T6 instate small
T6 OOS heavy
T6 OOS small
T6 Public
T6 utility
T7 Ag
T7 CAIRP
T7 CAIRP construction
T7 NNOOS
T7 NOOS
T7 other port
T7 POAK
T7 POLA
T7 Public
T7 Single
T7 single construction
T7 SWCV
T7 tractor
T7 tractor construction
T7 utility
35

TECHNOLOGY FUNCTIONS
Technologies can be introduced as:
1. Federal standards
• All truck purchases including migration
2. State or local standards
• Portion of new sales but no migration
3. Background survival and use rates
• Activity and retirement set at same rate as truck
fleet
4. Unique to technology
• Activity and retirement set specific to technology
36

PURCHASING AND TURNOVER
• Purchasing and turnover functions derived from
EMFAC data, specific to:
• Truck type
• Fuel
• Vision region
• Can input scenarios with rules and accelerated attrition
• Scenarios prior to 2023 require truck rule interaction
37

EXAMPLE OUTPUT
• Fleet average emission factors, technology
mixes, emission reductions vs goals, etc
• Input factors, sales percent, additional
purchases, etc
• These are preliminary results, will evolve as new
scenarios are developed
38

DAILY POPULATION
0
500,000
1,000,000
1,500,000
2,000,000
2,500,000
2010 2015 2020 2025 2030 2035 2040 2045 2050
Po
pu
lati
on
(d
aily)
Port Trucks
Class 8
Class 7
Class 4-6
Class 3
Class 2b
39

DAILY VMT
0
20,000,000
40,000,000
60,000,000
80,000,000
100,000,000
120,000,000
140,000,000
2010 2015 2020 2025 2030 2035 2040 2045 2050
VM
T (
daily) Port Trucks
Class 8
Class 7
Class 4-6
Class 3
Class 2b
40

DAILY NOX
0
50
100
150
200
250
300
350
400
2020 2025 2030 2035 2040 2045 2050
NO
x (
tpd
, su
mm
er)
Class 2b
Class 3
Class 4-6
Class 7
Class 8
Port Trucks
41

POPULATION SEGMENTS
42

ENERGY SECTOR MODULE &
EMISSION FACTORS
43

ENERGY MODULE OVERVIEW
44

ENERGY MODULE PURPOSE
• Aggregated energy consumption and multi-pollutant
emissions associated with fuel demand
• Emission factors
• “Well To Tank” (WTT) for Criteria Emissions
• WTT+TTW for GHG Emissions – AB32 boundary
• Full “Well to Wheel” for GHG – LCFS compliance
• Energy consumed
• Finished fuels (gasoline, diesel, NG, LNG, H2, Elec)
• Including renewable fuels
• Feedstock resources (e.g. oil, corn, etc)
45

CA-specific facility criteria emissions
WELL-TO-WHEEL DESCRIPTION
46

ENERGY MODULE POTENTIAL
Policies to consider
• GHG and petroleum reduction targets
• LCFS variations
• Renewable Portfolio Standard (RPS) variations
• SB1505 – Renewable Hydrogen
• EO S-06-06 – In-state biomass supply
Strategies
• Carbon Intensity (CI) for advanced biofuels
• Biomass feedstock competition for biofuels and biopower
• Spatial location of upstream emissions and facilities
• Methane leakage sensitivity
47

ENERGY MODULE MECHANICS
• End-use Sector Demands are aggregated into “fuel
bundles”
• Benefits of low CI fuels are equally distributed across all end-use
sectors
• Emission Factors
• Multiplied by demand to produce emissions associated with
fuel/energy production
• Blending/Supply
• Allows an arbitrary blend (eg 9.7% EtOH)
• Module can optimize blends to fully utilize low CI supplies
• Supply mix choices for electricity and hydrogen production
• Ensures supply capacities are not exceeded
48

Mobile Sources
• Passenger vehicles
• Heavy-duty vehicles (on-road)
• Freight locomotives
• Aviation
• Off-road Sectors
Stationary Sources
• Residential and commercial
buildings
Diesel
• Ultra Low Sulfur Diesel
• Soy Oil Bio-Diesel
• Advanced Bio-Diesel
• Renewable Diesel
Gasoline
• CA RBOB
• Corn Ethanol
• Advanced Ethanol
• Renewable Gasoline
Jet Fuel
• Kerosene Jet Fuel
• Renewable Jet Fuel
Natural Gas
• Fossil Natural Gas
• Dairy Digester Gas
• Landfill Gas
• Renewable Natural Gas
Hydrogen
• Central NG Reformed H2
• Distributed NG Reformed H2
• Bio- H2
• Central Solar H2
• Central Wind H2
Electricity
• Coal Generated Power
• Biomass Generated Power
• Geothermal Generated Power
• Large Hydro Generated Power
• Natural Gas Generated Power
• Nuclear Generated Power
• Small Hydro Generated Power
• Solar Generated Power
• Wind Generated Power
Demand Sectors Blendstocks potentially consumed to meet demand
VISION 2.0 DEMAND TO SUPPLY
49

WELL-TO-TANK EMISSION FACTORS:
UPSTREAM FUEL PRODUCTION
CA-specific statewide averages for upstream fuel production (g/mmbtu)
• Criteria pollutant EFs using:
• CA-specific facility emissions (ARB criteria pollutant emission inventory)
• CA-specific fuel production throughputs/capacities (CEC, DOGGR, DOE)
• GREET 2013 national averages for non-facility indirect processes
• GHG EFs using:
• CA GHG emissions Inventory
• CA-specific fuel production throughputs/capacities (CEC, DOGGR, DOE)
• Fuels currently not produced in CA:
• Default GREET national average emission factors
• Scaled using emission factor differences between an average CA refinery vs. a national refinery (conventional fuel production )
50

CRITERIA POLLUTANT EMISSIONS:
BOUNDARY CONSIDERATIONS
• CA-Global: Reflects CA-specific facility emissions for fraction of fuel production in-state
• Direct (on-site) emission factors from GREET substituted with CA-specific data
• Indirect (upstream) emission factors from GREET 2013
• CA-State: CA-Global emission factors constrained to state boundary
• Fuel production activities in-state and within 100 nautical miles of state border
51

WTT NOX EMISSION FACTORS:
SPATIAL BOUNDARY EFFECTS
52

WTT NOX EMISSION FACTORS:
SPATIAL BOUNDARY EFFECTS
CA-specific emission
factors 70-80% lower than
national averages
53

BASELINE RESULTS
54 Note: quad = quadrillion BTUs

BASELINE FUEL BLENDING
0%
20%
40%
60%
80%
100%
2010 2020 2030 2040 2050
DieselB
lend
0%
20%
40%
60%
80%
100%
2010 2020 2030 2040 2050
GasBlend
0%
20%
40%
60%
80%
100%
2010 2020 2030 2040 2050
JetBlend
Ba
seli
ne Gasoline Jet Diesel
0%
20%
40%
60%
80%
100%
2010 2020 2030 2040 2050
DieselB
lend
Biodiesel
RenewableDiesel
CaliforniaproducedULSD
0%
20%
40%
60%
80%
100%
2010 2020 2030 2040 2050
GasBlend
AlchoholBundle
RenewableGasolineBundle
CaliforniaproducedCARBOBFuel
0%
20%
40%
60%
80%
100%
201020152020202520302035204020452050
NGBlend
Baseline
CaliforniaproducedNG USproducedNG RenewableNG
Natural Gas Hydrogen
55

BASELINE ELECTRICITY
GENERATION MIX
56
Baselin
e
CA Mix
0%
20%
40%
60%
80%
100%
2010 2020 2030 2040 2050
0%
20%
40%
60%
80%
100%
2010 2020 2030 2040 2050
0%
20%
40%
60%
80%
100%
2010 2020 2030 2040 2050
US Mix Renewables
Mix
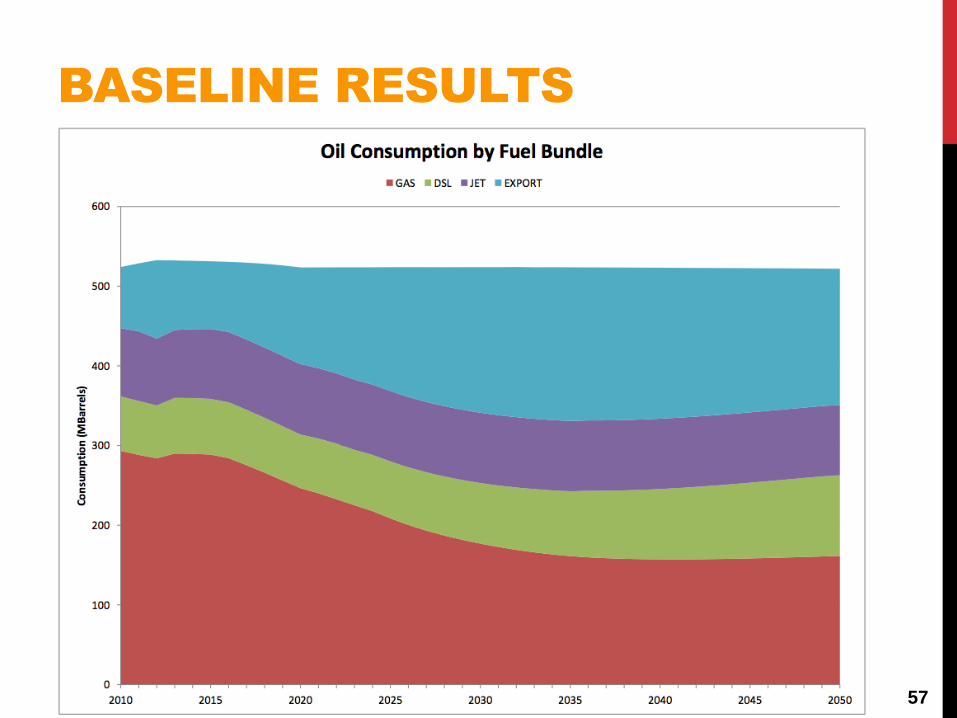
BASELINE RESULTS
57

BASELINE RESULTS
58

BASELINE RESULTS
59

FREIGHT RAIL
60

DATA SOURCES
• Updated locomotive inventory
• Summarized in prior workshop presentation: http://www.arb.ca.gov/msei/goods_movement_emission_in
ventory_line_haul_octworkshop_v3.pdf
• Inventory reflects all adopted policies including
1998 South Coast MOU
61

USER INPUT
Parameters
• Technology
• Fuel Efficiency
• Tier Distribution/Penetration
• Fuel Sulfur Content
• Activity
• Speed Changes
62

ADVANCED TECHNOLOGY
• Baseline model assumes 100% diesel and
impact of 1998 MOU, South Coast/spillover
• User can select penetration of advanced
technology by air basin, calendar year
• Technology – e.g. combustion, battery electric,
catenary, fuel cell, natural gas
• Technology Performance – e.g. Tier 4, Tier 4 +
aftertreatment, zero-emission tailpipe
63

OTHER SCENARIO OPTIONS
Corridor-specific fuel reduction cases
• “Accelerated turnover”
• Congestion reduction (at-grade right of way)
• Weight/drag reduction
• Other efficiency improvements
64

PASSENGER RAIL
65

PASSENGER RAIL
• Utilizes Official ARB Inventory
• Module Input Variables
• Fleet efficiency
• Activity
• Fuel switching
• Emissions Tier distribution
• Future Years
• Forecasted Locomotive Population
• Output results
• GHG, Criteria Pollutants, total fuel usage
• High Speed Rail (HSR)
• Based on HSR Authority 2012 High Speed Rail Plan
• Determines VMT and air trip reductions
66

ASSUMPTIONS
• Baseline
• Passenger rail activity demand matched to Caltrans
CTP 2040
• Fuel Efficiency flat-lined
• High Speed Rail (HSR) not included in baseline
• Future scenario can include HSR
• HSR Authority data and build-out scenario
• Reduces Intrastate aviation trips
• Reduces LDV VMT statewide
67

EXAMPLE HSR AUTHORITY DATA
~1.4% of 2030
LDV VMT
Removed by HSR
~12% of 2030
intrastate flights
Removed by HSR
68

AVIATION
69

AVIATION DATA APPROACH
• Goals for this module
• Split out emissions from taxi mode
• Split out freight activity from commercial
• Study entire aviation sector fuel demand for biofuel strategies
• Bottom-up trip aggregation approach (2000 – 2012)
• Data Sources
• Aircraft flight data - RITA BTS (2000 – 2012)
• Includes all flights, all airports, distances, etc
• Fuel sales - EIA data for California (2000 - 2012)
• Aircraft emissions and fuel efficiency
• ESAS ICAO emissions data bank (2013)
70

AVIATION MODULE
• Module detail
• Flight identification
• Year
• Destination (intrastate, interstate, international)
• Flight type (passenger, freight, mixed, mail)
• Flight mode
• LTO – “Landing & Take-off” (below 3,000 ft)
• CCD – “Climb, Cruise & Descent” (above 3,000 ft)
• Input variables
• Freight movement, passenger growth, taxi-bot, FE / yr, additional criteria reductions
• Output results
• Emissions - GHG, Criteria Pollutants
• Fuel demand 71
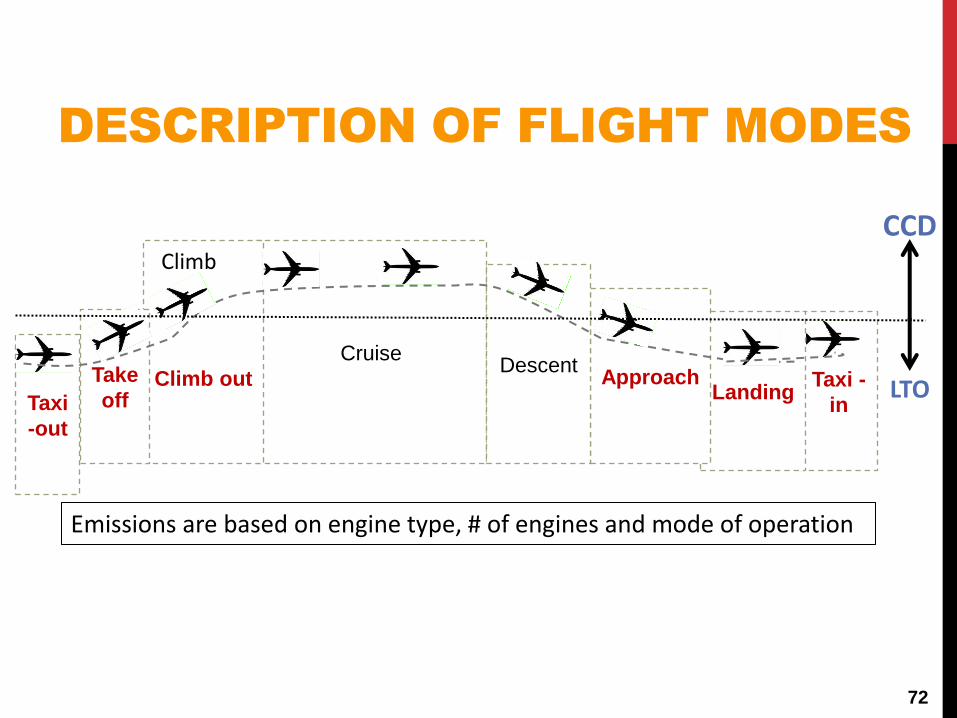
Emissions are based on engine type, # of engines and mode of operation
DESCRIPTION OF FLIGHT MODES
Taxi -
in
Cruise
Landing Approach
Descent
Climb out Take
off Taxi
-out
CCD
LTO
Climb
72

STATEWIDE AIRCRAFT NOX
73

STATEWIDE AVIATION GHG
74

BUILDING MODULES
75

BUILDING ENERGY DEMAND
VISION 2.0 BLDG MODULE
COMMERCIAL RESIDENTIAL
BLDG-FUNCTION
Colleges Food stores Hospitals Hotel/Motel/Lodging Large Offices Miscellaneous Refri. Warehouses Restaurants Retail stores Schools Small Offices Warehouses
SERVICE-TYPE
Miscellaneous Cooking Cooling Heating Indoor Lighting Office Equipment Outdoor Lighting Refrigeration Ventilation Water Heating
SERVICE-TYPE
Cooking Cooling Miscellaneous Water Heating Space Heating
SECTOR METRICS FOR STOCK INVENTORY
HOUSING UNIT
[Existing, Demo, New, Retro]
FLOORSPACE
[Existing, Demo, New, Retro]
76

RESIDENTIAL BLDG ENERGY DEMAND
STRUCTURE
Population Projection (DOF)
Stock Turn Over HUs - Existing Stock - New Construction - Demolition - Retrofit (to be added)
- Vacancy
Spatial Element
Climate Zone Assignment
Historical HU Estimation ( US Census)
Vacancy Rate (Census)
Historical Energy Demand per HU (CEC)
Efficiency Improvements
Fuel Switching from NG to Electricity
Stock Turn Over Variations
BASELINE STOCK PROJECTION SCENARIO CHOICES RESULTS
Future Energy Demand
On-site Criteria Emissions
METHODOLOGY
- Historical Energy Demand - Population Projection - Historical HU Amount and
Distribution - End Use Appliances Distribution
- HU Projection (building stock) - Energy Demand per Building Type - Criteria Emission Estimation
- Vacancy Rate - Demolition Rate - Retrofit Rate - End Use Appliance Efficiency - ZNE - End Use Appliance Demand
Distribution
FIXED PARAMETER VARIABLE INPUT PARAMETER OUTPUT
77 Note: HU = housing unit

COMMERCIAL BLDG ENERGY DEMAND
STRUCTURE
BASELINE STOCK PROJECTION SCENARIO CHOICES RESULTS
Commercial Floorspace Projection (LBNL)
Floorspace per Bldg Function or Service - Existing Stock - New Floor Space - Demolition - Retrofit
Spatial Element
Climate Zone Assignment
Historical Energy Demand (CEC)
Historical Floorspace (LBNL)
Efficiency Improvements
Fuel Switching from NG to Electricity
Floorspace per Bldg Function or Bldg Service Variations
Future Energy Demand
On-site Criteria Emissions
METHODOLOGY
- Historical Energy Demand - Commercial Floorspace
Projection - End Use Appliances
Distribution
- Commercial Floorspace Projection - Energy Demand per Building Type - Criteria Emission Estimation
FIXED PARAMETER VARIABLE INPUT PARAMETER OUTPUT
- Vacancy Rate - Demolition Rate - Retrofit Rate - Floorspace Distribution - End Use Appliance Efficiency - ZNE - End Use Appliance Demand
Distribution
78

STATEWIDE ENERGY DEMAND
BY SERVICE TYPE
RESIDENTIAL
COMMERCIAL
79

RESIDENTIAL BLDG STOCK - STATEWIDE
Housing Unit (HU) Building Stock Baseline
80

VISION 2.0 NEXT STEPS
• Post model on public ARB website
• Develop scenarios for SIP and other programs
• Brief Board (fourth quarter 2015)
81