aqueous phase fluorescence quenching technique for measuring naphthalene partition coefficients in...
TRANSCRIPT

Environ. Sci. Techno/. 1995, 29, 1273-1278
Aqueous Phase Fluorescence Quenching Technique for Measuring Naphthalene Partition Coefficients in Nonionic Surfactant Micelles R O B E R T L . A U G E R , A N N E T T E M . J A C O B S O N , A N D M I C H A E L M . D O M A C H * Department of Chemical Engineering, Carnegie Mellon University, Pittsburgh, Pennsylvania 15213
A methodology is presented for determining the partition coefficients for polycyclic aromatic hydrocar- bons (PAHs) distributed between the aqueous and the micellar pseudophases of nonionic surfactant solu- tions. The methodology entails measuring total PAH fluorescence and then using varying copper sulfate concentrations to quench the fluorescence con- tribution from aqueous pseudophase PAH. Additionally, front-surface sample analysis and absorption cor- rections to counteract inner-filter effects were used to extend the PAH concentration range over which quenching can be used. The methodology was tested by determining the partitioning of a model PAH (naphthalene) when the nonionic surfactant, octaeth- ylene glycol mono-n-dodecyl ether ( C I ~ E ~ ) , was present. Because the aqueous pseudophase is probed, both saturated and unsaturated systems were examined. Thus, the partition measurements are less restricted than those provided by frequently used analyses that must assume the aqueous pseudophase is saturated in order to close the solubilizate mass balance. The value obtained at saturation with naph- thalene was in reasonable agreement with the parti- tion coefficient (log K , ) for naphthalene in a similar nonionic surfactant. Moreover, log Km increased from 4.47 a t saturation (0.64 m M naphthalene in 1.88 m M surfactant) to 5.03 at 0.057 m M naphthalene (also in 1.88 m M surfactant). In practice, the methodol- ogy may prove useful for characterizing partitioning behavior under the varied conditions found in the field, designing surfactant-enhanced biodegradation experiments, and ascertaining the effects of sur- factant solubilization on PAH biodegradation rate.
Introduction Polycyclic aromatic compounds are common environ- mental contaminants, many of which are suspected car- cinogens and mutagens (1). Polycyclic aromatic hydro- carbons (PAHs) are a subset of this class of compounds which have been demonstrated to be susceptible to biodegradation by soil microbes (2-12). However, PAHs tend to partition onto hydrophobic surfaces, thus limiting their bioavailability (5-12). Nonionic surfactants have proven to be effective for stripping sorbed PAHs from contaminated soils (12-16). In several laboratory inves- tigations, the addition of surfactant increased both the rate and the extent of degradation (6, 12, 17-21). However, counter examples have also been found where the presence of surfactant micelles inhibited degradation (6, 8, 12).
Although the results vary, surfactants are still viewed as being potentially useful for aiding the remediation of PAH- contaminated sites. At present, the inconsistent results indicate that the physical and biochemical picture we have of the interactions between the surfactant micelles, PAHs, soils, and microbes is incomplete. The view that micelles simply facilitate mass transfer to the aqueous pseudophase where biodegradation occurs may not be comprehensive enough to account for the range of behavior observed. Clarification of the nature of these interactions is required for optimal utilization of this emerging technology as well as advancing the understanding of microbial carbon source acquisition mechanisms.
One important physicochemical factor is the partitioning of PAH between the aqueous and micellar pseudophases. This information is vital to modeling and prediction of the biodegradation process, since it is likely that degradation rates will depend on aqueous PAH concentrations and quantities solubilized in the micelles (12). Many prior estimates of partition coefficients have been obtained from solubilization data by assuming or maintaining a saturated aqueous pseudophase concentration to close the mass balance (13-16). To extend the measurement of partition- ing over a greater range of aqueous pseudophase PAH concentration as well as to provide a potential means for studying the time-dependent concentration and distribu- tion of PAH during biodegradation, we have tested the utility of a fluorescence quenching methodology.
In this paper, we first present the theory underlying the quenching method. Also described is how inner-filter effects (the absorption of excitation and emitted light by fluorophores) can be minimized by employing front-surface detection and applying optical absorbance corrections to fluorescence intensity data. These strategies for limiting inner-filter effects extend the range over which fluorophore concentration and fluorescence emission intensity are linearly related and thus the working range of the quenching method. Results from experiments with three fluorophores are then shown that demonstrate the efficacy of the strategies used to minimize inner-fdter effects. Thereafter, quenching results from experiments with saturated and unsaturated naphthalene solutions containing the nonionic surfactant, octaethylene glycol mono-n-dodecyl ether are reported. The quenching experiments yielded reasonable
* Corresponding author e-mail address: [email protected]; telephone: 412-268-2246; F a 412-268-7139.
0013-936)(/95/0929-1273$09.00/0 0 1995 American Chemical Society VOL. 29, NO. 5, 1995 /ENVIRONMENTAL SCIENCE & TECHNOLOGY * 1273
values of aqueous pseudophase naphthalene concentra- tions and pseudophase partition coefficients.
Naphthalene was investigated because it is an aquifer contaminant (22-24) and is frequently used as a repre- sentative PAH in degradation studies (24,25). The choice of using anonionic surfactant was based on their extensive use in bioremediation experiments (6,8,12-15). Nonionic surfactants are often used because unlike ionic surfactants, they adsorb less extensively onto mineral regions of soil particles, display lower sensitivity to water hardness, are less toxic, and are more susceptible to removal from the environment by biodegradation (26). The octaethylene glycol mono-n-dodecyl ether (CEE~) surfactant used is a member of a broad class of alkyl polyoxyethylene diblock copolymer surfactants (POE types), and unlike Triton surfactants (or other alkylphenol POE types) it does not contain a benzene moiety. Thus, the naphthalene- surfactant system examined is of interest to a wide range of investigators.
Quenching Theory PAHs are fluorescent species susceptible to quenching by copper(I1) (as copper sulfate) (8,27,28). Provided the PAH present in the micelle is not susceptible to quenching, selectively quenching the aqueous pseudophase compo- nent provides an opportunity to directly measure the partitioning between the micellar and aqueous pseudo- phases. While this approach exploits the utility of quench- ing, it differs from many prior applications in that the aqueous pseudophase PAH, as opposed to sequestered PAH, is quenched. An example of the latter is using PAH quenching upon binding to humic materials to determine association equilibrium constants (29).
For this application, the total fluorescence intensity is taken to be the sum of the contributions of the species in each pseudophase:
where Imic and Zaq are the contributions from naphthalene in the micellar and aqueous pseudophases respectively. A similar relationship exists in the presence of the quencher:
where the subscript q denotes the presence of quencher. The functional form of the aqueous pseudophase
quenching can be expressed as
(3)
where f(Q) is a function of quencher concentration that depends upon the specific quenching mechanism involved.
Assuming that the naphthalene present in the micelle is "protected" from aqueous pseudophase quenchers, the fluorescence contribution from the micellar pseudophase is not altered by the addition of quencher:
(4)
Substituting eqs 3 and 4 into eq 2 and dividing through by the unquenched total fluorescence intensity gives
(5)
From eq 5 we can define the following terms:
where MandA refer to the fraction of the total naphthalene present in the micellar and aqueous pseudophases, re- spectively. Substituting these definitions into eq 5 gives the final form of the equation to be used:
(7)
Equation 7 predicts that a plot of Zqt,,dlZtot~ versus l$(Q), obtained by measuring fluorescence intensity while varying the quencher concentration, yields a straight h e . From the slope and intercept, values of MandA can be obtained. Because the total amount of naphthalene present is known, the concentrations in each pseudophase can readily be obtained from a simple mass balance. Converting to mole fractions allows for the determination of the partition coefficient between the micellar and the aqueous pseudophases (13-15).
Some assumptions were made in the above derivation that could limit the utility of the quenching technique. The most significant is the condition that naphthalene present in the micellar pseudophase is not susceptible to quenching. Two factors suggest that this assumption is reasonable. First, the excited-state lifetime is on the order of nano- seconds (417 ns; 30) and the micelle-to-aqueous pseudo- phase transfer rate is on the order of microseconds (micelle residence times around 8 ps; 27, 31). Therefore, the naphthalene in the micelle will likelyemit before contacting the quencher present in the aqueous pseudophase. Sec- ondly, we have observed that negligible copper quenching occurs when the surfactant concentration was elevated to the point of virtually eliminating naphthalene from the aqueous pseudophase. Thus, it appears that the micellized naphthalene is "protected" from quenching.
Another important condition is that fluorescence in- tensity must be linear in concentration. In general, fluorescence intensity varies linearly with concentration only over a small range of very dilute concentrations before nonlinearity caused by inner-filter effects becomes sig- nificant. To increase the linear regime, two steps can be taken. First, front-surface detection can be used in place of the standard right-angle orientation. This detection mode has been demonstrated to extend the linear regime to higher concentrations (32, 33).
Secondly, light absorbance by the sample can be accounted for by correcting the measured signal by the transmittance at the excitation and emission wavelengths (33) :
I -1 I -1 'corrected - - Imeasured( ID).. ( ID)em
OK
Icorrected - - 'measured antilog(Abex (8b)
1274 ENVIRONMENTAL SCIENCE & TECHNOLOGY / VOL. 29, NO. 5, 1995

In eq 8b, Ab,, and Ab,, are the measured absorbances (10 mm path length) at the excitation and emission wave- lengths, and n is a geometric parameter representing the ratio of the path length used in the U V absorbance measurements to the effective path length sampled in the fluorescence measurement. In principle, n is only de- pendent on the geometry of the apparatus and is inde- pendent of the species being observed. For the right-angle orientation, the value for n is 2. For front-surface detection, this parameter was determined empirically. The extent that using front-surface detection and intensity correction extend the linearity of the fluorescence signal with con- centration will determine an upper bound for the naph- thalene concentrations to which this technique can be applied.
A further assumption is that the fluorescence emission intensity and the absorbance extinction coefficient of the PAH in the presence of surfactant micelles are not significantly different from the values measured in the aqueous phase. It was experimentally verified that the changes in either of these quantities was negligible over the range of wavelengths used. This is consistent with findings concerning the effect of solvent on extinction coefficients of PAHs such as phenanthrene, pyrene, and biphenyl (34).
Materials and Methods Solutions were prepared with Fisher HPLC-grade water. The nonionic surfactant octaethylene glycol mono-n- dodecyl ether (polyethylene oxide block copolymer “Cl2EB” 99.9+% purity, cmc = 0.071 mM) was purchased from Nikkol Chemical (BL-8SY). Naphthalene (B.D.H. Micro- Analytical Reagents 99+% purity) was chosen as a model PAH for this study. Triton X-100 (Aldrich), L-tryptophan (Sigma), and cupric sulfate (CuSO4*5H20, Fisher Scientific, 98.2%) were used without further purification.
Fluorescence measurements were performed with a Perkins-Elmer LS-5B fluorescence spectrometer fitted with afront-surface accessory (part5212-3130). Aquartzcuvette (10 mm path length) was used in the front-surface orienta- tion. Fluorescence measurements were zeroed to a closed excitation shutter. The excitation slit width was set at 10 nm while the emission slit width was set at 3 nm. The excitation monochromator was set at a fixed wavelength, and the emission maximum was monitored over the peak emission band. The excitation and emission wavelengths employed are as follows: naphthalene, 240 (excitation) and 310-350 nm (emission); tryptophan, 280 and 330-370 nm; Triton X-100, 240 and 280-320 nm.
Absorbance measurements were obtained using a Hewlett-Packard 8451A diode array spectrophotometer. Samples were placed in a 10-mm silica spectrophotometer cell and referenced to pure water. Naphthalene concen- trations were measured spectrophotometrically at 275 nm using an extinction coefficient of 4.61 x lo3 M-’ cm-’ (6). In cases where copper sulfate was present, the contribution of copper to the absorbance at 275 nm was subtracted from the measured values in order to obtain accurate naphtha- lene concentrations. The additivity of absorbances was established.
Saturated naphthalene solutions were obtained by heating the solutions to the melting point of naphthalene (80-82 “C), followed by a 3-day equilibration period at room temperature (maintained at 25 f 1 “C). Excess solid naphthalene was removed by filtering through a 0.2-pm
200 x Y .” M
5 150 - I C e, g 100 D e! 9 50 E
0 0.00 0.20 0.40 0.60 0.80 1.00 1.20
Naphthalene Concentration (mM)
0.0 0.1 0.2 0.3 0.4 0.5 0.6 0.7 0.8 Tryptophan Concentration (mM)
0.0 1.0 2.0 3.0 4.0 5.0 6.0 Triton X- 100 Concentration (mM)
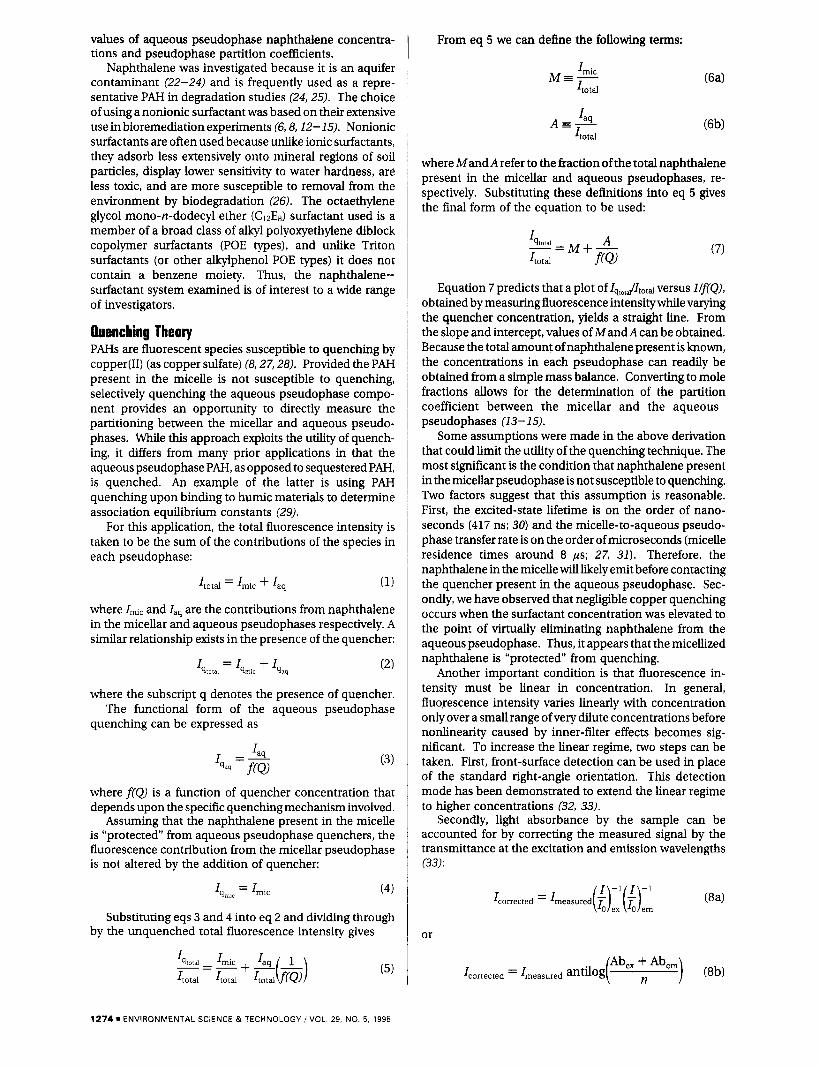
FIGURE 1. Fluorescence intensity at emission maximum measured in the front-surface orientation. Inner-filter effects cause a nonlinear response at fairly low concentrations of (a) naphthalene, (b) tryptophan, and (c) Triton X-100. Correcting for inner-filter effects using absorbances at excitation and emission wavelengths increases the range of linear response. Symbols: 0 and 0 denote measured and corrected values, respectively.
PTFE filter. Due to the volatility of naphthalene, unsatur- ated solution concentrations were obtained from absor- bance measurements rather than from the mass of naph- thalene initially added.
Results and Discussion Inner-Filter Corrections. Figure la shows the relative fluorescence intensity for naphthalene as a function of naphthalene concentration. Surfactant (C12E8) was added as needed to obtain values above the aqueous solubility limit of naphthalene (0.25 mM; 15). It is seen that even though the front-surface orientation was employed, inner- filter effects caused a nonlinear response at fairly low naphthalene concentrations. To find the parameter n in eq 8b, the data was regressed using a nonlinear least squares technique. A value of 5.35 for n was obtained.
Also shown in Figure l a are the “corrected” intensities using n = 5.35. Using eq 8b extends the range of total
VOL. 29, NO. 5. 1995 / ENVIRONMENTAL SCIENCE &TECHNOLOGY 1 1275
n . . . l . . . l . . l l . . . I . . . . . . .
0 2 4 6 8 10 12 Copper Sulfate Concentration (mM)
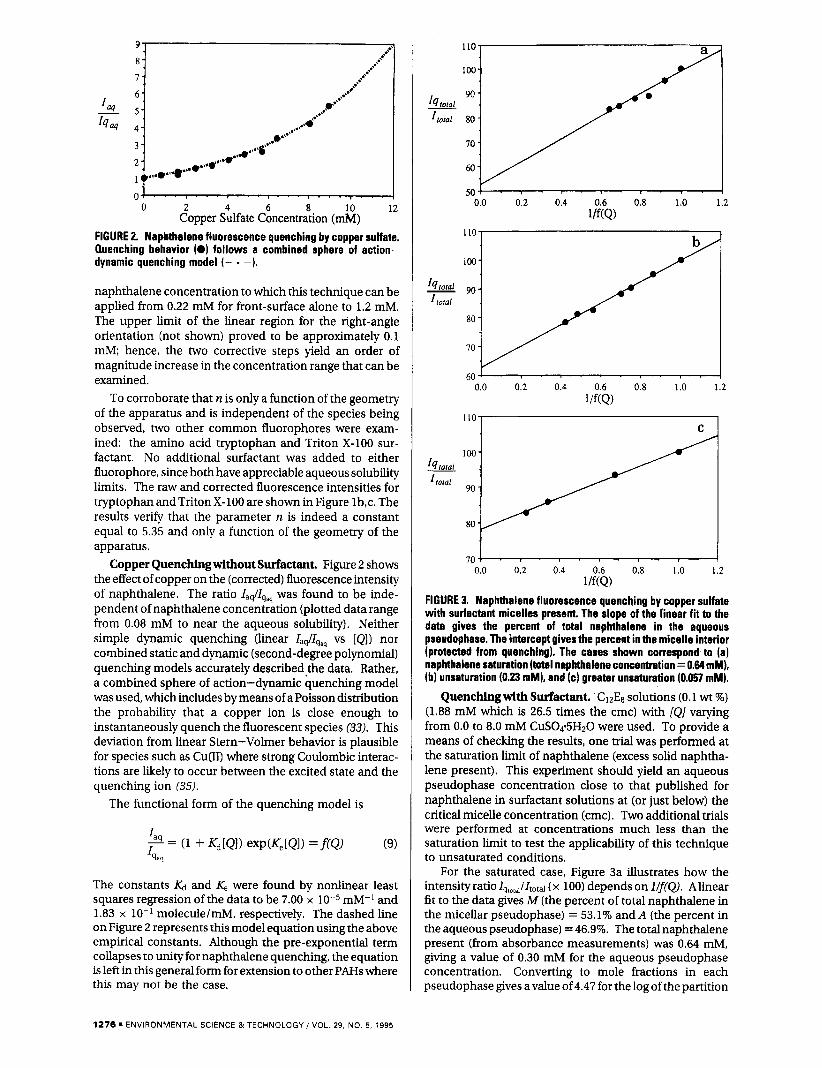
FIGURE 2. Naphthalene fluorescence quenching by copper sulfate. Quenching behavior (0) follows a combined sphere of action- dynamic quenching model (- - -).
naphthalene concentration to which this technique can be applied from 0.22 mM for front-surface alone to 1.2 mM. The upper limit of the linear region for the right-angle orientation (not shown) proved to be approximately 0.1 mM; hence, the two corrective steps yield an order of magnitude increase in the concentration range that can be examined.
To corroborate that n is ody a function of the geometry of the apparatus and is independent of the species being observed, two other common fluorophores were exam- ined: the amino acid tryptophan and Triton X-100 sur- factant. No additional surfactant was added to either fluorophore, since both have appreciable aqueous solubility limits. The raw and corrected fluorescence intensities for tryptophan and TritonX-100 are shown in Figure lb,c. The results verify that the parameter n is indeed a constant equal to 5.35 and only a function of the geometry of the apparatus.
Copper Quenchingwithout Surfactant. Figure 2 shows the effect of copper on the (corrected) fluorescence intensity of naphthalene. The ratio Iaq/Zqaq was found to be inde- pendent of naphthalene concentration (plotted data range from 0.08 mM to near the aqueous solubility). Neither simple dynamic quenching (linear Ias/Iq,, vs [QI) nor combined static and dynamic (second-degree polynomial) quenching models accurately described-the data. Rather, a combined sphere of action-dynamic quenching model was used, which includes by means of a Poisson distribution the probability that a copper ion is close enough to instantaneously quench the fluorescent species (33). This deviation from linear Stern-Volmer behavior is plausible for species such as Cu(I1) where strong Coulombic interac- tions are likely to occur between the excited state and the quenching ion (35).
The functional form of the quenching model is
The constants Kd and K, were found by nonlinear least squares regression of the data to be 7.00 x mM-' and 1.83 x lo-' moleculelmM, respectively. The dashed line on Figure 2 represents this model equation usingthe above empirical constants. Although the pre-exponential term collapses to unity for naphthalene quenching, the equation is left in this general form for extension to other PAHs where this may not be the case.
0.0 0.2 0.4 0.6 0.8 1.0 1.2 1 /f(Q)
110 C
0.0 0.2 0.4 0.6 0.8 1.0 1.2 l/f(Q)
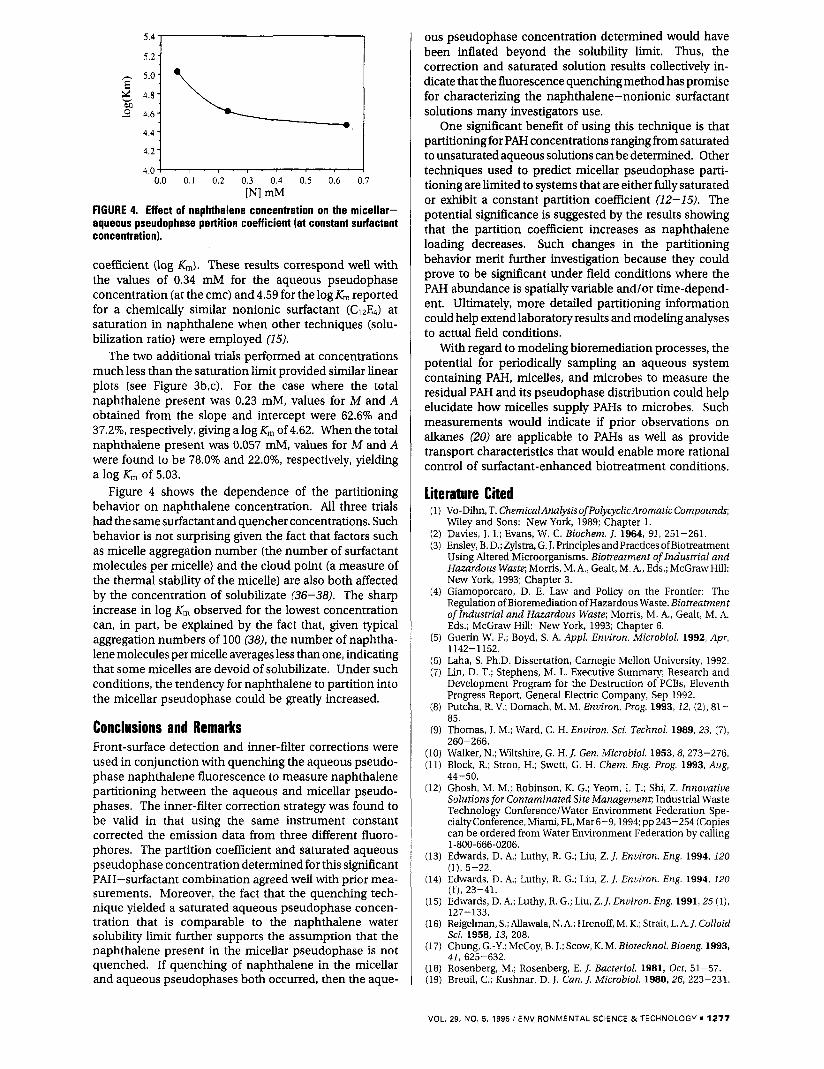
FIGURE 3. Naphthalene fluorescence quenching by copper sulfate with surfactant micelles present. The slope of the linear fit to the data gives the percent of total naphthalene in the aqueous pseudophase. The intercept gives the percent in the micelle interior (protected from quenching). The cases shown correspond to (a) naphthalene saturation (total naphthalene concentration = 0.64 mM), (b) unsaturation (0.23 mM), and (cl greater unsaturation (0.057 mM).
solutions (0.1 wt %) (1.88 mM which is 26.5 times the cmc) with [Q] varying from 0.0 to 8.0 mM CuS04.5H20 were used. To provide a means of checking the results, one trial was performed at the saturation limit of naphthalene (excess solid naphtha- lene present). This experiment should yield an aqueous pseudophase concentration close to that published for naphthalene in surfactant solutions at (or just below) the critical micelle concentration (cmc). Two additional trials were performed at concentrations much less than the saturation limit to test the applicability of this technique to unsaturated conditions.
For the saturated case, Figure 3a illustrates how the intensityratio Iq,,,,,/Itot~ (x 100) depends on l/f(Q). Alinear fit to the data gives M (the percent of total naphthalene in the micellar pseudophase) = 53.1% andA (the percent in the aqueous pseudophase) = 46.9%. The total naphthalene present (from absorbance measurements) was 0.64 mM, giving a value of 0.30 mM for the aqueous pseudophase concentration. Converting to mole fractions in each pseudophase gives a value of 4.47 for the log of the partition
Quenchingwith Surfactant.
1276 ENVIRONMENTAL SCIENCE &TECHNOLOGY / VOL. 29, NO. 5,1995
5.2 -I
4.2 1 4 . 0 1 . I 8 . I ' ' 7 ' I
0.0 0.1 0.2 0.3 0.4 0.5 0.6 0.7 [Nl mM
FIGURE 4. Effect of naphthalene concentration on the micellar- aqueous pseudophase partition coefficient (at constant surfactant concentration).
coefficient (log Km). These results correspond well with the values of 0.34 mM for the aqueous pseudophase concentration (at the cmc) and 4.59 for the log K, reported for a chemically similar nonionic surfactant (CI2E4) at saturation in naphthalene when other techniques (solu- bilization ratio) were employed (15).
The two additional trials performed at concentrations much less than the saturation limit provided similar linear plots (see Figure 3b,c). For the case where the total naphthalene present was 0.23 mM, values for A4 and A obtained from the slope and intercept were 62.6% and 37.2%, respectively, giving a log K, of 4.62. When the total naphthalene present was 0.057 mM, values for M and A were found to be 78.0% and 22.0%, respectively, yielding a log K, of 5.03.
Figure 4 shows the dependence of the partitioning behavior on naphthalene concentration. All three trials had the same surfactant and quencher concentrations. Such behavior is not surprising given the fact that factors such as micelle aggregation number (the number of surfactant molecules per micelle) and the cloud point (a measure of the thermal stability of the micelle) are also both affected by the concentration of solubilizate (36-38). The sharp increase in log Km observed for the lowest concentration can, in part, be explained by the fact that, given typical aggregation numbers of 100 (38), the number of naphtha- lene molecules per micelle averages less than one, indicating that some micelles are devoid of solubilizate. Under such conditions, the tendency for naphthalene to partition into the micellar pseudophase could be greatly increased.
Conclusions and Remarks Front-surface detection and inner-filter corrections were used in conjunction with quenching the aqueous pseudo- phase naphthalene fluorescence to measure naphthalene partitioning between the aqueous and micellar pseudo- phases. The inner-filter correction strategy was found to be valid in that using the same instrument constant corrected the emission data from three different fluoro- phores. The partition coefficient and saturated aqueous pseudophase concentration determined for this significant PAH-surfactant combination agreed well with prior mea- surements. Moreover, the fact that the quenching tech- nique yielded a saturated aqueous pseudophase concen- tration that is comparable to the naphthalene water solubility limit further supports the assumption that the naphthalene present in the micellar pseudophase is not quenched. If quenching of naphthalene in the micellar and aqueous pseudophases both occurred, then the aque-
ous pseudophase concentration determined would have been inflated beyond the solubility limit. Thus, the correction and saturated solution results collectively in- dicate that the fluorescence quenching method has promise for characterizing the naphthalene-nonionic surfactant solutions many investigators use.
One significant benefit of using this technique is that partitioning for PAH concentrations ranging from saturated to unsaturated aqueous solutions can be determined. Other techniques used to predict micellar pseudophase parti- tioning are limited to systems that are either fully saturated or exhibit a constant partition coefficient (12-15). The potential significance is suggested by the results showing that the partition coefficient increases as naphthalene loading decreases. Such changes in the partitioning behavior merit further investigation because they could prove to be significant under field conditions where the PAH abundance is spatially variable and/or time-depend- ent. Ultimately, more detailed partitioning information could help extend laboratory results and modeling analyses to actual field conditions.
With regard to modeling bioremediation processes, the potential for periodically sampling an aqueous system containing PAH, micelles, and microbes to measure the residual PAH and its pseudophase distribution could help elucidate how micelles supply PAHs to microbes. Such measurements would indicate if prior observations on alkanes (20) are applicable to PAHs as well as provide transport characteristics that would enable more rational control of surfactant-enhanced biotreatment conditions.
literature Cited (1) Vo-Dihn, T. ChemicalAnalysis ofPolycyclicAromatic Compounds;
(2) Davies, J. I.; Evans, W. C. Biochem. 1. 1964, 91, 251-261. (3) Ensley, B. D.; Zylstra, G. J. Principlesand Practices ofBiotreatment
Using Altered Microorganisms. Biotreatment of Industrial and Hazardous Waste; Morris, M. A., Gealt, M. A., Eds.; McGraw Hill: New York, 1993; Chapter 3.
(4) Giamoporcaro, D. E. Law and Policy on the Frontier: The Regulation of Bioremediation of Hazardous Waste. Biotreatment of Industrial and Hazardous Waste; Morris, M. A., Gealt, M. A. Eds.; McGraw Hill: New York, 1993; Chapter 6.
(5) Guerin W. F.; Boyd, S. A. Appl. Environ. Microbiol. 1992, Apr,
(6) Laha, S. Ph.D. Dissertation, Carnegie Mellon University, 1992. (7) Lin, D. T.; Stephens, M. L. Executive Summary; Research and
Development Program for the Destruction of PCBs, Eleventh Progress Report, General Electric Company, Sep 1992.
(8) Putcha, R. V.; Domach, M. M. Environ. Prog. 1993, 12, (2), 81- 85.
(9) Thomas, J. M.; Ward, C. H. Environ. Sci. Technol. 1989,23, (7), 260-266.
(IO) Walker, N.; Wiltshire, G. H.J. Gen. Microbiol. 1953, 8, 273-276. (11) Block, R.; Stroo, H.; Swett, G. H. Chem. Eng. Prog. 1993, Aug,
(12) Ghosh, M. M.; Robinson, K. G.; Yeom, I. T.; Shi, Z. Innovative Solutions for Contaminated Site Management; Industrial Waste Technology Conference/Water Environment Federation Spe- cialtyconference, Miami, FL, Mar 6-9,1994; pp 243-254 (Copies can be ordered from Water Environment Federation by calling
(13) Edwards, D. A,; Luthy, R. G.; Liu, Z. J. Environ. Eng. 1994, 120
(14) Edwards, D. A.; Luthy, R. G.; Liu, Z. J. Environ. Eng. 1994, 120
(15) Edwards, D.A.; Luthy, R. G.; Liu, Z.J. Environ. Eng. 1991,25 (l),
(16) Reigelman, S.;Alfawala, N.A.; Hrenoff, M. K.; Strait, L.A.J. Colloid
(17) Chung, G.-Y.; McCoy, B. J.;Scow, K.M.Biotechno1. Bioeng. 1993,
(18) Rosenberg, M.; Rosenberg, E. J. Bacterid. 1981, Oct, 51-57. (19) Breuil, C.; Kushnar, D. J. Can. J. Microbiol. 1980,26, 223-231.
Wiley and Sons: New York, 1989; Chapter 1.
1142-1152.
44-50.
1-800-666-0206.
(I), 5-22.
(I), 23-41.
127-133.
Sci. 1958, 13, 208.
41, 625-632.
VOL. 29. NO. 5, 1995 /ENVIRONMENTAL SCIENCE &TECHNOLOGY 1277

(20) Miller, R. M.; Bartha, R. Appl. Environ. Microbiol. 1989,5,269-
(21) Bury, S. J.; Miller, C. A. Environ. Sci. Technol. 1993,27 (l), 104-
(22) Mahaffey, W. R.; Compeau, G.; Nelson, M.; Kinsella, J. Water
(23) Wilson, S . C.; Jones, K. C. Environ. Pollut. 1993, 81, 229-249. (24) Marquis, S. A.; Dineen, D. Ground Water Manage. Res. 1994,
(25) Volkering, F.; Breure, A. M.; van Andel, J. C. Appl. Microbiol.
(26) Rosen,-M. J. Surfactants and Interfacial Phenomena, 2nd ed.;
(271 Almeren. M.: Greiser. F.: Thomas, K. 1. Chem. SOC. Faraday Trans.
274.
110.
Environ. Technol. 1991, Oct, 83-88.
105-119.
Biotechnol. 1993, 40, 535-540.
Wiley and Sons: New York, 1991; Chapter 1.
197;, 75 (11, 1674.
(6), 517-522. (28) Jay, J.; Johnson, L. J.; Scaiano, J. C. Chem. Phys. Lett. 1988, 148
(29) Gauthier, T. D.; Shane, E. C.; Guerin, W. F.; Seitz, W. F.; Grant, C. L. Environ. Sci. Technol. 1986, 20, 1162-1166.
Molecules; Academic Press: New York 1965; p 104.
Science: Oxford, 1989; p 611.
(30) Berlman, I. B. Handbook of Fluorescence Spectra of Aromatic
(31) Hunter, R. J. Foundations of Colloid Science Volume I; Oxford
(32) Lipton, A. J.; Domach, M. M. Biotechnol. Bioeng. 1992,39, 13-
(33) Lakowicz, J. R. Principles of Fluorescence Spectroscopy; Plenum
(34) Jacobson, A. M. Ph.D. Dissertation, Carnegie Mellon University,
(35) Yang, D. Y.; Cukier, R. I. J. Chem. Phys 1987, 5 (l), 2833-2838. (36) Hiemenz, P. C. Principles of Colloid and Surfme Chemism Marcel
(37) Lindemuth, P. M.; Bertrand, G. L. 1. Phys. Chem. 1993,97,7769-
(38) Maclay, W. N. J. Colloid Sci. 1956, 11, 272-285. (39) Kushner, L. M.; Hubbard, W. D. J. Res. Natl. Bur. Stand. 1954,
19.
Press: New York, 1983; Chapter 2.
1988.
Dekker: New York, 1986; Chapter 8.
7773.
58, 1163-1167.
Received for review August 5, 1994. Revised manuscript re- ceived January 13, 1995. Accepted February 3, 1995.*
ES9405011
@Abstract published in Advance ACS Abstracts, March 15, 1995.
1278 ENVIRONMENTAL SCIENCE &TECHNOLOGY / VOL. 29, NO. 5,1995